Aus der Klinik und Poliklinik für Kinder- u. Jugendpsychiatrie, Psychosomatik u. Psychotherapie der Universität Würzburg Direktor: Professor Dr. med. Marcel Romanos Correlates of Substantia Nigra Echogenicity in Healthy Children Inaugural - Dissertation zur Erlangung der Doktorwürde der Medizinischen Fakultät der Julius-Maximilians-Universität Würzburg vorgelegt von Sulamith Schaeff aus Bad Herrenalb Würzburg, Juni 2019
Transcript
Aus der Klinik und Poliklinik für Kinder- u.
Jugendpsychiatrie, Psychosomatik u. Psychotherapie
der Universität Würzburg
Direktor: Professor Dr. med. Marcel Romanos
Correlates of Substantia Nigra Echogenicity in Healthy
Children
Inaugural - Dissertation
zur Erlangung der Doktorwürde der Medizinischen
Fakultät der Julius-Maximilians-Universität Würzburg
vorgelegt von Sulamith Schae�
aus
Bad Herrenalb
Würzburg, Juni 2019
Referent: Professor Dr. Marcel Romanos
Korreferentin: Privatdozentin Dr. Camelia-Maria Monoranu
Dekan: Professor Dr. Matthias Frosch
Tag der mündlichen Prüfung: 09.03.2021
Die Promovendin ist Ärztin
Contents
1 Introduction 51.1 Transcranial Sonography . . . . . . . . . . . . . . . . . . . . . . 51.2 Transcranial Sonography in Movement Disorders . . . . . . . . . . 71.3 Iron Metabolism in Movement Disorders . . . . . . . . . . . . . . 101.4 Substrates of Substantia Nigra Hyperechogenicity . . . . . . . . . 131.5 Transcranial Sonography of the Substantia Nigra in Children . . . 161.6 Multimodal Assessment of Nigral Echogenicity in Healthy Children 18
Transcranial Sonography (TCS) has gained increasing importance since Aaslid,Markwalder and Nornes (1982) demonstrated the feasibility of Doppler ultrasoundon adult cerebral arteries. Hitherto the adult skull was thought to be non-penetrable for ultrasound waves. The depiction of cerebral blood flow in adultswith ultrasound was ground-breaking. Aaslid and colleagues (1982) placed theprobe at the temporal bone region, where the skull is relatively thin and thereforethe ultrasound signal is less diminished. They further minimized signal attenuationby reducing insonation frequencies to 2�0MH�, common Doppler systems operatewith 5 − 10 MH�. By modifying those parameters, Aaslid and colleagues (1982)successfully measured blood flow velocities in cerebral arteries. It was integratedquickly in clinical routines as it enables on-time and noninvasive monitoring ofintracranial hemodynamic states as well as cerebrovascular disorders.
Diagnostic sonography is built on the piezoelectrical e�ect: electrical energyis converted into mechanical energy. When alternating current is applied, piezo-electrical crystals deform, vibrate and thereby send out ultrasound. Ultrasound issound waves above 20� 000H�, thus non audible for humans but e.g. for dolphinsand bats. Di�erent tissues reflect, disperse and absorb sound waves di�erentlyand as a result create distinct signals. These echoes hit again the piezoelectricalcrystal with the reverse e�ect: mechanical energy is converted back into electricalenergy. Amplitude, timing and pitch of the sound waves get recorded and imagesare calculated. Most commonly B-mode (brightness modulation) images are usedwhere echo intensity is translated into scales of grey. Thus, image brightness of acertain pixel displays echo amplitude of a certain spatial point (Dössel, 2016). Inthis way di�erent tissues and di�erent brain areas e.g. brain stem and ventricularsystem can be depicted and measured (Becker et al., 1994a, 1995). Furthermore,noninvasive detection of pathological processes such as intracerebral malignomsand hemorrhagic events is possible (Becker et al., 1992, 1994b; Woydt et al.,1996).
5
In 1995, Becker and colleagues demonstrated structural di�erences of thesubstantia nigra (SN) with TCS in patients with Parkinson’s disease (PD) andthereby gave directions to the use of TCS in neurodegenerative movementdisorders. They observed an enhanced TCS signal of the SN in PD patients: SNwas hyperechogenic compared to healthy subjects. SN, a mesenecephalic nucleus,is known amongst others to be involved in movement and the pathophysiology ofPD (Bear, Connors & Paradiso, 2007).
Within the last years TCS has been widely used in neuropsychiatric movementdisorders. Standardized protocols to assess midbrain structures in neurodegen-erative diseases have been designed (Walter et al., 2007). Due to technicallimitations, these days signal brightness can not be quantified directly. There-fore indirect measures have been developed to evaluate signal intensity. Twoapproaches are well-established: 1. planimetric measurement of an echogenic areaor 2. semiquantitative rating of signal intensity by visual inspection (Walter etal., 2007). Consequently structures are defined as hypoechogenic if an echogenicarea is smaller or lower in signal intensity compared to the general population.Hyperechogenicity describes the opposite: a greater area or higher signal inten-sity (Walter et al., 2007; Berg et al., 2008). Overall the brain parenchyma ismainly low in echogenicity. High echogenicity can be a result of i.e. calciumaccumulations or high tissue density (Becker & Berg, 2001).
Sonography in general and TCS in particular is advantageous in manyrespects. It allows bedside examination of critically ill patients, it is noninvasive,fast, relatively low priced and widely available (Dössel, 2016). In neuropsychiatricmovement disorders it is especially useful because motion (i.e. a movingpatient) does not distort the entire measurement as it is the case in magneticresonance imaging (MRI). Noninvasive MRI technique is based on spinningprotons and magnetic properties of di�erent tissues, its spatial resolution ishigh, but examinations take long and motion artefacts are common (Dössel,2016). Sonography further permits an online mapping of dynamic changes,hence its temporal resolution is high. Besides, reliability of the measurementscan be increased tremendously since numerous replications of measurements areviable (Skoloudík & Walter, 2010). Limitations are mainly due to particularcharacteristics of patients and the dependency on investigator’s expertise. As
6
in conventional sonography, patients’ physical features influence the quality ofthe TCS signal and images. In about 10 − 20 % of Caucasians no adequatetemporal bone window can be found, presumably due to variations in bonestructure (Berg, Godau & Walter, 2008; Walter et al., 2007). In ethnic Asiansthe percentage is even higher varying between 21 − 59 % (Kim et al., 2007;Okawa et al., 2007). In addition, investigators’ knowledge and practice is crucialfor reliable measurements (Skoloudík, 2007). And last, mainly structures nearthe midline are explorable and superficial brain structures near the skull cannotbe displayed clearly (Skoloudík & Walter, 2010).
1.2 Transcranial Sonography in Movement Disorders
TCS is useful in neuroimaging of subcortical structures and detecting structuralalterations. It has been used in a variety of movement disorders and referencevalues have been developed. Commonly in adults SN echogenic sizes of less than�20 ��
2 are considered to be normal, SN sizes of �20 ��2 and above represent
the upper 75 ���������� of the healthy population and are assumed to behyperechogenic. But exact measures also depend on the ultrasound system used(Berg et al., 2008; Walter et al., 2007).
TCS in Parkinson’s Disease PD was the first neuropsychiatric movementdisorder where TCS was found to be a potentially useful diagnostic tool (Beckeret al., 1995). Parkinsonism is a general term for hypokinetic syndromes withextrapyramidal key symptoms of hypokinesia, resting tremor, postural instabilityand rigidity. Parkinson’s Disease refers specifically to the idiopathic form ofparkinsonism. Besides, there are many secondary and acquired parkinsoniansyndromes as well as so called atypical parkinsonian syndromes. PD is a commonneurodegenerative disorders of the elderly, a�ecting 1 − 5% of senior adults. PDis characterized by a loss of dopaminergic neurons in the pars compacta of theSN, a subsection of the SN and main source of dopamine (Lücking et al., 2013).Dopamine is a catecholaminergic neurotransmitter and involved in circuits ofmotor control (Bear, Connors & Paradiso, 2007).
7
In about 90% of PD patients SN is found to be hyperechogenic in TCS exam-ination. Early findings of SN hyperechogenicity have been replicated numerouslyby independent groups and in di�erent ethnicities (Becker et al., 1995; Berg et al.,2008; Gaenslen et al., 2008; Kim et al., 2007; Okawa et al., 2008). Apparentlythis hyperechogenicity is a trait marker, it does not reflect disease severity (Spiegelet al., 2006) nor does it progress over time (Berg et al., 2005). Therefore TCShas been proposed as a diagnostic tool in early diagnosis of PD when symptomsare not yet fully developed and accurate diagnosis can be complex (Gaenslen& Berg, 2010). Other studies though did not find satisfactory sensitivity andspecificity to enable classification (Bouwmans, 2013).
Another clinical application might be the di�erentiation between idiopathicPD and atypical parkinsonian syndromes. Atypical parkinsonian syndromesusually involve a multisystem degeneration. They have clinical symptoms inaddition to the typical parkinsonian malfunctions and are therefore also calledParkinson-plus syndromes. Often patients are younger at disease onset, symptomsare more severe and the course of the disease is more rapid. Moreover, atypicalparkinsonian patients respond poorly to levodopa (L-Dopa), which is a precursorof dopamine and the standard medication in PD. Examples for atypical syndromesinclude multiple system atrophy which is also associated with autonomicdysfunctions and progressive supranuclear palsy which is marked i.e. by verticalgaze palsy (Lücking et al., 2013). Especially in early disease stages classificationcan be a challenge and di�erentiation from idiopathic PD is delicate (Caslake etal., 2008). Postmortem studies reveal false positive rates in diagnosing idiopathicPD around 25% at the expense of under-diagnosing atypical parkinsoniansyndromes (Joutsa et al., 2014). Evidently, patients would benefit from a reliableimaging marker. Clear categorization is not a mere scientific question but isof great importance for adequate treatment. Hyperechogenic SN might besuch a marker, it is distinctive for idiopathic PD. Good sensitivity, specificityand predictive values have been obtained in order to distinguish idiopathic PDand atypical syndromes by means of TCS (Berg et al., 2008; Gaenslen et al., 2008).
8
TCS in Huntington’s Disease Huntington’s disease (HD) is a trinucleotiderepeat disorder with expanded cytosine-adenine-guanine (CAG) repeats. HD ischaracterized by initial hyperkinetic symptoms and in later stages hypokinesiaand dementia. It is known to cause GABAergic cell loss, the main inhibitoryneurotransmitter. Besides, it is accompanied by atrophies in di�erent brainregions i.e. striatum, thalamus, substantia nigra and cerebral cortex. HD is agenetic disease and with increasing numbers of CAG repeats, anticipation is awell known e�ect. Anticipation refers to an aggravation of symptom severity andearlier disease onset (Lücking et al., 2013). Interestingly, in an early study Postertand colleagues (1999) found a positive correlation between SN hyperechogenicityand symptom severity as well as number of CAG repeats. Nevertheless, this wasonly true for about 40 % of their HD patients. Recently, SN hyperechogenicityhas been demonstrated in more than 90 % of HD patients when priorly screenedfor hypokinetic symptoms. This indicates that SN alterations might be specific ina subgroup of HD patients with hypokinesia (Lambeck et al., 2015).
TCS in Restless Legs Syndrome Restless legs syndrome (RLS), a hyperki-netic syndrome, is marked by an urge to move the legs and dysesthetic sensations.Usually symptoms diminish when moving around and worsen when the patientrests. An underlying dysfunction of the dopaminergic system is proposed andsupported by the fact that RLS is e�ectively treated with levodopa or dopamineagonists (Lücking et al., 2013). As in other movement disorders echogenicsignals of the SN are altered. SN demarcates hypoechogenic in TCS in mostidiopathic RLS patients as compared to healthy subjects. The signal is thusdiminished (Godau & Sojer, 2010; Schmidauer et al., 2005). Also RLS symptomseverity correlates negatively with hypoechogenicity of the SN in patients withneurodegenerative movement disorders and comorbid RLS (Pedroso et al., 2012).
TCS in Attention-Deficit Hyperactivity Disorder Attention-deficit hyper-activity disorder (ADHD) is not a generic movement disorder, nevertheless it ischaracterized by excess motor activity. ADHD is a common hyperkinetic disorder
9
with prevalences around 8 − 10 % and by definition begins in childhood. Besidesstriking motor activity, patients exhibit psychomotor restlessness, impulsivityand have di�culties in sustaining attention. ADHD has a strong hereditarycomponent, often persists into adulthood and its prevalence is more than doubledin boys (Bokor & Anderson, 2014). Subcortical alterations i.a. in the basalganglia have been found in ADHD boys but not in girls (Seymour et al., 2017;Qiu et al., 2009) and also in both sexes (Shaw et al., 2014). Nigral dopaminergicmalfunction has been proposed as part of the underlying pathophysiology, whichis not yet thoroughly understood (Badgaiyan et al., 2010; Biederman & Faraone,2005; Bokor & Anderson, 2014). Based on altered nigral echogenicity in PDand common pathophysiological pathways, TCS has been performed on ADHDpatients. Nigral TCS signal is markedly hyperechogenic in ADHD children andadolescents as compared to healthy controls (Krauel et al., 2010; Romanos etal., 2010). Analogous to PD patients ���� SN sizes of �20 ��
2 have beenreported in ADHD children (Romanos et al., 2010). SN echogenic size alsocorrelates with symptom severity of inattention, hyperactivity and impulsivity(Krauel et al., 2010). The occurrence of SN hyperechogenicity in other typicmovement disorders hints at the motor component of ADHD and TCS suggestsmorphological changes of the SN. Hyperechogenicity of the SN might serve as astructural marker for ADHD.
1.3 Iron Metabolism in Movement Disorders
It is not only, that movement disorders share striking echographic findings ofthe substantia nigra as described before. The following chapter will outline thatthe substantia nigra in turn is closely intertwined with aberrant cerebral iron andmovement disorders.
Substantia nigra The SN is part of a complex regulation network involved inmotion, addiction, learning, the reward system and others. It is located in thetegmentum of the mesencephalon. Functionally and structurally the SN is dividedinto two nuclei: pars compacta and pars reticulata. The pars compacta contains
10
neuromelanin-pigmented dopaminergic neurons, it is dark in color and responsiblefor its illustrative name ’substantia nigra’. The nigrostriatal pathway is formedby axons that project anteriorly to the striatum. The pars reticulata comprisesinhibitory GABA-ergic (g-aminobutyric acid) neurons, receives direct and indirectinput from the striatum and projects in turn to the thalamus (Gazzaniga, Ivry& Mangun, 2009). Dopamine is known to be involved in di�erent projectionsand neural pathways regarding motor control, reward, sleep, attention andmemory processes. Motion processes in particular are mediated by dopaminergicprojections from the substantia nigra pars compacta. Dopamine is synthesizedthrough enzymatic reactions from tyrosine via L-Dopa to dopamine within thecatecholaminergic pathway (Bear, Connors & Paradiso, 2007). Interestingly,movement disorders with dopaminergic dysfunction such as PD or ADHD aremore frequent among males. Sex hormones and sex genes are proposed tomediate dopamine synthesis (Loke, Harley & Lee, 2015). Neuromelanin in thecentral nervous system partly resembles cutaneous melanin. It is a brownishpigment produced and contained in catecholaminergic neurons in some areas ofthe brain, but mainly in the SN pars compacta. Neuromelanin is also synthesizedwithin the catecholaminergic pathway. Its concentration is thus dependent oncatecholamine synthesis. Neuromelanin binds metals such as iron, copper, zincand thereby presumably functions as protective antioxidant. In PD the bu�eringsystem in not intact, dopaminergic neurons containing neuromelanin are lost.(Fedorow et al., 2005, Zecca et al., 2002).
Cerebral Iron Non-heme iron is abundant within the central nervous system,in some brain areas quantities are even comparable to the liver. Highestconcentrations are measured i.a. within the SN. Cerebral iron is contained intransport and structural proteins, enzymes and in iron storage proteins such asferritin. It is also pooled in neuromelanin (Beard & Connor, 2003; Singh et al.,2014). Whereas ferritin is mostly found in glia cells, in dopaminergic neurons ofthe SN neuromelanin appears to be a storage system of iron (Fedorow et al.,2005, Zecca et al., 2002). The blood-brain barrier keeps cerebral iron partlyindependent of the rest of the body and maintains homeostasis. Thus, normal
11
serum iron concentrations do not mean normal cerebral iron or vice versa, ifanything their concentrations di�er. Iron is indispensable for brain function, it isamongst others involved in myelination, enzyme synthesis as well as synthesis andcatabolism of neurotransmitters such as dopamine. Iron is an essential coenzymeof tyrosine hydroxylase, the rate-limiting enzyme in catecholamine or dopaminesynthesis. Iron and dopaminergic neurons are co-located within the substantianigra and functionally associated. Shortage of cerebral iron is associated with adecrease in dopamine transporters and receptors. On the other hand, free ironis cytotoxic, it reacts with molecular oxygen. Iron homeostasis is complex anddepends on requirements, resorption, distribution and storage (Beard & Connor,2003; Singh et al., 2014).
Iron and Movement Disorders In PD patients the SN shows signs of irondysfunction. Not only loss of neuromelanin, but also abnormally high ironconcentrations in the SN pars compacta have been found repeatedly. It has beenproposed that iron excess leads to oxidative stress causing dopaminergic cells todecline, but it remains a matter of debate, whether it is cause or consequence(Dexter et al., 1989; Gerlach et al., 1994; Götz et al., 2004).
In ADHD scientific evidence is controversial. Depending on the study designlower serum ferritin levels have repeatedly been found to be related to hyperactivityand symptom severity in ADHD (Juneja et al., 2010; Oner, Alkar & Oner, 2008;Oner et al., 2012). Though others did not find an association (Adisetiyo etal., 2014; Donfrancesco et al., 2013). Recent MRI studies show significantlylower iron indices in striatum and thalamus in ADHD patients as compared tohealthy controls (Adisetiyo et al., 2014; Cortese et al., 2012). Moreover, thesedi�erences are only evident in medication-naive ADHD patients, suggesting thataltered cerebral iron indices map dopaminergic disruption, which is reversible withmedication. (Adisetiyo et al., 2014; Adisetiyo & Helpern, 2015). In fact, ADHDpsychostimulant medication is known to increase dopamine levels (Del Campo etal., 2011).
Research on RLS also pinpoints the role of iron metabolism in its pathogenesis.Iron deficiency increases the risk of developing RLS. Furthermore, symptoms
12
can be alleviated by intravenous iron treatment, even if patients are notdeficient in iron (Allen & Earley, 2007). MRI measurements of nigral ironconcentrations are negatively correlated with symptom severity (Allen et al.,2001). In idiopathic RLS patients ferritin concentrations of the cerebrospinal fluidare significantly lower, whereas transferrin levels of cerebrospinal fluid are higherwhen compared to healthy subjects. This suggests a central iron deficiency andaltered blood-brain barrier transport mechanisms. (Earley et al., 2000, Mizunoet al., 2005). The findings correspond with necropsies on RLS brains, thatshow decreased immunostaining of ferritin and increased staining of transferrinin the SN (Connor et al., 2003). Iron might also be a link to the proposeddopaminergic dysfunction in RSL and PD, since it influences dopamine metabolismand dopaminergic signal transmission (Allen & Earley, 2007; Connor et al., 2003).
1.4 Substrates of Substantia Nigra Hyperechogenicity
As stated previously, the SN is found to be hyperechogenic in some medicalconditions such as PD or ADHD. But nigral hyperechogenicity is also detected inup to 10 % of healthy adults (Berg et al., 1999a; Schweitzer et al., 2007). Onthe other hand, in RLS the SN demarcates hypoechogenic. Underlying biologicalmechanisms of SN echogenicity remain unclear. However, there is preliminaryevidence for the role of iron in echogenic alterations.
Findings from Movement Disorders Insights come from research onneurodegeneration with brain iron accumulation (formerly Hallervorden-Spatzsyndrome). This is a group of orphan genetic diseases. Core symptomsinclude gait abnormalities, rigor, dysarthria and dystonia (Dashti & Chitsaz,2014). Pathological iron deposits i.e. in the SN are known to be involved inits pathophysiology (Koeppen & Dickson, 2001). Commonly it is diagnosedclinically and in addition with genetic testing and MRI. But MRI measurementsin patients with movement disorders, especially in children, are troublesome.Patients have to be sedated in order to avoid motion artefacts. Moreover,pathognomonic abnormalities are sometimes but not always depicted in MRI
13
images (Liman et al., 2012). Therefore it is auspicious that nigral structuralabnormalities are also visible in TCS. Albeit small sample size, the results arepromising. In planimetric measurements SN hyperechogenicity was found inall 7 patients and size di�erences (���� size right SN �39 ��
2 and left SN�35 ��
2 ) compared to healthy controls (���� size right SN �12 ��2 and left
SN �10 ��2 ) were highly significant. The correspondence between the two
neuroimaging methods as well as neuropathological results suggest a poten-tial connection between iron deposits and nigral echogenicity (Liman et al., 2012).
Findings from Neurologically Healthy Subjects In animal studies directinjection of iron into the SN of rats leads to a dose-dependent enhancement ofSN echogenicity. This seems to be a special attribute of free iron. Direct injectionof ferritin, that is protein-bound iron, has no e�ect on SN echogenicity. On theother hand injection of substances, that release iron from its storage moleculeferritin, leads to increases in echogenicity (Berg et al., 1999b).
Furthermore, a postmortem study of Zecca and colleagues (2005) foundsignificant correlations between nigral echogenicity and iron-related parameters inhuman brains. They examined 40 brains of subjects without movement disordersand 3 PD brains. After removal from the skull TCS was performed on thebrains and SN echogenicity was determined. Subsequently, SN was dissectedand contents of ferritin, iron and neuromelanin were quantified for each subject.Results showed significant positive correlations between SN echogenicity andconcentrations of iron as well as ferritin. On the other hand, neuromelaninwas negatively correlated with SN echogenicity. Considering that neuromelaninincorporates iron and that their opposing e�ects on echogenicity might overlap,neuromelanin was only statistically significant, when iron concentrations hadbeen taken into account as well. Previous findings on PD brains were replicated:hyperechogenic SN, elevated iron, reduced neuromelanin in the SN. In accordancewith the animal model (Berg et al., 1999b) and rather weak correlations of ferritin,it has been discussed that lower levels of neuromelanin together with elevatediron content (but not ferritin) are related to SN echogenicity. And that thosealterations in turn might express a toxic milieu and increased susceptibility for
14
nigrostriatal damage (Zecca et al., 2005).If SN signal alterations in neurologically healthy and a�ected subjects underly
the same cerebral changes and if these changes are due to iron abnormalities,questions about its implications raise. Hyperechogenicity in non-symptomatic andsymptomatic subjects might be regarded as a marker for nigrostriatal disruption.Insights come from positron emission tomography (PET) studies on healthysubjects. Despite normal motor abilities, PET reveals reduced fluorine-18-dopa(18F-dopa) uptake in the striatum in healthy subjects with hyperechogenic SN.PET is used for nuclear functional imaging and maps metabolic processes. Thusmorphological changes might map functional changes: SN hyperechogenicityseems associated with decreased dopaminergic uptake in the striatum (Behnkeet al., 2009; Berg et al., 1999a, 2002). Reduced 18F-dopa uptake has also beenreported in PD patients with nigral hyperechogenicity. Moreover, correspondingstructural changes of the SN have been observed with MRI in patients and healthysubjects with hyperechogenic SN (Behnke et al., 2009). It has been suggestedthat SN hyperechogenicity can serve as a marker for nigrostriatal impairment andvulnerability in preclinical settings and PD patients (Behnke et al., 2009; Berg etal., 1999a, 2002).
The evidence for iron as the biological correlate of SN echogenicity iscompelling. As outlined above, evidence suggests it is a multi-layered processconsisting of aberrant iron deposits and altered iron handling mechanismsthat depict enhanced vulnerability of nigrostriatal pathways. Still there arecontroversies and unanswered questions. About 90% of PD patients show SNhyperechogenicity (Berg et al., 2008; Walter et al., 2007). Reciprocally, thequestion arises whether the remaining 10% have no disturbances in SN ironmetabolism. PD is known for SN iron overload (Dexter et al., 1989; Gerlach etal., 1994; Götz et al., 2004) and hyperechogenicity (e.g. Becker et al., 1995;Berg et al., 2008), whereas RLS is associated with SN iron deficiency (Allen etal., 2001; Connor et al., 2003) and SN hypoechogenicity (Godau & Sojer, 2010;Schmidauer et al., 2005). But PD patients with and without comorbid RLS donot di�er in their degree of SN echogenicity (Ryu, Lee & Baik, 2011). Clearly,more research is warranted in order to illuminate the complex mechanismsunderlying TCS signals in nigral echogenicity.
15
1.5 Transcranial Sonography of the Substantia Nigra inChildren
Although TCS is an integral part of premature infant diagnostics in evaluatingvessels, intracerebral bleedings and the ventricular system (Speer, 2013), there isonly very limited research on midbrain structures in children. Hitherto to my bestknowledge, 4 studies have been published assessing nigral echogenicity in children.Two studies focused on age-related changes in SN echogenicity (Hagenah et al.,2010; Iova et al., 2004) and, as mentioned before, 2 other independent studiesaddressed nigral echogenic signals in ADHD (Krauel et al., 2010; Romanos et al.,2010).
Evidence for the e�ects of age on SN echogenicity is conflicting. A gradualdecrease of SN echogenicity with age has been found, with newborns exhibitingsignificantly greater SN echogenic areas than older children (Iova et al., 2004).Here, 77% of the infants (aged 12 months or younger) showed SN echogenic sizesover �19 ��
2, whereas by the age of 10 years this was only the case in about17% of the children. Both proportion of hyperechogenicity (Berg et al., 1999a;Schweitzer et al., 2007) and cut-o� scores for hyperechogenicity approach adultnumbers (Walter et al., 2007). On the other hand, Hagenah and colleagues (2010)observed a significant increase in SN echogenic size with age. Their investigationincluded neurologically healthy infants/children from 0 − 17 years as well asadults 23 − 72 years. Here, lowest ���� SN measures for infants and children(�06 ��
2) and highest values for older subjects (�13 ��2) were detected. Though
subanalysis of the infants/children group did not reveal a significant correlation ofage and SN echogenic size within this subcluster. In both TCS studies on ADHDage did not exert an e�ect on SN echogenic sizes (Krauel et al., 2010; Romanos etal., 2010). However, age range in the research designs was restricted to childrenfrom 6 − 17 years and 7 − 16 years respectively. As stated above, SN echogenicsizes are markedly pronounced in ADHD children as compared to healthy peers(Krauel et al., 2010; Romanos et al., 2010). Noticeable, SN echogenic sizes ofthe controls di�ered considerably between the two ADHD studies, although the
16
same ultrasound system was used. Whereas one study reported ���� sizes of�14 ��
2 (right) and �16 ��2 (left) (Romanos et al., 2010), the other mentioned
������ sizes of �40 ��2 (Krauel et al., 2010). Likewise in the patient groups:
���� = �20 ��2 and ������ = 1�0 ��
2 respectively.Since iron metabolism has been related to echogenic signals in adults, it
stands to reason that it is also involved in potential temporal signal changesand nigral echogenicity in children. Consequently, altered brain iron metabolismand nigrostriatal vulnerability have been discussed (Iova et al., 2004; Krauel etal., 2010; Romanos et al., 2010). Aside from that, iron in the SN is known toaccumulate over time, newborns have lowermost iron contents (Snyder & Connor,2009; Zecca et al., 2004). Neuromelanin emerges first during the second/thirdyear of life in the SN and its concentration increases with normal ageing (Zeccaet al., 2001; Zucca et al., 2006). Though ambiguous age-related changes inechogenicity have been observed in children, in elderly subjects (Berg et a., 2001b)and PD patients (Berg et al., 2005) no e�ect of age has been found on SNechogenicity. It has been proposed that nigral hyperechogenicity develops early inlife and afterwards changes are only subtle (Berg et al., 2001b). Consequently,depending on the range of age in the study design, correlations are visible ornot (Hagenah et al., 2010). In ADHD evidence for iron as structural correlateis antithetic, albeit recent MRI data show in fact aberrant brain iron indicesin ADHD. However, MRI shows iron deprivation in the striatum and thalamus(Adisetiyo et al., 2014; Donfrancesco et al., 2013), while from a TCS pointof view one would rather expect iron overload from adult studies. Underlyingbiophysics of echogenicity might be a complex interaction of neuromelanin andiron contents, it might be di�erent for ADHD and PD and possibly also relatedto the di�erent age groups. Alternative hypotheses such as maturational delayand altered connectivity have been discussed elsewhere (Drepper et al., 2017).
In children scientific data on midbrain TCS are rare and moreover ambiguous.To enable a better interpretation of future patient data and a more profoundunderstanding of the biological basis of the nigral TCS signal, reference valuesand conclusive data of the temporal dynamics in a clinically healthy populationof children are desirable.
17
1.6 Multimodal Assessment of Nigral Echogenicity inHealthy Children
To recap shortly, hyperechogenic SN is found in about 10% of healthy adults (Berget al., 1999a; Schweitzer et al., 2007) as well as di�erent movement disorders(see chapter 1�2 for references). SN hyperechogenicity has been suggestedto map nigrostriatal dysbalance in preclinical and clinical settings i.e. in thehealthy population and in patients (Behnke et al., 2009; Berg et al., 1999a,2002). In adults signal alterations might reflect high concentrations of nigraliron and low levels of neuromelanin. Nigral hyperechogenicity, thus, could be amarker of neuromelanin depletion and iron deposition expressing susceptibility fornigrostriatal impairment (Zecca et al., 2005). In addition, iron seems a plausiblecandidate, it is involved in the pathophysiology of many movement disorders(Snyder & Connor, 2009) and also in dopamine synthesis and transmission (Beard& Connor, 2003; Singh et al., 2014). In children though, research is sparse andwithin itself controversial. In healthy children increases of SN echogenicity withage have been reported (Hagenah et al., 2010) as well as decreases (Iova et al.,2004). ADHD is associated with SN hyperechogenicity (Romanos et al., 2010;Krauel et al., 2010). Structural correlates of SN echogenicity, at least in ADHDchildren, might be di�erent from those in adults. MRI studies show diminishediron content in striatum and thalamus (Adisetiyo et al., 2014; Donfrancesco etal., 2013).
To my knowledge no studies have been made to further explore nigralechogenicity in healthy children. Up to now distribution of SN echogenicityand prevalences of SN hyperechogenicity in a healthy children population havenot been investigated conclusively. It is of special interest how SN echogenicityrelates to subclinical hyperactive behavior in healthy children. There is evidence inadults, that those who di�er in structure also di�er in motor function. In non-PDadults SN hyperechogenicity is associated with motor slowing (Berg et al., 2001b)and more severe extrapyramidal side e�ects under neuroleptic treatment (Berg etal., 2001a). It is then expected that in healthy children SN hyperechogenicity isalso associated with more “hyperactive” behavior. Furthermore, the role of ironand neuromelanin in SN echogenicity of healthy children has not been resolved.
18
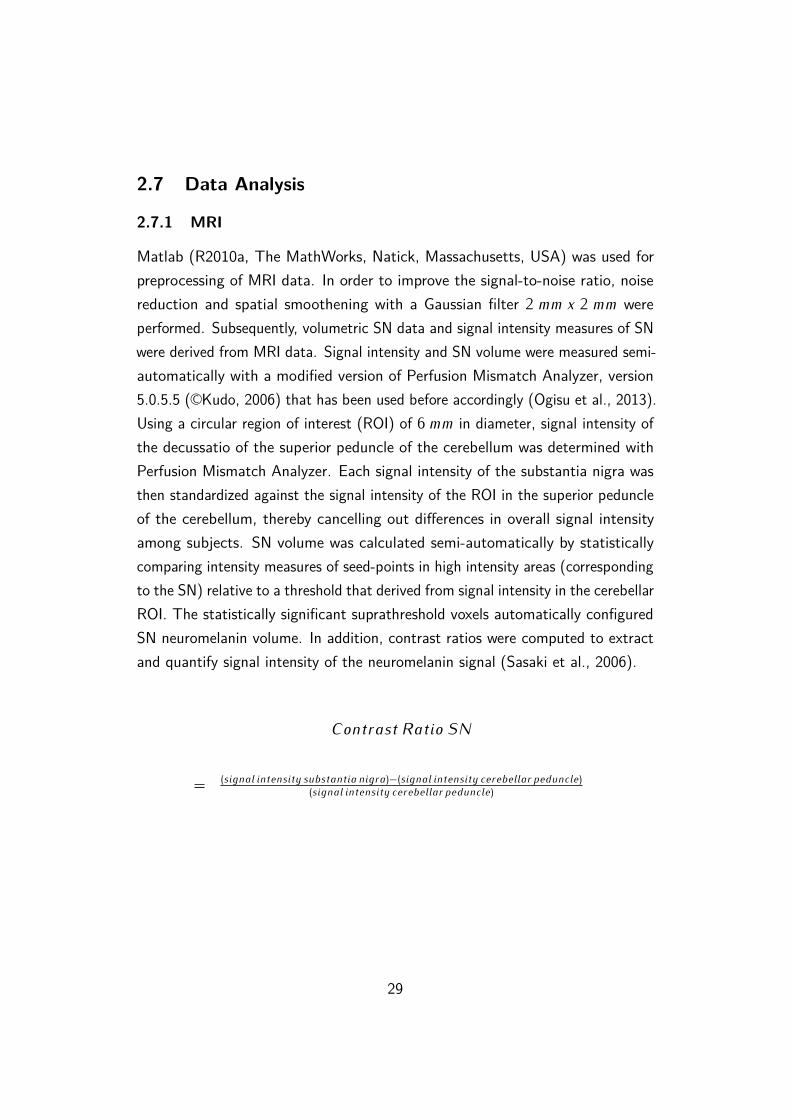
Recent technological advances have made non-invasive, indirect measurements ofneuromelanin possible. Since neuromelanin binds e.g. iron it has paramagnetice�ects rendering MRI feasible. In healthy adults nigral neuromelanin content andconsequently in PD patients depletion of nigral neuromelanin can be visualizedwith neuromelanin-sensitive MRI (Sasaki et al., 2006; Ogisu et al., 2013; Ohtsukaet al., 2013). The relation between age and neuromelanin content of the SN haslately been investigated with neuromelanin-sensitive MRI: nigral neuromelaninmeasures rise gradually until the mid-fifties and decline afterwards (Xing, 2018).This is also in line with some neuropathological studies (Mann & Yates, 1978),whereas others report a lifelong increase (Zecca et al., 2001). Accordingly, it ispresumed that SN hyperechogenicity in healthy children is associated with lowerneuromelanin indices of the SN in neuromelanin-sensitive MRI and that the nigralneuromelanin measures show an age-dependent increase.
In an attempt to evaluate potential correlates of SN echogenicity in healthychildren, the following multimodal study was conducted. Since direct measure-ments of cerebral iron are not ethical, a combination of indirect measures wasemployed. Neuroimaging techniques i.e. neuromelanin-sensitive MRI and TCSwere combined with behavioral data from questionnaires and serum measuresof iron-related parameters in healthy children. The aim of this study was toinvestigate ¨ the distribution of SN echogenicity and a critical value for SNhyperechogenicity in healthy children, ≠ whether nigral neuroimaging signalschange over time and show an association with the age of the children, Æ whetherSN echogenicity is correlated with hyperactive behavior in healthy children, and inaddition, Ø whether SN echogenicity can be predicted by neuromelanin-sensitiveMRI measures of the SN but not by peripheral iron status.
19
2 Methods
2.1 Participants
Between October 2013 and February 2015 a total of 34 healthy participants(4 females, 30 males) participated in this study of the Department of Childand Adolescent Psychiatry of Wuerzburg University Hospital (KJPPP). Allparticipants were Caucasian. Requirements to participate included: age of 8 − 12years, IQ above 85 points, no psychiatric illness and no severe somatic illness(e.g. epilepsy, hyperthyroidism, diabetes, foetal alcohol syndrome, brain trauma).Furthermore, metal implants, pacemaker or dental braces and claustrophobiawere criterions for exclusion since MRI measurements were also part of the study.Participants and their legal guardians received written information about courseand purpose of the study before hand. Written informed consent was obtainedfrom all participants as well as their legal guardians. Participants were recruitedfrom a pool of healthy controls that participated recently in other studies ofthe KJPPP. They received a financial gratification for their participation. Theethics committee of Wuerzburg University gave their approval to this study(file reference 313/13) and it was conducted according to the standards of theHelsinki declaration.
2.2 Psychological Assessment
To assess psychological phenotype, standardized instruments were used. Sincethe children participated in other studies of the KJPPP within the last 6 months,no major changes in phenotype could be expected. Therefore the followingdata could be retrieved from a database of the KJPPP and did not have to beacquired once again.
20
CFT-20-R: For overall intelligence, intelligence quotient was measured using Cul-ture Fair Intelligence Test, CFT-20-R (Wei�, 2006). CFT-20-R comprises101 items composed of 4 categories: series, classification, matrices andtopology. Adequate scientific value is proven by high test-retest reliability(= �80 − �82), internal consistency (= �95) and good concurrent validitywith other IQ tests (���� = �64). It assesses nonverbal intelligence interms of fluid intelligence as defined by Cattell. Cattell distinguishes fluidand crystallized intelligence. Fluid intelligence corresponds to problemsolving behavior independent of prior knowledge - thus novel situations. Onthe other hand crystallized intelligence relies on acquired skills and previousknowledge (e.g. Cattell, 1968).
SDQ-Deu: To evaluate psychological attributes and behavior,Strength and Di�culties Questionnaire (SDQ) for parents (Goodman,1997), was evaluated. The German version with German normative data(SDQ-Deu) was implemented (Woerner et al., 2002). Reliability is high(C�������
�� α = �82) and concurrent validity with other questionnaires
(amongst others Child Behavior Checklist) is good (� = �78 − �83)(Klasen et al., 2003). SDQ-Deu is a behavioral screening checklist thatlooks for psychological attributes. It consists of a total of 25 itemsregarding child behavior as rated by their parents. It examines emotionalproblems, conduct problems, problems with peers, hyperactivity andprosocial behavior. Each of these five subscales evenly contains 5 itemsand each item is rated on a 3-point scale (not true, somewhat true,certainly true). Final results are given as ����������� in relation to arepresentative reference group. Higher scores indicate more problems:< 80 = ������� ∼ 80 − 90 = ����������� ? 90 = �����������.Only children showing no evidence of psychiatric disorders(����� ≤ 90�� ����������) were finally included.
21
2.3 Transcranial Sonography
TCS was performed using an Esaote Mylab25 Gold ultrasound system (EsaoteS.p.A., Genoa, Italy) with a 2�5MH� phased array transducer. Penetration depthwas set to 15�0 �� and a dynamic range of 45 �B. Both parameter settings havebeen proven to be most appropriate for TCS in these kinds of settings (Berg et al.,2001b; Walter, 2012). Image brightness had to be adapted for each participantindividually. Two-dimensional B-mode images of the brain were generated.
Axial images of standardized midbrain and diencephalic scanning planes wereobtained, frozen and stored digitally for further analysis. TCS is performedthrough the intact scull at the temporal acoustic bone window on each side ofthe head respectively. The same examiner (S.S.) obtained and analyzed all TCSimages. Quality and clearness of TCS images of diencephalic and mesencephalicstructures strongly depend on the quality of the temporal acoustic bone window(Walter et al., 2007) making it crucial to find an optimal probe position. Tothis end, the exact position of the ultrasound probe had to be aligned for eachparticipant individually. For o�ine analysis multiple pictures of each scanningplane were stored digitally. Among those a total of 4 pictures for each subject(midbrain left and right, diencephalon left and right) were chosen for subsequentinvestigation. Three participants had insu�cient left temporal acoustic bonewindows. Therefore analyses of these participants were limited to their righthemisphere.
Further analysis was done using ImageJ, an open source processing andanalysis software based on Java by Wayne Rasband of the National Instituteof Mental Health at National Institute of Health (Rasband, 1997). For preciseevaluation pictures were zoomed-in 2 − ����. Scanning planes can be identifiedand delineated by certain anatomical landmarks (Huber, 2010; Walter et al., 2007).Evaluation of brain structures was conducted according to standard procedures(Berg et al., 2008; Walter et al., 2007).
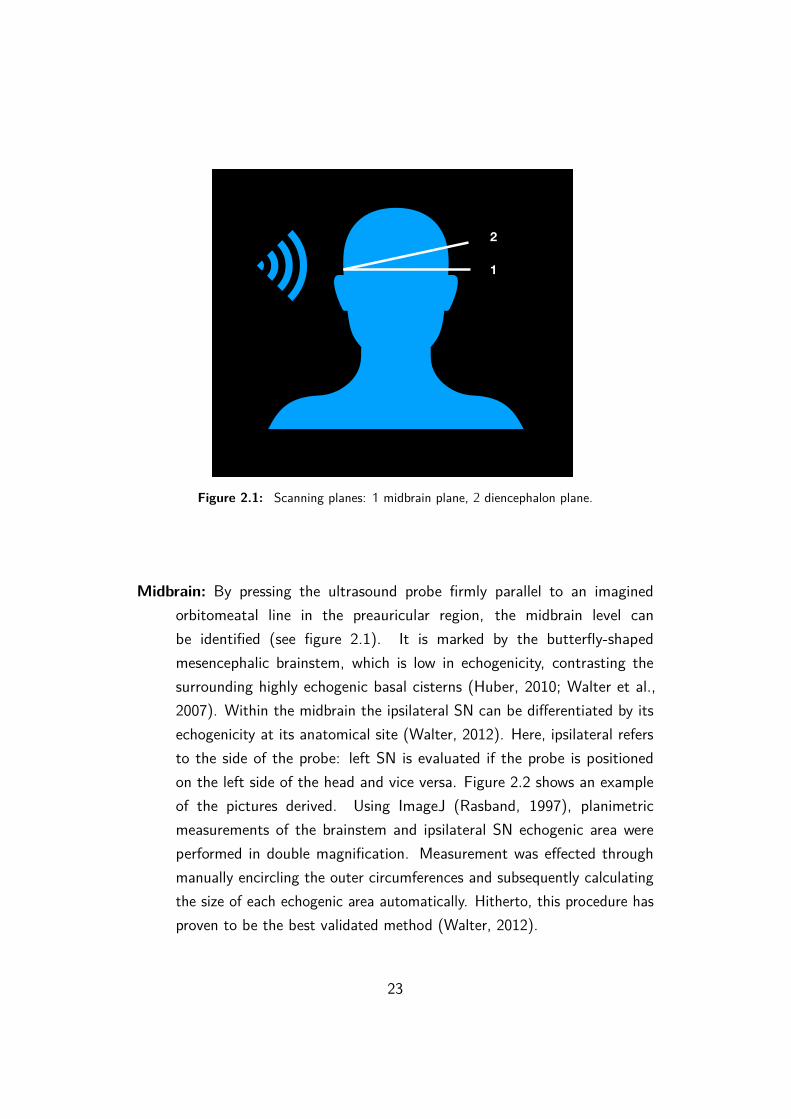
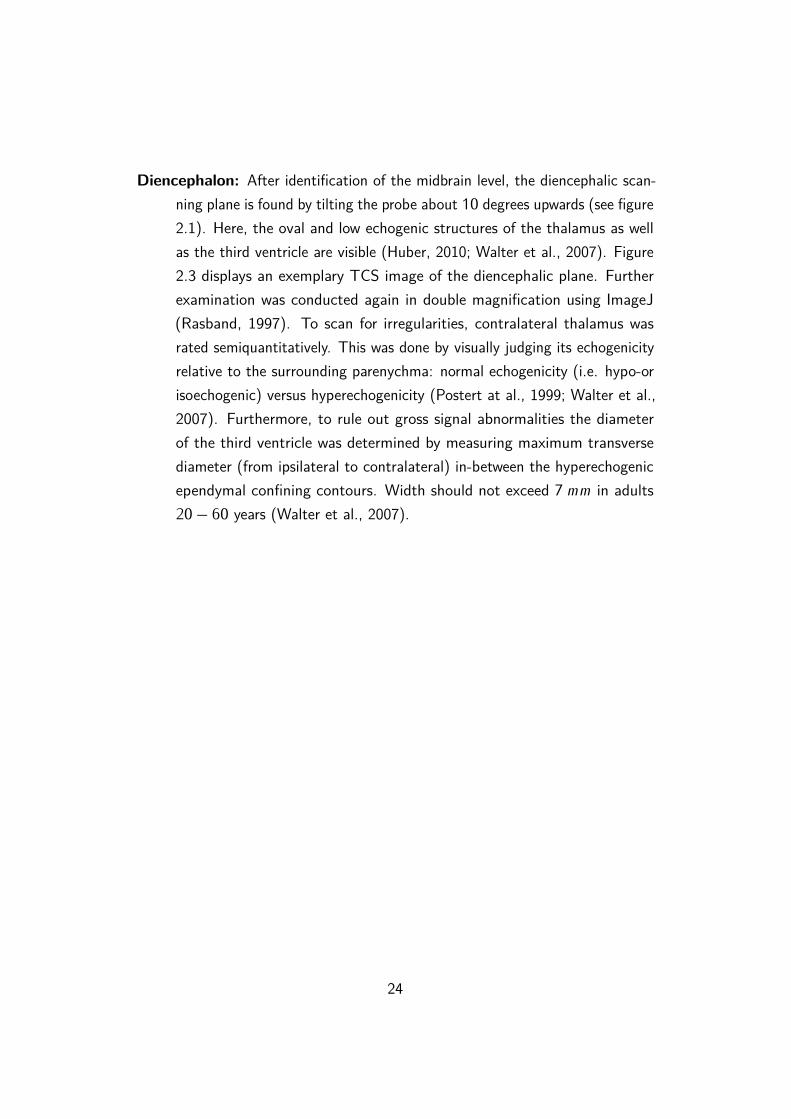
Midbrain: By pressing the ultrasound probe firmly parallel to an imaginedorbitomeatal line in the preauricular region, the midbrain level canbe identified (see figure 2.1). It is marked by the butterfly-shapedmesencephalic brainstem, which is low in echogenicity, contrasting thesurrounding highly echogenic basal cisterns (Huber, 2010; Walter et al.,2007). Within the midbrain the ipsilateral SN can be di�erentiated by itsechogenicity at its anatomical site (Walter, 2012). Here, ipsilateral refersto the side of the probe: left SN is evaluated if the probe is positionedon the left side of the head and vice versa. Figure 2.2 shows an exampleof the pictures derived. Using ImageJ (Rasband, 1997), planimetricmeasurements of the brainstem and ipsilateral SN echogenic area wereperformed in double magnification. Measurement was e�ected throughmanually encircling the outer circumferences and subsequently calculatingthe size of each echogenic area automatically. Hitherto, this procedure hasproven to be the best validated method (Walter, 2012).
23
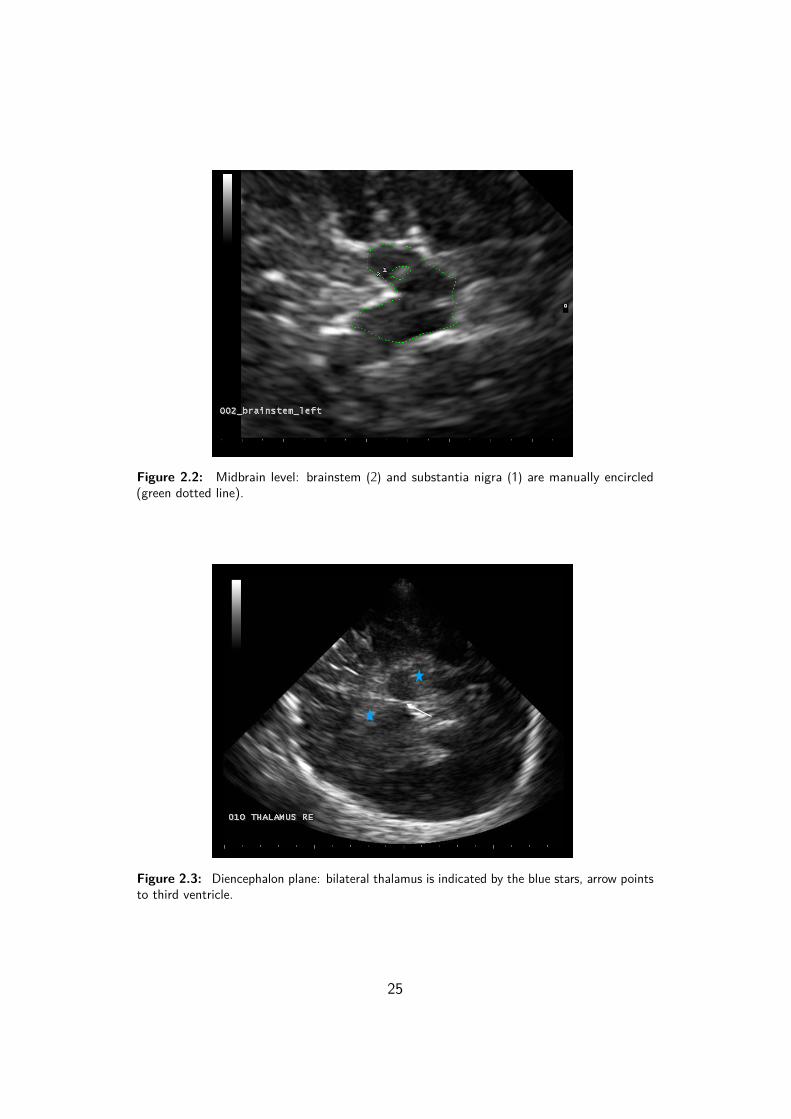
Diencephalon: After identification of the midbrain level, the diencephalic scan-ning plane is found by tilting the probe about 10 degrees upwards (see figure2.1). Here, the oval and low echogenic structures of the thalamus as wellas the third ventricle are visible (Huber, 2010; Walter et al., 2007). Figure2.3 displays an exemplary TCS image of the diencephalic plane. Furtherexamination was conducted again in double magnification using ImageJ(Rasband, 1997). To scan for irregularities, contralateral thalamus wasrated semiquantitatively. This was done by visually judging its echogenicityrelative to the surrounding parenychma: normal echogenicity (i.e. hypo-orisoechogenic) versus hyperechogenicity (Postert at al., 1999; Walter et al.,2007). Furthermore, to rule out gross signal abnormalities the diameterof the third ventricle was determined by measuring maximum transversediameter (from ipsilateral to contralateral) in-between the hyperechogenicependymal confining contours. Width should not exceed 7 �� in adults20 − 60 years (Walter et al., 2007).
24
Figure 2.2: Midbrain level: brainstem (2) and substantia nigra (1) are manually encircled(green dotted line).
Figure 2.3: Diencephalon plane: bilateral thalamus is indicated by the blue stars, arrow pointsto third ventricle.
25
2.4 Magnetic Resonance Imaging
For MRI a 3 - Tesla Magnetom Trio Scanner (Siemens, Erlangen, Germany)was deployed. T1-weighted turbo field echo (TFE) sequences were used forneuromelanin-sensitive MR image acquisition with the following parameters:repetition time (TR): 600 ��, echo time (TE): 10 ��, field of view (FoV): 178 �
220 ��, matrix size: 416 � 512, in plane (pixel) resolution: �43 � �43 ��, slicethickness: 2�5 ��, 4 � 2 averaged, and a total acquisition time of 16 : 32 ���.In addition, anatomical T1- MRI sequences were obtained and examined toexclude pathological imaging findings. Magnetization prepared rapid gradientecho (MPRAGE) sequences were applied with 176 slices, TR: 2300 ��, TE:2�95 ��, FoV: 270 ��, flip angle 9°, slice thickness: 1�2 ��. One participantrefused MRI measurement.
2.5 Serum Iron Parameters
To assess peripheral iron levels, venous blood samples were taken. A total of 29participants delivered blood samples. Five subjects refused a venepuncture due tovegetative symptoms such as nausea or due to personal reasons. Blood sampleswere analyzed for the following parameters that are related to iron metabolism:iron, ferritin, transferrin, transferrin saturation (TSAT) and C-reactive protein(CRP). Analyses were done in the central laboratory of Wuerzburg UniversityHospital.
Iron: Serum iron concentration varies strongly during the day. It depends on foodintake and circadian rhythms. High levels can indicate hemochromatosisor hemolytic anaemia. Low levels can be due to increased requirements(e.g. pregnancy), iron loss (e.g. hemorrhage), inadequate supply (e.g.vegetarianism) or insu�cient absorption (Dörner, 2009). Reference intervalsfor children (2 − 14 �����) ranged from 80 − 165 µ�/��.
Ferritin: Ferritin is a protein and the main intracellular storage of iron. It is alsoreleased to some degree into blood plasma. This concentration correlateswith intracellular ferritin. Therefore, it can be used as indirect marker for
26
the total amount of stored iron. Ferritin is high in iron excess and acuteinflammatory reactions. It is low during iron deficiency. Ferritin is alsoan acute-phase protein. Infections can trigger high ferritin concentrationsand thereby mask underlying low concentrations (Dörner, 2009). Referenceintervals for children 1 − 12 ����� were: 9�3 − 59 µ�/� .
Transferrin: Transferrin is a glycoprotein that binds to iron and serves as themain transport mechanism for cellular iron uptake. During iron deficiencytransferrin concentration is reactively high. On the other hand it is low iniron overload diseases and during acute-phase (Dörner, 2009). Referenceintervals for children ranged from 215 − 360 ��/��.
TSAT: TSAT indicates saturation of transferrin proteins with iron.
T SAT (%) = 70�9 ×����� ���� (µ�/��)
����� ����������� (��/��)Rates are high in iron overload and low in iron deficiency (Dörner, 2009).Reference intervals for children extended from 15 − 45 %.
CRP: CRP is produced in the liver and functions as an acute-phase parameter,it is a marker for acute infections (Dörner, 2009). Since iron levelscan also be altered due to infections, CRP was quantified in addition.Thereby facilitating the distinction of acute infections and chronicchanges in iron metabolism. None of the blood samples reached the clini-cal cut-o� scores of �5��/��, making a severe acute infection rather unlikely.
27
2.6 Procedure
Participants and their legal guardians were again informed about course,timing and purpose of this study. Written informed consent was obtained.Claustrophobia, metal implants and pacemaker were again explicitly inquired andexcluded. The procedure had a total duration of approximately 1 hour for eachsubject. All participants ran through the following 3 measurements but they werefree to choose if they wanted to start with TCS or MRI.
1. TCS: TCS image collection took about 15 minutes for each subject. Par-ticipants were lying supine, the examiner sitting behind their head. Theultrasound probe was pressed firmly to the preauricular region, anglingthe probe in parallel towards an imagined orbitomeatal line. Images of allplanes were obtained gradually by tilting the probe on each side of the headsystematically. The procedure was repeated for left and right sides of thehead respectively.
2. MRI: MRI data acquisition required approximately 35 minutes for eachsubject. Participants were asked to lay still and relax in order to reduceartifacts. In addition, the head was stabilized using a headrest with sidepads. To further support their compliance and minimize motion artifacts,subjects could choose to watch a children’s film.
3. Bloodsample: To reduce stress and anxiety due to venepuncture, bloodsamples were taken at the end of the whole experiment. The procedurelasted about 10 minutes. After local disinfection, a serum tube for eachsubject was taken from vena mediana cubiti.
Except for reliability assessment and data exploration, in all analyses the maximumSN echogenic size (thus the largest measurement of each bilateral measurement)was used (Walter, 2012). Three participants had no su�cient left temporalacoustic bone windows, here right hemispheric data were used. Hyperechogenicitywas determined according to standard recommendations as ≥ 75 ����������.Pronounced hyperechogenicity was defined as signal extensions ≥ 90 ����������
2007). Durbin-Watson test was used to check for independent errors. Normalprobability plots and Shapiro-Wilk tests of the residuals were evaluated to ensurenormally distributed errors. Potential multicollinearity was examined by correlationmatrices and VIF. Standardized residuals and predicted values helped to rule outheteroscedasticity. Influential cases were assessed by Cook’s distance, leveragevalues and standardized DFBeta values. To test for di�erences between groupsMann-Whitney test (2 groups) was used for nonparametric data, it is based onranked data and ����� � is reported. Lines-of-best-fit (least square method) areused to illustrate correlations. Andy Field’s “Discovering Statistics Using SPSS”(2005) helped to answer specific statistical questions and understand settings inSPSS routines.
31
3 ResultsA total of 6 subjects had to be excluded from final data analyses due to: insu�cientbone window (1 case), conspicuous SDQ = 93 %��� (1 case) or female gender(4 cases). Since gender has been shown previously to have an e�ect on SNechogenicity (Schweitzer et al., 2007) and also movement disorders are moreprevalent among man (Loke, Harley & Lee, 2015) only male participants werefinally included, leaving a total of 28 participants.
From those subjects finally included in further analyses, datapoints weremissing for 1 subject who rejected MRI scan. Three subjects refused venipuncture.Due to technical problems in the laboratory for 3 subjects parts of the bloodparameters were missing. Cases were excluded listwise.
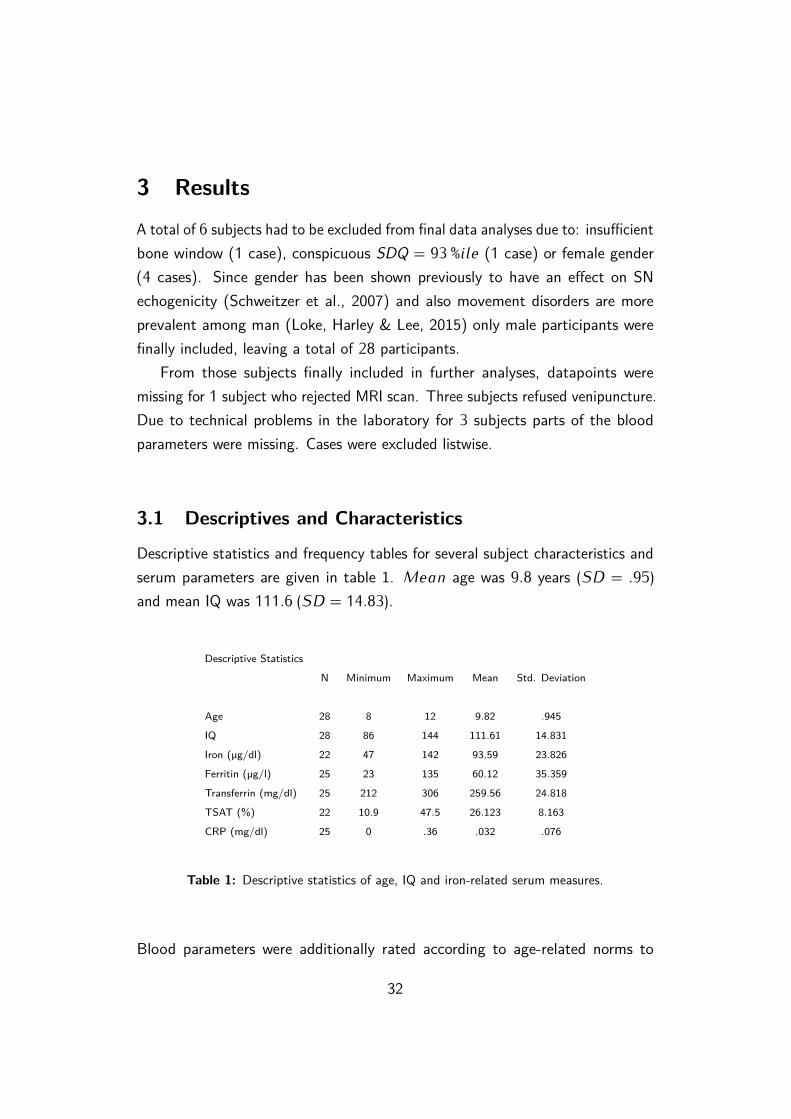
3.1 Descriptives and Characteristics
Descriptive statistics and frequency tables for several subject characteristics andserum parameters are given in table 1. M��� age was 9�8 years (SD = �95)and mean IQ was 111�6 (SD = 14�83).
Descriptive Statistics
N Minimum Maximum Mean Std. Deviation
Age 28 8 12 9.82 .945
IQ 28 86 144 111.61 14.831
Iron (µg/dl) 22 47 142 93.59 23.826
Ferritin (µg/l) 25 23 135 60.12 35.359
Transferrin (mg/dl) 25 212 306 259.56 24.818
TSAT (%) 22 10.9 47.5 26.123 8.163
CRP (mg/dl) 25 0 .36 .032 .076
Table 1: Descriptive statistics of age, IQ and iron-related serum measures.
Blood parameters were additionally rated according to age-related norms to
32
indicate if they were below norm, within norm or above norm. Within the scope ofnormal measuring inaccuracy, subjects mostly had only minor abnormalities in 1parameter. Serum iron was below norm in 5 subjects, none had a surplus. Ferritinwas above norm in 9 subjects. None of the children showed ferritin concentrationsbelow norm. Although unfortunately further information on e.g. hemoglobin,reticulocytes was not obtained, iron deficiency anemia is improbable. Transferrinwas below norm in 1 subject, no serum concentrations were above referenceintervals. TSAT was deficient in 2 subjects and above norm in 1 subject. Twochildren had a low TSAT and low iron indicating a slight iron undersupply, buttheir ferritin was within normal range. Serious infections mostly involve elevatedCRP. In this sample CRP was within norm for all subjects.
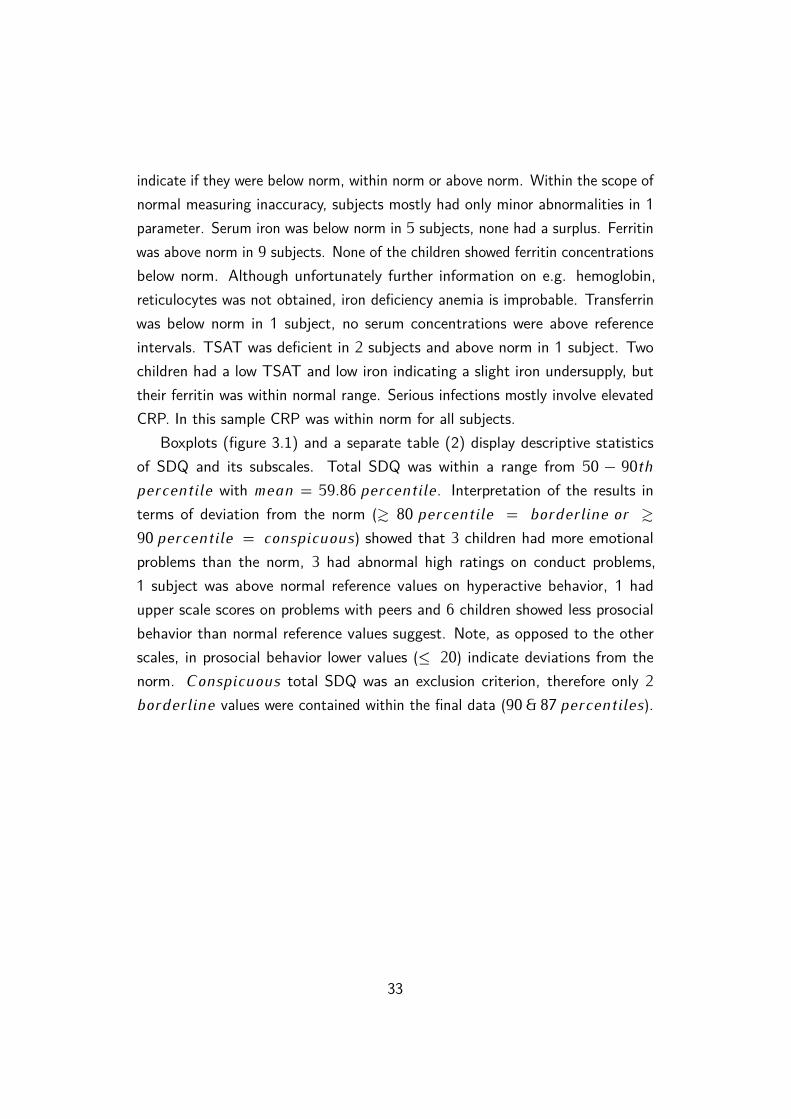
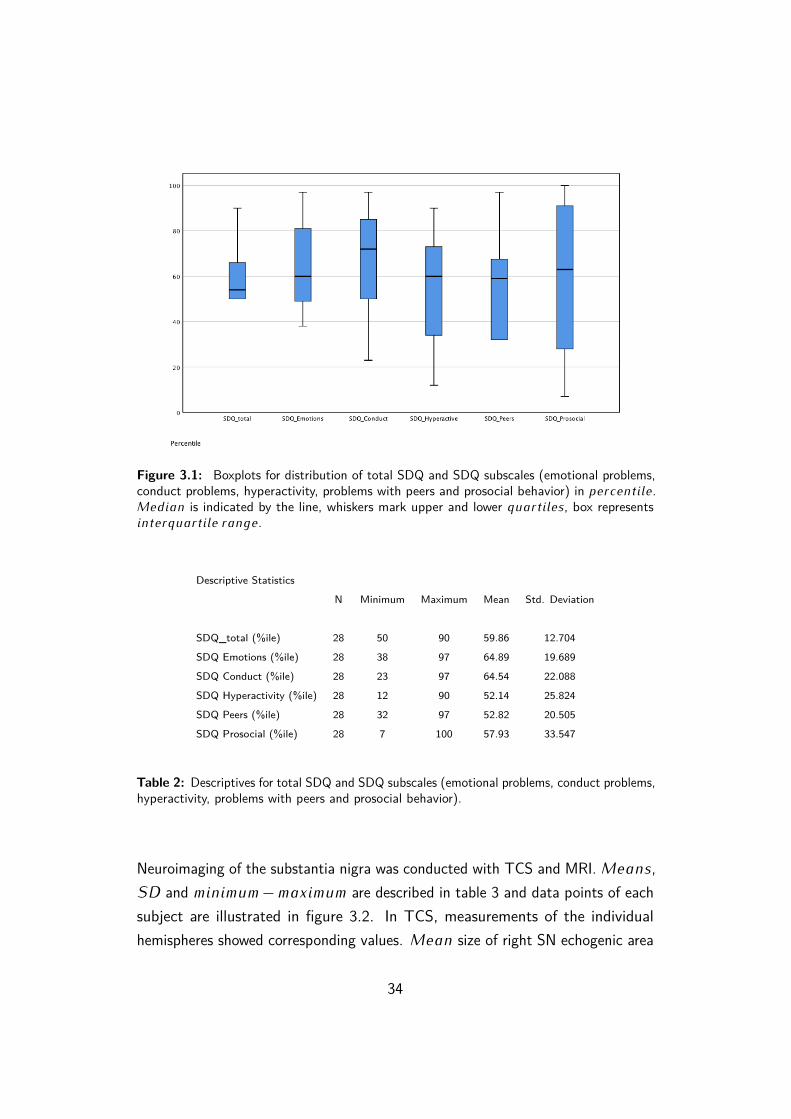
Boxplots (figure 3.1) and a separate table (2) display descriptive statisticsof SDQ and its subscales. Total SDQ was within a range from 50 − 90��
���������� with ���� = 59�86 ����������. Interpretation of the results interms of deviation from the norm (? 80 ���������� = ���������� �� ?90 ���������� = �����������) showed that 3 children had more emotionalproblems than the norm, 3 had abnormal high ratings on conduct problems,1 subject was above normal reference values on hyperactive behavior, 1 hadupper scale scores on problems with peers and 6 children showed less prosocialbehavior than normal reference values suggest. Note, as opposed to the otherscales, in prosocial behavior lower values (≤ 20) indicate deviations from thenorm. C���������� total SDQ was an exclusion criterion, therefore only 2���������� values were contained within the final data (90 & 87 �����������).
33
Figure 3.1: Boxplots for distribution of total SDQ and SDQ subscales (emotional problems,conduct problems, hyperactivity, problems with peers and prosocial behavior) in ����������.M����� is indicated by the line, whiskers mark upper and lower ���������, box represents������������� �����.
Descriptive Statistics
N Minimum Maximum Mean Std. Deviation
SDQ_total (%ile) 28 50 90 59.86 12.704
SDQ Emotions (%ile) 28 38 97 64.89 19.689
SDQ Conduct (%ile) 28 23 97 64.54 22.088
SDQ Hyperactivity (%ile) 28 12 90 52.14 25.824
SDQ Peers (%ile) 28 32 97 52.82 20.505
SDQ Prosocial (%ile) 28 7 100 57.93 33.547
Table 2: Descriptives for total SDQ and SDQ subscales (emotional problems, conduct problems,hyperactivity, problems with peers and prosocial behavior).
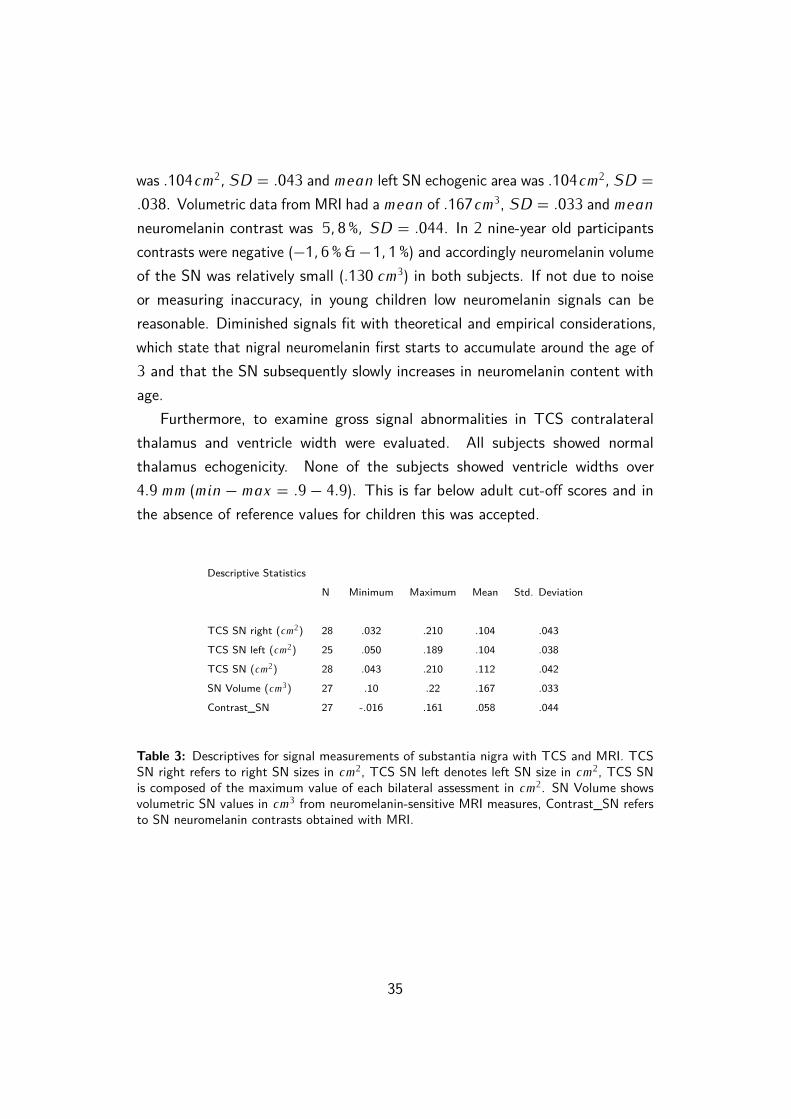
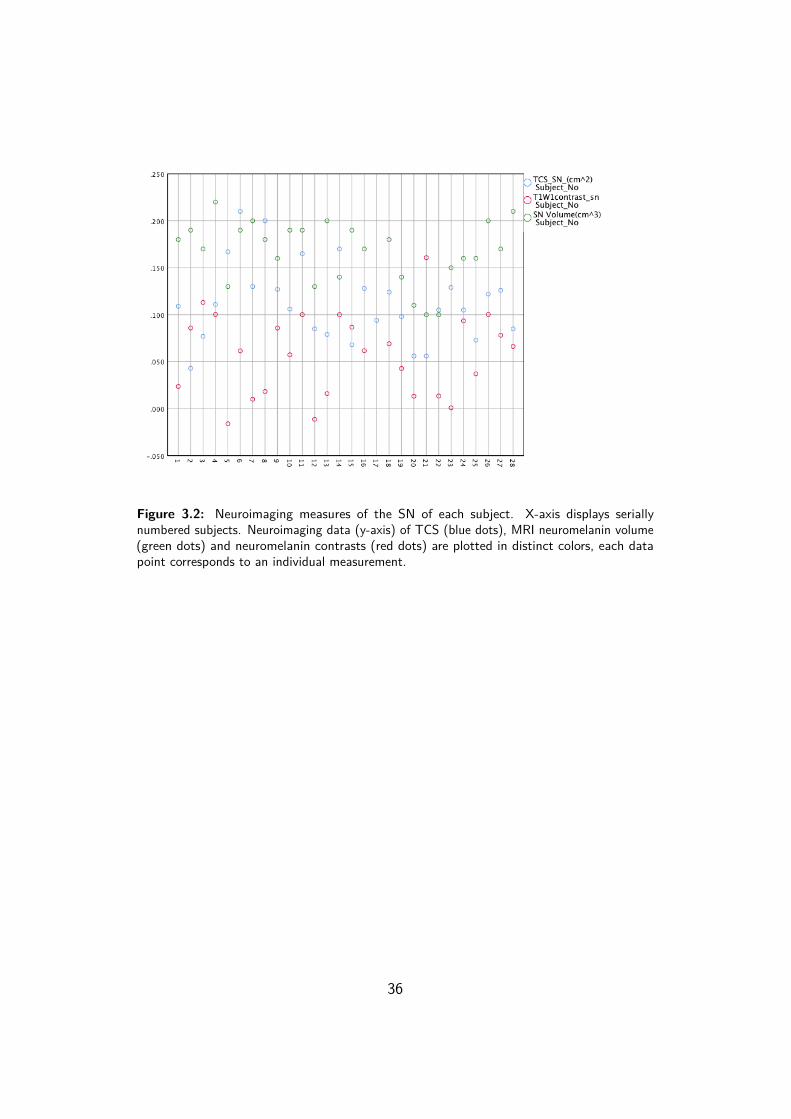
Neuroimaging of the substantia nigra was conducted with TCS and MRI. M����,SD and ������� − ������� are described in table 3 and data points of eachsubject are illustrated in figure 3.2. In TCS, measurements of the individualhemispheres showed corresponding values. M��� size of right SN echogenic area
34
was �104��2� SD = �043 and ���� left SN echogenic area was �104��
2� SD =
�038. Volumetric data from MRI had a ���� of �167��3, SD = �033 and ����
neuromelanin contrast was 5� 8 %� SD = �044. In 2 nine-year old participantscontrasts were negative (−1� 6 % & −1� 1 %) and accordingly neuromelanin volumeof the SN was relatively small (�130 ��
3) in both subjects. If not due to noiseor measuring inaccuracy, in young children low neuromelanin signals can bereasonable. Diminished signals fit with theoretical and empirical considerations,which state that nigral neuromelanin first starts to accumulate around the age of3 and that the SN subsequently slowly increases in neuromelanin content withage.
Furthermore, to examine gross signal abnormalities in TCS contralateralthalamus and ventricle width were evaluated. All subjects showed normalthalamus echogenicity. None of the subjects showed ventricle widths over4�9 �� (��� − ��� = �9 − 4�9). This is far below adult cut-o� scores and inthe absence of reference values for children this was accepted.
Descriptive Statistics
N Minimum Maximum Mean Std. Deviation
TCS SN right (��2) 28 .032 .210 .104 .043
TCS SN left (��2) 25 .050 .189 .104 .038
TCS SN (��2) 28 .043 .210 .112 .042
SN Volume (��3) 27 .10 .22 .167 .033
Contrast_SN 27 -.016 .161 .058 .044
Table 3: Descriptives for signal measurements of substantia nigra with TCS and MRI. TCSSN right refers to right SN sizes in ��
2, TCS SN left denotes left SN size in ��2, TCS SN
is composed of the maximum value of each bilateral assessment in ��2. SN Volume shows
volumetric SN values in ��3 from neuromelanin-sensitive MRI measures, Contrast_SN refers
to SN neuromelanin contrasts obtained with MRI.
35
Figure 3.2: Neuroimaging measures of the SN of each subject. X-axis displays seriallynumbered subjects. Neuroimaging data (y-axis) of TCS (blue dots), MRI neuromelanin volume(green dots) and neuromelanin contrasts (red dots) are plotted in distinct colors, each datapoint corresponds to an individual measurement.
36
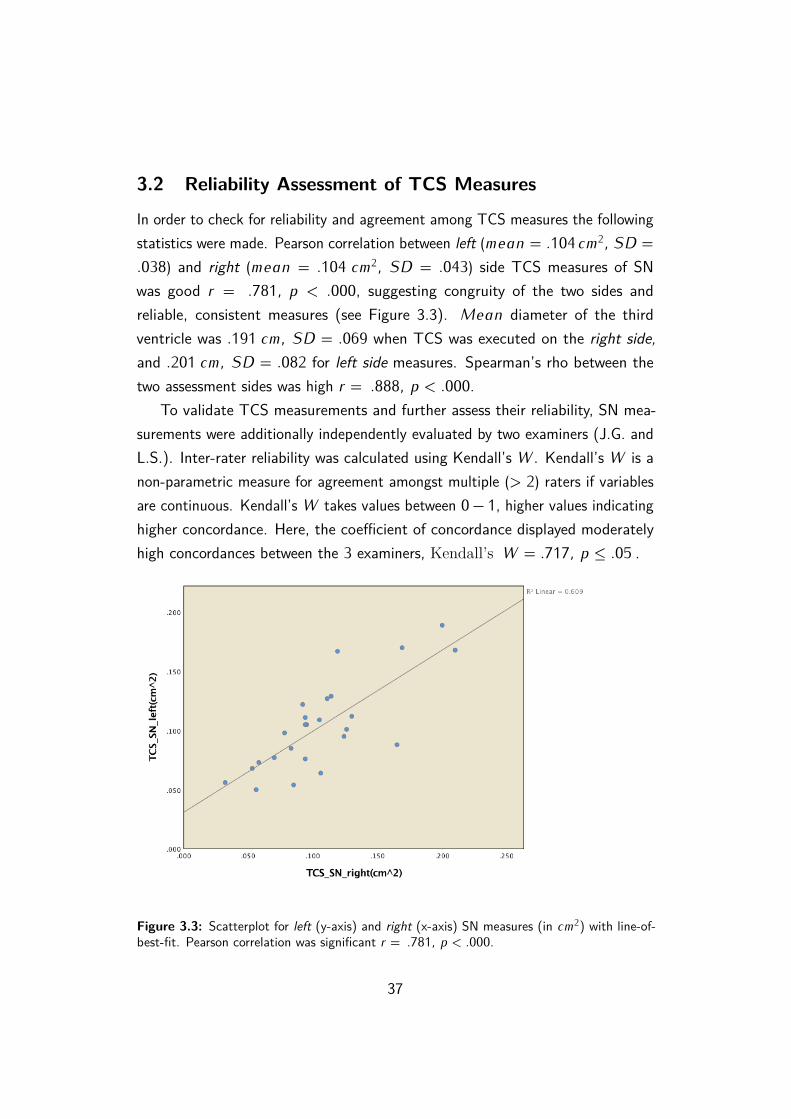
3.2 Reliability Assessment of TCS Measures
In order to check for reliability and agreement among TCS measures the followingstatistics were made. Pearson correlation between left (���� = �104��
2� SD =
�038) and right (���� = �104 ��2� SD = �043) side TCS measures of SN
was good � = �781� � < �000, suggesting congruity of the two sides andreliable, consistent measures (see Figure 3.3). M��� diameter of the thirdventricle was �191 ��� SD = �069 when TCS was executed on the right side,and �201 ��� SD = �082 for left side measures. Spearman’s rho between thetwo assessment sides was high � = �888� � < �000.
To validate TCS measurements and further assess their reliability, SN mea-surements were additionally independently evaluated by two examiners (J.G. andL.S.). Inter-rater reliability was calculated using Kendall’s W . Kendall’s W is anon-parametric measure for agreement amongst multiple (> 2) raters if variablesare continuous. Kendall’s W takes values between 0 − 1, higher values indicatinghigher concordance. Here, the coe�cient of concordance displayed moderatelyhigh concordances between the 3 examiners, Kendall’s W = �717� � ≤ �05 .
Figure 3.3: Scatterplot for left (y-axis) and right (x-axis) SN measures (in ��2) with line-of-
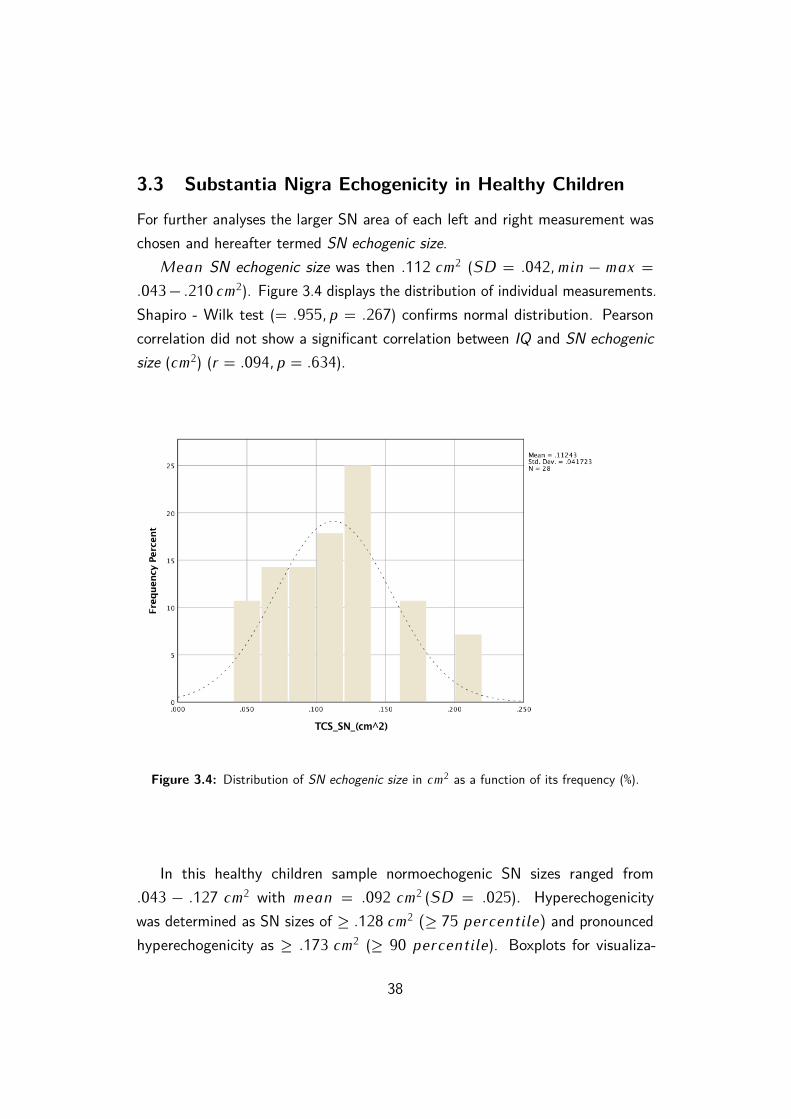
3.3 Substantia Nigra Echogenicity in Healthy Children
For further analyses the larger SN area of each left and right measurement waschosen and hereafter termed SN echogenic size.
M��� SN echogenic size was then �112 ��2 (SD = �042� ��� − ��� =
�043 − �210 ��2). Figure 3.4 displays the distribution of individual measurements.
Shapiro - Wilk test (= �955� � = �267) confirms normal distribution. Pearsoncorrelation did not show a significant correlation between IQ and SN echogenicsize (��
2) (� = �094� � = �634).
Figure 3.4: Distribution of SN echogenic size in ��2 as a function of its frequency (%).
In this healthy children sample normoechogenic SN sizes ranged from�043 − �127 ��
2 with ���� = �092 ��2 (SD = �025). Hyperechogenicity
was determined as SN sizes of ≥ �128 ��2 (≥ 75 ����������) and pronounced
hyperechogenicity as ≥ �173 ��2 (≥ 90 ����������). Boxplots for visualiza-
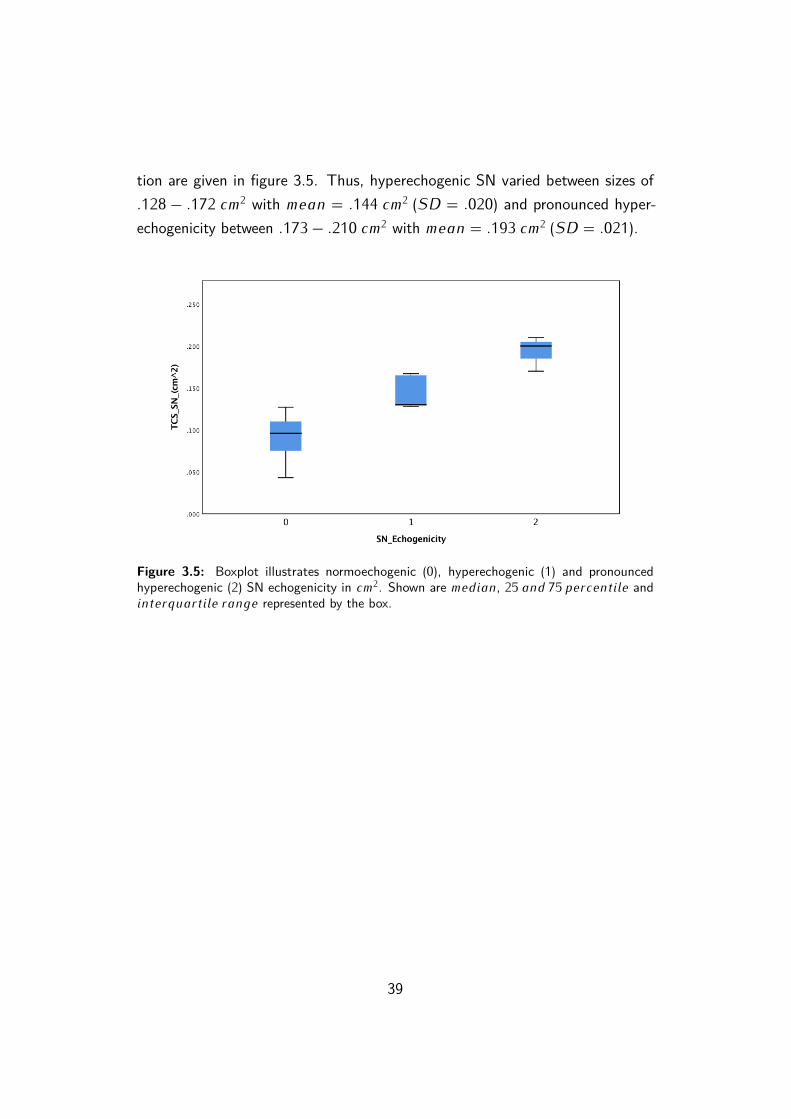
38
tion are given in figure 3.5. Thus, hyperechogenic SN varied between sizes of�128 − �172 ��
2 with ���� = �144 ��2 (SD = �020) and pronounced hyper-
echogenicity between �173 − �210 ��2 with ���� = �193 ��
2 (SD = �021).
Figure 3.5: Boxplot illustrates normoechogenic (0), hyperechogenic (1) and pronouncedhyperechogenic (2) SN echogenicity in ��
2. Shown are ������, 25 ��� 75 ���������� and������������� ����� represented by the box.
39
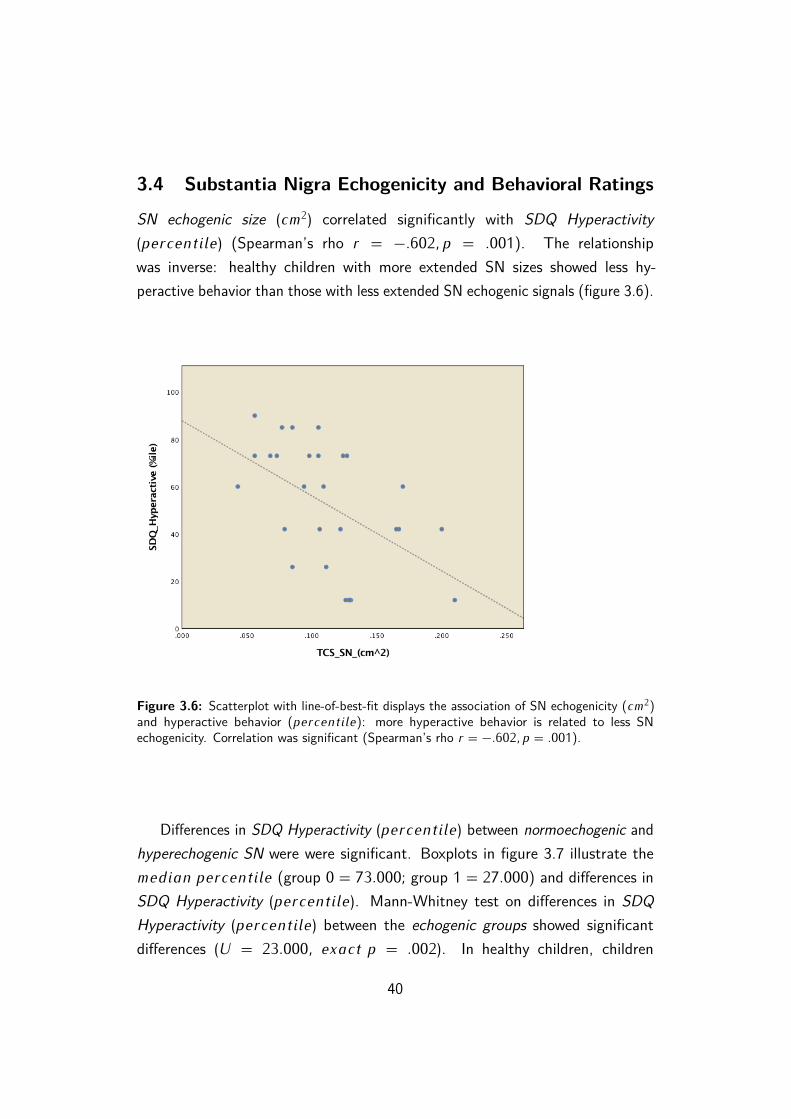
3.4 Substantia Nigra Echogenicity and Behavioral Ratings
SN echogenic size (��2) correlated significantly with SDQ Hyperactivity
(����������) (Spearman’s rho � = −�602� � = �001). The relationshipwas inverse: healthy children with more extended SN sizes showed less hy-peractive behavior than those with less extended SN echogenic signals (figure 3.6).
Figure 3.6: Scatterplot with line-of-best-fit displays the association of SN echogenicity (��2)
and hyperactive behavior (����������): more hyperactive behavior is related to less SNechogenicity. Correlation was significant (Spearman’s rho � = −�602� � = �001).
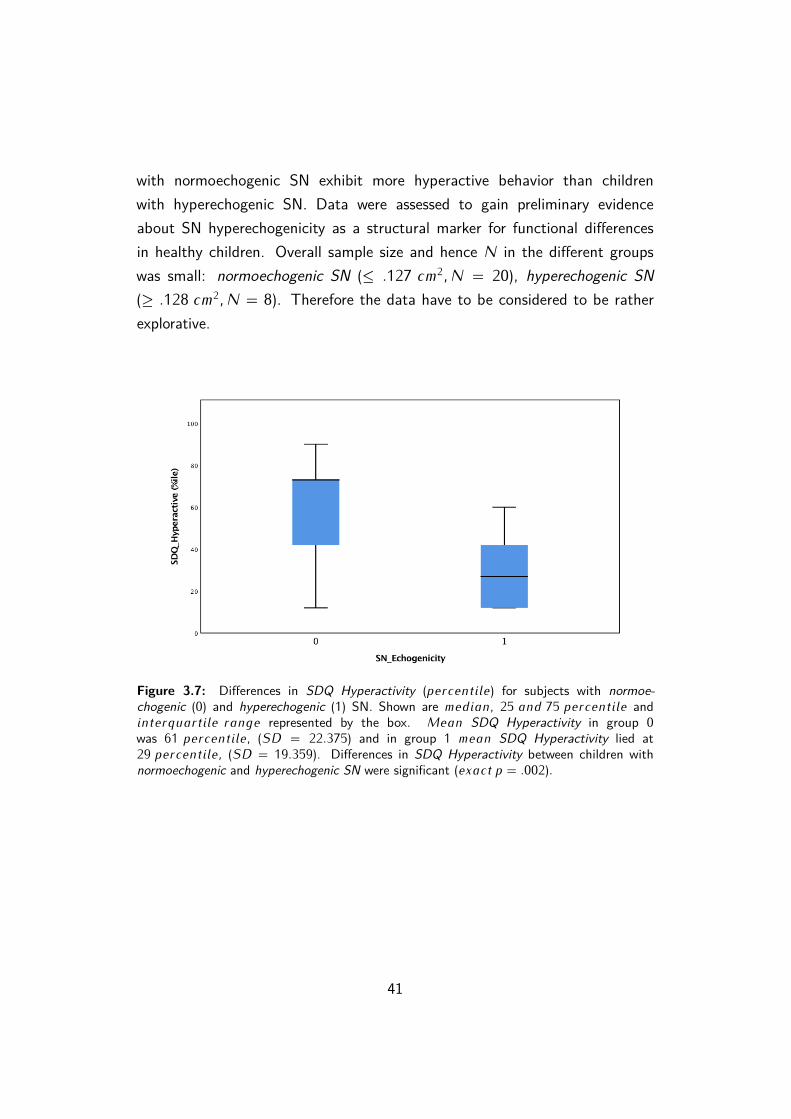
Di�erences in SDQ Hyperactivity (����������) between normoechogenic andhyperechogenic SN were were significant. Boxplots in figure 3.7 illustrate the������ ���������� (group 0 = 73�000; group 1 = 27�000) and di�erences inSDQ Hyperactivity (����������). Mann-Whitney test on di�erences in SDQHyperactivity (����������) between the echogenic groups showed significantdi�erences (U = 23�000� ����� � = �002). In healthy children, children
40
with normoechogenic SN exhibit more hyperactive behavior than childrenwith hyperechogenic SN. Data were assessed to gain preliminary evidenceabout SN hyperechogenicity as a structural marker for functional di�erencesin healthy children. Overall sample size and hence N in the di�erent groupswas small: normoechogenic SN (≤ �127 ��
2� N = 20), hyperechogenic SN
(≥ �128 ��2� N = 8). Therefore the data have to be considered to be rather
explorative.
Figure 3.7: Di�erences in SDQ Hyperactivity (����������) for subjects with normoe-
chogenic (0) and hyperechogenic (1) SN. Shown are ������, 25 ��� 75 ���������� and������������� ����� represented by the box. M��� SDQ Hyperactivity in group 0was 61 ����������� (SD = 22�375) and in group 1 ���� SDQ Hyperactivity lied at29 ����������� (SD = 19�359). Di�erences in SDQ Hyperactivity between children withnormoechogenic and hyperechogenic SN were significant (����� � = �002)�
41
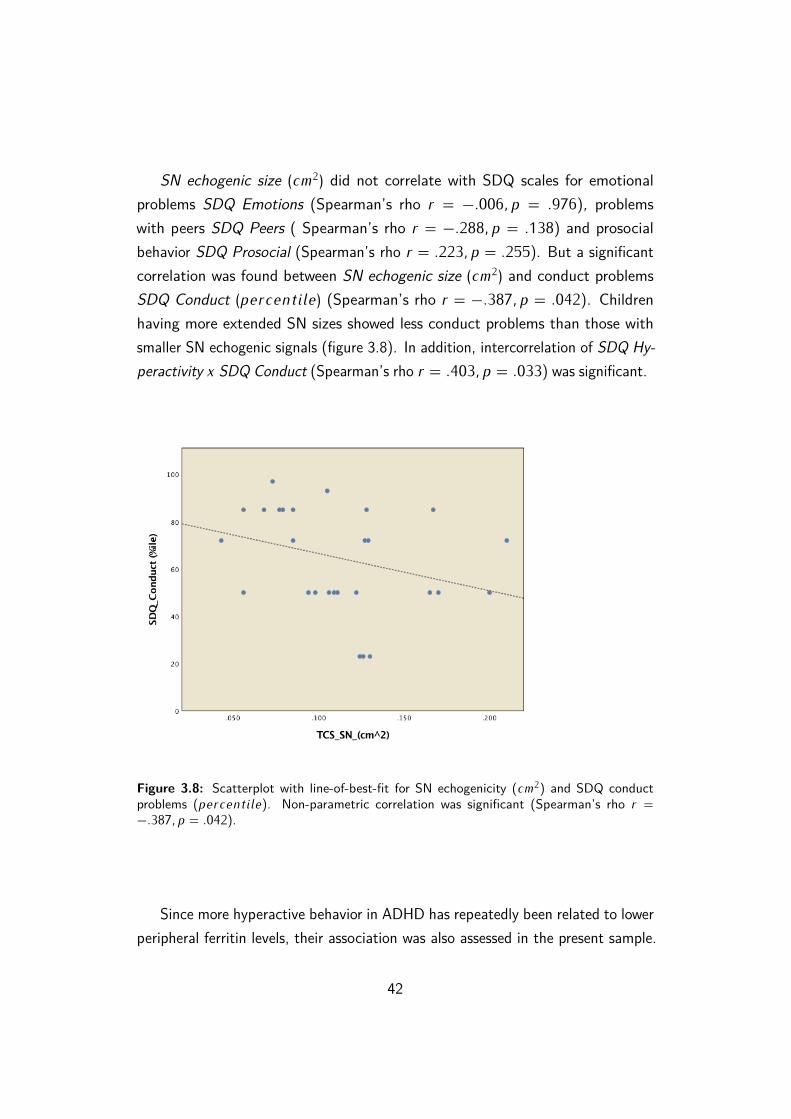
SN echogenic size (��2) did not correlate with SDQ scales for emotional
problems SDQ Emotions (Spearman’s rho � = −�006� � = �976), problemswith peers SDQ Peers ( Spearman’s rho � = −�288� � = �138) and prosocialbehavior SDQ Prosocial (Spearman’s rho � = �223� � = �255). But a significantcorrelation was found between SN echogenic size (��
2) and conduct problemsSDQ Conduct (����������) (Spearman’s rho � = −�387� � = �042). Childrenhaving more extended SN sizes showed less conduct problems than those withsmaller SN echogenic signals (figure 3.8). In addition, intercorrelation of SDQ Hy-peractivity � SDQ Conduct (Spearman’s rho � = �403� � = �033) was significant.
Figure 3.8: Scatterplot with line-of-best-fit for SN echogenicity (��2) and SDQ conduct
Since more hyperactive behavior in ADHD has repeatedly been related to lowerperipheral ferritin levels, their association was also assessed in the present sample.
42
SDQ Hyperactivity (����������) did not correlate with ferritin (µg/l) (Spearman’srho � = −�026� � = �900). Also none of the subscales changed as a functionof age: SDQ Hyperactivity � age (Spearman’s rho � = −�129� � = �513), SDQConduct � age (Spearman’s rho � = −�111� � = �576), SDQ Emotions � age(Spearman’s rho � = −�089� � = �653), SDQ Prosocial � age (Spearman’s rho� = �060� � = �761), SDQ Peers � age ( Spearman’s rho � = −�048� � = �807).
43
3.5 Regression Analyses
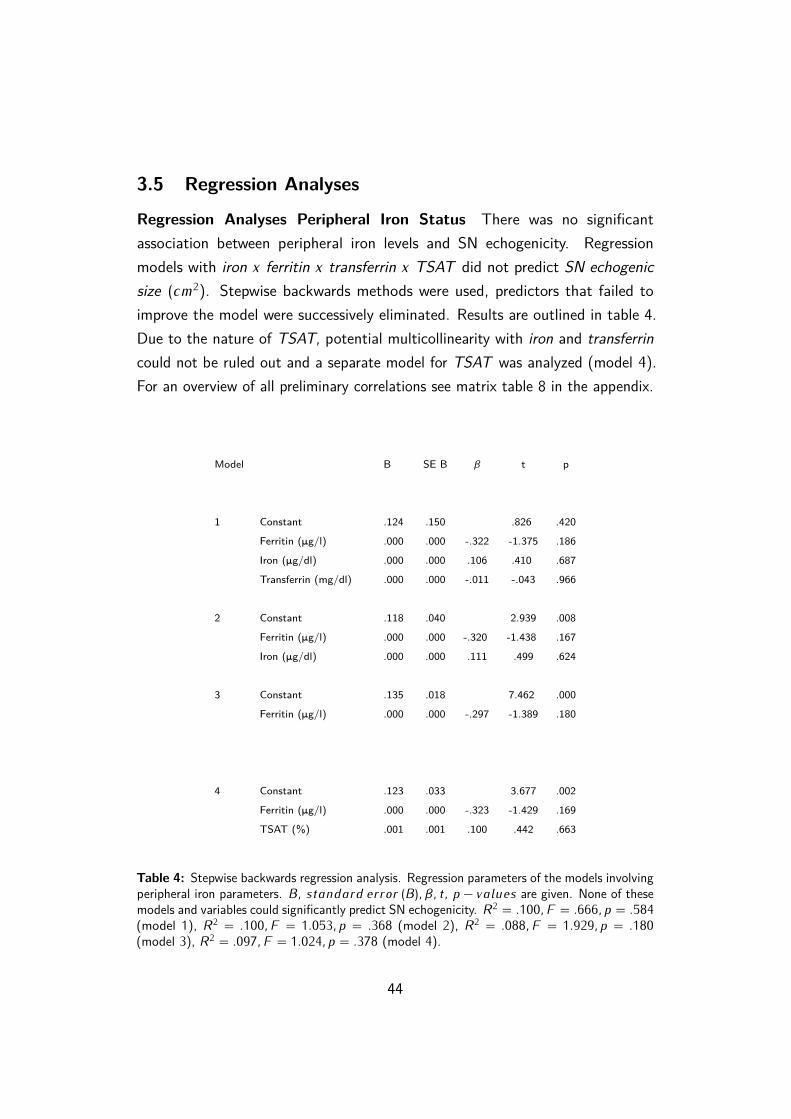
Regression Analyses Peripheral Iron Status There was no significantassociation between peripheral iron levels and SN echogenicity. Regressionmodels with iron � ferritin � transferrin � TSAT did not predict SN echogenicsize (��
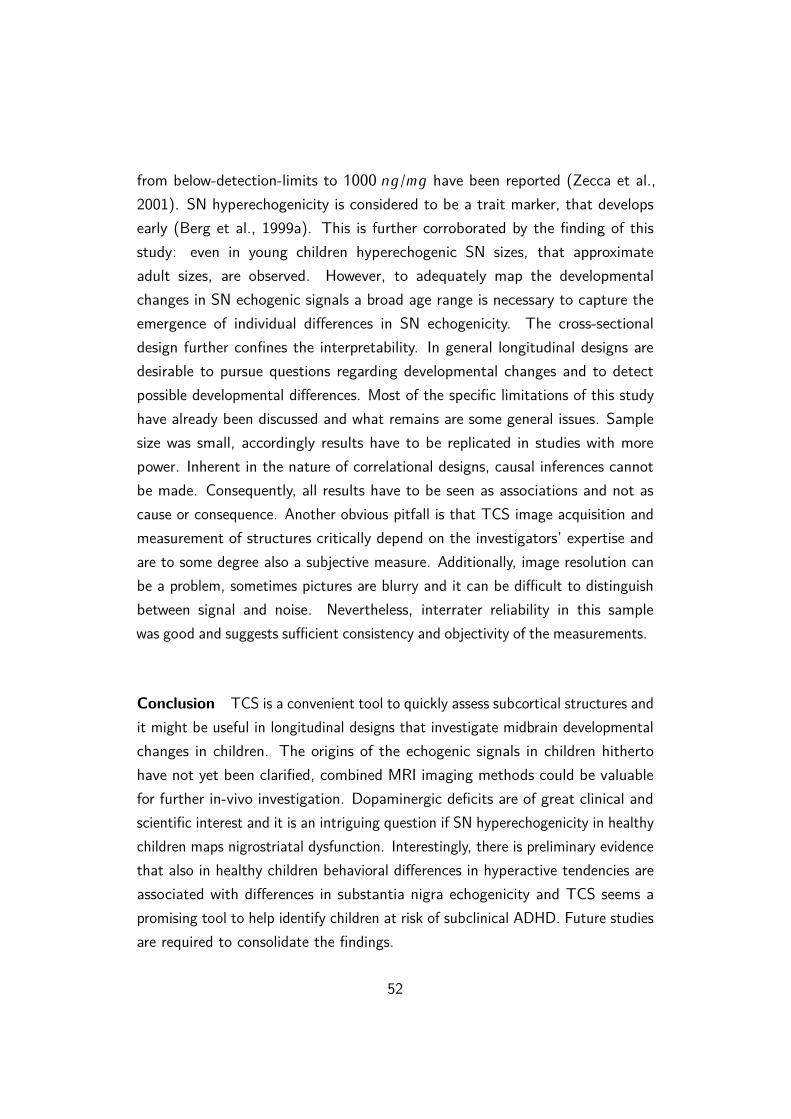
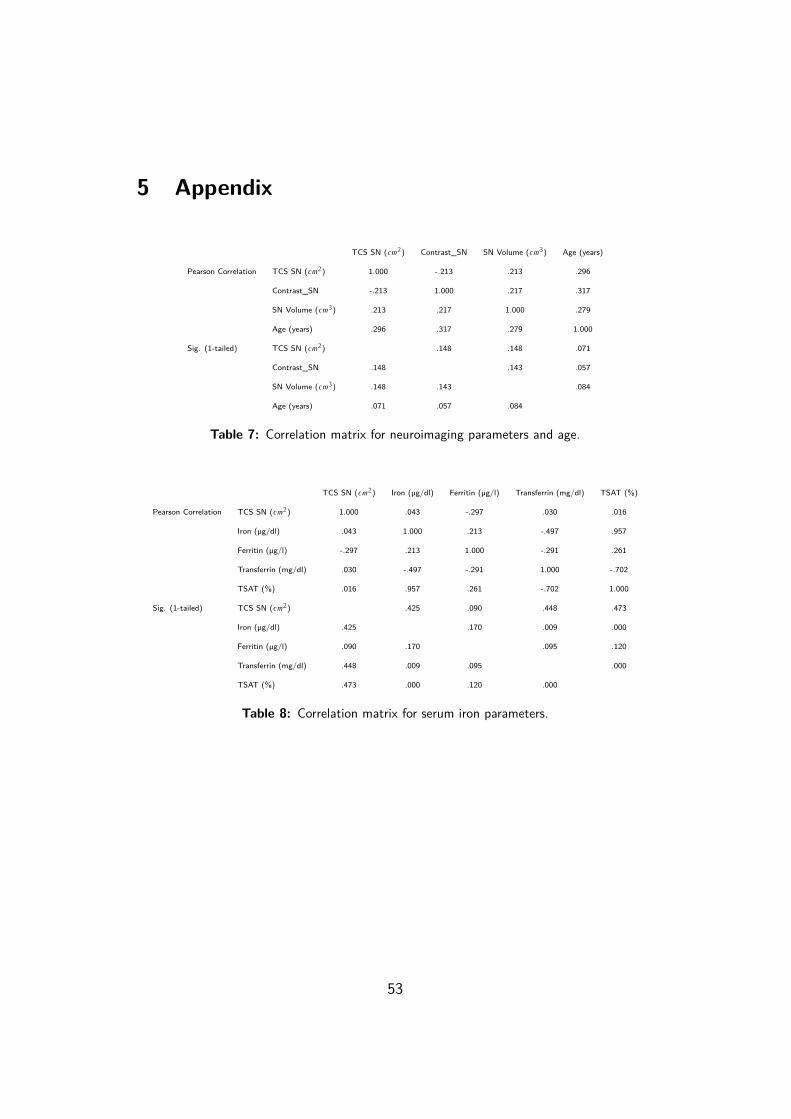
2). Stepwise backwards methods were used, predictors that failed toimprove the model were successively eliminated. Results are outlined in table 4.Due to the nature of TSAT, potential multicollinearity with iron and transferrincould not be ruled out and a separate model for TSAT was analyzed (model 4).For an overview of all preliminary correlations see matrix table 8 in the appendix.
Model B SE B β t p
1 Constant .124 .150 .826 .420
Ferritin (mg/l) .000 .000 -.322 -1.375 .186
Iron (mg/dl) .000 .000 .106 .410 .687
Transferrin (mg/dl) .000 .000 -.011 -.043 .966
2 Constant .118 .040 2.939 .008
Ferritin (mg/l) .000 .000 -.320 -1.438 .167
Iron (mg/dl) .000 .000 .111 .499 .624
3 Constant .135 .018 7.462 .000
Ferritin (mg/l) .000 .000 -.297 -1.389 .180
4 Constant .123 .033 3.677 .002
Ferritin (mg/l) .000 .000 -.323 -1.429 .169
TSAT (%) .001 .001 .100 .442 .663
Table 4: Stepwise backwards regression analysis. Regression parameters of the models involvingperipheral iron parameters. B� �������� ����� (B)� β� �� � − ������ are given. None of thesemodels and variables could significantly predict SN echogenicity. R
2 = �100� F = �666� � = �584(model 1), R
2 = �100� F = 1�053� � = �368 (model 2), R2 = �088� F = 1�929� � = �180
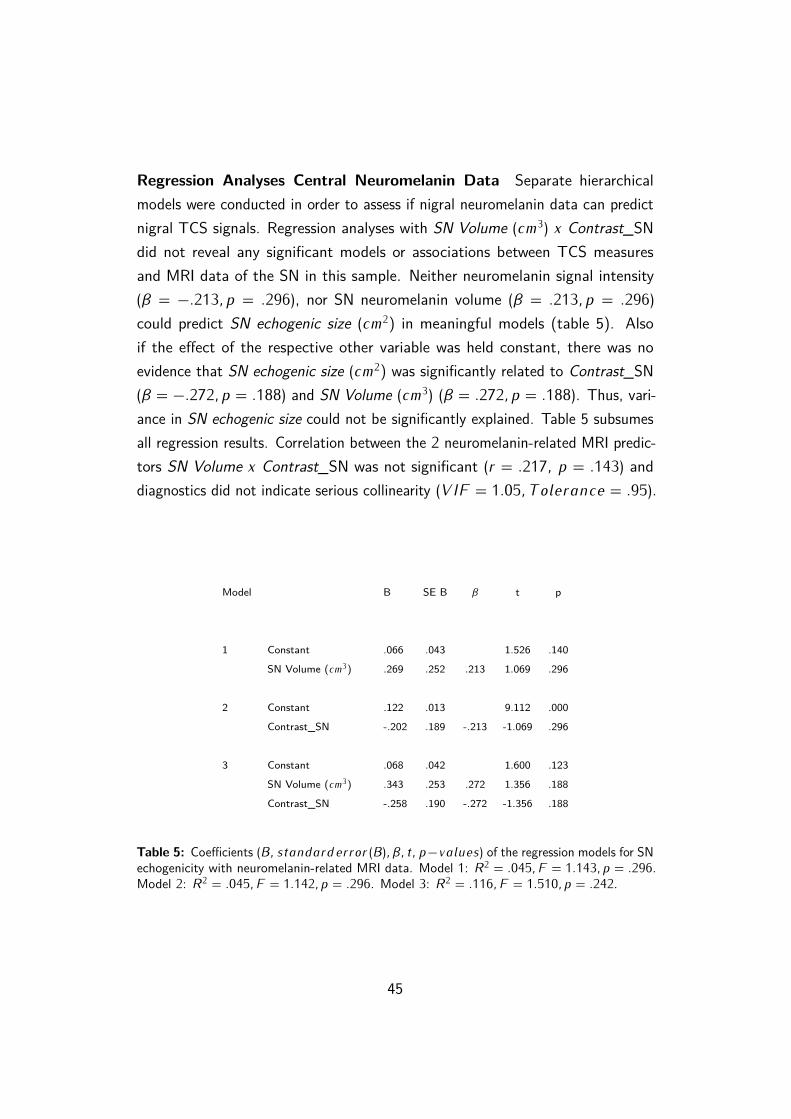
Regression Analyses Central Neuromelanin Data Separate hierarchicalmodels were conducted in order to assess if nigral neuromelanin data can predictnigral TCS signals. Regression analyses with SN Volume (��
3) � Contrast_SNdid not reveal any significant models or associations between TCS measuresand MRI data of the SN in this sample. Neither neuromelanin signal intensity(β = −�213� � = �296), nor SN neuromelanin volume (β = �213� � = �296)could predict SN echogenic size (��
2) in meaningful models (table 5). Alsoif the e�ect of the respective other variable was held constant, there was noevidence that SN echogenic size (��
2) was significantly related to Contrast_SN(β = −�272� � = �188) and SN Volume (��
3) (β = �272� � = �188). Thus, vari-ance in SN echogenic size could not be significantly explained. Table 5 subsumesall regression results. Correlation between the 2 neuromelanin-related MRI predic-tors SN Volume � Contrast_SN was not significant (� = �217� � = �143) anddiagnostics did not indicate serious collinearity (V IF = 1�05� T �������� = �95).
Model B SE B β t p
1 Constant .066 .043 1.526 .140
SN Volume (��3) .269 .252 .213 1.069 .296
2 Constant .122 .013 9.112 .000
Contrast_SN -.202 .189 -.213 -1.069 .296
3 Constant .068 .042 1.600 .123
SN Volume (��3) .343 .253 .272 1.356 .188
Contrast_SN -.258 .190 -.272 -1.356 .188
Table 5: Coe�cients (B� ������������� (B)� β� �� �−������) of the regression models for SNechogenicity with neuromelanin-related MRI data. Model 1: R
2 = �045� F = 1�143� � = �296.Model 2: R
2 = �045� F = 1�142� � = �296. Model 3: R2 = �116� F = 1�510� � = �242.
45
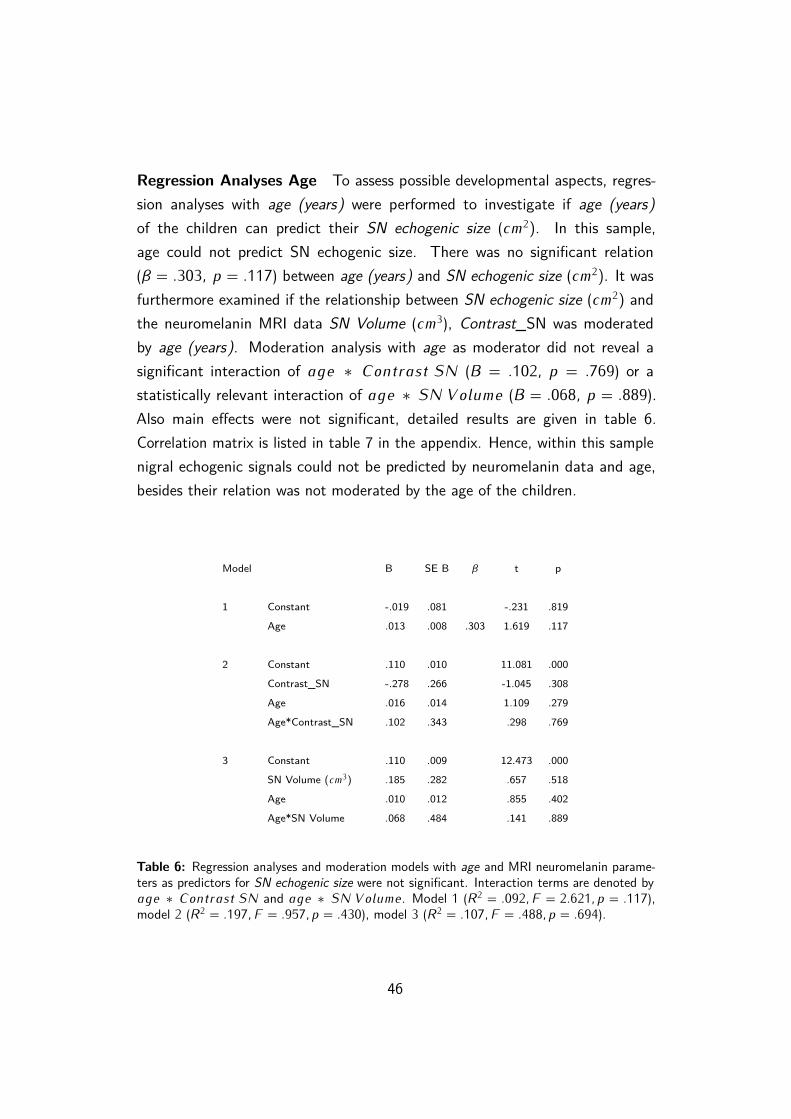
Regression Analyses Age To assess possible developmental aspects, regres-sion analyses with age (years) were performed to investigate if age (years)of the children can predict their SN echogenic size (��
2). In this sample,age could not predict SN echogenic size. There was no significant relation(β = �303� � = �117) between age (years) and SN echogenic size (��
2). It wasfurthermore examined if the relationship between SN echogenic size (��
2) andthe neuromelanin MRI data SN Volume (��
3), Contrast_SN was moderatedby age (years). Moderation analysis with age as moderator did not reveal asignificant interaction of ��� ∗ C������� SN (B = �102� � = �769) or astatistically relevant interaction of ��� ∗ SN V ����� (B = �068� � = �889).Also main e�ects were not significant, detailed results are given in table 6.Correlation matrix is listed in table 7 in the appendix. Hence, within this samplenigral echogenic signals could not be predicted by neuromelanin data and age,besides their relation was not moderated by the age of the children.
Model B SE B β t p
1 Constant -.019 .081 -.231 .819
Age .013 .008 .303 1.619 .117
2 Constant .110 .010 11.081 .000
Contrast_SN -.278 .266 -1.045 .308
Age .016 .014 1.109 .279
Age*Contrast_SN .102 .343 .298 .769
3 Constant .110 .009 12.473 .000
SN Volume (��3) .185 .282 .657 .518
Age .010 .012 .855 .402
Age*SN Volume .068 .484 .141 .889
Table 6: Regression analyses and moderation models with age and MRI neuromelanin parame-ters as predictors for SN echogenic size were not significant. Interaction terms are denoted by��� ∗ C������� SN and ��� ∗ SN V �����. Model 1 (R2 = �092� F = 2�621� � = �117),model 2 (R2 = �197� F = �957� � = �430), model 3 (R2 = �107� F = �488� � = �694).
46
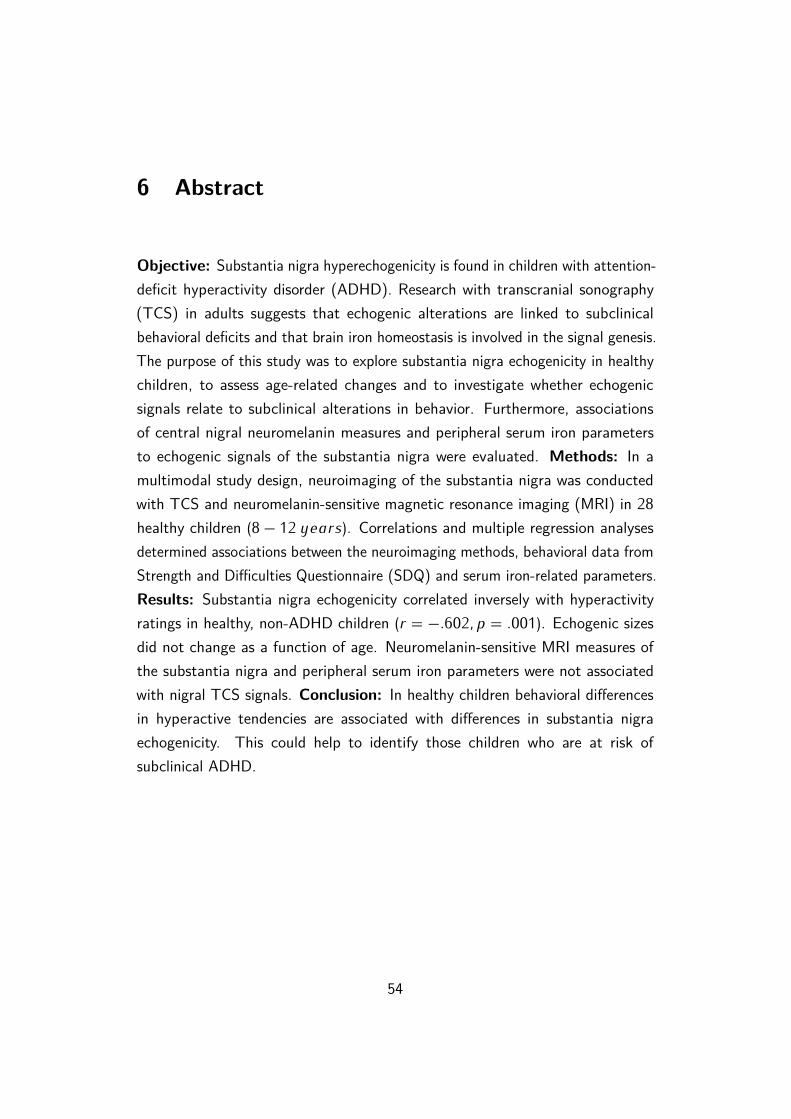
4 DiscussionTCS has proven to be a useful, inexpensive and flexible tool in the assessment ofmovement disorders. Yet there are very few publications on TCS of the SN inchildren. The purpose of this study was to help establish reference values of theSN in healthy children and to relate SN echogenicity to subclinical alterationsin behavior. Furthermore, associations of peripheral serum iron parameters andcentral nigral neuromelanin measures to TCS signals of the SN were evaluated.And moreover, the question was addressed if neuroimaging signals of the SN showage-related changes.
In adults SN sizes equal to or greater �20 ��2 are considered to be hyper-
echogenic and sizes of �25 ��2 and above are labeled as markedly hyperechogenic
(Walter et al., 2007). Hyperechogenicity is not only found in movement disor-ders but also in about 10% of healthy adults (Berg et al., 1999a; Schweitzeret al., 2007). In children hitherto inconclusive values have been reported. Tohelp establish reference values for children, SN echogenicity was determinedaccording to common guidelines. In this sample, hyperechogenic SN in healthychildren extended from �128 − �210 ��
2 and pronounced hyperechogenicity from�173 − �210 ��
2. Those sizes approximate echogenic sizes of ADHD children(Romanos et al., 2010), hyperechogenic sizes in another data set of healthychildren (Iova et al., 2004) as well as sizes of adults (Walter et al., 2007).Normoechogenicity varied between �043 − �127 ��
2.Nowadays it is widely acknowledged that behaviors exhibit a flowing continuum
from adaptive to non-adaptive and consequently some disorders, amongst othersADHD, should be seen as as dimensional rather than categorical (Coghill &Sonuga-Barke, 2012; Marcus & Barry, 2011). Hence, even if manners are notclinically relevant or pathological, certain phenotypes and di�erences still exist.In healthy adults there is evidence that SN hyperechogenicity is associated withsubclinical alterations in behavior and PD-like symptoms such as motor slowing(Berg et al., 2001b). In an attempt to link SN echogenicity to subclinical behavioral
47
tendencies in healthy children, behavioral screening questionnaires were obtained.As expected there was a significant association between hyperactivity ratingsand SN echogenicity and no statistically relevant association with emotionalproblems, prosocial behavior or problems with peers. Contrary to expectations,SN echogenicity was inversely related to hyperactivity ratings in healthy, non-ADHD children. Children with higher nigral echogenicity showed less “hyperactive”behavior. In other words, hyperactive tendencies were associated with low SNechogenicity. To date there is no clear-cut definition of subclinical and subthresholdforms of ADHD. However, there is substantial evidence that it is a risk factorand that comorbidities of substance abuse, oppositional defiant disorder, conductdisorder, major depression disorder and others are frequent. Moreover, it is acommon condition, point prevalences range from 1−23% (for a systematic reviewsee: Balázs & Keresztény, 2014). Preventive strategies, thorough attention andearly interventions may be crucial for children who are at risk of subthresholdADHD and an echogenic marker could help to identify those children at risk.If confirmed in future studies, nigral echogenicity might be useful also in theassessment of subclinical forms of ADHD.
The findings are intriguing. Nevertheless, the investigation was based onquestionnaires and no actual behavioral data were gathered. Further limiting wasthe exclusive use of parental rating scales and additional external informatione.g. from teachers would increase the accuracy of their ratings. It has beenshown that teachers have more elaborate diagnostic observational skills whenit comes to ADHD rating scales (Kóbor et al., 2012). Besides, while giving agood overview about the overall psychological phenotype and good reliability &validity with other scales, SDQ consists of only 5 hyperactivity items. A moreextensive questionnaire on hyperactivity would conduce to augment the conceptand importantly also allow for the discrimination of the di�erent ADHD subtypesresp. dimensions. Due to the brief and compact questionnaire, discrimination inthe present study was not reasonable.
In the current study, children with less SN echogenicity showed more hy-peractive behavior. Continuing preliminary analyses revealed that children withhyperechogenic SN exhibited indeed significantly less hyperactive behavior thanthose with normoechogenic SN. Although, the latter results are rather explorative,
48
sample sizes were small and outcomes have to be replicated in studies withmore power. In adults SN hyperechogenicity is considered to be a marker fornigrostriatal vulnerability and it is associated with reduced dopaminergic uptakein the striatum (Behnke et al., 2009; Berg et al., 1999a, 2002). Functionalconsiderations of echogenic alterations in healthy and ADHD children have notyet been enlightened. However, if hyperechogenicity in healthy children alsoreflects dopaminergic dysfunction, in the present study there is no evidence thatit is associated with reports of more hyperactive behavioral tendencies. Thus,the question remains if those children with nigral hyperechogenicity show othersubclinical symptoms of dopaminergic disruption.
In the past, upwards and downwards deviations in nigral echogenic sizeshave been associated with certain phenotypes: hypoechogenicity is found inRLS (Godau & Sojer, 2010; Schmidauer et al., 2005) and hyperechogenicityin PD (e.g. Becker et al., 1995; Berg et al., 2008) and ADHD (Krauel et al.,2010; Romanos et al., 2010). There is no clear consensus on the definitionand measurement requirements of hypoechogenicity (Skoloudík & Walter, 2010)and in the current study it has not been further investigated. Nevertheless, thedi�erence in hyperactive behavior might actually narrow down to a di�erencebetween hypoechogenic and hyperechogenic SN. Although to date this remainsspeculation and needs investigation in further studies.
SN echogenicity also correlated significantly with scales on conduct problems.Again the relation was inverse, children with higher SN echogenicity had lowerscores in conduct problems and vice versa. The correlation was rather weak.Nevertheless, SN echogenicity has been related to conduct problems in ADHDchildren before: ADHD children with hyperechogenic SN had significantly lowersymptoms of oppositional defiant disorder than children with normoechogenic SN(Krauel et al., 2010). The authors at that time argued, that there is evidencefor a special ADHD subtype with oppositional defiant disorder/conduct disorder.In any case, comorbidity of ADHD and oppositional defiant disorder or conductdisorder is well known (e.g. Loeber et al., 2000; Noordermeer et al., 2017).The interconnection seems to hold also true for behavioral tendencies in healthychildren, here in this sample hyperactivity ratings and conduct problems weresignificantly positively correlated.
49
Evidence suggests that aberrant free iron deposits and altered iron-handling,such as neuromelanin, are involved in the biophysics which underlie SN hyper-echogenic signals (Berg et al., 1999b, Zecca et al., 2005). Neuromelanin bindsiron, is contained in catecholaminergic neurons in the SN and supposedly has aprotective function - free iron is cytotoxic (Beard & Connor, 2003; Fedorow et al.,2005; Zecca et al., 2002). The blood-brain barrier protects the central nervoussystem from fluctuations in the peripheral system (Beard & Connor, 2003; Singhet al., 2014) and in the present study, SN echogenicity could not be predicted byperipheral iron status. Furthermore, SN echogenicity did not show an associationwith MRI neuromelanin measures of the SN, neither with volumetric measures,nor with intensity measures. Hence, the results seem to be in contrast to thehypothesis that SN hyperechogenicity is a marker for neuromelanin depletion.Unfortunately, only neuromelanin-related data were obtained and failure to detectany correlations between the two imaging methods might be also related to thelack of central iron measures. Previous histological research found a relationbetween neuromelanin and SN echogenicity only in multivariate analyses whencerebral iron levels were accounted for as well. Associations of neuromelaninand iron with SN echogenicity are antagonistic and in addition neuromelaninstores iron. Increased echogenicity is then related to neuromelanin depletion andiron overload (Zecca et al., 2005). Future research addressing the nature of SNechogenic signals should include both iron-sensitive MRI measures as well asneuromelanin-sensitive MRI data to approach this question in vivo. Besides, ironlevels might also influence neuromelanin signal acquisition with MRI. It has beenproposed that iron can disguise neuromelanin MRI signals of the SN, especiallyif neuromelanin levels are low and that therefore SN iron indices should alsobe investigated. Disproportional high iron concentrations might saturate theMRI signal and thereby mask neuromelanin signals (Sasaki et al., 2006). Lownigral neuromelanin contents are found in PD patients but also in young children.Again, for precise approximation of neuromelanin tissue content, iron-relatedMRI measures should be obtained in addition. Importantly, it has been discussedthat in ADHD children SN hyperechogenicity might have other morphologicalaspects than those proposed for adults and PD. Instead of aberrant central ironhomeostasis, a developmental delay and altered functional connectivity have been
50
considered as possible structural candidates. Increased tissue density might thenlead to the TCS signal changes that have been observed in ADHD (Drepper et al.,2017). This is further supported by the notion that ADHD children show in factreduced - but not elevated - central iron indices (Adisetiyo et al., 2014; Corteseet al., 2012) and ADHD has repeatedly been related to a maturational delay inseveral central regions (e.g. Rubia, 2007; Vaidya, 2012). Consequently, alteredstructural maturation might be involved in childhood hyperechogenicity in generaland could be another plausible explanation for the failure to detect associationswith neuromelanin within this study. Alternative hypotheses concerning potentialcauses for SN hyperechogenicity, such as neuronal cell death, aberrant tissuecomposition and others, have been outlined and critically evaluated elsewhere(Double, Todd & Duma, 2010). Clearly, more research is warranted in order toelucidate this topic and comparative studies of di�erent age groups and might beparticularly useful.
A shortcoming of the study design clearly was the age-range (8 − 12)�There was no significant association between SN echogenic signals and agein this sample. Although in fact it is possible that age does not influence SNechogenicity, to profoundly assess age-related changes in nigral signals the agerange was too narrow, especially with a small sample size and most of thechildren e�ectively being aged between 9 − 11. Previously, increases (Hagenah etal., 2010, Berg et al., 1999a) or decreases (Iova et al. 2004) of SN echogenicitywith age have been found only in studies with broader age ranges. In this currentstudy, sonographic neuroimaging of the SN was positively correlated with age,although it did not reach statistical significance. This supports the hypothesis,that echogenic characteristics might develop very early in life and that changesafterwards are subtle (Berg et al., 1999a, Berg et al., 2001b). Also in the lightof altered brain iron mechanisms as potential biophysical correlates of nigralechogenicity, developmental changes in SN echogenicity of children are expected.Nigral iron concentrations increase with normal ageing from 20 ��/�� in thefirst year to 100 − 200 ��/�� in late adolescence & early adulthood (Zeccaet al., 2001). Histological studies (Zecca et al., 2001; Zucca et al., 2006) aswell as neuroimaging studies (Xing, 2018) have shown that nigral neuromelanincontent increases with age as well. Within the first two decades of life increments
51
from below-detection-limits to 1000 ��/�� have been reported (Zecca et al.,2001). SN hyperechogenicity is considered to be a trait marker, that developsearly (Berg et al., 1999a). This is further corroborated by the finding of thisstudy: even in young children hyperechogenic SN sizes, that approximateadult sizes, are observed. However, to adequately map the developmentalchanges in SN echogenic signals a broad age range is necessary to capture theemergence of individual di�erences in SN echogenicity. The cross-sectionaldesign further confines the interpretability. In general longitudinal designs aredesirable to pursue questions regarding developmental changes and to detectpossible developmental di�erences. Most of the specific limitations of this studyhave already been discussed and what remains are some general issues. Samplesize was small, accordingly results have to be replicated in studies with morepower. Inherent in the nature of correlational designs, causal inferences cannotbe made. Consequently, all results have to be seen as associations and not ascause or consequence. Another obvious pitfall is that TCS image acquisition andmeasurement of structures critically depend on the investigators’ expertise andare to some degree also a subjective measure. Additionally, image resolution canbe a problem, sometimes pictures are blurry and it can be di�cult to distinguishbetween signal and noise. Nevertheless, interrater reliability in this samplewas good and suggests su�cient consistency and objectivity of the measurements.
Conclusion TCS is a convenient tool to quickly assess subcortical structures andit might be useful in longitudinal designs that investigate midbrain developmentalchanges in children. The origins of the echogenic signals in children hithertohave not yet been clarified, combined MRI imaging methods could be valuablefor further in-vivo investigation. Dopaminergic deficits are of great clinical andscientific interest and it is an intriguing question if SN hyperechogenicity in healthychildren maps nigrostriatal dysfunction. Interestingly, there is preliminary evidencethat also in healthy children behavioral di�erences in hyperactive tendencies areassociated with di�erences in substantia nigra echogenicity and TCS seems apromising tool to help identify children at risk of subclinical ADHD. Future studiesare required to consolidate the findings.
52
5 Appendix
TCS SN (��2) Contrast_SN SN Volume (��
3) Age (years)
Pearson Correlation TCS SN (��2) 1.000 -.213 .213 .296
Contrast_SN -.213 1.000 .217 .317
SN Volume (��3) .213 .217 1.000 .279
Age (years) .296 .317 .279 1.000
Sig. (1-tailed) TCS SN (��2) .148 .148 .071
Contrast_SN .148 .143 .057
SN Volume (��3) .148 .143 .084
Age (years) .071 .057 .084
Table 7: Correlation matrix for neuroimaging parameters and age.
TCS SN (��2) Iron (µg/dl) Ferritin (µg/l) Transferrin (mg/dl) TSAT (%)
Pearson Correlation TCS SN (��2) 1.000 .043 -.297 .030 .016
Iron (µg/dl) .043 1.000 .213 -.497 .957
Ferritin (µg/l) -.297 .213 1.000 -.291 .261
Transferrin (mg/dl) .030 -.497 -.291 1.000 -.702
TSAT (%) .016 .957 .261 -.702 1.000
Sig. (1-tailed) TCS SN (��2) .425 .090 .448 .473
Iron (µg/dl) .425 .170 .009 .000
Ferritin (µg/l) .090 .170 .095 .120
Transferrin (mg/dl) .448 .009 .095 .000
TSAT (%) .473 .000 .120 .000
Table 8: Correlation matrix for serum iron parameters.
53
6 Abstract
Objective: Substantia nigra hyperechogenicity is found in children with attention-deficit hyperactivity disorder (ADHD). Research with transcranial sonography(TCS) in adults suggests that echogenic alterations are linked to subclinicalbehavioral deficits and that brain iron homeostasis is involved in the signal genesis.The purpose of this study was to explore substantia nigra echogenicity in healthychildren, to assess age-related changes and to investigate whether echogenicsignals relate to subclinical alterations in behavior. Furthermore, associationsof central nigral neuromelanin measures and peripheral serum iron parametersto echogenic signals of the substantia nigra were evaluated. Methods: In amultimodal study design, neuroimaging of the substantia nigra was conductedwith TCS and neuromelanin-sensitive magnetic resonance imaging (MRI) in 28healthy children (8 − 12 �����). Correlations and multiple regression analysesdetermined associations between the neuroimaging methods, behavioral data fromStrength and Di�culties Questionnaire (SDQ) and serum iron-related parameters.Results: Substantia nigra echogenicity correlated inversely with hyperactivityratings in healthy, non-ADHD children (� = −�602� � = �001). Echogenic sizesdid not change as a function of age. Neuromelanin-sensitive MRI measures ofthe substantia nigra and peripheral serum iron parameters were not associatedwith nigral TCS signals. Conclusion: In healthy children behavioral di�erencesin hyperactive tendencies are associated with di�erences in substantia nigraechogenicity. This could help to identify those children who are at risk ofsubclinical ADHD.
54
7 Bibliography
1. Aaslid, R., Markwalder, TM., & Nornes, H. (1982). Noninvasive transcranialDoppler ultrasound recording of flow velocity in basal cerebral arteries. JNeurosurg. 57, 769-74.
2. Adisetiyo, V., & Helpern, JA. (2015). Brain iron: a promising noninvasivebiomarker of attention-deficit/hyperactivity disorder that warrants furtherinvestigation. Biomark Med. 9, 403-6.
3. Adisetiyo, V., Jensen, JH., Tabesh, A., Deardor�, RL., Fieremans, E., DiMartino, A., Gray, KM., Castellanos, FX., & Helpern, JA. (2014). Multi-modal MR imaging of brain iron in attention deficit hyperactivity disorder:a noninvasive biomarker that responds to psychostimulant treatment? Ra-diology. 272, 524-32.
4. Allen, RP., & Earley, CJ. (2007). The role of iron in restless legs syndrome.Mov Disord. 22, Suppl 18, 440-8.
5. Allen, RP., Barker, PB., Wehrl, F., Song, HK., & Earley, CJ. (2001).MRI measurement of brain iron in patients with restless legs syndrome.Neurology. 56, 263-265.
6. Badgaiyan, RD., Sinha, S., Sajjad, M., & Wack, DS. (2015). AttenuatedTonic and Enhanced Phasic Release of Dopamine in Attention DeficitHyperactivity Disorder. PLoS One. 10, e0137326.
7. Balázs, J., & Keresztény, A. (2014). Subthreshold attention deficit hyper-activity in children and adolescents: a systematic review. Eur Child AdolescPsychiatry. 23, 393-408.
8. Bear, M. F., Connors, B. W., & Paradiso, M. A. (2007). Neuroscience:Exploring the brain (3rd ed.). Philadelphia, PA, US: Lippincott Williams &Wilkins Publishers.
55
9. Beard J., & Connor, J. (2003). Iron status and neural functioning. AnnRev Nutr. 23, 41–58.
10. Becker, G., & Berg, D. (2001). Neuroimaging in basal ganglia disorders:Perspectives for transcranial ultrasound. Movement disorders. 16, 23–32.
11. Becker, G., Bogdahn, U., Strassburg, HM., Lindner, A., Hassel, W., Meixens-berger, J., & Hofmann, E. (1994a). Identification of ventricular enlargementand estimation of intracranial pressure by transcranial color-coded real-timesonography. J Neuroimaging. 4, 17-22.
12. Becker, G., Krone, A., Koulis, D., Lindner, A., Hofmann, E., Roggendorf,W., & Bogdahn, U. (1994b). Reliability of transcranial colour-coded real-time sonography in assessment of brain tumours: correlation of ultrasound,computed tomography and biopsy findings. Neuroradiology. 36, 585-90.
13. Becker, G., Perez, J., Krone, A., Demuth, K., Lindner, A., Hofmann, E.,Winkler, J., & Bogdahn, U. (1992). Transcranial color-coded real-timesonography in the evaluation of intracranial neoplasms and arteriovenousmalformations. Neurosurgery. 31, 420-8.
14. Becker, G., Seufert, J., Bogdahn, U., Reichmann, H., & Reiners, K. (1995).Degeneration of substantia nigra in chronic Parkinson’s disease visualizedby transcranial color-coded real-time sonography. Neurology. 45, 182-4.
15. Behnke, S., Schroeder, U., Dillmann, U., Buchholz, HG., Schreckenberger,M., Fuss, G., Reith, W., Berg, D., & Krick, CM. (2009). Hyperechogenicityof the substantia nigra in healthy controls is related to MRI changes andto neuronal loss as determined by F-Dopa PET. Neuroimage. 47, 1237-43.
16. Berg, D., Becker, G., Zeiler, B., Tucha, O., Hofmann, E., Preier, M., Benz,P., Jost, W., Reiners, K., & Lange, KW. (1999a). Vulnerability of thenigrostriatal system as detected by transcranial ultrasound. Neurology. 53,1026-31.
17. Berg, D., Godau, J., & Walter, U. (2008). Transcranial sonography inmovement disorders. The Lancet Neurology. 7, 1044-1055.
56
18. Berg, D., Grote, C., Rausch, WD., Mäurer, M., Wesemann, W., Riederer,P., & Becker, G. (1999b). Iron accumulation in the substantia nigra in ratsvisualized by ultrasound. Ultrasound Med Biol. 25, 901-4.
19. Berg, D., Jabs, B., Merschdorf, U., Beckmann, H., & Becker, G. (2001a).Echogenicity of substantia nigra determined by transcranial ultrasoundcorrelates with severity of parkinsonian symptoms induced by neuroleptictherapy. Biol Psychiatry. 50, 463-7.
20. Berg, D., Merz, B., Reiners, K., Naumann, M., & Becker, G. (2005).Five-year follow-up study of hyperechogenicity of the substantia nigra inParkinson’s disease. Mov Disord. 20, 383-5.
21. Berg, D., Roggendorf, W., Schröder, U., Klein, R., Tatschner, T., Benz, P.,Tucha, O., Preier, M., Lange, KW., Reiners, K., Gerlach, M., & Becker, G.(2002). Echogenicity of the substantia nigra: association with increased ironcontent and marker for susceptibility to nigrostriatal injury. Arch Neurol.59, 999-1005.
22. Berg, D., Siefker, C., Ruprecht-Dörfler, P., & Becker G. (2001b). Relation-ship of substantia nigra echogenicity and motor function in elderly subjects.Neurology. 56, 13-7.
25. Bouwmans, AE., Vlaar, AM., Mess, WH., Kessels, A., & Weber, WE. (2013).Specificity and sensitivity of transcranial sonography of the substantia nigrain the diagnosis of Parkinson’s disease: prospective cohort study in 196patients. BMJ Open. 3.
26. Cattell, RB. (1963). Theory of fluid and crystallized intelligence: A criticalexperiment. Journal of Educational Psychology. 54, 1-22.
57
27. Caslake, R., Moore, JN., Gordon, JC., Harris, CE., & Counsell, C. (2008).Changes in diagnosis with follow-up in an incident cohort of patients withparkinsonism. J Neurol Neurosurg Psychiatry. 79, 1202-7.
28. Coghill, D,. & Sonuga-Barke, EJS. (2012) Annual research review: cate-gories versus dimensions in the classification and conceptualisation of childand adolescent mental disorders—implications of recent empirical study. JChild Psychol Psychiatry 53, 469–489.
29. Connor, JR., Boyer, PJ., Menzies, SL., Dellinger, B., Allen, RP., Ondo, WG.,& Earley. CJ. (2003). Neuropathological examination suggests impairedbrain iron acquisition in restless legs syndrome. Neurology. 61, 304-9.
30. Cortese, S., Azoulay, R., Castellanos, FX., Chalard, F., Lecendreux,M., Chechin, D., Delorme, R., Sebag, G., Sbarbati, A., Mouren, MC.,Bernardina, BD., & Konofal, E. (2012). Brain iron levels in attention-deficit/hyperactivity disorder: a pilot MRI study. World J Biol Psychiatry.13, 223-31.
31. Dashti, M., & Chitsaz, A. (2014). Hallervorden-Spatz disease. Adv BiomedRes. 3, 191.
32. Del Campo, N., Chamberlain, SR., Sahakian, BJ., & Robbins, TW. (2011).The roles of dopamine and noradrenaline in the pathophysiology and treat-ment of attention-deficit/hyperactivity disorder. Biol Psychiatry. 69, 145-57.
33. Dexter, DT., Wells, FR., Lees, AJ., Agid, F., Agid, Y., Jenner, P., &Marsden, CD. (1989). Increased nigral iron content and alterations in othermetal ions occurring in brain in Parkinson’s disease. J Neurochem. 52,1830-6.
34. Double, KL., Todd, G., & Duma, SR. (2010). Pathophysiology of tran-scranial sonography signal changes in the human substantia nigra. In D.Berg & U. Walter (Eds.), Transcranial sonography in Movement disorders,International Review of Neurobiology. 90, 107-120.
58
35. Dörner, K. (2009). Klinische Chemie und Hämatologie (7th ed.). Stuttgart,Germany: Georg Thieme Verlag.
36. Dössel, O. (2016). Bildgebende Verfahren in der Medizin (2nd ed.). Hei-delberg, Germany: Springer Verlag.
37. Donfrancesco, R., Parisi, P., Vanacore, N., Martines, F., Sargentini, V., &Cortese, S. (2013). Iron and ADHD: time to move beyond serum ferritinlevels. J Atten Disord. 17, 347-57.
38. Drepper, C., Gei�ler, J., Pastura, G., Yilmaz, R., Berg, D., Romanos, M.,& Gerlach, M. (2017). Transcranial sonography in psychiatry as a potentialtool in diagnosis and research. World J Biol Psychiatry. 1-13.
39. Earley, CJ., Connor, JR., Beard, JL., Malecki, EA., Epstein, DK., & Allen,RP. (2000). Abnormalities in CSF concentrations of ferritin and transferrinin restless legs syndrome. Neurology. 54, 1698–1700.
40. Fedorow, H., Tribl, F., Halliday, G., Gerlach, M., Riederer, P., & Double,KL. (2005). Neuromelanin in human dopamine neurons: comparison withperipheral melanins and relevance to Parkinson’s disease. Prog Neurobiol.75, 109-24.
41. Field, A. (2005). Discovering Statistics Using SPSS (2nd ed.). London,UK: SAGE Publications.
42. Gaenslen, A., & Berg, D. (2010). Early Diagnosis of Parkinson’s Disease.In D. Berg & U. Walter (Eds.), Transcranial sonography in Movementdisorders, International Review of Neurobiology. 90, 82-92. Transcranialsonography in Movement disorders,
43. Gaenslen, A., Unmuth, B., Godau, J., Liepelt, I., Di Santo, A., Schweitzer,KJ., Gasser, T., Machulla, HJ., Reimold, M., Marek, K., & Berg, D. (2008).The specificity and sensitivity of transcranial ultrasound in the di�erentialdiagnosis of Parkinson’s disease: a prospective blinded study. Lancet Neurol.7, 417-24.
59
44. Gazzaniga, MS., Ivry, RB., & Mangun, GR. (2009). Cognitive neuroscience:The biology of the mind (3rd ed.). New York: W.W. Norton.
45. Gerlach, M., Ben-Shachar, D., Riederer, P., & Youdim, MB. 1994. Alteredbrain metabolism of iron as a cause of neurodegenerative diseases? JNeurochem. 63, 793-807.
46. Godau, J., & Sojer, M. (2010). Transcranial Sonography in Restless LegsSyndrome. In D. Berg & U. Walter (Eds.), Transcranial sonography inMovement disorders, International Review of Neurobiology. 90, 199-215.
47. Götz, ME., Double, K., Gerlach, M., Youdim, MB., & Riederer, P. 2004.The relevance of iron in the pathogenesis of Parkinson’s disease. Ann N YAcad Sci. 1012, 193-208.
48. Goodman, R. (1997). The Strengths and Di�culties Questionnaire: AResearch Note. Journal of Child Psychology and Psychiatry. 38, 581-586.
49. Hagenah, J., König, IR., Sperner, J., Wessel, L., Seidel, G., Condefer, K.,Saunders-Pullman, R., Klein, C., & Brüggemann, N. (2010). Life-longincrease of substantia nigra hyperechogenicity in transcranial sonography.Neuroimage. 51, 28-32.
50. Hayes, A. (2012). PROCESS, version 3.1 [software]. Department ofPsychology, Ohio State University, Columbus OH, USA. Available fromhttp://www.processmacro.org
51. Hayes, A. & Cai, L. (2007). Behavior Research Methods, 39, 709-722.
52. Huber, H. (2010). Transcranial Sonography- Anatomy. Int Rev Neurobiol.90, 35-45.
53. Iova, A., Garmashov, A., Androuchtchenko, N., Kehrer, M., Berg, D.,Becker, G., & Garmashov, Y. (2004). Postnatal decrease in substantianigra echogenicity. Implications for the pathogenesis of Parkinson’s disease.J Neurol. 251, 1451-4.
60
54. Joutsa, J., Gardberg, M., Röyttä, M., & Kaasinen, V. (2014). Diagnosticaccuracy of parkinsonism syndromes by general neurologists. ParkinsonismRelat Disord. 20, 840-4.
55. Juneja, M., Jain, R., Singh, V., & Mallika, V. (2010). Iron deficiency inIndian children with attention deficit hyperactivity disorder. Indian Pediatr.47, 955-8.
56. Kim, JY., Kim, ST., Jeon, SH., & Lee, WY. (2007). Midbrain transcranialsonography in Korean patients with Parkinson’s disease. Mov Disord. 22,1922-6.
57. Klasen, H., Woerner, W., Rothenberger, A., & Goodman, R. (2003). Diedeutsche Fassung des Strengths and Di�culties Questionnaire (SDQ-Deu)– Übersicht und Bewertung erster Validierungs- und Normierungsbefunde.Praxis der Kinderpsychologie und Kinderpsychiatrie. 52, 491-502.
58. Kóbor, A., Takács, Á., Urbán, R., & Csépe, V. (2012). The latent classesof subclinical ADHD symptoms: convergences of multiple informant reports.Res Dev Disabil. 33, 1677-89.
59. Koeppen, AH., & Dickson, AC. (2001). Iron in the Hallervorden-Spatzsyndrome. Pedriatic Neurol. 25, 148–155
60. Krauel, K., Feldhaus, HC., Simon, A., Rehe, C., Glaser, M., Flechtner, HH.,Heinze, HJ., & Niehaus, L. (2010). Increased echogenicity of the substan-tia nigra in children and adolescents with attention-deficit/hyperactivitydisorder. Biol Psychiatry. 68, 352-8.
61. Kudo, K . (2006). Perfusion Mismatch Analyzer, version 5.0.5358.55864[software]. Advanced Medical Science Center, Iwate Medical University,Iwate, Japan. Available from http://asist.umin.jp/index-e.htm
62. Lambeck, J., Niesen, WD., Reinhard, M., Weiller, C., Dose, M., & Zucker,B. (2015). Substantia nigra hyperechogenicity in hypokinetic Huntington’sdisease patients. J Neurol. 262, 711-7.
61
63. Liman, J., Wellmer, A., Rostasy, K., Bähr, M., & Kermer, P. (2012).Transcranial ultrasound in neurodegeneration with brain iron accumulation(NBIA). Eur J Paediatr Neurol. 16, 175-8.
64. Loeber, R., Burke, JD., Lahey, BB., Winters, A., & Zera, M. (2000).Oppositional defiant and conduct disorder: a review of the past 10 years,part I.J Am Acad Child Adolesc Psychiatry. 39, 1468-84.
65. Loke, H., Harley, V., & Lee, J. (2015). Biological factors underlying sexdi�erences in neurological disorders. Int J Biochem Cell Biol. 65,139-50.
66. Lücking, CH., Amtage, F., Hummel, S., Hornyak, M., Zucker, B., & Hellwig,B. (2013). Basalganglienerkrankungen. In A. Hufschmidt, C. H. Lücking& S. Rauer (Eds.) Neurologie compact (6th ed., pp. 337-386). Stuttgart,Germany: Georg Thieme Verlag.
67. Mann, DM., & Yates, PO. (1974). Lipoprotein pigments--their relationshipto ageing in the human nervous system. II. The melanin content ofpigmented nerve cells. Brain. 97, 489-98.
68. Marcus, DK., & Barry, TD. (2011) Does attention-deficit/hyperactivitydisorder have a dimensional latent structure? A taxometric analysis. JAbnorm Psychol. 120, 427–442.
69. Mizuno, S., Mihara, T., Miyaoka,T., Inagaki, T., & Horiguchi, J. (2005).CSF iron, ferritin and transferrin levels in restless legs syndrome. J SleepRes. 14. 43-7.
70. Noordermeer, SDS., Luman, M., Greven, CU., Veroude, K., Faraone, SV.,Hartman, CA., Hoekstram PJ., Frankem B., Buitelaar, JK., Heslenfeld,DJ., & Oosterlaan, J. (2017). Structural Brain Abnormalities of Attention-Deficit/Hyperactivity Disorder With Oppositional Defiant Disorder. BiolPsychiatry. 82, 642-650.
71. Ogisu, K., Kudo, K., Sasaki, M., Sakushima, K., Yabe, I., Sasaki, H.,Terae, S., Nakanishi, M., & Shirato H. (2013). 3D neuromelanin-sensitivemagnetic resonance imaging with semi-automated volume measurement
62
of the substantia nigra pars compacta for diagnosis of Parkinson’s disease.Neuroradiology. 55, 719-24.
72. Ohtsuka, C., Sasaki, M., Konno, K., Koide, M., Kato, K., Takahashi, J.,Takahashi, S., Kudo, K., Yamashita, F., & Terayama,Y. (2013). Changes insubstantia nigra and locus coeruleus in patients with early-stage Parkinson’sdisease using neuromelanin-sensitive MR imaging. Neurosci. Lett. 541,93–98.
73. Okawa, M., Miwa,. H., Kajimoto, Y., Hama, K., Morita, S., Nakanishi, I.,& Kondo, T. (2007). Transcranial sonography of the substantia nigra inJapanese patients with Parkinson’s disease or atypical parkinsonism: clinicalpotential and limitations. Intern Med, 46. 1527-31.
74. Oner, P., Oner, O., Azik, FM., Cop, E., & Munir, KM. (2012). Ferritinand hyperactivity ratings in attention deficit hyperactivity disorder. PediatrInt. 54, 688-92.
75. Oner, O., Alkar, OY., & Oner, P. (2008). Relation of ferritin levels withsymptom ratings and cognitive performance in children with attentiondeficit-hyperactivity disorder. Pediatr Int. 50, 40-4.
76. Pedroso, JL., Bor-Seng-Shu, E., Felicio, AC., Braga-Neto, P., Dutra, LA.,de Aquino, CC., Ferraz, HB., do Prado, GF., Teixeira, MJ., & Barsottini,OG. (2012). Severity of restless legs syndrome is inversely correlatedwith echogenicity of the substantia nigra in di�erent neurodegenerativemovement disorders. a preliminary observation. J Neurol Sci. 319, 59-62.
77. Postert, T., Lack, B., Kuhn, W., Jergas, M., Andrich, J., Braun, B.,Przuntek, H., Sprengelmeyer, R., Agelink, M., & Büttner, T. (1999). Basalganglia alterations and brain atrophy in Huntington’s disease depicted bytranscranial real time sonography. J Neurol Neurosurg Psychiatry. 67,457-62.
78. Qiu, A., Crocetti, D., Adler, M., Mahone, EM., Denckla, MB., Miller, MI.,& Mostofsky, SH. (2009). Basal ganglia volume and shape in children withattention deficit hyperactivity disorder. Am J Psychiatry. 166, 74-82.
63
79. Rasband, WS. (1997). ImageJ [software]. US National Insti-tutes of Mental Health, Bethesda, Maryland, USA. Available fromhttps://imagej.nih.gov/ij/
80. Romanos, M., Weise, D., Schliesser, M., Schecklmann, M., Lö�er, J.,Warnke, A., Gerlach, M., Classen, J., & Mehler-Wex, C. (2010). Struc-tural abnormality of the substantia nigra in children with attention-deficithyperactivity disorder. J Psychiatry Neurosci. 35, 55-8.
81. Rubia, K. (2007). Neuro-anatomic evidence for the maturational delayhypothesis of ADHD. Proc Natl Acad Sci U S A. 104, 19663-4.
82. Ryu, JH., Lee, MS., & Baik, JS. (2011). Sonographic abnormalities inidiopathic restless legs syndrome (RLS) and RLS in Parkinson’s disease.Parkinsonism Relat Disord. 17, 201–203.
83. Sasaki, M., Shibata, E., Tohyama, K., Takahashi, J., Otsuka, K., Tsuchiya,K., Takahashi, S., Ehara, S., Terayama, Y., & Sakai, A. (2006). Neurome-lanin magnetic resonance imaging of locus ceruleus and substantia nigra inParkinson’s disease. Neuroreport. 17, 1215-8.
84. Schmidauer, C., Sojer, M., Seppi, K., Stockner, H., Högl, B., Biedermann,B., Brandauer, E., Peralta, CM., Wenning, GK., & Poewe, W. (2005). Tran-scranial ultrasound shows nigral hypoechogenicity in restless legs syndrome.Ann Neurol. 58, 630-4.
85. Schweitzer, KJ., Behnke, S., Liepelt, I., Wolf, B., Grosser, C., Godau, J.,Gaenslen, A., Bruessel, T., Wendt, A., Abel, F., Müller, A., Gasser, T., &Berg, D. (2007). Cross-sectional study discloses a positive family historyfor Parkinson’s disease and male gender as epidemiological risk factors forsubstantia nigra hyperechogenicity. J Neural Transm. 114, 1167-71.
86. Seymour, KE., Tang X., Crocetti, D., Mostofsky, SH., Miller, MI., & Rosch,KS. (2017). Anomalous subcortical morphology in boys, but not girls,with ADHD compared to typically developing controls and correlates withemotion dysregulation. Psychiatry Res Neuroimaging. 261, 20-28.
64
87. Shaw, P., De Rossi, P., Watson, B., Wharton, A., Greenstein, D., Raznahan,A., Sharp, W., Lerch, JP., & Chakravarty, MM. (2014). Mapping the devel-opment of the basal ganglia in children with attention-deficit/hyperactivitydisorder. J Am Acad Child Adolesc Psychiatry. 53, 780–789.
88. Singh, N., Haldar, S., Tripathi, AK., Horback, K., Wong, J., Sharma, D.,Beserra, A., Suda, S., Anbalagan, C., Dev, S., Mukhopadhyay, CK., &Singh, A. (2014). Brain iron homeostasis: from molecular mechanisms toclinical significance and therapeutic opportunities. Antioxid Redox Signal.20, 1324-63.
89. Skoloudík, D., Fadrná, T., Bártová, P., Langová, K., Ressner, P., Zaple-talová, O., Hlustík, P., Herzig, R., & Kannovsk ,̋ P. (2007). Reproducibilityof sonographic measurement of the substantia nigra. Ultrasound Med Biol.33, 1347-52.
90. Skoloudík, D., & Walter, U. (2010). Method and validity of transcra-nial sonography in movement disorders. In D. Berg & U. Walter (Eds.),Transcranial sonography in Movement disorders, International Review ofNeurobiology. 90, 7-34.
91. Snyder, AM., & Connor, JR. (2009). Iron, the substantia nigra and relatedneurological disorders. Biochim Biophys Acta. 1790, 606-14.
92. Speer, CP. (2013). Neonatologie. In B. Koletzko (Ed.) Kinder- undJugendmedizin (14th ed., pp. 49-105). Heidelberg, Germany: Springer.
93. Spiegel, J., Hellwig, D., Möllers, MO., Behnke, S., Jost, W., Fassbender, K.,Samnick, S., Dillmann, U., Becker, G., & Kirsch, CM. (2006). Transcranialsonography and [123I]FP-CIT SPECT disclose complementary aspects ofParkinson’s disease. Brain. 129, 1188-93.
95. Walter, U. (2012). Transcranial sonography of the cerebral parenchyma:update on clinically relevant applications. Perspectives in Medicine, 1,334–343.
96. Walter, U., Behnke, S., Eyding, J., Niehaus, L., Postert, T., Seidel, G., &Berg, D. (2007). Transcranial brain parenchyma sonography in movementdisorders: state of the art. Ultrasound Med Biol. 33, 15-25.
97. Wei�, R. H. (2006). Grundintelligenztest Skala 2 - Revision - (CFT 20-R).Göttingen: Hogrefe.
98. Woerner, W., Becker, A., Friedrich, C., Klasen, H., Goodman, R., &Rothenberger, A. (2002): Normierung und Evaluation der deutschen Eltern-version des Strengths and Di�culties Questionaire (SDQ): Ergebnisse einerrepräsentativen Felderhebung. Zeitschrift für Kinder- und Jugendpsychiatrieund Psychotherapie. 30, 105-112.
99. Woydt, M., Greiner, K., Perez, J., Becker, G., Krone, A., & Roosen,K. (1996). Transcranial duplex-sonography in intracranial hemorrhage.Evaluation of transcranial duplex-sonography in the diagnosis of spontaneousand traumatic intracranial hemorrhage. Zentralbl Neurochir. 57, 129-35.
100. Xing, Y. (2018). Life span pigmentation changes of the substantia nigradetected by neuromelanin-sensitive MRI. European Congress of Radiology,Vienna, Austria.
101. Zecca, L., Berg, D., Arzberger, T., Ruprecht, P., Rausch, WD., Musicco,M., Tampellini, D., Riederer, P., Gerlach, M., & Becker, G. (2005). Invivo detection of iron and neuromelanin by transcranial sonography: a newapproach for early detection of substantia nigra damage. Mov Disord. 20,1278-85.
102. Zecca, L., Gallorini, M., Schünemann, V., Trautwein, AX., Gerlach, M.,Riederer, P., Vezzoni, P., & Tampellini, D. (2001). Iron, neuromelaninand ferritin content in the substantia nigra of normal subjects at di�erentages: consequences for iron storage and neurodegenerative processes. JNeurochem. 2001, 76, 1766-73.
66
103. Zecca, L., Stroppolo, A., Gatti, A., Tampellini, D., Toscani, M., Gallorini,M., Giaveri, G., Arosio, P., Santambrogio, P., Fariello, RG., Karatekin, E.,Kleinman, MH., Turro, N., Hornykiewicz, O., & Zucca FA. (2004). Therole of iron and copper molecules in the neuronal vulnerability of locuscoeruleus and substantia nigra during aging. Proc Natl Acad Sci U S A.101, 9843-8.
104. Zecca, L., Tampellini, D., Gatti, A., Crippa, R., Eisner, M., Sulzer, D.,Ito, S., Fariello, R., & Gallorini M. (2002). The neuromelanin of humansubstantia nigra and its interaction with metals. J Neural Transm. 109,663–672.
105. Zucca, FA., Bellei, C., Giannelli, S., Terreni, MR., Gallorini, M., Rizzio, E.,Pezzoli, G., Albertini, A., & Zecca, L. (2006). Neuromelanin and iron inhuman locus coeruleus and substantia nigra during aging: consequencesfor neuronal vulnerability. J Neural Transm (Vienna). 113, 757-67.
67
Danksagungen
Herzlichen Dank an Herrn Professor Marcel Romanos für die Überlassung des The-mas, die grosszügige Bereitstellung aller notwendigen Ressourcen, die warmherzigeUnterstützung und konstruktive Kritik. Desweiteren Dank an Herrn Dr. CarstenDrepper, Frau Dr. Susanne Neufang, Frau Dr. Julia Geissler und Frau Dr. Su-YinDang für jedwede Hilfe, sei sie methodologischer, inhaltlicher, organisatorischeroder zwischenmenschlicher Natur. Vielen Dank auch an Anna Reus, die ihre rareZeit in die Korrektur dieser Arbeit gesteckt hat.
Von ganzem Herzen danken, möchte ich zudem meinen Eltern und meinemBruder. Dafür, dass sie mir stets liebend den Rücken frei gehalten haben undnoch immer frei halten. Dafür, dass sie die Liebe zur Medizin und Wissenschaft inmir geweckt und gefördert haben und mich zu jeder Zeit ermuntert haben weiterzu machen. Dafür, dass sie immer aufrichtig und interessiert an meinem Lebenteilhaben. Dafür, dass sie dies alles überhaupt möglich gemacht haben.