Nanomaterials DOI: 10.1002/anie.201105324 Controlled Doping of MS 2 (M = W, Mo) Nanotubes and Fullerene-like Nanoparticles** Lena Yadgarov, Rita Rosentsveig, Gregory Leitus, Ana Albu-Yaron, Alexey Moshkovich, Vladislav Perfilyev, Relja Vasic, AnatolyI. Frenkel, Andrey N. Enyashin, Gotthard Seifert, Lev Rapoport, and Reshef Tenne* Doping of semiconductor nanocrystals and nanowires with minute amounts of foreign atoms plays a major role in controlling their electrical, optical, and magnetic properties. [1] In the case of carbon nanotubes, subsequent doping with oxygen and potassium leads to a p-type and n-type behavior, respectively. [1a–c] In another work, VO x nanotubes were transformed from spin-frustrated semiconductors to ferro- magnets by doping with either electrons or holes. [2] Calculations indicated that n- and p-type doping of multiwall MoS 2 nanotubes (INT) could be accomplished by substituting minute amounts of the Mo lattice atoms with either Nb [3] (p-type) and Re [4] (n-type), respectively. Substi- tuting (< 0.1 at %) molybdenum by rhenium atoms [5] and sulfur by halogen atoms [6] was shown to produce n-type conductivity in MoS 2 crystals. To synthesize rhenium-doped nanoparticles (NP) and nanotubes both in situ and subsequent doping methods were used. Figure 1a shows the quartz reactor used for in situ synthesis of rhenium doped MoS 2 NP with fullerene-like structure (Re:IF-MoS 2 ). The formal Re concentration was varied from 0.02 to 0.7 at%. The precursor Re x Mo 1Àx O 3 (x < 0.01) powder was prepared in a specially designed auxiliary reactor (see Supporting Information). Evaporation of this powder takes place in area 1 at 770 8C (Figure 1a). The oxide vapor reacts with hydrogen gas in area 2 (Figure 1 a) at 800 8C which leads to a partial reduction of the vapor and its condensation into Re-doped MoO 3Ày nanoparticles. The resulting NP react with H 2 /H 2 S gas in area 3 at 810–820 8C to produce reduced oxide nanoparticles engulfed with a few closed layers of Re:MoS 2 , which protect it against ripening into bulk 2H-MoS 2 . [7] To complete this oxide to sulfide conversion a long (25–35 h) annealing process at 870 8C in the presence of H 2 S and forming gas (H 2 10 wt %; N 2 ) was performed. At the end of this diffusion-controlled process a powder of Re-doped MoS 2 NP with a fullerene-like (IF) structure (Re:IF-MoS 2 ) was obtained. In addition, doping of IF-WS 2 NP and INT-WS 2 was subsequently carried out by heating the pre-prepared IF/INT in an evacuated quartz ampoule also containing ReO 3 , or ReCl 3 and iodine. In the case of ReCl 3 , both the rhenium and the chlorine atoms (substitution to sulfur atoms) served as n- type dopants. Typical high-resolution scanning electron microscopy (HRSEM) and transmission electron microscopy (HRTEM) micrographs of the Re-doped fullerene-like NP are shown in Figure 1 b. The Re:IF-MoS 2 consists of about 30 closed (concentric) MoS 2 layers. No impurity, such as oxides, or platelets (2 H) of MoS 2 could be found in the product powder. The line profile and the Fourier analyses (FFT) (inset of Figure 1 b) show an interlayer spacing of 0.627 nm (doped). Furthermore, the layers seem to be evenly folded and closed with very few defects and cusps, demonstrating the Re-doped NP to be quite perfectly crystalline. HRTEM did not reveal any structural changes even for the samples with high Re concentration (0.71 at %). However, owing to its quasi- spherical shape and size, this analysis cannot completely rule-out the presence of a small amount of the ReS 2 phase in the IF NP. Figure 1c shows a typical TEM image of Re(Cl) (post synthesis) doped multiwall WS 2 nanotube. There is no [*] L. Yadgarov, Dr. R. Rosentsveig, Dr. A. Albu-Yaron, Prof. R. Tenne Department of Materials and Interfaces, Weizmann Institute Rehovot 76100 (Israel) E-mail: [email protected]Dr. G. Leitus Department of Chemical Research Support, Weizmann Institute Rehovot 76100 (Israel) Dr. A. Moshkovich,Dr. V. Perfilyev, Prof. L. Rapoport Department of Science, Holon Institute of Technology P.O. Box 305, 52 Golomb St., Holon 58102 (Israel) Dr. R. Vasic, Prof. A. I. Frenkel Department of Physics, Yeshiva University 245 Lexington Ave, New York, NY 10016 (USA) Dr. A. N. Enyashin Institute of Solid State Chemistry UB RAS Pervomayskaya Str., 91, 620990 Ekaterinburg (Russia) Prof. Dr. G. Seifert Physikalische Chemie, Technische UniversitȨt Dresden Bergstrasse, 66b, 01062 Dresden (Germany) [**] We are grateful to the help of R. Popovitz-Biro (HRTEM/EELS), Hilla Friedman (SEM/EDS), Y. Feldman (XRD), H. Cohen and T. Bendikov (XPS), S.R. Cohen (AFM), and Y. Tsverin (some of the conductivity measurements). R.T. gratefully acknowledges the support of ERC project INTIF 226639, the Israel Science Foundation, AddNano project 229284 of the FP7 (EU) program (late tribological meas- urements), the Harold Perlman Foundation, and the Irving and Cherna Moskowitz Center for Nano and Bio-Nano Imaging. R.T. is the Drake Family Chair in Nanotechnology and director of the Helen and Martin Kimmel Center for Nanoscale Science; A.I.F. and R.V. acknowledge support by the U.S. Department of Energy (DOE) Grant No. DE-FG02-03ER15476. Use of the NSLS was supported by the U.S. DOE Grant No. DE-AC02-98CH10886. Beamlines X18B and X19A at the NSLS are supported in part by the Synchrotron Catalysis Consortium, U. S. DOE Grant No DE-FG02-05ER15688. Supporting information for this article is available on the WWW under http://dx.doi.org/10.1002/anie.201105324. . Angewandte Communications 1148 # 2012 Wiley-VCH Verlag GmbH & Co. KGaA, Weinheim Angew. Chem. Int. Ed. 2012, 51, 1148 –1151
Transcript
NanomaterialsDOI: 10.1002/anie.201105324
Controlled Doping of MS2 (M = W, Mo) Nanotubes and Fullerene-likeNanoparticles**Lena Yadgarov, Rita Rosentsveig, Gregory Leitus, Ana Albu-Yaron, Alexey Moshkovich,Vladislav Perfilyev, Relja Vasic, Anatoly I. Frenkel, Andrey N. Enyashin, Gotthard Seifert,Lev Rapoport, and Reshef Tenne*
Doping of semiconductor nanocrystals and nanowires withminute amounts of foreign atoms plays a major role incontrolling their electrical, optical, and magnetic properties.[1]
In the case of carbon nanotubes, subsequent doping withoxygen and potassium leads to a p-type and n-type behavior,respectively.[1a–c] In another work, VOx nanotubes weretransformed from spin-frustrated semiconductors to ferro-magnets by doping with either electrons or holes.[2]
Calculations indicated that n- and p-type doping ofmultiwall MoS2 nanotubes (INT) could be accomplished bysubstituting minute amounts of the Mo lattice atoms witheither Nb[3] (p-type) and Re[4] (n-type), respectively. Substi-tuting (< 0.1 at%) molybdenum by rhenium atoms[5] and
sulfur by halogen atoms[6] was shown to produce n-typeconductivity in MoS2 crystals.
To synthesize rhenium-doped nanoparticles (NP) andnanotubes both in situ and subsequent doping methods wereused. Figure 1a shows the quartz reactor used for in situsynthesis of rhenium doped MoS2 NP with fullerene-likestructure (Re:IF-MoS2). The formal Re concentration wasvaried from 0.02 to 0.7 at%. The precursor RexMo1�xO3 (x<0.01) powder was prepared in a specially designed auxiliaryreactor (see Supporting Information). Evaporation of thispowder takes place in area 1 at 770 8C (Figure 1 a). The oxidevapor reacts with hydrogen gas in area 2 (Figure 1a) at 800 8Cwhich leads to a partial reduction of the vapor and itscondensation into Re-doped MoO3�y nanoparticles. Theresulting NP react with H2/H2S gas in area 3 at 810–820 8Cto produce reduced oxide nanoparticles engulfed with a fewclosed layers of Re:MoS2, which protect it against ripeninginto bulk 2H-MoS2.
[7] To complete this oxide to sulfideconversion a long (25–35 h) annealing process at 870 8C in thepresence of H2S and forming gas (H2 10 wt %; N2) wasperformed. At the end of this diffusion-controlled process apowder of Re-doped MoS2 NP with a fullerene-like (IF)structure (Re:IF-MoS2) was obtained.
In addition, doping of IF-WS2 NP and INT-WS2 wassubsequently carried out by heating the pre-prepared IF/INTin an evacuated quartz ampoule also containing ReO3, orReCl3 and iodine. In the case of ReCl3, both the rhenium andthe chlorine atoms (substitution to sulfur atoms) served as n-type dopants.
Typical high-resolution scanning electron microscopy(HRSEM) and transmission electron microscopy (HRTEM)micrographs of the Re-doped fullerene-like NP are shown inFigure 1b. The Re:IF-MoS2 consists of about 30 closed(concentric) MoS2 layers. No impurity, such as oxides, orplatelets (2 H) of MoS2 could be found in the product powder.The line profile and the Fourier analyses (FFT) (inset ofFigure 1b) show an interlayer spacing of 0.627 nm (doped).Furthermore, the layers seem to be evenly folded and closedwith very few defects and cusps, demonstrating the Re-dopedNP to be quite perfectly crystalline. HRTEM did not revealany structural changes even for the samples with high Reconcentration (0.71 at%). However, owing to its quasi-spherical shape and size, this analysis cannot completelyrule-out the presence of a small amount of the ReS2 phase inthe IF NP. Figure 1c shows a typical TEM image of Re(Cl)(post synthesis) doped multiwall WS2 nanotube. There is no
[*] L. Yadgarov, Dr. R. Rosentsveig, Dr. A. Albu-Yaron, Prof. R. TenneDepartment of Materials and Interfaces, Weizmann InstituteRehovot 76100 (Israel)E-mail: [email protected]
Dr. G. LeitusDepartment of Chemical Research Support, Weizmann InstituteRehovot 76100 (Israel)
Dr. A. Moshkovich, Dr. V. Perfilyev, Prof. L. RapoportDepartment of Science, Holon Institute of TechnologyP.O. Box 305, 52 Golomb St., Holon 58102 (Israel)
Dr. R. Vasic, Prof. A. I. FrenkelDepartment of Physics, Yeshiva University245 Lexington Ave, New York, NY 10016 (USA)
Dr. A. N. EnyashinInstitute of Solid State Chemistry UB RASPervomayskaya Str., 91, 620990 Ekaterinburg (Russia)
Prof. Dr. G. SeifertPhysikalische Chemie, Technische Universit�t DresdenBergstrasse, 66b, 01062 Dresden (Germany)
[**] We are grateful to the help of R. Popovitz-Biro (HRTEM/EELS), HillaFriedman (SEM/EDS), Y. Feldman (XRD), H. Cohen and T. Bendikov(XPS), S. R. Cohen (AFM), and Y. Tsverin (some of the conductivitymeasurements). R.T. gratefully acknowledges the support of ERCproject INTIF 226639, the Israel Science Foundation, AddNanoproject 229284 of the FP7 (EU) program (late tribological meas-urements), the Harold Perlman Foundation, and the Irving andCherna Moskowitz Center for Nano and Bio-Nano Imaging. R.T. isthe Drake Family Chair in Nanotechnology and director of the Helenand Martin Kimmel Center for Nanoscale Science; A.I.F. and R.V.acknowledge support by the U.S. Department of Energy (DOE)Grant No. DE-FG02-03ER15476. Use of the NSLS was supported bythe U.S. DOE Grant No. DE-AC02-98CH10886. Beamlines X18B andX19A at the NSLS are supported in part by the Synchrotron CatalysisConsortium, U. S. DOE Grant No DE-FG02-05ER15688.
Supporting information for this article is available on the WWWunder http://dx.doi.org/10.1002/anie.201105324.
distinction between this image and a typical TEM micrographof pristine WS2 nanotubes.
The Re concentration in the IF/INT was determined byinductive coupled plasma mass spectrometry (ICP-MS). Forthe Re-doped IF/INT-WS2 the level of Re doping varied
between approximately 0.07–0.5 at% depending on theloading of the dopant, the temperature, and duration of theprocess. For the Re:IF-MoS2 the Re level was found toincrease with the formal ReO3 content of the oxide powderand varied to some extent from one measurement to the other(three measurements for each Re concentration). Theseresults suggested some non-uniformity in the doping level ofthe NP. Roughly speaking, the average Re concentration inthe IF-MoS2 powder was found to be about 1/3 to 1/2 of theformal (weighted) concentration in the oxide precursor. Thusin a typical nanoparticle consisting of about 5–7 � 105 Moatoms, there are on the average about 200–300 Re atoms (inthe 0.12 at% sample).
X-ray absorption fine structure (XAFS) measurementswere performed to determine the dopant locations bychecking the local structure around the Re atoms. Dataprocessing and analysis of the raw X-ray absorption near edgestructure (XANES) and extended XAFS (EXAFS) data wereperformed for IF-MoS2, Re:IF-MoS2 (0.12 and 0.71 at%).The Fourier transform magnitude of the data collected at theRe L3 edge (Figure 2a) demonstrates distinct differencesbetween the atomic arrangements of the Re-doped IFsamples and bulk ReS2. A theoretical model was constructedby replacing the X-ray-absorbing Mo atom in the MoS2
structure by Re and using FEFF6 program to calculate thetheoretical EXAFS contribution to Re from the first (Re–S)and second (Re–Mo) coordination shells. The good fitbetween the theoretical and experimental curves for the0.12 at% sample (Figure 2b) support the substitution modelfor the dopant (ReMo).
Pure ReS2 has a small Re–S first peak owing to the largefirst-shell disorder. Thus the larger peak intensity of the0.12 at% Re compared to the 0.71 at% (Figure 2a) is
Figure 1. a) Modified quartz reactor used for the synthesis of theRe:IF-MoS2 NP with the temperature profile shown along the reactor(z) axis, on the left, see text for details. b) HRSEM and HRTEM (inset)images of a typical Re(0.12 at%):IF-MoS2 NP. The interlayer spacing asshown by the line profile of Re:IF-MoS2 (0.627 nm) coincides with thatof the undoped IF-MoS2. c) HRTEM image of a post-synthesis Re-doped INT-WS2.
Figure 2. Fourier transform magnitudes of the EXAFS spectra of theRe L3 edge for: a) Two Re-doped IF samples (0.12 at% red,0.71 at% Re blue) and the ReS2 (green) reference. b) Raw data (red)and theoretical fit (black) of the Re L3 edge data in the 0.12 at%sample.
consistent with the 0.71 at% sample containing a small sub-mixture of ReS2 phase. These differences are also manifestedby the interatomic distances for the different bonds betweenRe, S, and Mo obtained by the data analysis (Table 1).Additional detailed descriptions of the measurements anddata analysis are presented in the Supporting Information.The first-shell disorder in the ReS2 lattice reflects the fact that
there are two inequivalent Re sites, where the Re–S distancesrange from 2.31 to 2.50 �. This is not the case for the Mo–Mo(or ReMo–Mo) in the MoS2 lattice which has sixfold degen-erate Mo�S bonds of 2.43 � in length. Therefore, the XAFSdata analysis also allows for quantification of the dopantsolubility limit in the NP.
Doped and undoped IF/INT-WS2 were also analyzed byXANES and EXAFS. The Re doping was found to inducestronger W�S bonding, and/or a less defective bondingenvironment. However, since the Re and W signals arealmost overlapping, this method could not unequivocallyconfirm that Re substitute W atoms. Additional detaileddescriptions of the measurements and data analysis arepresented in the Supporting Information.
The limit of the rhenium solubility within the MoS2 latticeas a dopant was estimated by using a simple thermodynamicapproach (for the entropy part) and quantum mechanicalcalculations (for the enthalpy part). More details of thecalculations are given in the Supporting Information. Theresults show that for a temperature around 1200 K, themaximal Re content in the MoS2 lattice is 0.01 at%, which issomewhat below the experimentally observed value (0.02–0.05 at%). These calculations clearly indicate that the Redoping process is self-limiting, which is highly desirable forprecise control of the doping densities.
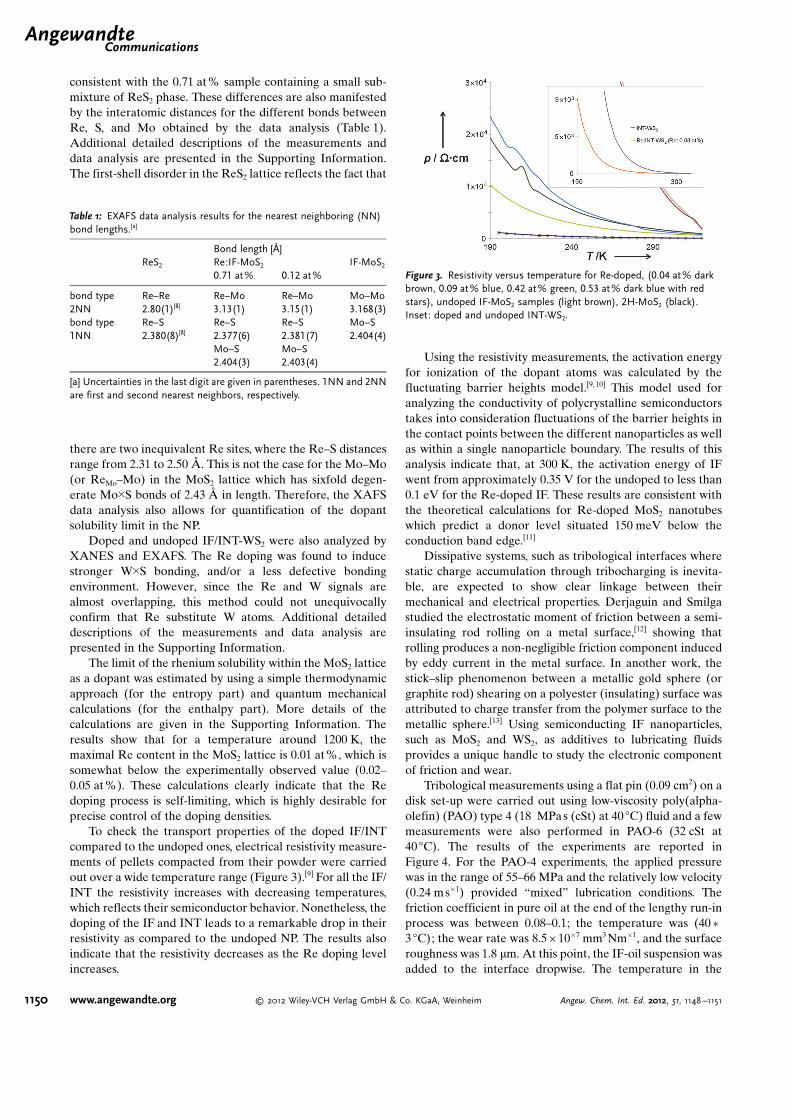
To check the transport properties of the doped IF/INTcompared to the undoped ones, electrical resistivity measure-ments of pellets compacted from their powder were carriedout over a wide temperature range (Figure 3).[9] For all the IF/INT the resistivity increases with decreasing temperatures,which reflects their semiconductor behavior. Nonetheless, thedoping of the IF and INT leads to a remarkable drop in theirresistivity as compared to the undoped NP. The results alsoindicate that the resistivity decreases as the Re doping levelincreases.
Using the resistivity measurements, the activation energyfor ionization of the dopant atoms was calculated by thefluctuating barrier heights model.[9, 10] This model used foranalyzing the conductivity of polycrystalline semiconductorstakes into consideration fluctuations of the barrier heights inthe contact points between the different nanoparticles as wellas within a single nanoparticle boundary. The results of thisanalysis indicate that, at 300 K, the activation energy of IFwent from approximately 0.35 V for the undoped to less than0.1 eV for the Re-doped IF. These results are consistent withthe theoretical calculations for Re-doped MoS2 nanotubeswhich predict a donor level situated 150 meV below theconduction band edge.[11]
Dissipative systems, such as tribological interfaces wherestatic charge accumulation through tribocharging is inevita-ble, are expected to show clear linkage between theirmechanical and electrical properties. Derjaguin and Smilgastudied the electrostatic moment of friction between a semi-insulating rod rolling on a metal surface,[12] showing thatrolling produces a non-negligible friction component inducedby eddy current in the metal surface. In another work, thestick–slip phenomenon between a metallic gold sphere (orgraphite rod) shearing on a polyester (insulating) surface wasattributed to charge transfer from the polymer surface to themetallic sphere.[13] Using semiconducting IF nanoparticles,such as MoS2 and WS2, as additives to lubricating fluidsprovides a unique handle to study the electronic componentof friction and wear.
Tribological measurements using a flat pin (0.09 cm2) on adisk set-up were carried out using low-viscosity poly(alpha-olefin) (PAO) type 4 (18 MPas (cSt) at 40 8C) fluid and a fewmeasurements were also performed in PAO-6 (32 cSt at40 8C). The results of the experiments are reported inFigure 4. For the PAO-4 experiments, the applied pressurewas in the range of 55–66 MPa and the relatively low velocity(0.24 ms�1) provided “mixed” lubrication conditions. Thefriction coefficient in pure oil at the end of the lengthy run-inprocess was between 0.08–0.1; the temperature was (40�3 8C); the wear rate was 8.5 � 10�7 mm3 Nm�1, and the surfaceroughness was 1.8 mm. At this point, the IF-oil suspension wasadded to the interface dropwise. The temperature in the
Table 1: EXAFS data analysis results for the nearest neighboring (NN)bond lengths.[a]
Bond length [�]ReS2 Re:IF-MoS2 IF-MoS2
0.71 at% 0.12 at%
bond type2NN
Re–Re2.80(1)[8]
Re–Mo3.13(1)
Re–Mo3.15(1)
Mo–Mo3.168(3)
bond type1NN
Re–S2.380(8)[8]
Re–S2.377(6)Mo–S2.404(3)
Re–S2.381(7)Mo–S2.403(4)
Mo–S2.404(4)
[a] Uncertainties in the last digit are given in parentheses. 1NN and 2NNare first and second nearest neighbors, respectively.
Figure 3. Resistivity versus temperature for Re-doped, (0.04 at% darkbrown, 0.09 at% blue, 0.42 at% green, 0.53 at% dark blue with redstars), undoped IF-MoS2 samples (light brown), 2H-MoS2 (black).Inset: doped and undoped INT-WS2.
contact area gradually dropped to 30� 3 8C. The frictioncoefficient of PAO-4 with 1% IF-MoS2 was found to bebetween 0.04 and 0.05, which is compatible with previousresults.[14] Remarkably, the friction coefficient of the oil with1 wt % Re:IF-MoS2 (0.12 and 0.71 at%) gradually dropped to0.014–0.016 and the surface roughness parameter decreasedfrom 1.8 to 0.1 mm. Re:IF-MoS2 also exhibits, by-far, thelowest wear rate, 4.7 � 10�8 nm3 N�1 m�1 for 0.12 at% and2.7 � 10�9 for 0.71 at% Re. In addition, Re-doped IF-WS2 wastested in PAO-6 providing exceedingly low friction coefficient(0.007) and wear rates (1.35 � 10�9 nm3 N�1 m�1) under similarvelocities and load conditions.
The low friction, smooth surface, and the lengthy periodof friction in pure oil after the friction test in the oil + Re-doped IF indicate the formation of an easy shear film at thecontact surface. The compact film of the Re-doped NP on thetested surface could be seen by SEM and AFM.
It is believed that the agglomeration of the undopednanoparticles, which hinder their facile access to the inter-face,[15] is largely alleviated in the case of the doped IF.Furthermore, the reduced friction and wear can be ascribed tothe build-up of a film with appreciable conductivity on bothsides of the matting metal contact. However more work isrequired to fully characterize this film and study thetribological mechanism of charged colloidal nanoparticles inoil. These results indicate that both the friction coefficient andthe wear rate are adversely affected by tribocharging of theinterface, which problem is at least partially relieved bydoping the IF.
Most likely, the free carriers are trapped at surface defectsinducing negative charge on the NP surface. Such defectsoccur when the surface monolayer folds in sharp angles andthe sulfur atoms are replaced by oxygen or OH moieties in thekinks.[16] The negative surface charge can be balanced byeither an inner space-charge layer (band bending); byexternal double layer or chemisorb positive ions, and possiblyjointly by all of these factors. Nonetheless, these surface
charges lead to mutual repulsion at close proximity andprevent agglomeration and subsequent sedimentation of thenanoparticles. Consequently, the nanoparticles can formstable suspensions in the oil. It can also access the tribologicalinterface more easily, providing both easier shearing and aslower wear rate. It should also be recalled that, in therelevant pressure range (up to a few hundred MPa),[17] thefree carrier concentration increases with the applied pressurefor extrinsically doped metal dichalcogenide semiconductors.Careful doping of the inorganic fullerene-like (IF) NP andnanotubes (INT) could lead to other advances, for example, inthe electronic and optical properties of such NP for sensorapplications.
Received: July 28, 2011Revised: October 10, 2011Published online: December 23, 2011
[1] a) V. Derycke, R. Martel, J. Appenzeller, P. Avouris, Appl. Phys.Lett. 2002, 80, 2773; b) J. Kong, C. Zhou, E. Yenilmez, H. Dai,Appl. Phys. Lett. 2000, 77, 3977; c) C. Zhou, J. Kong, E.Yenilmez, H. Dai, Science 2000, 290, 1552; d) Y. Cui, X. Duan,J. Hu, C. M. Lieber, J. Phys. Chem. B 2000, 104, 5213; e) X.Duan, Y. Huang, Y. Cui, J. Wang, C. M. Lieber, Nature 2001, 409,66; f) D. J. Bryan, D. R. Gamelin, Prog. Inorg. Chem. 2005, 54,47.
[2] L. Krusin-Elbaum, D. Newns, H. Zeng, V. Derycke, J. Sun, R.Sandstrom, Nature 2004, 431, 672.
[3] V. Ivanovskaya, T. Heine, S. Gemming, G. Seifert, Phys. StatusSolidi B 2006, 243, 1757.
[4] a) Y. Zhu, W. Hsu, S. Firth, M. Terrones, R. Clark, H. Kroto, D.Walton, Chem. Phys. Lett. 2001, 342, 15; b) F. L. Deepak, R.Popovitz-Biro, Y. Feldman, H. Cohen, A. Enyashin, G. Seifert,R. Tenne, Chem. Asian J. 2008, 3, 1568.
[5] a) K. Tiong, P. Liao, C. Ho, Y. Huang, J. Cryst. Growth 1999, 205,543; b) J. Wildervanck, F. Jellinek, J. Less-Common Met. 1971,24, 73.
[6] R. Sp�h, U. Elrod, M. Lux-Steiner, E. Bucher, S. Wagner, Appl.Phys. Lett. 1983, 43, 79.
[7] A. Zak, Y. Feldman, V. Alperovich, R. Rosentsveig, R. Tenne, J.Am. Chem. Soc. 2000, 122, 11108.
[8] V. Petkov, S. J. L. Billinge, J. Heising, M. G. Kanatzidis, J. Am.Chem. Soc. 2000, 122, 11571.
[9] F. Kopnov, A. Yoffe, G. Leitus, R. Tenne, Phys. Status Solidi B2006, 243, 1229.
[10] J. Werner, Solid State Phenom. 1994, 37 – 38, 213.[11] A. N. Enyashin, I. Popov, G. Seifert, Phys. Status Solidi B 2009,
246, 114.[12] B. Derjaguin, V. Smilga, Wear 1964, 7, 270.[13] R. Budakian, S. Putterman, Phys. Rev. Lett. 2000, 85, 1000.[14] R. Rosentsveig, A. Margolin, A. Gorodnev, R. Popovitz-Biro, Y.
Feldman, L. Rapoport, Y. Novema, G. Naveh, R. Tenne, J. Mater.Chem. 2009, 19, 4368.
[15] A. Moshkovith, V. Perfiliev, I. Lapsker, N. Fleischer, R. Tenne,L. Rapoport, Tribol. Lett. 2006, 24, 225.
[16] C. Shahar, D. Zbaida, L. Rapoport, H. Cohen, T. Bendikov, J.Tannous, F. Dassenoy, R. Tenne, Langmuir 2010, 26, 4409.
[17] A. Grant, T. Griffiths, G. Pitt, A. Yoffe, J. Phys. C 1975, 8, L17.
Figure 4. Friction coefficient (m) versus time measured with pin ondisk set-up for different samples in PAO-4 oil. Pin (0.09 cm2) made ofAISI 1020 steel (hardness HV = 180) was rubbed against a disk(AISI 4330 steel; HV = 550). The applied loads are in the range of 500–600 N and the velocity is 0.24 ms�1.