Page 1
Česká společnost pro nedestruktivní zkoušení materiálu38. mezinárodní konference DEFEKTOSKOPIE 2008
Brno, 4. – 6. 11. 2008
DEFEKTOSKOPIE 2008 283
DETECTION AND PROCESSING OF SOUND SIGNALS IN
STEEL QUENCHING
Franc Ravnik, Janez Grum* University of Ljubljana, Faculty of Mechanical Engineering, Ašker eva 6, 1000 Ljubljana
[email protected] ; [email protected]
* corresponding author
Abstract
In the production of machine components a manufacturing process often ends with heat
treatment such as quenching by tempering. Generation of internal stresses during heat
treatment and residual stresses present thereafter frequently result in non-uniform hardness
and depth of a quenched layer, which produces distortion of a machine component and
generation of residual stresses. The choice of optimum parameters of a quenching process and
monitoring of the process itself ensures the achievement of the specified hardness and
residual stress at the surface of the machine component. The paper treats an experimental
setup comprising detection of acoustic emission in the course of quenching. Due to heat
transfer from a specimen to a quenching medium, film boiling and nucleate boiling occur
round a heated object, which strongly affects quenching. An investigation of acoustic
emission in the quenching process was carried out with cylindrical specimens made of
chrome-molybdenum heat-treatment steel 42CrMo4. The cylindrical specimens of two shapes
were quenched in five different recommended quenching media. Sound-pressure signals
demonstrated by different amplitudes depending on time at different frequencies are shown in
3D diagrams. It has turned out that an analysis of acoustic-emission signals can provide useful
information that confirms differences occurring in quenching with different quenching media
and under different quenching conditions. The quenching results obtained from acoustic-
emission signals during the quenching process can be confirmed by variations of residual
stresses and hardness in the cross section. The results confirm the applicability of the new
approach to the control of steel quenching.
Keywords: Acoustic emission, Acoustic spectrograph, Cooling rate, Polymeric solution,
Quenching, Sound pressure level, Vapour film
1. Introduction
A purpose of quenching is to provide a cooling rate higher than the upper critical cooling rate
in a certain depth of a machine component in order to obtain desired mechanical properties.
The mechanical properties obtained are then verified by hardness measurement at the surface,
i.e. by measuring through-depth hardness of the machine component. Critical cooling rates
with carbon steels and low-alloy steels can be achieved by cooling a machine component
from the austenitic microstructure, which is obtained by immersion into fluid quenching
media such as water, oil, polymeric water solutions, and emulsions.
Page 2
284 DEFEKTOSKOPIE 2008
During the quenching process in liquids the occurrence of three phases of heat transport of the
heated machine component, which is conditioned by quenching parameters and workpiece
properties, is characteristic.
In the initial phase of machine-component immersion, a stable vapour film of a fluid
quenching medium forms around the workpiece, so that the heat transfer to the quenching
medium is considerably slowed down. In further cooling the vapour film gradually decays so
that a phase of nucleate boiling occurs at some parts of the workpiece surface having a
temperature lower than the Leidenfrost temperature. In nucleate boiling, a surface section
wets with the liquid quenching medium and the heat transfer from the workpiece increases. At
lower temperatures, a third phase of convective cooling occurs at the interface. The three
phases are characterized by different modes of heat transfer, which contributes to different
cooling intensities.
With exacting workpiece shapes it often occurs during heat treatment, i.e. during workpiece
cooling, that all the three phases occur simultaneously, which, however, produces
considerable thermal stresses and also an explicit influence on microstructural stresses, which
leads to distortion, or even to distortion and cracking, of the workpiece. Steel quenching starts
at the austenitizing temperature of a given steel, the quenching process in fluid quenching
media always being accompanied by an evaporation phase of the medium in contact with the
workpiece surface, since a boiling point of most of quenching media ranges between 100 °C
and 300 °C at normal pressure.
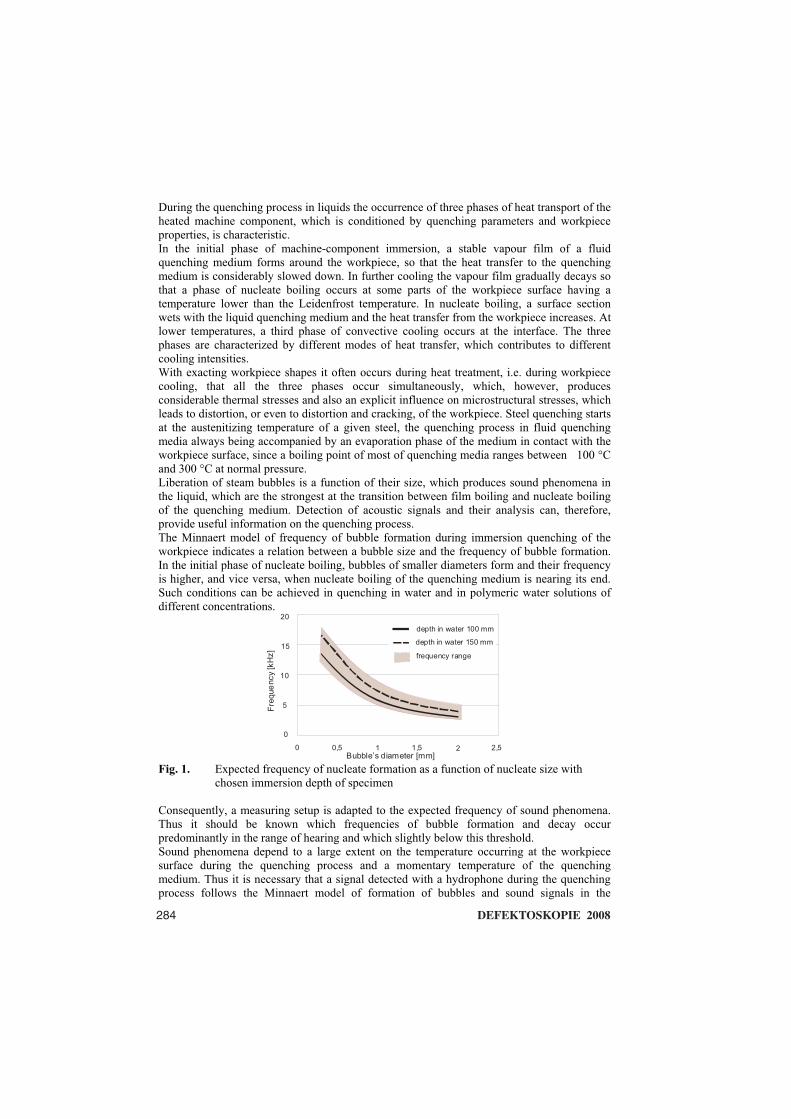
Liberation of steam bubbles is a function of their size, which produces sound phenomena in
the liquid, which are the strongest at the transition between film boiling and nucleate boiling
of the quenching medium. Detection of acoustic signals and their analysis can, therefore,
provide useful information on the quenching process.
The Minnaert model of frequency of bubble formation during immersion quenching of the
workpiece indicates a relation between a bubble size and the frequency of bubble formation.
In the initial phase of nucleate boiling, bubbles of smaller diameters form and their frequency
is higher, and vice versa, when nucleate boiling of the quenching medium is nearing its end.
Such conditions can be achieved in quenching in water and in polymeric water solutions of
different concentrations.
0 2,521,510,5Bubble s diameter’ [mm]
Frequency[kHz]
20
15
10
5
0
depth in water 100 mm
depth in water 150 mm
frequency range
Fig. 1. Expected frequency of nucleate formation as a function of nucleate size with
chosen immersion depth of specimen
Consequently, a measuring setup is adapted to the expected frequency of sound phenomena.
Thus it should be known which frequencies of bubble formation and decay occur
predominantly in the range of hearing and which slightly below this threshold.
Sound phenomena depend to a large extent on the temperature occurring at the workpiece
surface during the quenching process and a momentary temperature of the quenching
medium. Thus it is necessary that a signal detected with a hydrophone during the quenching
process follows the Minnaert model of formation of bubbles and sound signals in the
Page 3
DEFEKTOSKOPIE 2008 285
quenching medium. The conditions at which the signals were detected can be monitored with
temperature measurement in the specimen during the quenching process. The phenomena
occurring at the workpiece/medium interface should then be logically interrelated in film
boiling, including additional sound effects due to material failure.
2. Experimental procedure
Because of an influence of the workpiece surface temperature on the occurrence of film
boiling and nucleate boiling, an experimental procedure was elaborated for temperature
monitoring in the cylindrical specimens and on-line detection of sound signals in the entire
temperature range of the quenching process.
2.1. Experimental setup
The designed experimental setup comprises two independent setups, i.e.:
a setup for monitoring the temperatures at the surface and in the core during
quenching and monitoring of the temperature of the medium itself (Fig. 2);
a setup for detection and processing acoustic-emission signals (Fig. 2).
The experimental setup for detecting AE signals in wetting processes is to be independent
from the type of quenching medium used and of the quenching mode. Although the
quenching process takes some seconds or even up to several minutes, the experimental system
should register individual events sensed up to 0.1 second or less.
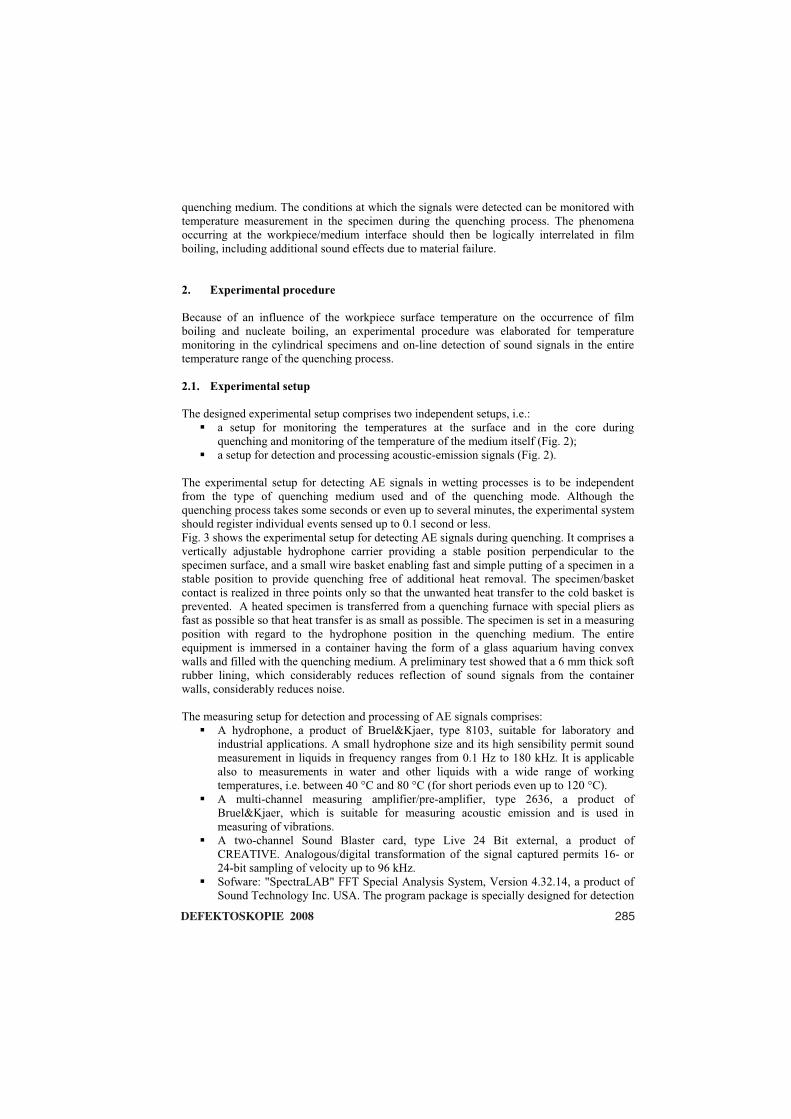
Fig. 3 shows the experimental setup for detecting AE signals during quenching. It comprises a
vertically adjustable hydrophone carrier providing a stable position perpendicular to the
specimen surface, and a small wire basket enabling fast and simple putting of a specimen in a
stable position to provide quenching free of additional heat removal. The specimen/basket
contact is realized in three points only so that the unwanted heat transfer to the cold basket is
prevented. A heated specimen is transferred from a quenching furnace with special pliers as
fast as possible so that heat transfer is as small as possible. The specimen is set in a measuring
position with regard to the hydrophone position in the quenching medium. The entire
equipment is immersed in a container having the form of a glass aquarium having convex
walls and filled with the quenching medium. A preliminary test showed that a 6 mm thick soft
rubber lining, which considerably reduces reflection of sound signals from the container
walls, considerably reduces noise.
The measuring setup for detection and processing of AE signals comprises:
A hydrophone, a product of Bruel&Kjaer, type 8103, suitable for laboratory and
industrial applications. A small hydrophone size and its high sensibility permit sound
measurement in liquids in frequency ranges from 0.1 Hz to 180 kHz. It is applicable
also to measurements in water and other liquids with a wide range of working
temperatures, i.e. between 40 °C and 80 °C (for short periods even up to 120 °C).
A multi-channel measuring amplifier/pre-amplifier, type 2636, a product of
Bruel&Kjaer, which is suitable for measuring acoustic emission and is used in
measuring of vibrations.
A two-channel Sound Blaster card, type Live 24 Bit external, a product of
CREATIVE. Analogous/digital transformation of the signal captured permits 16- or
24-bit sampling of velocity up to 96 kHz.
Sofware: "SpectraLAB" FFT Special Analysis System, Version 4.32.14, a product of
Sound Technology Inc. USA. The program package is specially designed for detection
Page 4
286 DEFEKTOSKOPIE 2008
and processing, and recording of acoustic signals in its original and digitized form,
which permits subsequent evaluation and monitoring of events in the specimen during
quenching.
An IBM notebook, type ThinkPad, model R51, with Intel ® Pentium ® M Processor
1.6 MHz, and 760 MB RAM. Operating system: MS Windows XP Professional 2002.
In addition to acoustic emission, temperature variations at the specimen surface and in the
core, and quenching-medium temperatures prior to, during and after quenching were
monitored too.
Each of the ten specimens was equipped with two thermocouples, the first being 2 mm below
the surface and the second one in the core centre, i.e. in the specimen axis.
The measuring setup for monitoring temperature variations at the specimen surface and in its
comprised:
thermocouples mounted at the surface and in the core for measuring temperature
variations during quenching;
SCIXI 16-bit USB I/O platform for signal processing, a product of National
Instruments Inc; it enables detection of temperature signals with a 16-bit resolution
and sampling rate of up to 200 kHz.
Lab VIEW Software for monitoring time-dependent temperature.
The IBM notebook, type ThinkPad, model R51, with Intel ® Pentium ® M Processor
1,6 MHz and 760 MB RAM. Operating system: MS Windows XP Professional 2002
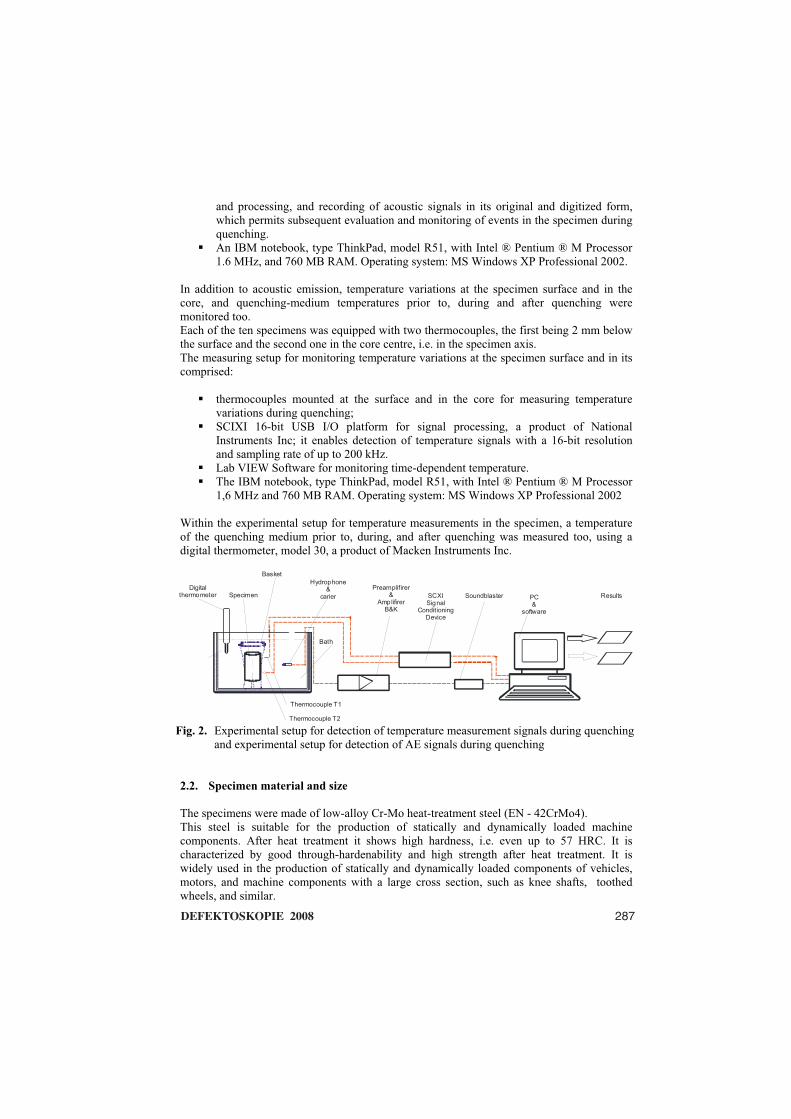
Within the experimental setup for temperature measurements in the specimen, a temperature
of the quenching medium prior to, during, and after quenching was measured too, using a
digital thermometer, model 30, a product of Macken Instruments Inc.
Soundblaster
Preamplifirer
AmplifirerB K
&
&
Digitalthermometer Specimen PC
software&
Hydrophone
carier&
SCXISignal
ConditioningDevice
Bath
Basket
Results
Thermocouple T1
Thermocouple T2
Fig. 2. Experimental setup for detection of temperature measurement signals during quenching
and experimental setup for detection of AE signals during quenching
2.2. Specimen material and size
The specimens were made of low-alloy Cr-Mo heat-treatment steel (EN - 42CrMo4).
This steel is suitable for the production of statically and dynamically loaded machine
components. After heat treatment it shows high hardness, i.e. even up to 57 HRC. It is
characterized by good through-hardenability and high strength after heat treatment. It is
widely used in the production of statically and dynamically loaded components of vehicles,
motors, and machine components with a large cross section, such as knee shafts, toothed
wheels, and similar.
Page 5
DEFEKTOSKOPIE 2008 287
and processing, and recording of acoustic signals in its original and digitized form,
which permits subsequent evaluation and monitoring of events in the specimen during
quenching.
An IBM notebook, type ThinkPad, model R51, with Intel ® Pentium ® M Processor
1.6 MHz, and 760 MB RAM. Operating system: MS Windows XP Professional 2002.
In addition to acoustic emission, temperature variations at the specimen surface and in the
core, and quenching-medium temperatures prior to, during and after quenching were
monitored too.
Each of the ten specimens was equipped with two thermocouples, the first being 2 mm below
the surface and the second one in the core centre, i.e. in the specimen axis.
The measuring setup for monitoring temperature variations at the specimen surface and in its
comprised:
thermocouples mounted at the surface and in the core for measuring temperature
variations during quenching;
SCIXI 16-bit USB I/O platform for signal processing, a product of National
Instruments Inc; it enables detection of temperature signals with a 16-bit resolution
and sampling rate of up to 200 kHz.
Lab VIEW Software for monitoring time-dependent temperature.
The IBM notebook, type ThinkPad, model R51, with Intel ® Pentium ® M Processor
1,6 MHz and 760 MB RAM. Operating system: MS Windows XP Professional 2002
Within the experimental setup for temperature measurements in the specimen, a temperature
of the quenching medium prior to, during, and after quenching was measured too, using a
digital thermometer, model 30, a product of Macken Instruments Inc.
Soundblaster
Preamplifirer
AmplifirerB K
&
&
Digitalthermometer Specimen PC
software&
Hydrophone
carier&
SCXISignal
ConditioningDevice
Bath
Basket
Results
Thermocouple T1
Thermocouple T2
Fig. 2. Experimental setup for detection of temperature measurement signals during quenching
and experimental setup for detection of AE signals during quenching
2.2. Specimen material and size
The specimens were made of low-alloy Cr-Mo heat-treatment steel (EN - 42CrMo4).
This steel is suitable for the production of statically and dynamically loaded machine
components. After heat treatment it shows high hardness, i.e. even up to 57 HRC. It is
characterized by good through-hardenability and high strength after heat treatment. It is
widely used in the production of statically and dynamically loaded components of vehicles,
motors, and machine components with a large cross section, such as knee shafts, toothed
wheels, and similar.
Page 6
288 DEFEKTOSKOPIE 2008
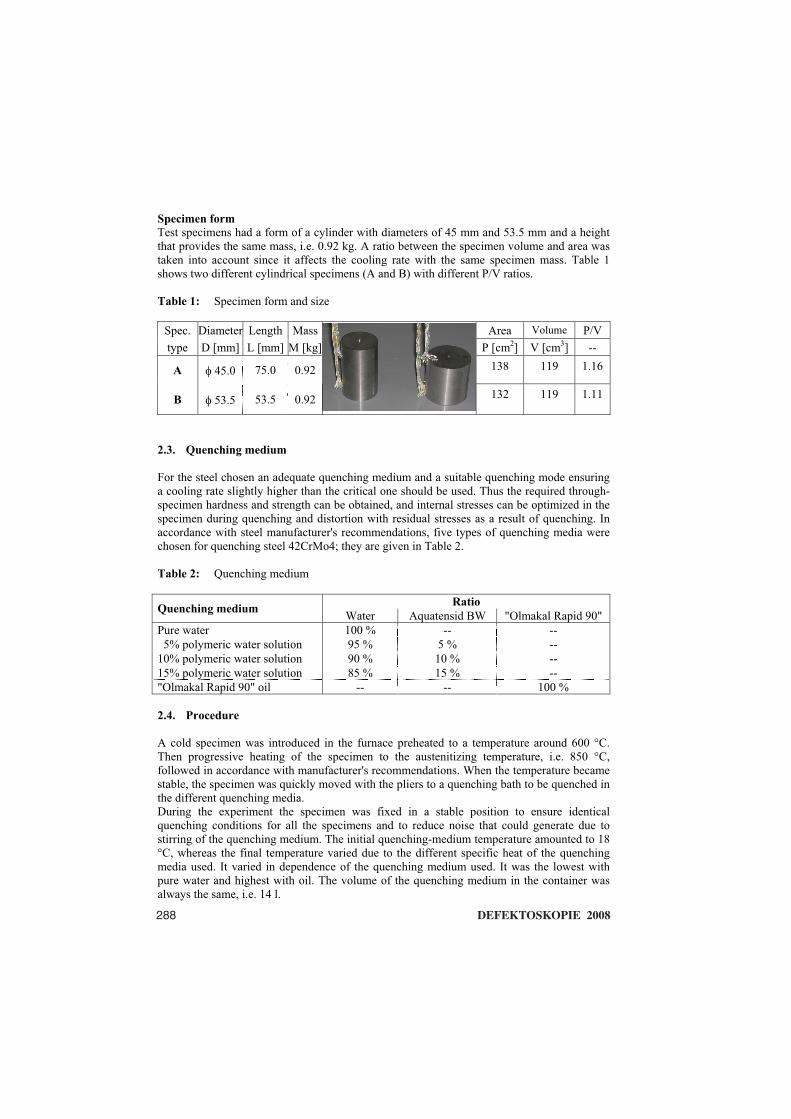
Specimen form
Test specimens had a form of a cylinder with diameters of 45 mm and 53.5 mm and a height
that provides the same mass, i.e. 0.92 kg. A ratio between the specimen volume and area was
taken into account since it affects the cooling rate with the same specimen mass. Table 1
shows two different cylindrical specimens (A and B) with different P/V ratios.
Table 1: Specimen form and size
Spec. Diameter Length Mass Area Volume P/V
type D [mm] L [mm] M [kg] P [cm2] V [cm
3] --
A 45.0 75.0 0.92 138 119 1.16
B 53.5 53.5 0.92 132 119 1.11
2.3. Quenching medium
For the steel chosen an adequate quenching medium and a suitable quenching mode ensuring
a cooling rate slightly higher than the critical one should be used. Thus the required through-
specimen hardness and strength can be obtained, and internal stresses can be optimized in the
specimen during quenching and distortion with residual stresses as a result of quenching. In
accordance with steel manufacturer's recommendations, five types of quenching media were
chosen for quenching steel 42CrMo4; they are given in Table 2.
Table 2: Quenching medium
RatioQuenching medium
Water Aquatensid BW "Olmakal Rapid 90"
Pure water 100 % -- --
5% polymeric water solution 95 % 5 % --
10% polymeric water solution 90 % 10 % --
15% polymeric water solution 85 % 15 % --
"Olmakal Rapid 90" oil -- -- 100 %
2.4. Procedure
A cold specimen was introduced in the furnace preheated to a temperature around 600 °C.
Then progressive heating of the specimen to the austenitizing temperature, i.e. 850 °C,
followed in accordance with manufacturer's recommendations. When the temperature became
stable, the specimen was quickly moved with the pliers to a quenching bath to be quenched in
the different quenching media.
During the experiment the specimen was fixed in a stable position to ensure identical
quenching conditions for all the specimens and to reduce noise that could generate due to
stirring of the quenching medium. The initial quenching-medium temperature amounted to 18
°C, whereas the final temperature varied due to the different specific heat of the quenching
media used. It varied in dependence of the quenching medium used. It was the lowest with
pure water and highest with oil. The volume of the quenching medium in the container was
always the same, i.e. 14 l.
Page 7
DEFEKTOSKOPIE 2008 289
At the IBM notebook two program packages, i.e. "SpectraLAB" for sound-signal processing
and "Temperature" program for temperature-signal processing, were running simultaneously
at platform LabView. The captured sound signals were subsequently evaluated with the same
program package, i.e. "SpectraLAB", and the temperature signals with MS EXCEL.
3. Results
Results of a spectrum analysis of sound pressure are diagrams showing varying of sound
pressure Lp in dependence of frequency and time.
3.1. Comparison of spectrograms
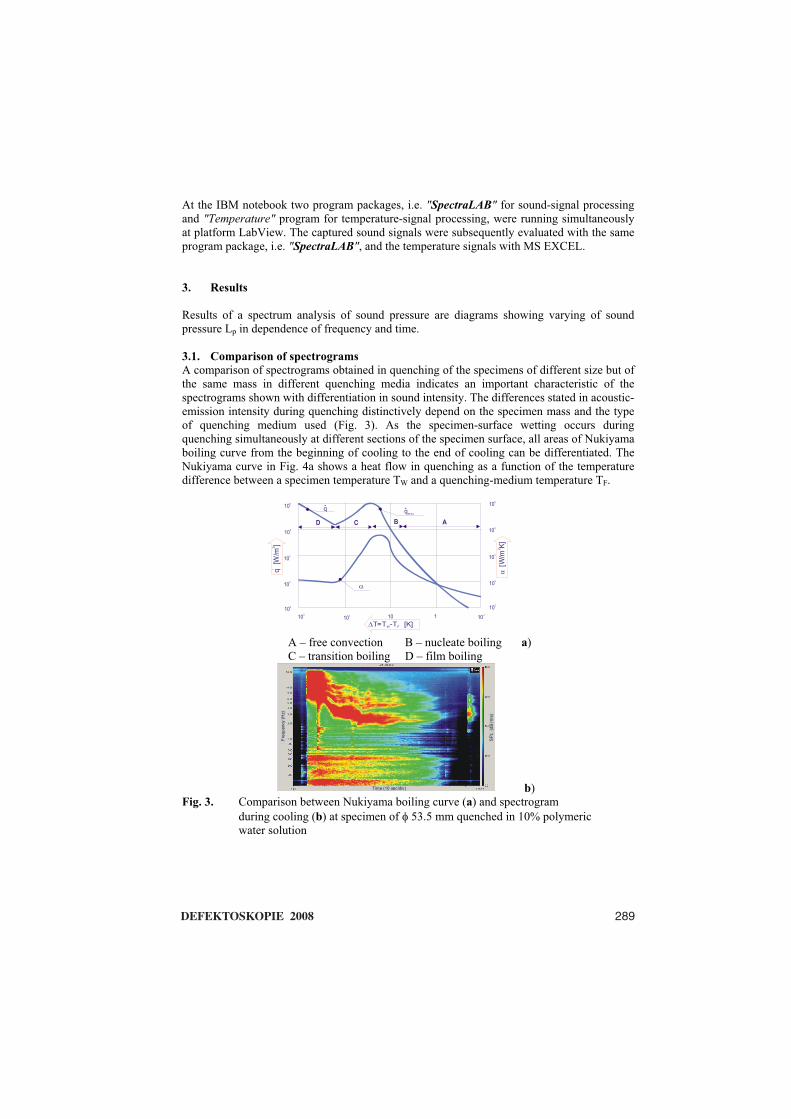
A comparison of spectrograms obtained in quenching of the specimens of different size but of
the same mass in different quenching media indicates an important characteristic of the
spectrograms shown with differentiation in sound intensity. The differences stated in acoustic-
emission intensity during quenching distinctively depend on the specimen mass and the type
of quenching medium used (Fig. 3). As the specimen-surface wetting occurs during
quenching simultaneously at different sections of the specimen surface, all areas of Nukiyama
boiling curve from the beginning of cooling to the end of cooling can be differentiated. The
Nukiyama curve in Fig. 4a shows a heat flow in quenching as a function of the temperature
difference between a specimen temperature TW and a quenching-medium temperature TF.
10-1
103
102 10 1
102
102
103 10
3
104
104
105
106
106
105
T=T -T [K]W F
[W/mK]
2
q[W/m]2
D C AB
q qmax
A – free convection B – nucleate boiling a)
C – transition boiling D – film boiling
Time (10 sec/div)
Frequency(Hz)
SPL(dBrms)
b)
Fig. 3. Comparison between Nukiyama boiling curve (a) and spectrogram
during cooling (b) at specimen of 53.5 mm quenched in 10% polymeric
water solution
Page 8
290 DEFEKTOSKOPIE 2008
3.2. Analysis of an acoustic spectrum
A spectrogram is a time record of sound signals, from which a frequency is evident as a value
at the ordinate and signal intensity as colour intensity (cold, blue colour - low intensity, hot,
red colour – strong intensity).
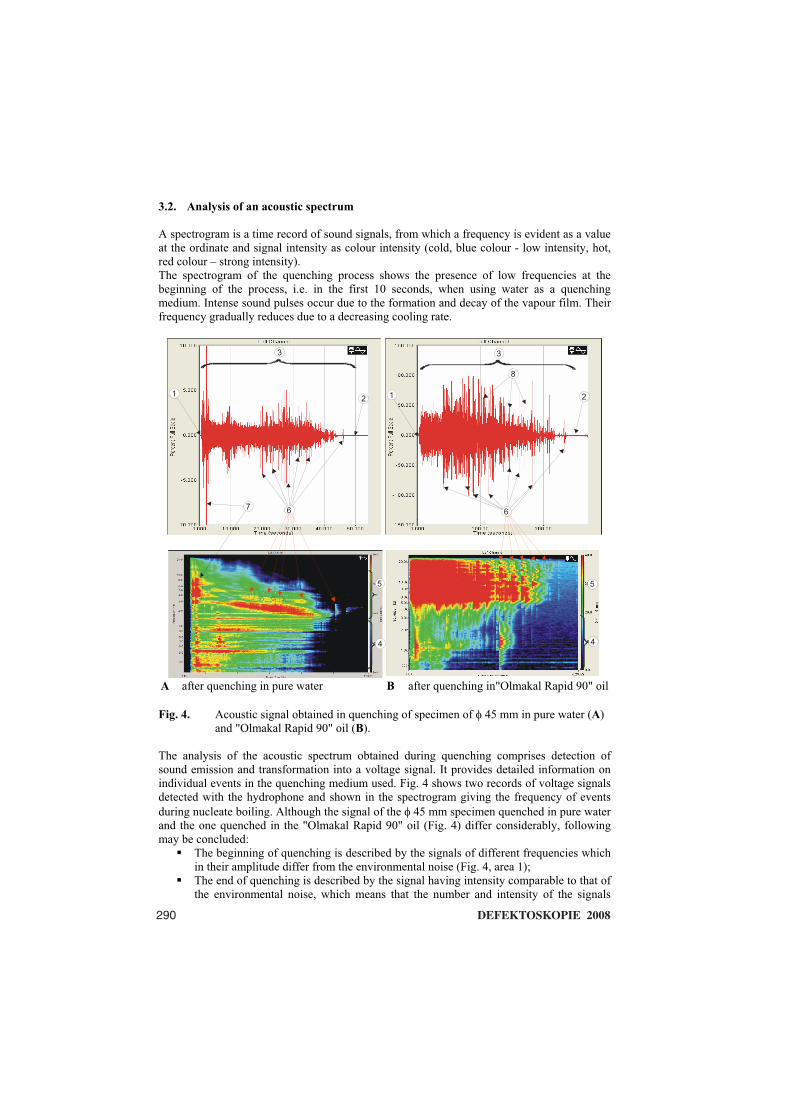
The spectrogram of the quenching process shows the presence of low frequencies at the
beginning of the process, i.e. in the first 10 seconds, when using water as a quenching
medium. Intense sound pulses occur due to the formation and decay of the vapour film. Their
frequency gradually reduces due to a decreasing cooling rate.
1 12 2
3 3
4
55
4
7 6 6
8
A after quenching in pure water B after quenching in"Olmakal Rapid 90" oil
Fig. 4. Acoustic signal obtained in quenching of specimen of 45 mm in pure water (A)
and "Olmakal Rapid 90" oil (B).
The analysis of the acoustic spectrum obtained during quenching comprises detection of
sound emission and transformation into a voltage signal. It provides detailed information on
individual events in the quenching medium used. Fig. 4 shows two records of voltage signals
detected with the hydrophone and shown in the spectrogram giving the frequency of events
during nucleate boiling. Although the signal of the 45 mm specimen quenched in pure water
and the one quenched in the "Olmakal Rapid 90" oil (Fig. 4) differ considerably, following
may be concluded:
The beginning of quenching is described by the signals of different frequencies which
in their amplitude differ from the environmental noise (Fig. 4, area 1);
The end of quenching is described by the signal having intensity comparable to that of
the environmental noise, which means that the number and intensity of the signals
Page 9
DEFEKTOSKOPIE 2008 291
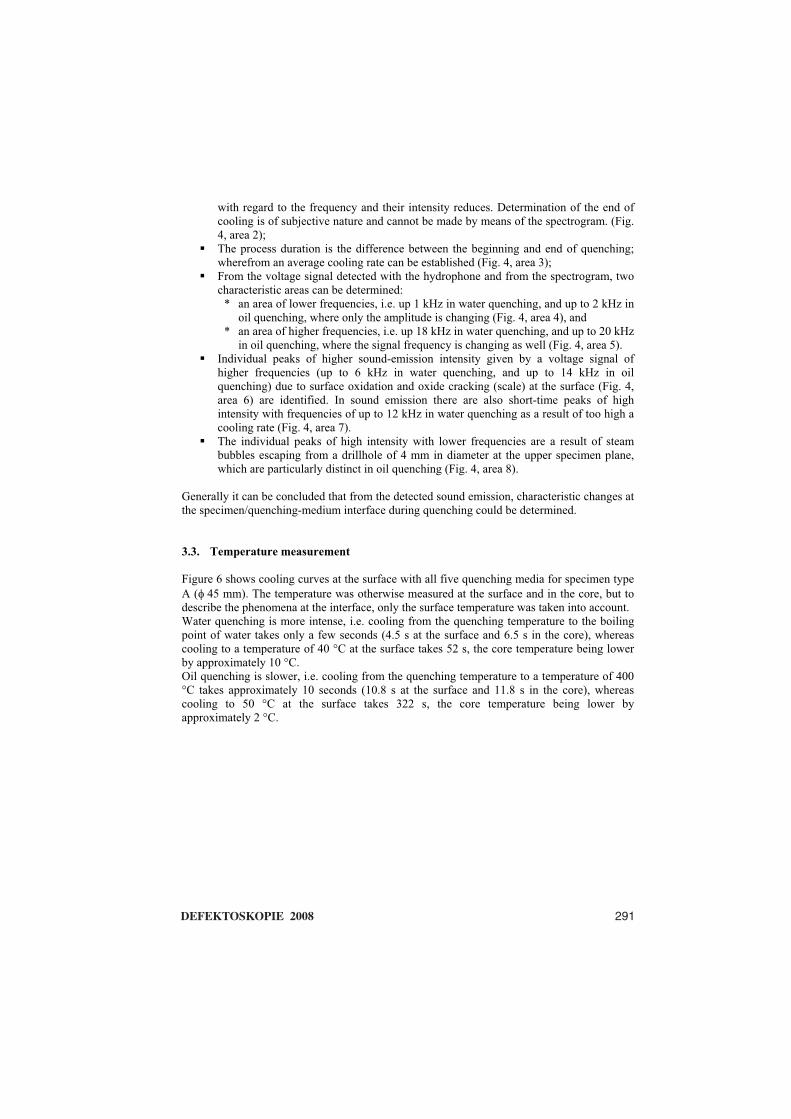
with regard to the frequency and their intensity reduces. Determination of the end of
cooling is of subjective nature and cannot be made by means of the spectrogram. (Fig.
4, area 2);
The process duration is the difference between the beginning and end of quenching;
wherefrom an average cooling rate can be established (Fig. 4, area 3);
From the voltage signal detected with the hydrophone and from the spectrogram, two
characteristic areas can be determined:
* an area of lower frequencies, i.e. up 1 kHz in water quenching, and up to 2 kHz in
oil quenching, where only the amplitude is changing (Fig. 4, area 4), and
* an area of higher frequencies, i.e. up 18 kHz in water quenching, and up to 20 kHz
in oil quenching, where the signal frequency is changing as well (Fig. 4, area 5).
Individual peaks of higher sound-emission intensity given by a voltage signal of
higher frequencies (up to 6 kHz in water quenching, and up to 14 kHz in oil
quenching) due to surface oxidation and oxide cracking (scale) at the surface (Fig. 4,
area 6) are identified. In sound emission there are also short-time peaks of high
intensity with frequencies of up to 12 kHz in water quenching as a result of too high a
cooling rate (Fig. 4, area 7).
The individual peaks of high intensity with lower frequencies are a result of steam
bubbles escaping from a drillhole of 4 mm in diameter at the upper specimen plane,
which are particularly distinct in oil quenching (Fig. 4, area 8).
Generally it can be concluded that from the detected sound emission, characteristic changes at
the specimen/quenching-medium interface during quenching could be determined.
3.3. Temperature measurement
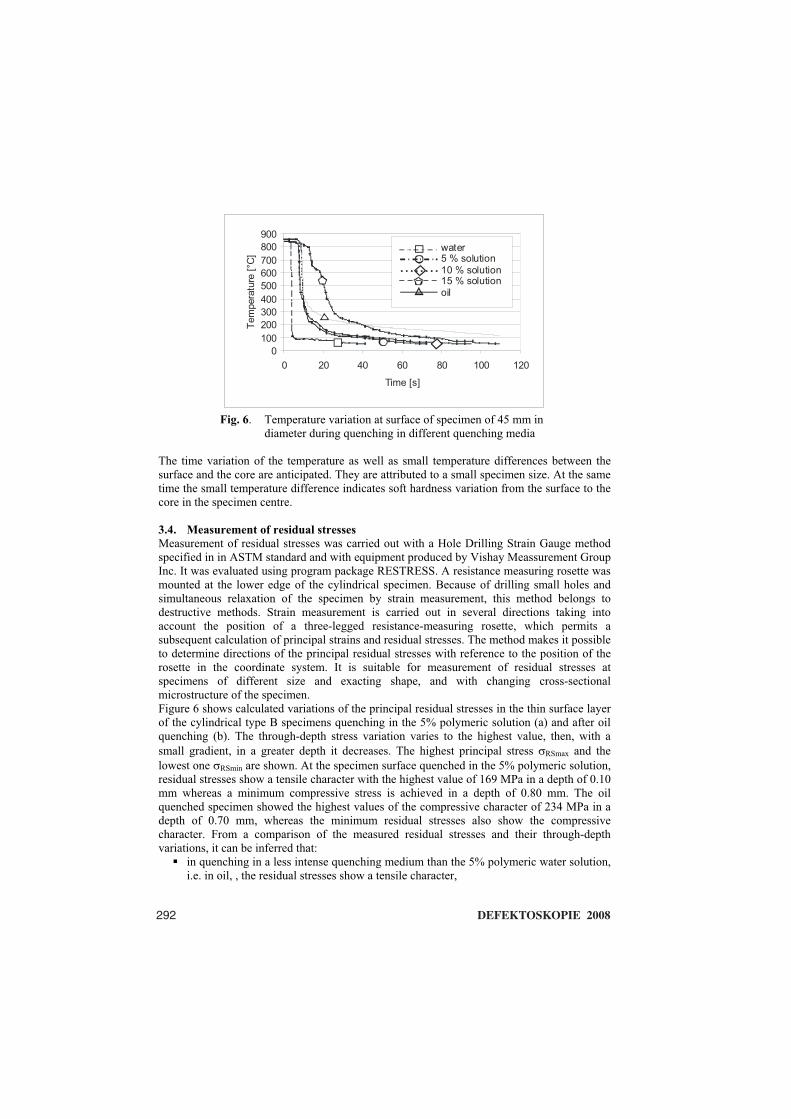
Figure 6 shows cooling curves at the surface with all five quenching media for specimen type
A ( 45 mm). The temperature was otherwise measured at the surface and in the core, but to
describe the phenomena at the interface, only the surface temperature was taken into account.
Water quenching is more intense, i.e. cooling from the quenching temperature to the boiling
point of water takes only a few seconds (4.5 s at the surface and 6.5 s in the core), whereas
cooling to a temperature of 40 °C at the surface takes 52 s, the core temperature being lower
by approximately 10 °C.
Oil quenching is slower, i.e. cooling from the quenching temperature to a temperature of 400
°C takes approximately 10 seconds (10.8 s at the surface and 11.8 s in the core), whereas
cooling to 50 °C at the surface takes 322 s, the core temperature being lower by
approximately 2 °C.
Page 10
292 DEFEKTOSKOPIE 2008
0
100
200
300
400
500
600
700
800
900
0 20 40 60 80 100 120
Time [s]
Temperature[°C]
water5 % solution10 % solution15 % solutionoil
Fig. 6. Temperature variation at surface of specimen of 45 mm in
diameter during quenching in different quenching media
The time variation of the temperature as well as small temperature differences between the
surface and the core are anticipated. They are attributed to a small specimen size. At the same
time the small temperature difference indicates soft hardness variation from the surface to the
core in the specimen centre.
3.4. Measurement of residual stresses
Measurement of residual stresses was carried out with a Hole Drilling Strain Gauge method
specified in in ASTM standard and with equipment produced by Vishay Meassurement Group
Inc. It was evaluated using program package RESTRESS. A resistance measuring rosette was
mounted at the lower edge of the cylindrical specimen. Because of drilling small holes and
simultaneous relaxation of the specimen by strain measurement, this method belongs to
destructive methods. Strain measurement is carried out in several directions taking into
account the position of a three-legged resistance-measuring rosette, which permits a
subsequent calculation of principal strains and residual stresses. The method makes it possible
to determine directions of the principal residual stresses with reference to the position of the
rosette in the coordinate system. It is suitable for measurement of residual stresses at
specimens of different size and exacting shape, and with changing cross-sectional
microstructure of the specimen.
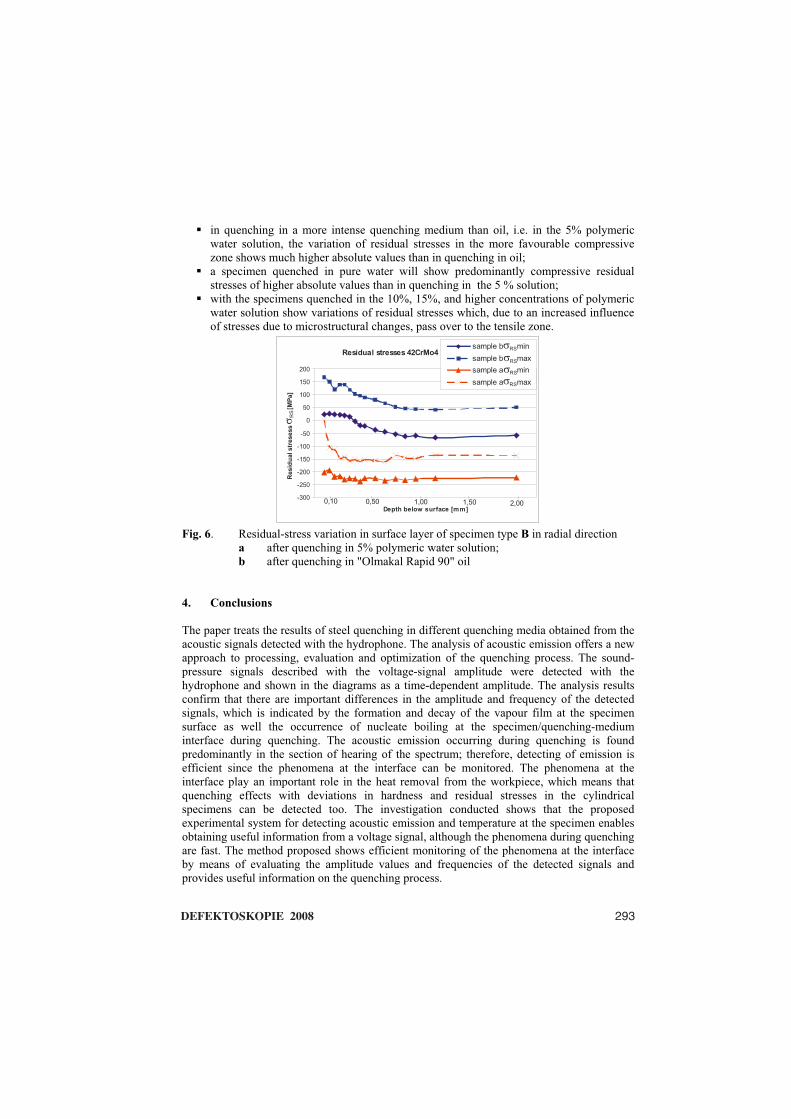
Figure 6 shows calculated variations of the principal residual stresses in the thin surface layer
of the cylindrical type B specimens quenching in the 5% polymeric solution (a) and after oil
quenching (b). The through-depth stress variation varies to the highest value, then, with a
small gradient, in a greater depth it decreases. The highest principal stress RSmax and the
lowest one RSmin are shown. At the specimen surface quenched in the 5% polymeric solution,
residual stresses show a tensile character with the highest value of 169 MPa in a depth of 0.10
mm whereas a minimum compressive stress is achieved in a depth of 0.80 mm. The oil
quenched specimen showed the highest values of the compressive character of 234 MPa in a
depth of 0.70 mm, whereas the minimum residual stresses also show the compressive
character. From a comparison of the measured residual stresses and their through-depth
variations, it can be inferred that:
in quenching in a less intense quenching medium than the 5% polymeric water solution,
i.e. in oil, , the residual stresses show a tensile character,
Page 11
DEFEKTOSKOPIE 2008 293
in quenching in a more intense quenching medium than oil, i.e. in the 5% polymeric
water solution, the variation of residual stresses in the more favourable compressive
zone shows much higher absolute values than in quenching in oil;
a specimen quenched in pure water will show predominantly compressive residual
stresses of higher absolute values than in quenching in the 5 % solution;
with the specimens quenched in the 10%, 15%, and higher concentrations of polymeric
water solution show variations of residual stresses which, due to an increased influence
of stresses due to microstructural changes, pass over to the te sile zone.n
Residual stresses 42CrMo4
-300
-250
-200
-150
-100
-50
0
50
100
150
200
Depth below surface [mm]
Residualstresess
[MPa]
sample b min
sample b max
sample a min
sample a max
2,001,501,000,10 0,50
RS
RS
RS
RS
RS
Fig. 6. Residual-stress variation in surface layer of specimen type B in radial direction
a after quenching in 5% polymeric water solution;
b after quenching in "Olmakal Rapid 90" oil
4. Conclusions
The paper treats the results of steel quenching in different quenching media obtained from the
acoustic signals detected with the hydrophone. The analysis of acoustic emission offers a new
approach to processing, evaluation and optimization of the quenching process. The sound-
pressure signals described with the voltage-signal amplitude were detected with the
hydrophone and shown in the diagrams as a time-dependent amplitude. The analysis results
confirm that there are important differences in the amplitude and frequency of the detected
signals, which is indicated by the formation and decay of the vapour film at the specimen
surface as well the occurrence of nucleate boiling at the specimen/quenching-medium
interface during quenching. The acoustic emission occurring during quenching is found
predominantly in the section of hearing of the spectrum; therefore, detecting of emission is
efficient since the phenomena at the interface can be monitored. The phenomena at the
interface play an important role in the heat removal from the workpiece, which means that
quenching effects with deviations in hardness and residual stresses in the cylindrical
specimens can be detected too. The investigation conducted shows that the proposed
experimental system for detecting acoustic emission and temperature at the specimen enables
obtaining useful information from a voltage signal, although the phenomena during quenching
are fast. The method proposed shows efficient monitoring of the phenomena at the interface
by means of evaluating the amplitude values and frequencies of the detected signals and
provides useful information on the quenching process.
Page 12
294 DEFEKTOSKOPIE 2008
5. References
[1.] Tensi, H. M. (1992): Wetting kinematics. Eds: Liš i , B.; Tensi, H. M.; Luty, W.:
Theory and Technology of Quenching, A handbook, Springer-Verlag, Berlin, 481 pp.
[2.] Tensi, H.M., and G.E. Totten (1996): "Development of the Understanding of the
Influence of Wetting Behaviour on Quenching and the Merits in these Developments of
Prof. Imao Tamura'', Proceedings of the 2nd
International Conference on Quenching
and the Control of Distortion, Nov. 4-7, 1996.
[3.] Grum J., Boži S. (2003): Acoustic emission during quenching of 42CrMo4 steel,
Proceedings of the Fourth International Conference on Quenching and the Control of
Distortion, Beijing
[4.] GRUM, Janez, RAVNIK, Franc. Investigation of sound phenomena during quenching
process. Int. J. Mater. Prod. Technol., 2006, vol. 27, no. 3/4, str. 266-288. [COBISS.SI-
ID 9847835]
[5.] udina M. (2001): Technical Acoustics - Measuring, evaluation and decreasing noise
and vibration (in Slovene: Tehni na akustika – merjenje, vrednotenje in zmanjševanja
hrupa in vibracij), University of Ljubljana, Faculty of Mechanical Engineering
[6.] Grum J., Boži S. (1999): Influence of various quenching oils and polymeric water
solutions on mechanical properties of steel, ASM Heat Treating Society, The 3rd
International Conference on Quenching and Control of Distortion, Eds.: G.E. Totten, B.
Liš i , H.M. Tensi, Prague, Czech Republic, 530-541.
[7.] Grum J., Bozi S. Zupan i M., (1999): Influence of quenching process parameters on
residual stresses in steels, ASM Heat Treating Society, The 3rd International
Conference on Quenching and Control of Distortion, Eds.: G.E. Totten, B. Liš i , H.M.
Tensi, Prague, Czech Republic, 530-541.
[8.] Grum J., Boži S., Lavri R. (1998): Influence of Mass of Steel and a Quenching Agent
on Mechanical Properties of Steel, Heat Treating, Proceedings of the 18th Conference,
Including the Liu Dai Memorial Symposium, ASM International, The Materials
Information Society, Eds.: R.A. Wallis, H.V. Walton, 645-654.
[9.] Leighton T. G. (2001): The Acoustic Bubble, Academic Press, 613 p.
Macherauch E., Vohringer O. (1992): Residual Stresses After Quenching, Eds.: B.
Liš i , H.M. Tensi, W. Luty: Theory and Technology of Quenching, A Handbook,
Springer-Verlag Berlin, Heidelberg, 117-181.