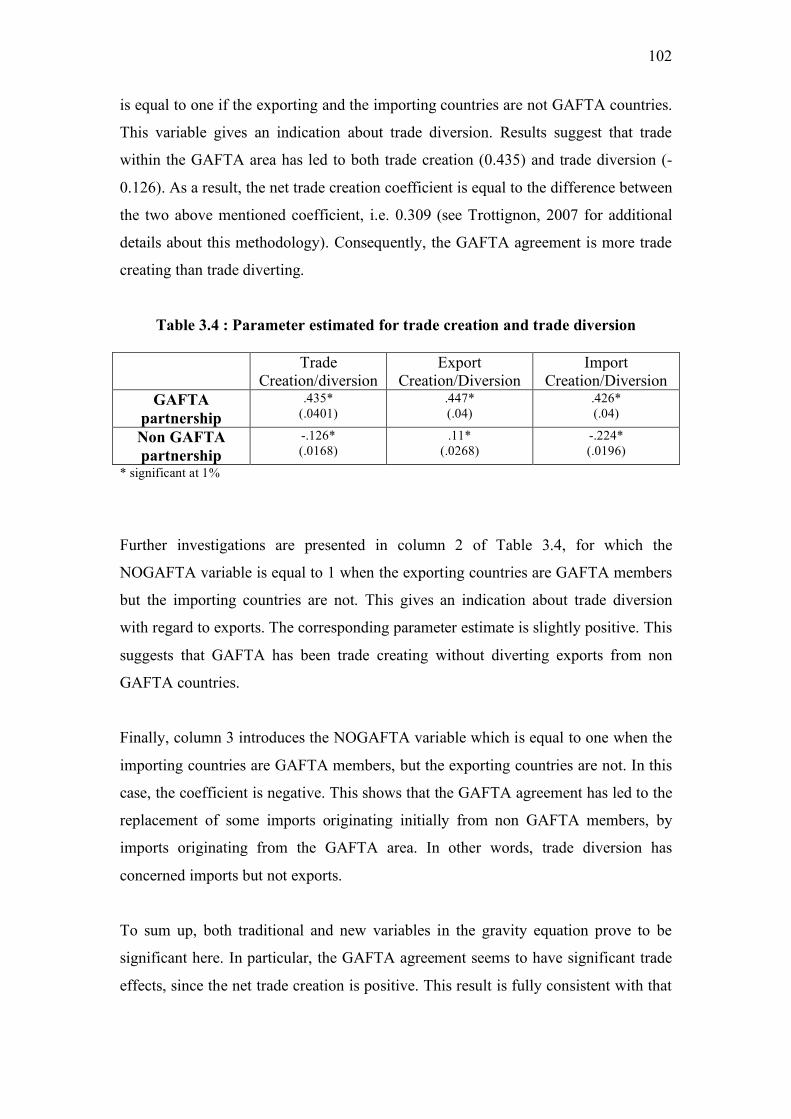
In collaboration with: Ahmed Ghoneim, Cairo University, Faculty of Economics and Political Science, Egypt September 2008 FEMISE RESEARCH PROGRAMME 2007-2008 Research n°FEM32-03 Directed By Nicolas Péridy, Université de Nantes, Laboratoire d’Economie de Nantes, France Ce rapport a été réalisé avec le soutien financier de l’Union Européenne au travers du Femise. Le contenu du rapport relève de la seule responsabilité des auteurs et ne peut en aucun cas être considéré comme reflétant l’opinion de l’Union Européenne. This document has been produced with the financial assis- tance of the European Union within the context of the FEMISE program. The contents of this document are the sole respon- sibility of the authors and can under no circumstances be regarded as reflecting the position of the European Union. The Greater Arab Free Trade Area: An ex-post appraisal within an imperfect competition framework
Transcript
In collaboration with:
Ahmed Ghoneim, Cairo University, Faculty of Economics and Political Science, Egypt
September 2008
F E M I S E R E S E A R C HP R O G R A M M E
2007-2008
Research n°FEM32-03Directed By
Nicolas Péridy, Université de Nantes, Laboratoire d’Economie de Nantes, France
Ce rapport a été réalisé avec le soutien financier de l’Union Européenne au travers du Femise. Le contenu du rapport relève de la seule responsabilité des auteurs et ne peut en aucun cas être considéré comme reflétant l’opinion de l’Union Européenne.
This document has been produced with the financial assis-tance of the European Union within the context of the FEMISE program. The contents of this document are the sole respon-sibility of the authors and can under no circumstances be regarded as reflecting the position of the European Union.
The Greater Arab Free Trade Area: An ex-post appraisal within an imperfect
competition framework
1
The Greater Arab Free Trade Area:
An ex-post appraisal within an imperfect competition framework
FEMISE Project n°32-03
Directed by Prof. Nicolas Péridy (Université de Nantes, France)
Team :
- Nicolas Péridy (Université de Nantes, Laboratoire d’Economie
de Nantes, France)
- Ahmed Ghoneim (Cairo University, Faculty of Economics and
Political Science, Egypt)
September 2008
2
Table of Contents
List of Acronyms…………………………………………………………………….. 3
Executive Summary…………………………………………………………………. 4
Résumé ……………………………………………………………………………... 11
Introduction…………………………………………………………………………. 18
1. Regional Integration and Trade in the Arab world ……………………………… 29
1.1 Overview of Arab Integration and GAFTA contents ………………………. 29
1.1.1 Short History of Arab Integration……………………………………29
1.1.2 A Short Literature Review on GAFTA……………………………... 35
1.2 Trade patterns in the GAFTA area…………………………………………. 40
1.2.1 Overall Trends in Intraregional Arab Trade………………………… 40
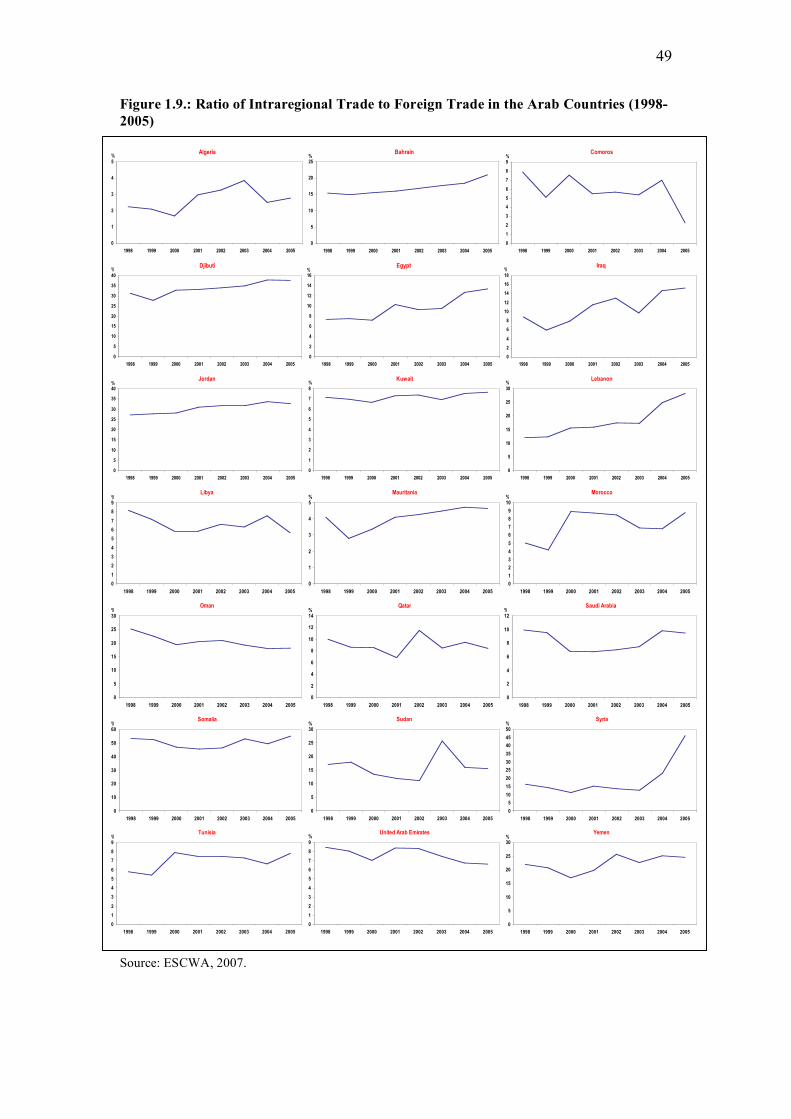
1.2.2 Analysis at Country Level………………………………………….. 47
1.2.3 Analysis at Commodity Level……………………………………… 50
2. Welfare effects of GAFTA: from theory to inquiries
2.1 A short survey of the theory of PTAs……………………………………60
2.2 Welfare effects of free trade area: A generalized model in imperfect
competition…………………………………………………………………. 65
2.3 An application to GAFTA countries: Results from a regional inquiry…. 70
3. Trade effects of GAFTA: A quantitative assessment ……………………………..89
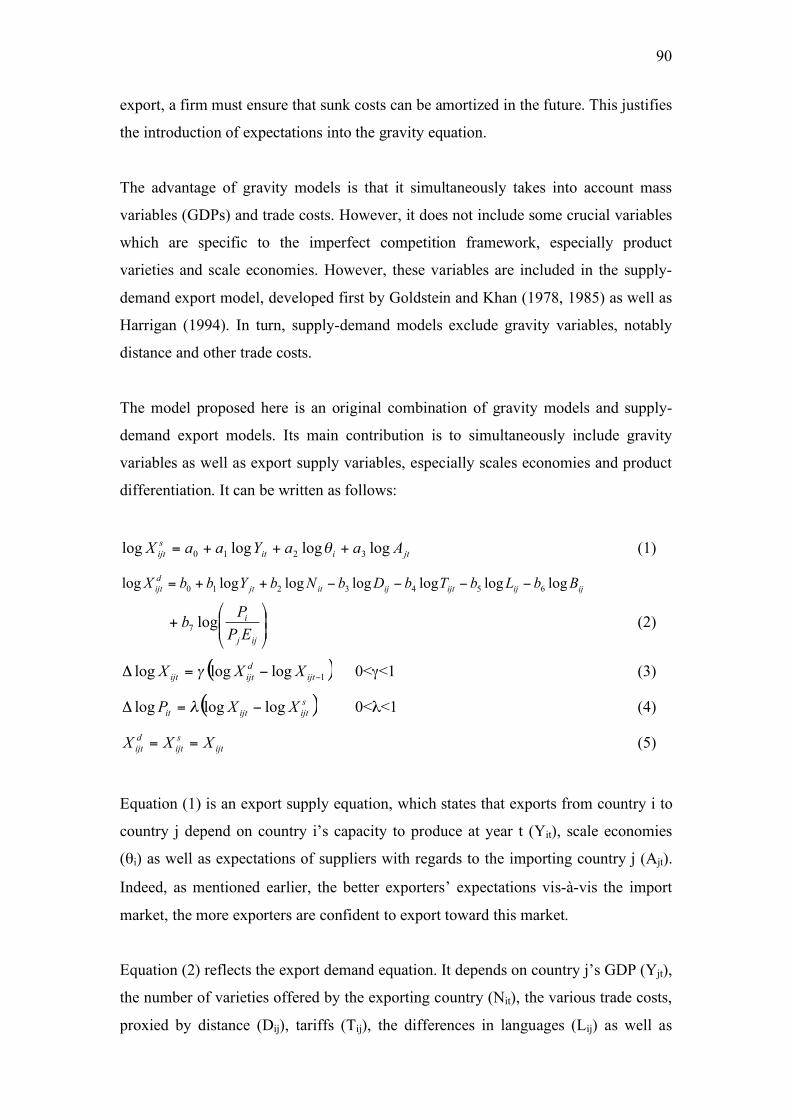
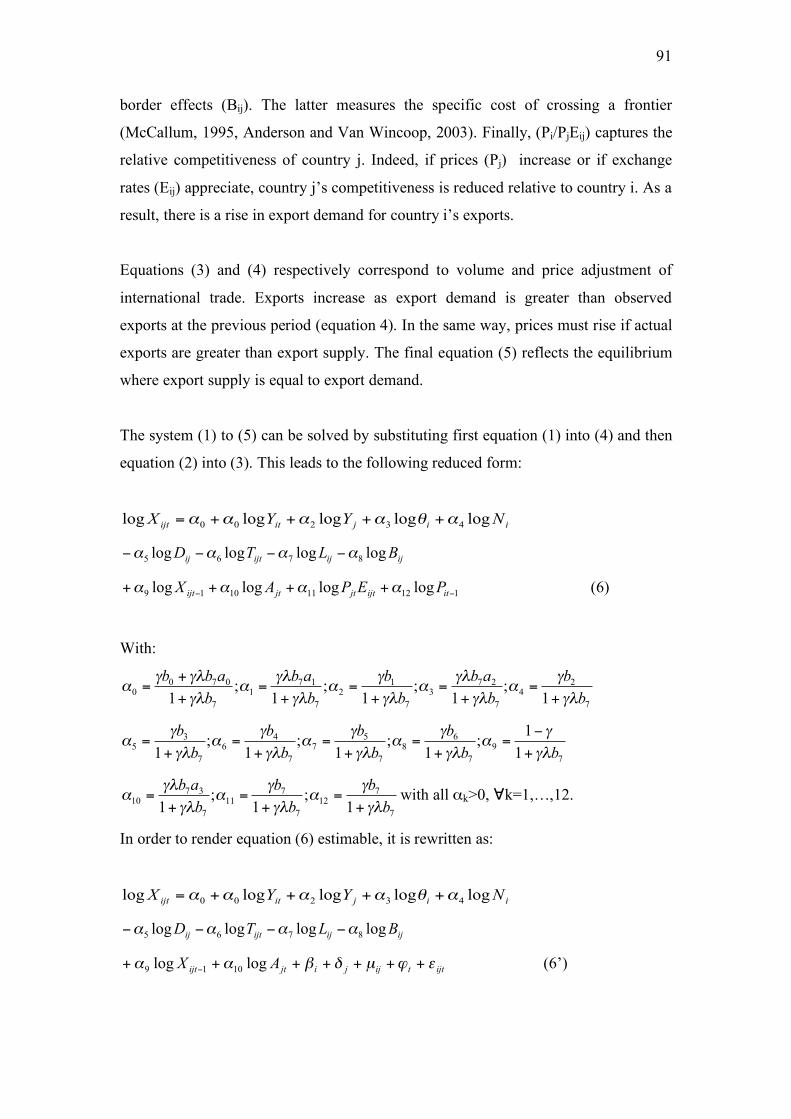
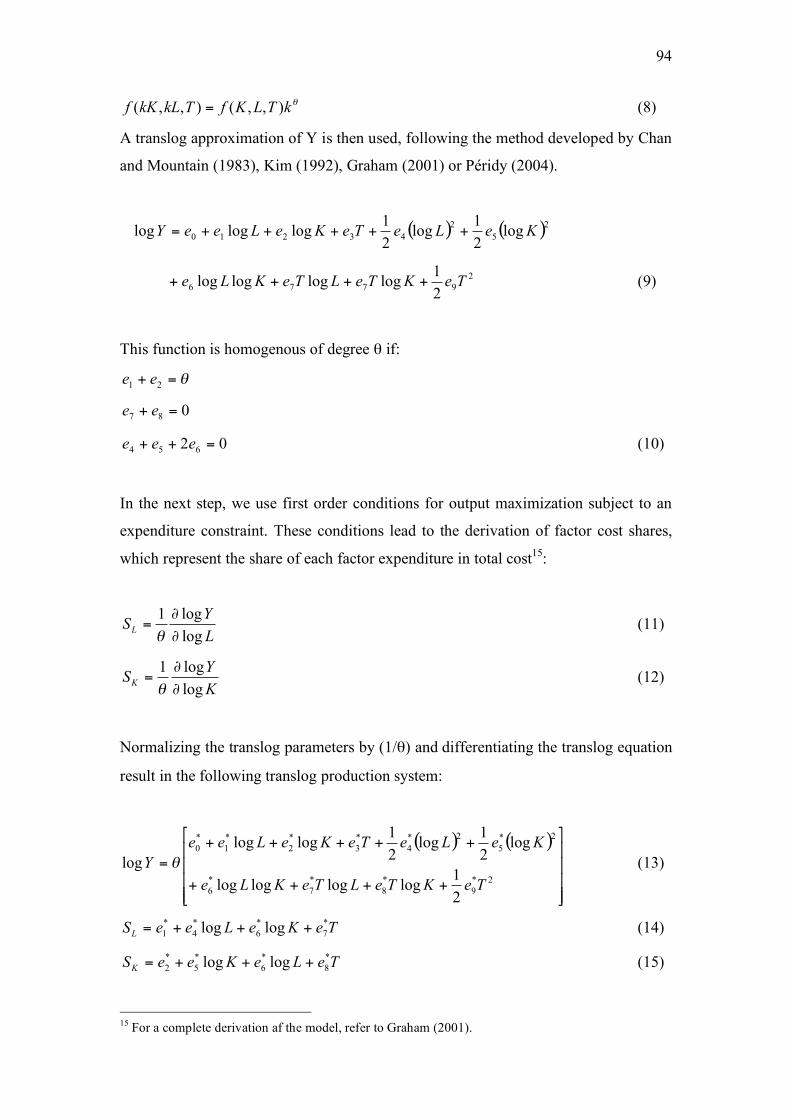
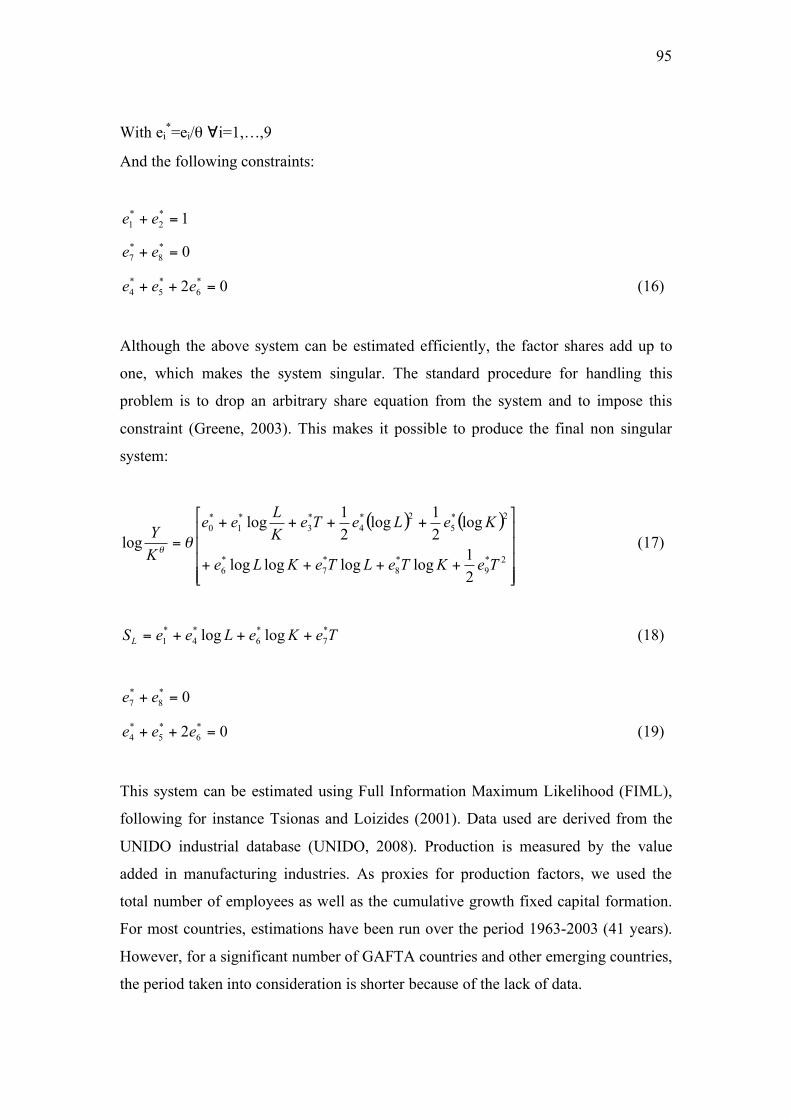
3.1 The model ………………………………………………………………. 89
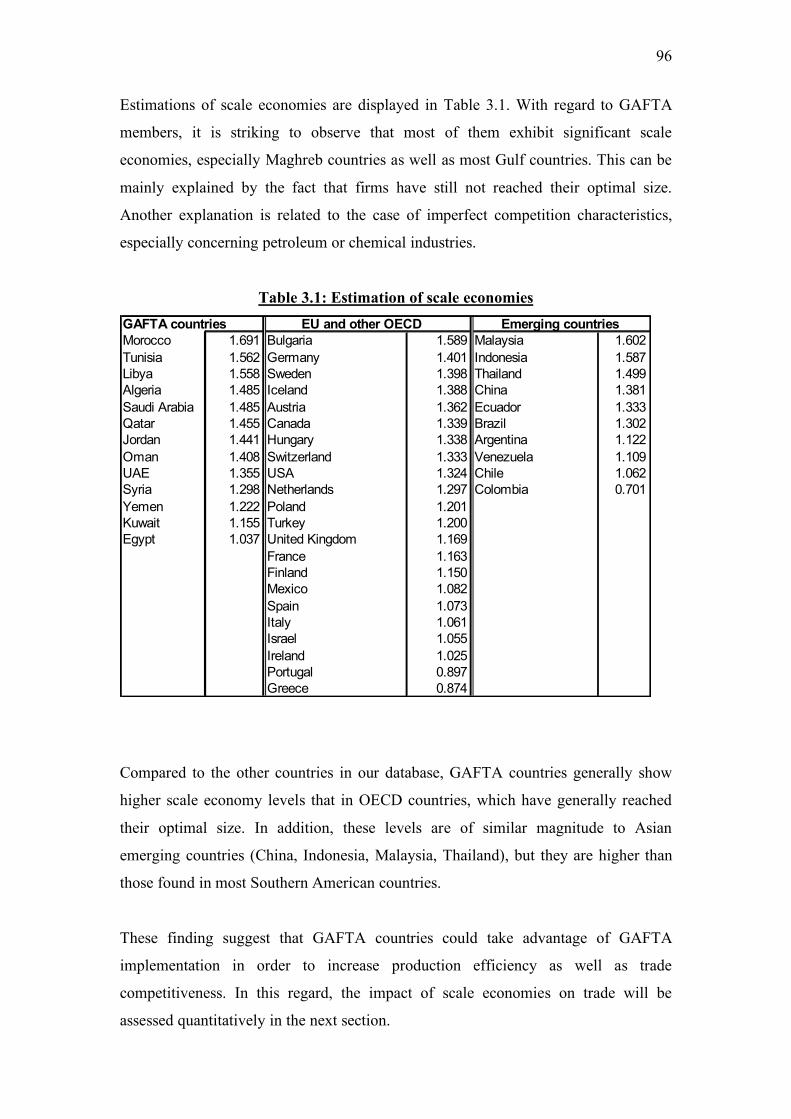
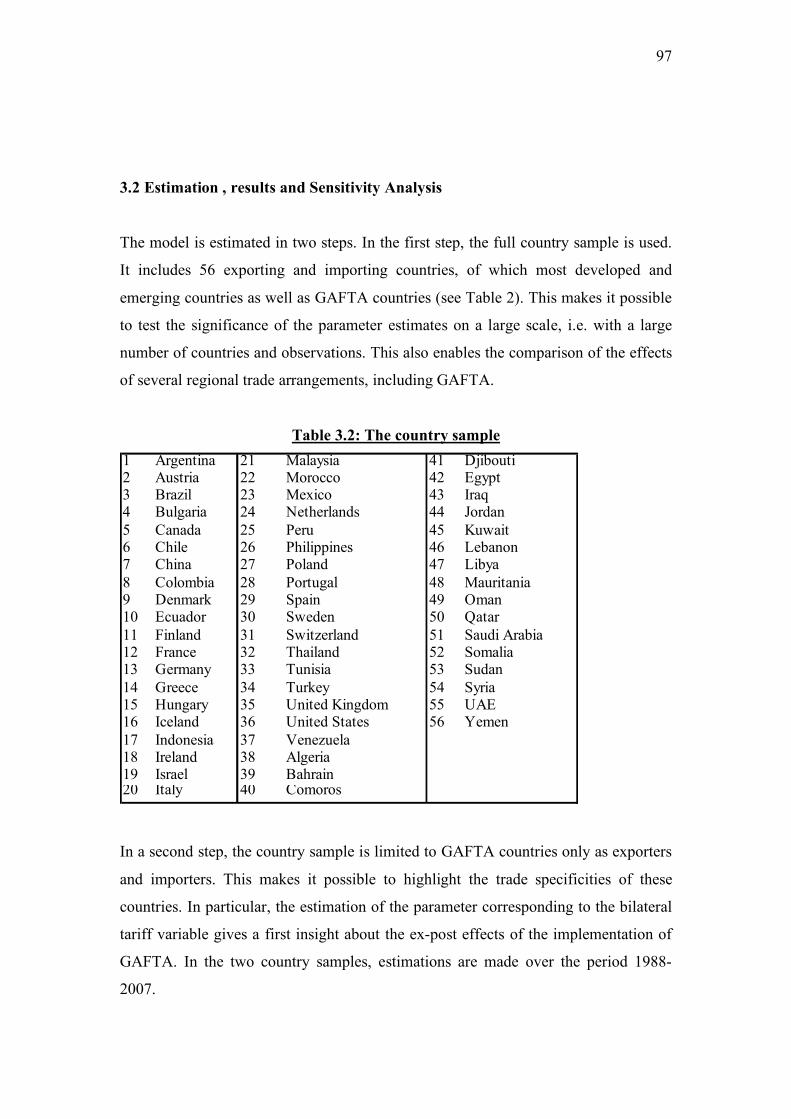
3.2 Estimation, results and sensitivity analysis……………………………. 97
Conclusion and policy recommendations………………………………………… 111
Annexes…………………………………………………………………………... 114
3
List of Acronyms:
ACM: Arab Common Market Agreement
AEUA: Arab Economic Unity Agreement
AFDT : Agreement on Facilitation and Development of Trade
AMU: Arab Maghreb Union
APEC: Asia-Pacific Economic Cooperation
ASEAN: the Association of South-East Asian Nations
ATFRTT: Agreement on Trade Facilitation and Regulating Transit Trade
CGE: Computable General Equilibrium
COMESA: Common Market for Eastern and Southern Africa
ESC: Economic and Social Council
EU: European Union
FDI: Foreign Direct Investment
FTA: Free Trade Area
GAFTA: Greater Arab Free Trade Area
GCC: Gulf Cooperation Council
LAN: League of Arab Nations
MENA: Middle-East and North Africa
NTBs: Non Tariff Barriers
PTA: Preferential Trading Arrangement
RTAs : Regional Trade Agreements
TJDEC: Treaty for Joint Defense and Economic Cooperation
4
Executive Summary
The aim of this research project is to provide some new and original insight
concerning the GAFTA welfare and trade impact, 10 years after the implementation
of this agreement. This project starts with the description and a critical analysis of
economic integration and trade in the Arab world in the past decades. Particular
emphasis is put on the provisions included in the GAFTA agreement. Its limitations
are also discussed. Recent patterns in regional integration are also compared with the
analysis of trade flows in Arab countries, especially since the implementation of the
GAFTA agreement in 1998.
The next parts of the project are based on a twofold approach which relies on new
theoretical developments in regional economic integration. The first approach
involves a theoretical model of regional integration, followed by inquiries
implemented in selected GAFTA countries and selected industries. This approach
makes it possible to highlight several possible welfare effects of economic integration
in the Arab region. It does not only include the gains related to the perfect competition
framework (exploitation of comparative advantage, more efficient use of factors of
production) but also the additional gains due to imperfect competition (terms of trade
improvement, reduction in trade costs, existence of scale economies, greater product
varieties for consumers) as well as dynamic effects (increase in foreign direct
investment, growth effects) and the impact of economic distortions (taxes/subsidies).
This qualitative analysis is complemented by an empirical model (representing the
second approach) which aims to quantify the trade effects of GAFTA. This model is
an original combination of gravity models and supply-demand export models. Its
main contribution is to simultaneously include gravity variables as well as export
supply variables, especially scales economies and product differentiation. This model
is subsequently estimated in order to calculate the effect of GAFTA on intra-regional
trade, by using several appropriate estimators, of which Hausman and Taylor (which
tackle endogeneity problems), GMM in dynamic models as well as transformed fixed
and random effect models (for addressing multiple heterogeneity concerns).
5
The main results of this study are the following:
1. Although the first attempt for regional integration dates back to the 1950s, the
GAFTA agreement is certainly the most outreaching one. Indeed, tariffs
have been fully eliminated on 1.1.2005; currently, it covers 17 countries in the
Arab region; it relies on a negative list approach; it includes agricultural
products as well as an additional regional agreement concerning trade
liberalization of services signed in 2003 in addition to research and
technological cooperation.
2. However, the GAFTA agreement shows some limitations. First, although
tariffs have been removed, some GAFTA members have introduced new trade
barriers, which can be taxes or other NTBs. Secondly, the GAFTA agreement
remains a perfect example of “shallow integration”. It suffers a number of
problems, including the absence of full fledge dispute settlement mechanism
(although there are efforts to have one), the inability to reach a detailed rules
of origin scheme1, a weak system of harmonized standards, the lack of
harmonization of competition rules as well as the lack of protection of
intellectual property rights. In addition, there is no provision for labour
movement. Finally, there is a lack of supra-national institutions or a strong
leading Arab country to solve the problem of disputed matters. In other words,
mainly all aspects of “deep” integration are absent from GAFTA.
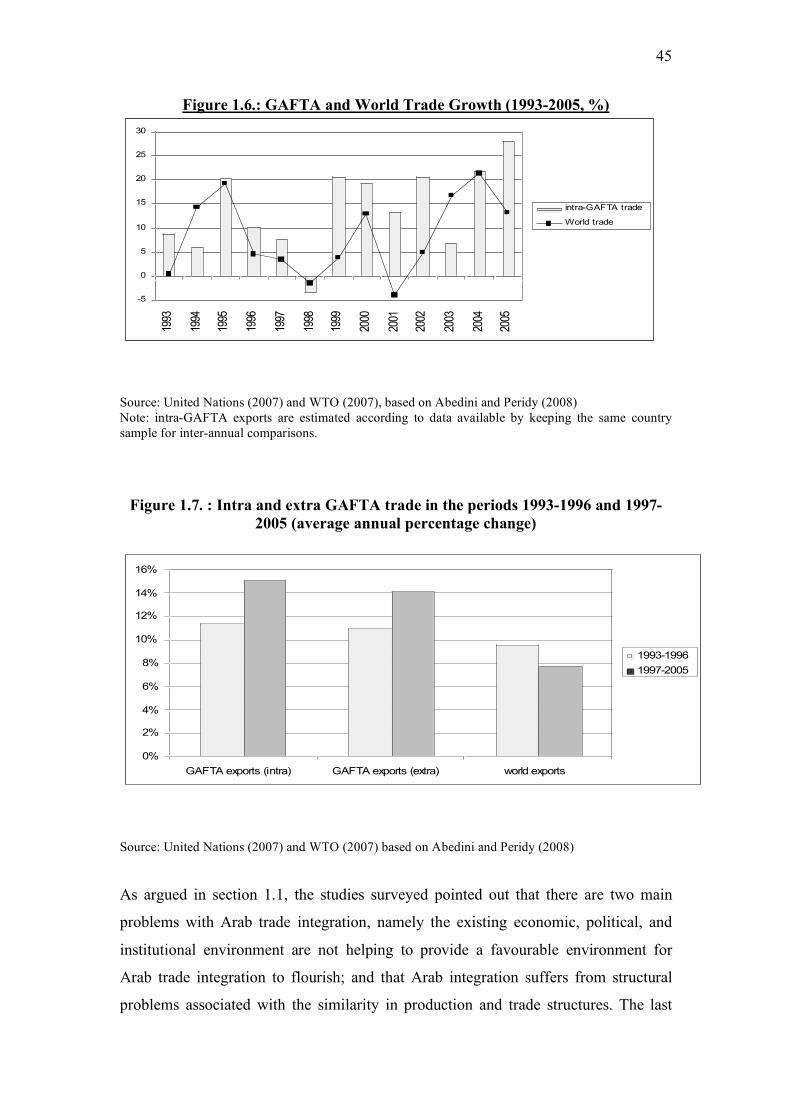
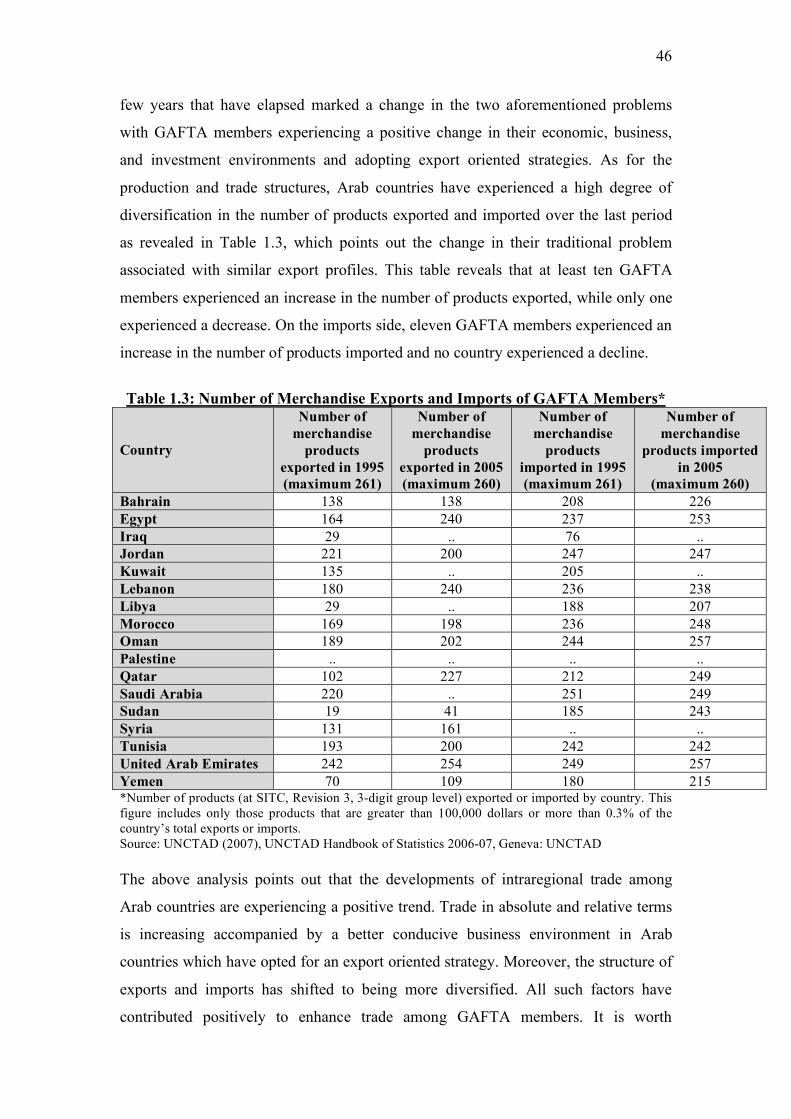
3. Intra-GAFTA trade has significantly increased since GAFTA
implementation in 1997 (+15% at a yearly average since 1997). This increase
is greater than world exports (8%) and than extra-GAFTA exports (14%).
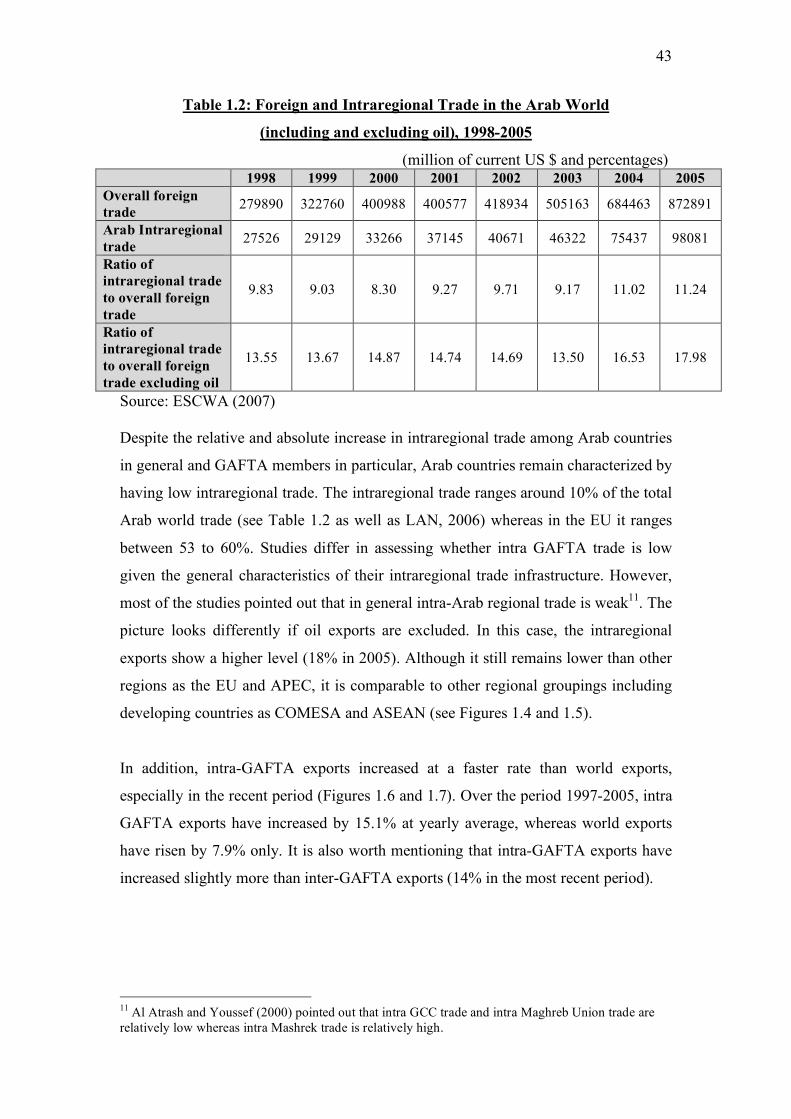
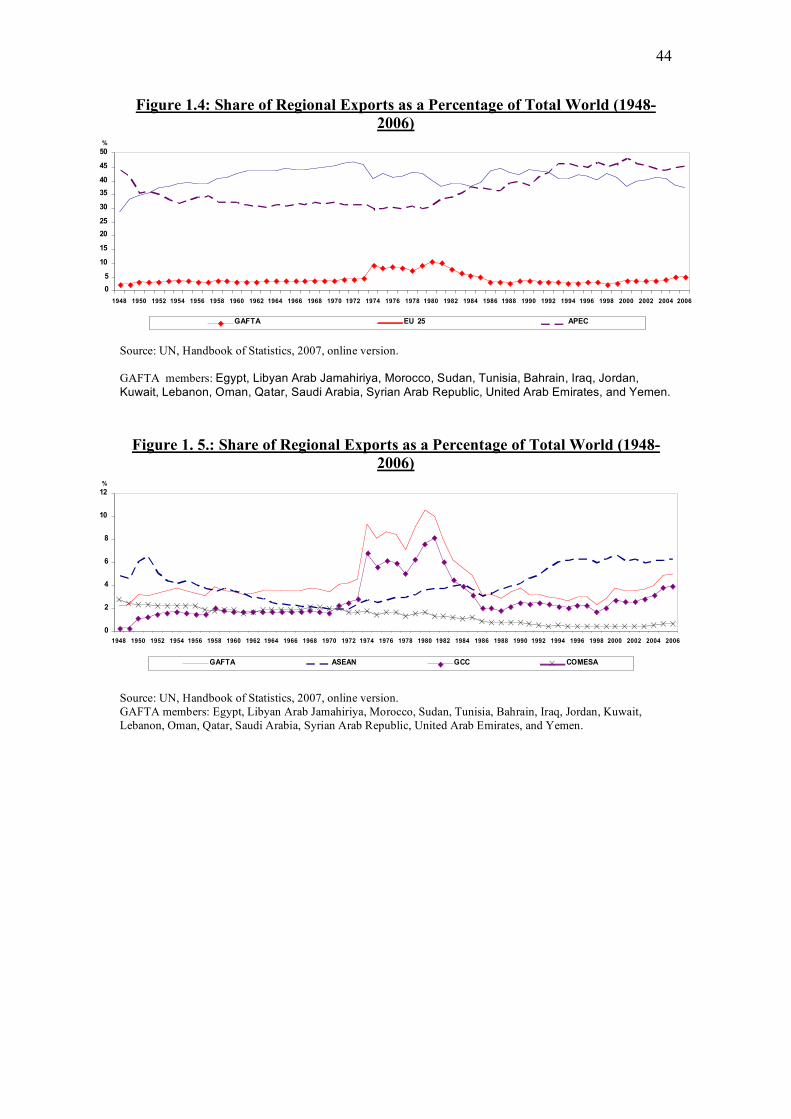
4. As a proportion of total trade, intra-regional trade increased from 9.8% in
1998, to 11.2% in 2005. When excluding oil products, this share rose from
13.5% to 18.0% over the same period. This intra-regional trade share is
comparable to some other regional grouping such as COMESA or ASEAN.
However, it remains much lower than intra-regional trade in the EU or the
APEC.
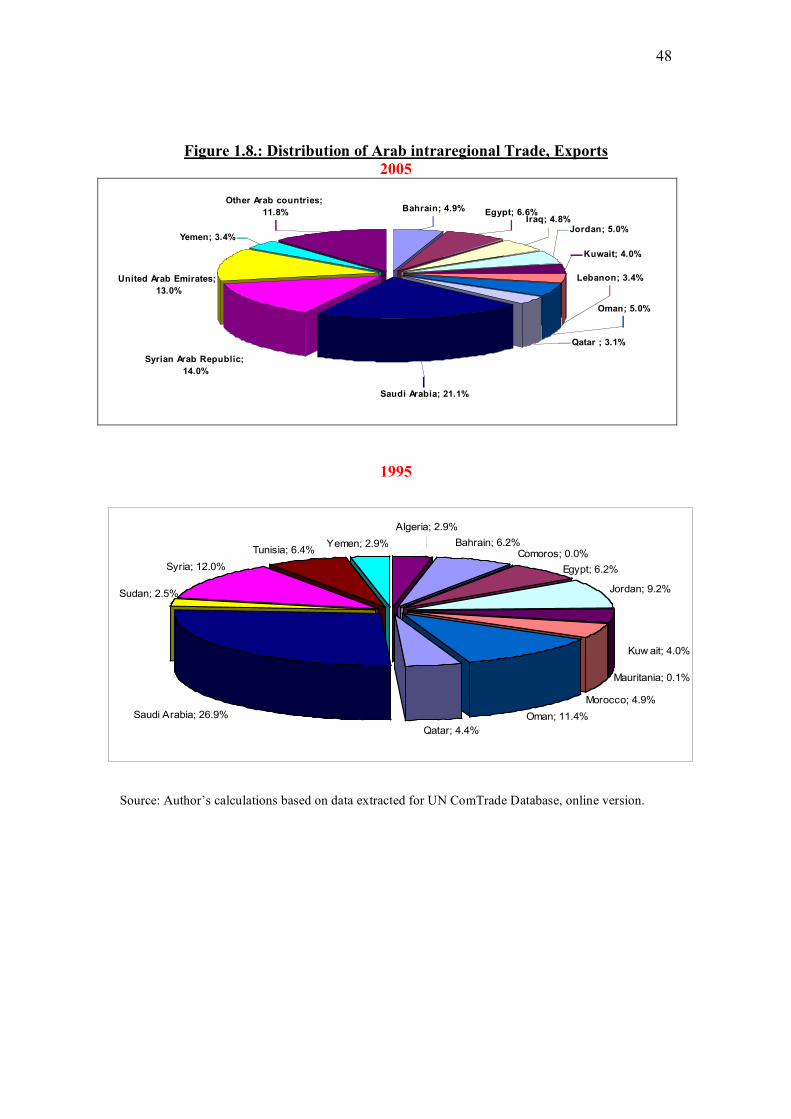
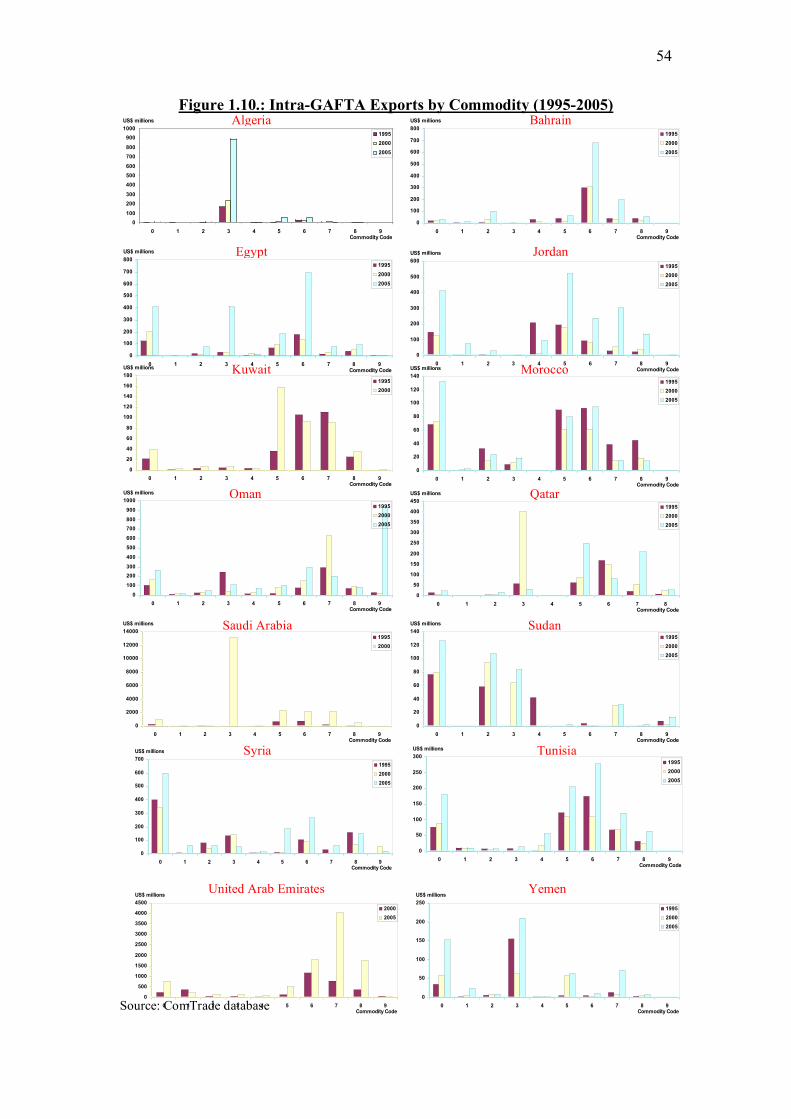
5. More precisely, there are differences across countries and commodities. For
example, some countries have strongly increased their intra-regional trade
1 Although a detailed system has finally been implemented in July 2008, it does not cover all goods; In addition, an assessment of this system is needed after its implementation.
6
(Egypt, Jordan, Lebanon, Syria, Tunisia) whereas some other have
experienced a stability or even a decline (mainly Gulf countries). At industry-
level, the most important increase in intra-regional trade concerns food,
manufactured products as well as machinery and transport equipment.
Conversely, crude material, oil and fats have not enjoyed such an increase.
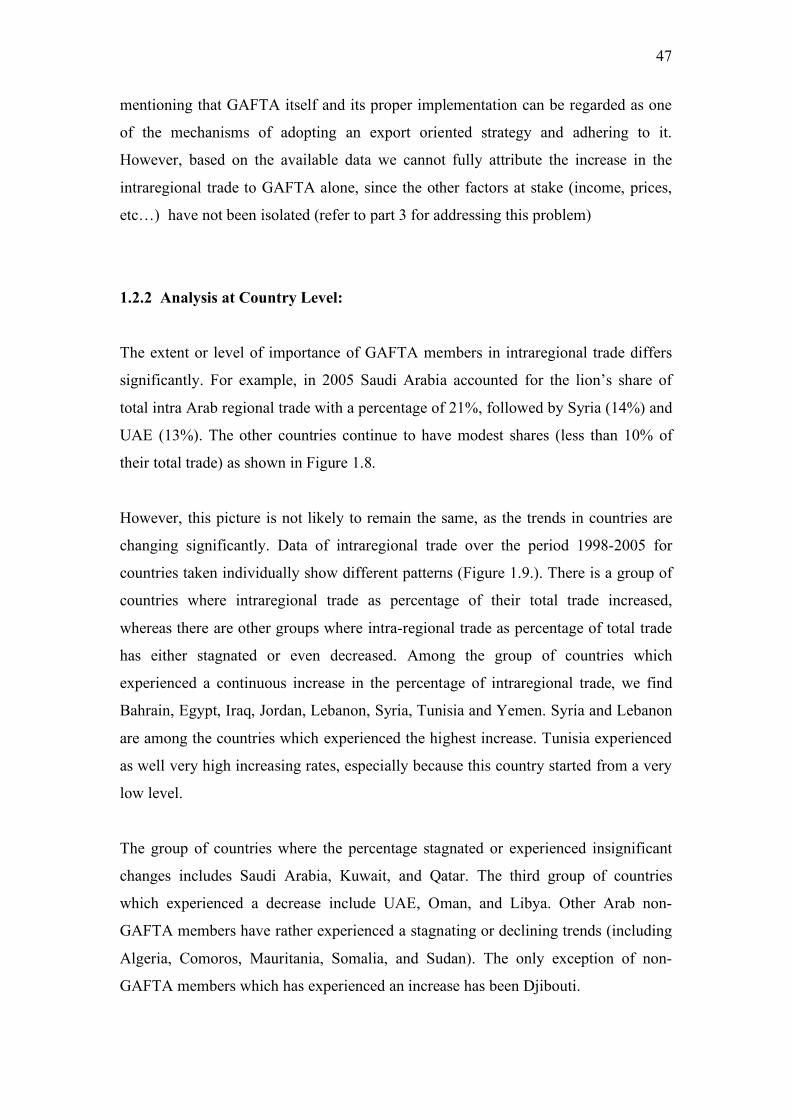
6. Arab countries have succeeded to some extent in diversifying the products
exported or imported. As a matter of fact, eight Arab countries have exported
more than 200 products in 2005 (at 3-digit group level), against three countries
only in 1995.
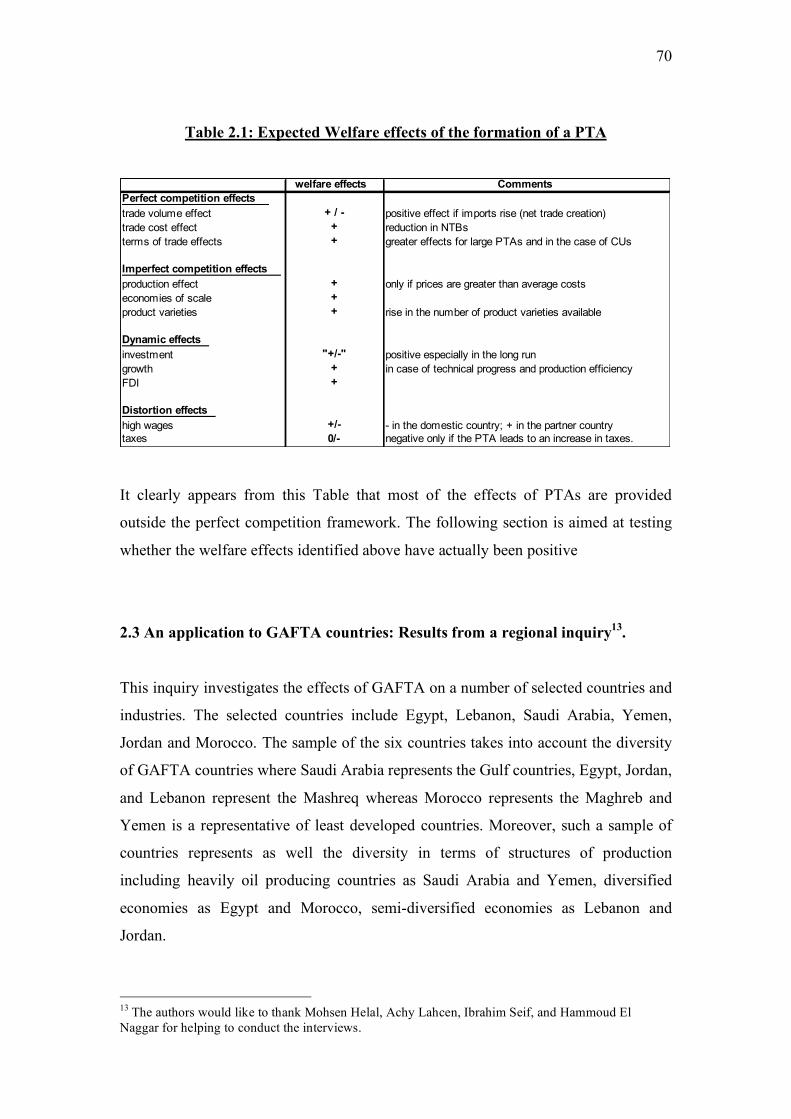
7. The extended theoretical model of regional integration in imperfect
competition (presented in Part 2) makes it possible to state that welfare effects
due to regional integration can be decomposed in different channels:
a. Perfect competition effects (trade volume, trade costs)
b. Terms of trade effects
c. Imperfect competition effects (production, scale economies, product
varieties)
d. Dynamic effects (investment, growth, FDI)
e. Economic distortion effects (wages, domestic taxes)
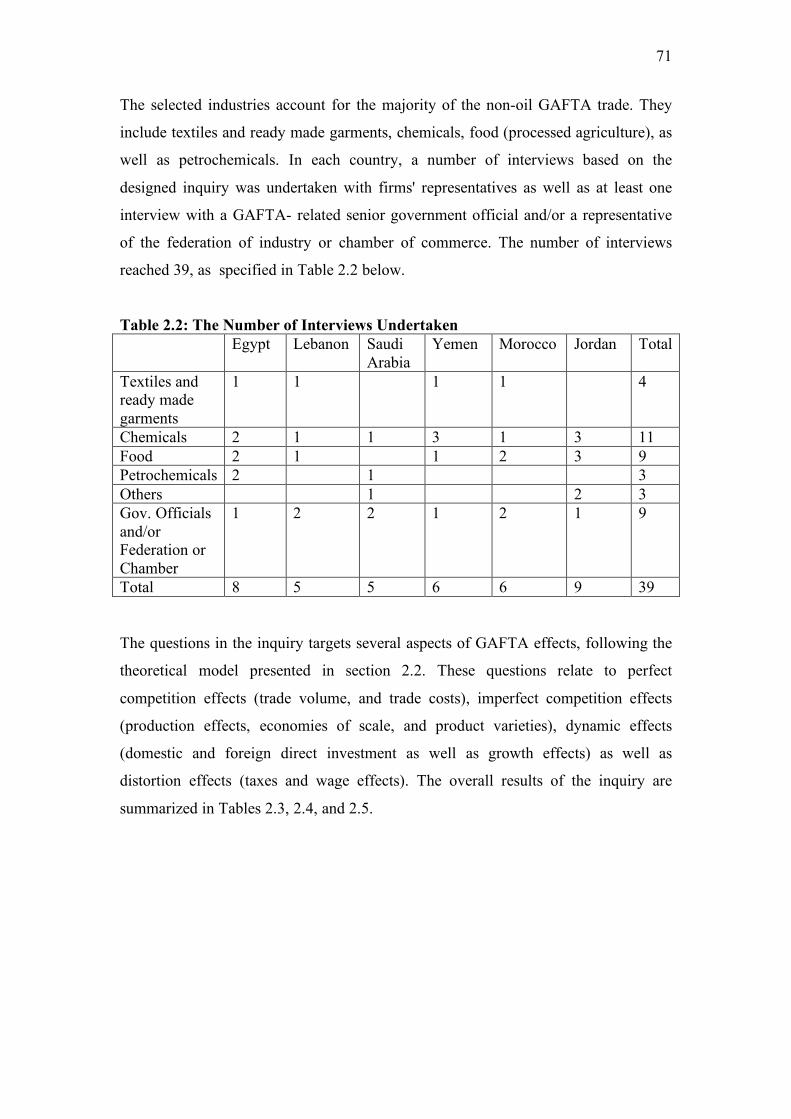
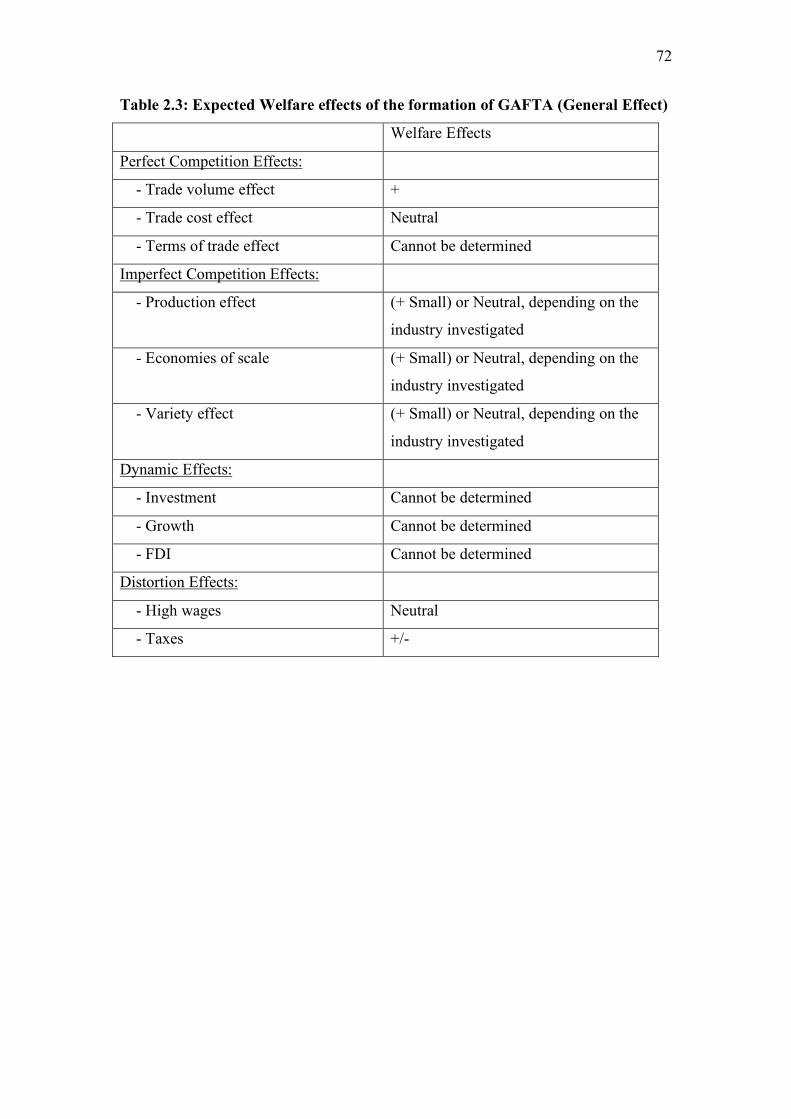
8. An application of this model to GAFTA countries through an appropriate
inquiry reveals that:
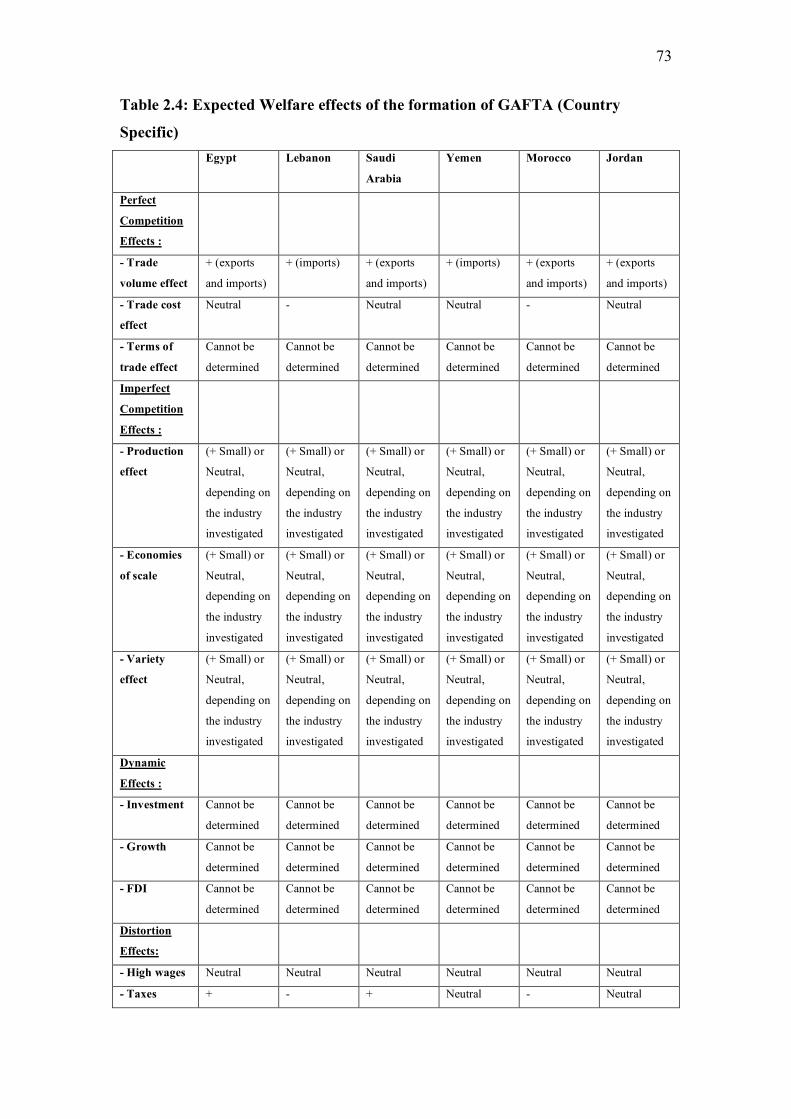
a. GAFTA has a positive effect on the volume of intra-regional trade.
There are however some differences across countries and industries.
As a matter of fact, almost all countries seem to have enjoyed positive
trade effects, with the possible exception of Lebanon, for which the
firms investigated complained about differences in energy prices due
to subsidies in the other GAFTA countries. This has created an unfair
competition situation where Lebanese firms are disadvantaged in the
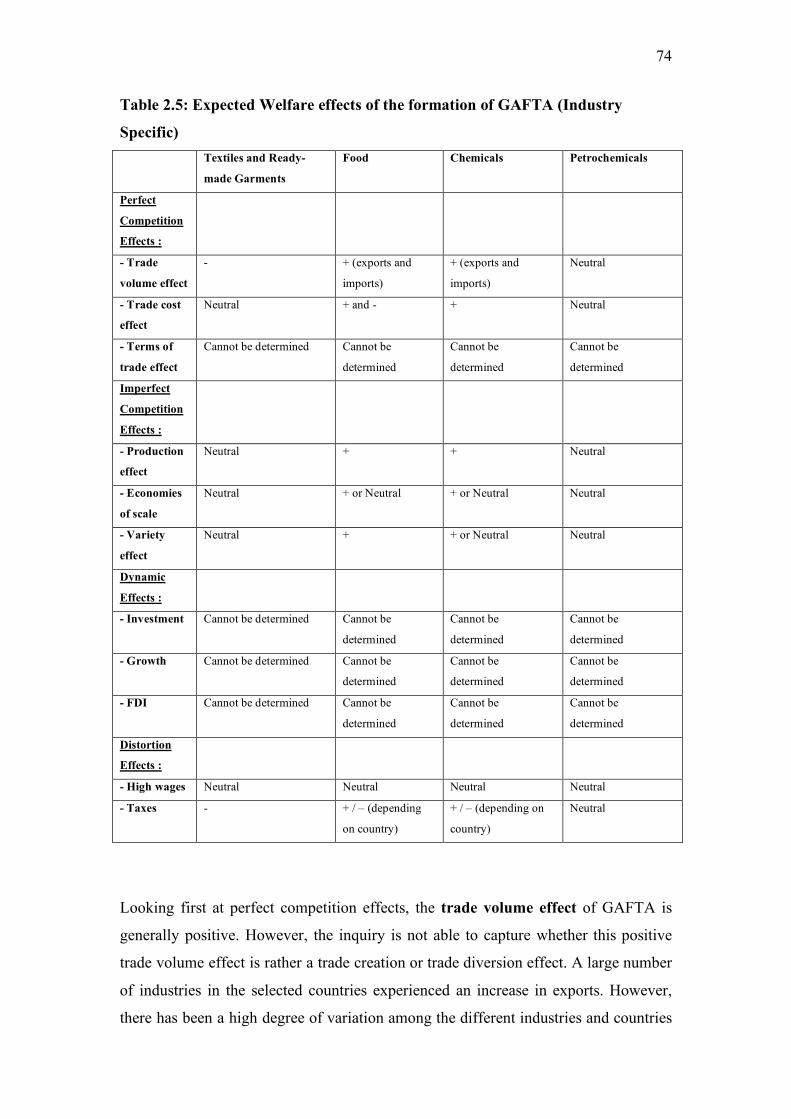
GAFTA regional market. Turning to industry-specific effects, the food
industry and chemicals have taken advantage of GAFTA, whereas
textile and clothing have not enjoyed intra-regional trade liberalization
so much, for several reasons (increased NTB, dumping, absence of
differences in production costs and consumer tastes across countries,
etc…).
7
b. The reduction in NTBs has a neutral effect, since this reduction
provided by the GAFTA agreement has been supplemented by the
erection of new NTBs by some GAFTA members.
c. Imperfect competition effects (production effect, scale economies,
product varieties) are only slightly positive. This result contrasts to
the very positive effects recorded for North-North regional integration,
especially the EU. Several reasons can explain this difference: the
persistence of NTBs which impede strong production effects and scale
economies, the lack of product differentiation which impedes product
variety effects, the lack of taste differences. As a result, trade is mainly
inter-industrial with small imperfect competition effects. Finally, the
lack of deep integration is a brake for creating a real single market
where production effects and scale economy can really occur.
d. Distortion effects have a significant impact, especially differences
in taxes/subsidies across countries. Some countries take advantage of
subsidizing their own production and exports (especially Saudi Arabia,
the United Arab Emirates and Egypt) at the expense of the countries
with the lowest subsidies (Lebanon).
e. Terms of trade effects and dynamic effects have not been
determined. This is mainly due to the fact that the firms interviewed
cannot identify the complex link between economic integration and its
indirect effects on prices, investment, FDI or growth.
9. In part 3, an original trade model based on new developments in gravity
models as well as export-demand model is proposed. It makes it possible to
identify the following trade determinants
a. The traditional gravity variables (GDP, distance, common language)
b. Trade costs variables (border effects, regional economic integration)
c. Imperfect competition variables (scale economies, product varieties)
d. Expectations
e. Hysteresis due to sunk costs
10. An application of this model to GAFTA countries through a set of appropriate
econometric estimators (Hausman and Taylor, Arellano, Bond and Bover,
Transformed fixed and random effects models, etc…) makes it possible to
8
quantify the impact of the above variables on intra-regional trade in GAFTA
countries. This leads to the following results:
a. Standard perfect competition trade effects significantly affect
trade (GDP and distance).
b. The trade effect of the GAFTA agreement is positive. In particular,
the model exhibits a significant trade creation. Small trade diversion is
highlighted for imports but not for exports. Overall, the net trade
creation is positive. It is estimated to be about 26% of GAFTA trade.
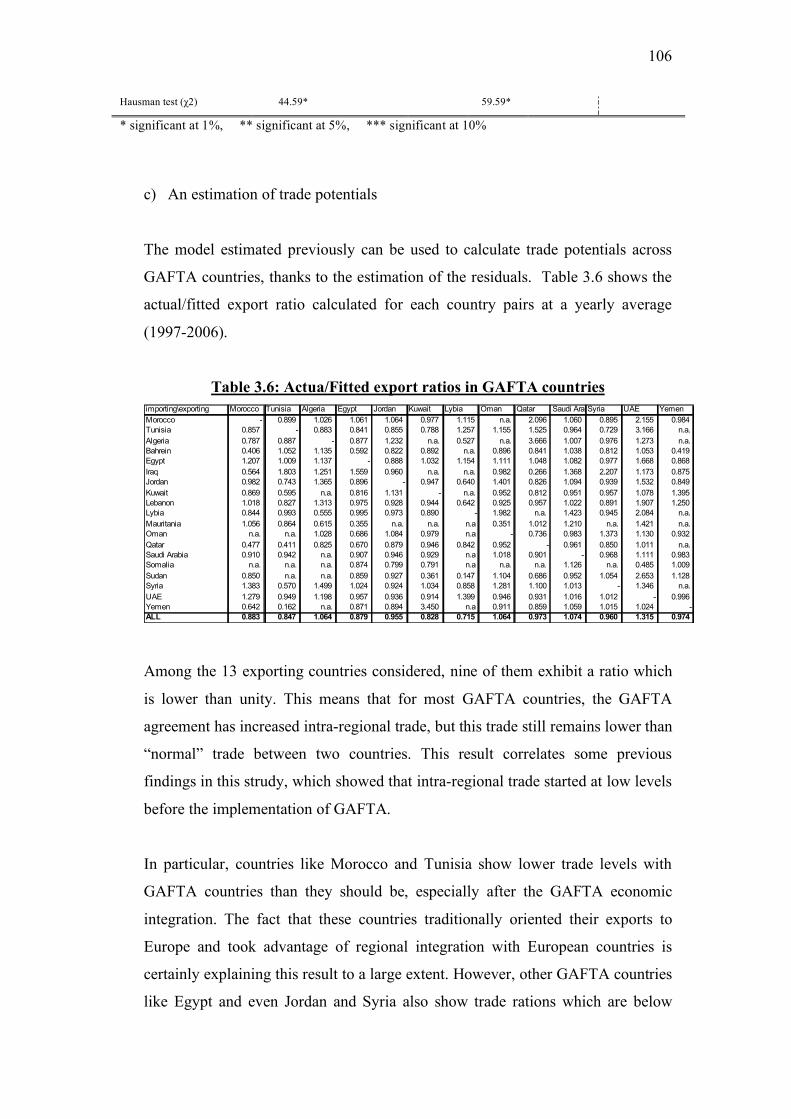
c. However, most countries exhibit current trade levels which are below
their fitted levels, as showed by the calculation of export potentials.
This suggests that the GAFTA agreement has not made it possible
to increase regional trade above its “normal” level, especially in
Morocco, Tunisia, but also Egypt, Jordan and Syria.
d. Imperfect competition effects are small. In particular, although scale
economies are significant in GAFTA countries, they hardly increase
trade flows. These results correlate those already found qualitatively
with the inquiry. Again, the main explanation may be found in market
structures, where products are poorly differentiated, consumer tastes
are similar and trade is mainly inter-industrial. In addition, the absence
of deep integration impedes GAFTA countries to take advantage of
existing scale economies, since the remaining NTBs makes it difficult
to exploit the economies by producing for a large unified market.
11. The main policy implications which can be drawn from the results are the
following. If the objective is to enhance the trade and welfare effects of
regional integration in the GAFTA region, several policies can be undertaken:
a. All the loopholes in the current agreement should be fully addressed
and further step toward deep integration must be achieved: In
particular, progress must be made in favour of the adoption of clear
and detailed rules of origin, the actual removal of new NTBs and trade
frictions among GAFTA members, the adoption of common standards,
the free movement of entrepreneurs, the protection of intellectual
property, etc…Such a deep integration will not only increase direct
trade effects of regional integration, but also increase indirect effects
9
(scale economies, and dynamic effects) through the establishment of
solid foundations toward a more integrated area. In this regard, it is
worth mentioning that liberalization of trade in services on a GATS+
approach will surely have a positive impact on deepening integration
among GAFTA members.
b. Another mean to enhance GAFTA integration could be achieved
through the cumulation of rules of origin among some of the GAFTA
members in their other regional agreements as Agadir. The utilization
of such cumulation schemes is likely to force GAFTA countries to
cooperate and is likely to result in better allocation of resources.
c. There is a need to design a system which ensures that domestic
distortions do not yield negative spillovers on GAFTA members.
The case of different systems of energy pricing in GAFTA members
has proved to have negative effects, especially for Lebanon. Hence, at
least rules governing subsidies should be fully articulated and
efficiently implemented within GAFTA.
d. GAFTA members should start cooperating on enhancing regional trade
and investments in sectors that have proved to have benefited so far
from GAFTA as food and some chemicals industries. Moreover, the
NTBs that are affecting intra-regional trade in other sectors as textiles
should be seriously tackled.
e. There is a need to start a serious program on building a comprehensive
database and information system on intraregional trade and investment
opportunities. In addition, since there is still a lack of knowledge of the
GAFTA agreement and its provisions in many firms, more information
should be provided concerning regional economic integration in the
Arab world.
f. From a political point of view, it is also crucial that GAFTA countries
can rely on a closer political cooperation as well as on common
institutions that can make possible to control trade liberalisation in the
region and solve trade disputes.
g. More generally, conditions for economic growth should be
developed, such as the reform of the states, the development of cross-
regional infrastructures, such as railway and highways, progress
10
toward more trade and FDI liberalisation not only within the GAFTA
area but also with the other partners, etc..
11
Résumé
Le but de ce projet de recherche est d’établir une évaluation nouvelle et originale de la
grande zone arabe de libre-échange (GAFTA), concernant ses effets sur le commerce
et le bien-être. Cette recherche débute par une description et une analyse critique des
échanges et de l’intégration régionale dans le monde arabe. Une attention particulière
est portée sur les dispositions de l’accord GAFTA, ainsi que ses limites. L’analyse de
l’intégration régionale est également reliée à l’analyse des échanges dans la zone, en
particulier depuis la signature de l’accord GAFTA en 1998.
Les parties suivantes sont consacrées à une double approche, fondée sur des théories
récentes de l’intégration régionale. La première approche consiste en des enquêtes
mises en œuvre dans divers pays et diverses branches de la zone GAFTA. Ces
enquêtes permettent de mettre en lumière plusieurs effets sur le bien-être, effets liés à
l’intégration régionale dans la zone arabe. Ils incluent non seulement les gains en
concurrence parfaite (exploitation des avantages comparatifs, utilisation plus efficace
des facteurs de production) mais aussi les gains supplémentaires en concurrence
imparfaite (amélioration des termes de l’échange, réduction des coûts à l’échange,
existence d’économie d’échelle, élargissement du choix de variété des produits pour
le consommateur) ainsi que les effets dynamiques (hausse des investissements directs
étrangers, effets sur la croissance) et l’impact des distorsions économiques
(impôts/subventions).
Cette analyse qualitative à l’échelle micro-économique est ensuite complétée par un
modèle empirique, correspondant à la seconde approche, destinée à quantifier les
effets de l’accord GAFTA sur les échanges. Ce modèle combine de façon originale les
modèles de gravité ainsi que les modèles d’offre-demande à l’exportation. Sa
contribution principale est d’inclure simultanément les variables gravitaires avec des
variables d’offre, en particulier les économies d’échelle et la différenciation des
produits. Ce modèle est ensuite estimé afin de calculer les effets du GAFTA sur les
échanges intra-régionaux, à partir de plusieurs estimateurs choisis, comme Hausman
et Taylor (qui tient compte du problème d’endogénéité), les GMM (modèles
dynamiques) ainsi que les modèles à effets transformés (pour tenir compte de
l’hétérogénéité multiple).
12
Les principaux résultats de la recherche sont les suivants :
1. Bien que les premières tentatives d’intégration régionale remontent aux années
cinquante, l’accord GAFTA est certainement le plus abouti. En effet, les
droits de douane ont été complètement éliminés le 1 janvier 2005 ; l’accord
couvre actuellement 17 pays dans la zone arabe ; il s’appuie sur une liste
« négative » ; il inclut les produits agricoles ainsi des accords supplémentaires
sur la libéralisation des services (signés en 2003) et sur la coopération en
matière de recherche et de technologie.
2. Cependant, l’accord GAFTA présente un certain nombre de limites.
Premièrement, bien que les droits de douane aient été éliminés, certains pays
membres ont introduit de nouvelles barrières, pouvant être des taxes ou
d’autres barrières non tarifaires (BNTs). Deuxièmement, l’accord GAFTA
reste un exemple parfait d’intégration « molle », et souffre d’un certain
nombre de limites, comme l’absence d’un mécanisme de règlement de conflits
(bien que certains efforts soient effectués en ce sens), l’absence de schéma
détaillé de règles d’origine2, la faiblesse du système d’harmonisation des
normes, l’absence d’harmonisation des règles de concurrence ainsi que
l’absence de protection des droits de propriété intellectuelle. De plus, il
n’existe pas d’accord sur la libre circulation du travail. Enfin, l’accord ne
prévoit pas la mise en place d’institutions communes ou la présence d’un Etat
arabe leader, qui pourraient permettre de résoudre les problèmes concernant
notamment les litiges commerciaux. Autrement dit, pratiquement tous les
aspects de l’intégration « profonde » sont absents de l’accord.
3. Le commerce intra-GAFTA a augmenté de façon importante depuis la
mise en place de l’accord en 1998 (+15% en moyenne annuelle depuis 1998).
Cette hausse est plus élevée que celle des exportations mondiale (9%) et que
celle des exportations extra-GAFTA (+14%).
4. En pourcentage des échanges totaux, le commerce intra-régional est passé de
9,8% en 1998 à 11,2% en 2005. En excluant les produits pétroliers, ce
pourcentage est passé de 13,5% à 18,0% sur la même période. Cette part est
2 Bien qu’un système détaillé a finalement été mis en place en juillet 2008, il ne couvre pas tous les biens. De plus, il est encore trop tôt pour évaluer l’efficacité de ce système.
13
comparable à celle correspondant à d’autres groupements régionaux comme le
COMESA ou l’ASEAN. Cependant, elle reste beaucoup plus faible que celle
correspondant à l’UE et l’APEC.
5. Plus précisément, il existe des différences entre les pays et les produits. Par
exemple, certains pays ont fortement augmenté leur part de commerce intra-
régional (Egypte, Jordanie, Liban, Syrie, Tunisie), tandis que d’autres ont
connu une stabilité ou même un déclin (certains pays du Golfe). Au niveau des
branches d’activité, l’augmentation la plus forte du commerce intra-régional
concerne les produits agro-alimentaires, les produits manufacturés ainsi que
les machines et l’équipement de transport. A l’inverse, les produits non
transformés, les produits pétroliers et les produits gras n’ont pas connu une
telle croissance.
6. Les pays arabes ont réussi dans une certaine mesure à diversifier leurs
échanges. Ainsi, huit pays ont exporté plus de 200 produits en 2005 (au niveau
3-digit de classification), au lieu de trois pays en 1995.
7. Le modèle théorique d’intégration régionale étendu en concurrence imparfaite
(présenté dans la partie 2), permet d’identifier plusieurs canaux correspondant
aux effets sur le bien-être de l’intégration régionale :
a. Les effets en concurrence parfaite (volumes de commerce, coûts
d’échange)
b. Les effets liés aux termes de l’échange
c. Les effets en concurrence imparfaite (production, économie d’échelle,
variété des produits)
d. Les effets dynamiques (investissement, croissance, IDE)
e. Les effets liés aux distorsions (salaires, impôts)
8. Une application de ce modèle aux pays membres du GAFTA à partir d’une
série d’enquêtes menées dans plusieurs pays arabes et auprès de plusieurs
branches, révèle que :
a. L’accord GAFTA a un effet positif sur le volume du commerce
intra-régional. Il existe cependant des différences entre les pays et les
produits. Par exemple, si presque tous les pays semblent avoir
bénéficié d’effets positifs sur le commerce, le Liban fait figure
d’exception. Dans ce pays, les firmes se plaignent en effet des
différences de prix de l’énergie, dues aux subventions dans les autres
14
pays membres du GAFTA. Ceci a créé une situation de concurrence
déloyale, dans laquelle les firmes libanaises sont désavantagées sur le
marché régional. Concernant les effets par produits, l’agro-alimentaire
et la chimie semblent avoir bénéficié de l’accord GAFTA,
contrairement au textile et à l’habillement, pénalisés par plusieurs
facteurs (hausse des BNTs, dumping, absence de différences de coûts
de production et de goûts des consommateurs entre les pays, structures
de marché, etc…).
b. La réduction des BNTs a un effet neutre, dans la mesure où les
réductions prévues par l’accord ont été accompagnées par l’érection de
nouvelles BNTs dans certains pays membres.
c. Les effets en concurrence imparfaite (production, économies
d’échelle et variétés de produits) sont faiblement positifs. Ce
résultat contraste avec les effets très positifs enregistrés pour
l’intégration régionale nord-nord, en particulier dans l’UE. Plusieurs
raisons expliquent cette différence : la persistance des BNTs qui freine
les effets de production et d’économie d’échelle, l’absence de
différenciation des produits qui pénalise l’effet « variétés », ou encore
l’insuffisance des différences de goût des consommateurs. En
conséquence, les échanges sont essentiellement de nature inter-
branches avec de faibles effets en concurrence imparfaite. Enfin,
l’absence de « deep integration » constitue un frein à la création d’un
véritable marché unique qui permettrait de réels effets de production et
d’économie d’échelle.
d. Les effets de distorsions ont un impact significatif, notamment les
différences de subventions entre les pays. Ainsi, certains pays sont
avantagés par les subventions de leurs propres productions et
exportations (en particulier l’Arabie Saoudite, les EAU et l’Egypte), au
détriment des pays avec les subventions les plus faibles (Liban,
Maroc).
e. Les effets concernant les termes de l’échange et les effets
dynamiques n’ont pas pu être identifiés. Ceci peut s’expliquer par le
fait que les firmes interrogées ne peuvent identifier la relation
15
complexe entre l’intégration régionale d’une part, et ses effets indirects
sur les prix, l’investissement, les IDE et la croissance d’autre part.
9. Dans la partie 3, nous proposons un modèle d’échange original, qui s’appuie
sur des développements récents des modèles de gravité ainsi que des modèle
offre-demande à l’exportation. Il permet d’identifier les déterminants suivants
des échanges :
a. Les variables gravitaires traditionnelles (PIB, distance, langue
commune)
b. Les variables liées au coût à l’échange (effets frontières, intégration
régionale)
c. Les variables de concurrence imparfaite (économies d’échelle, variétés
de produits)
d. Les anticipations
e. L’hystérèse due aux coûts irrécupérables.
10. Une application de ce modèle aux pays membres du GAFTA à l’aide d’une
série d’estimateurs économétriques appropriés (Hausman et Taylor, Arellano,
Bond et Bover, modèles à effets transformés, etc…) rend possible de
quantifier l’impact des variables décrites ci-dessus sur le commerce intra-
régional des pays du GAFTA. Les principaux résultats sont les suivants :
a. Les effets standard de commerce en concurrence parfaite
entraînent une hausse des échanges (PIB et distance)
b. Les effets de l’accord GAFTA sur les échanges sont positifs. En
particulier, le modèle démontre une création d’échanges significative.
En revanche, il y a peu de détournement d’échanges. Cette dernière se
limite d’ailleurs aux importations mais est inexistante pour les
exportations. Au total, la création nette d’échanges est estimée à
environ 26% des échanges de la zone GAFTA.
c. Cependant, la plupart des pays ont des niveaux actuels d’échanges en
deçà de leurs niveaux potentiels. Ceci suggère que l’accord GAFTA
n’a pas permis d’augmenter les flux d’échanges régionaux à un
niveau supérieur aux flux « normaux », particulièrement concernant
le Maroc, la Tunisie, mais aussi l’Egypte, la Jordanie et la Syrie.
16
d. Les effets en concurrence imparfaite sont limités. En particulier,
bien que les économies d’échelle soient significatives dans la plupart
des pays du GAFTA, ces économies ne permettent pas d’augmenter les
flux d’échanges dans cette zone. Ce résultat corrobore les résultats
qualitatifs obtenus avec les enquêtes de terrain. La encore, la principale
explication réside dans les structures de marché, caractérisées par une
faible différenciation des produits, une similarité des goûts des
consommateurs et un commerce essentiellement inter-branches. De
plus d’absence d’intégration profonde empêche les pays du GAFTA de
bénéficier de leurs économies d’échelle, dans la mesure où les BNTs
existantes rendent difficile d’exploiter leurs économies d’échelle en
profitant d’un grand marché unifié.
11. Les principales implications en termes de politique économique sont les
suivantes. Si l’objectif est d’améliorer les effets de l’accord GAFTA sur le
commerce et le bien-être, plusieurs politiques peuvent être mises en œuvre :
a. Toutes les dispositions de l’accord actuel doivent être rigoureusement
appliquées. Au-delà, des efforts vers une intégration plus profonde
doivent être engagés : en particulier, de réels progrès doivent être
accomplis en faveur de l’adoption de règles d’origine détaillées et
transparentes, de la suppression des BNTs, de l’adoption de normes
communes, de la libre circulation du travail (en particulier des
entrepreneurs et du travail qualifié), etc… De tels progrès
permettraient non seulement d’augmenter les effets commerciaux
directs de l’intégration régionale, mais aussi de développer les effets
indirects (économies d’échelle et effets dynamiques), grâce à la mise
en place de fondations solides pour une zone plus intégrée. Sur ce
point, il est important de souligner que la libéralisation des services
selon l’approche GATS+ aura certainement un effet positif sur
l’approfondissement de l’intégration entre les pays membres du
GAFTA.
b. Un autre moyen d’améliorer les effets de l’intégration régionale
pourrait être atteint à partir du cumul des règles d’origine entre les
pays GAFTA et les pays membres de l’accord d’Agadir. L’utilisation
de ce système de cumul permettrait de contraindre les pays du GAFTA
17
à davantage coopérer ce qui permettrait d’atteindre une meilleure
allocation des ressources.
c. Il y a aussi urgence à mettre en place un système qui permettrait
que les distorsions domestiques ne produisent pas d’effets
d’entraînement négatifs sur les pays membres du GAFTA. Le cas des
différents systèmes de prix de l’énergie dans les pays membres a
montré ses effets négatifs, en particulier pour le Liban (non
subventionné). Ainsi, des règles claires et équitables régulant les
subventions doivent-elles être mises en place rapidement.
d. Les pays de la zone GAFTA doivent renforcer leur coopération afin
d’augmenter les effets positifs de l’accord sur les secteurs les plus
perméables à ces effets comme l’agro-alimentaire et la chimie. De plus
les BNTs affectant les autres secteurs comme le textile doivent être
éliminés.
e. Les pays membres devraient aussi mettre en place des programmes
d’information et des bases de données sur le commerce et
l’investissement intra-régional. En effet, les acteurs économiques
connaissent encore assez peu les dispositions de l’accord GAFTA. Ils
ont besoin de plus d’information.
f. D’un point de vue politique, il est aussi crucial que les pays du
GAFTA puissent s’appuyer sur une coopération politique plus
étroite ainsi que sur des institutions communes qui permettraient de
contrôler la libéralisation des échanges dans la région et de résoudre
les litiges commerciaux.
g. Plus généralement, les Etats doivent tout mettre en œuvre pour générer
des conditions optimales pour la croissance économique. Ces
conditions incluent la réforme des Etats, le développement
d’infrastructures inter-pays, comme les autoroutes ou les chemins de
fer, une plus grande libéralisation des échanges et des IDE, pas
seulement à l’intérieur de la zone GAFTA mais aussi avec les autres
partenaires, etc…
18
Introduction
Trade integration in the Arab world is an old story. Starting with the creation of the
Arab League in 1945, several attempts have been made to promote regional political
and economic integration: the 1950 Treaty for Joint Defence and Economic
Cooperation, the 1953 Convention for Facilitating and Regulating Transit Trade, the
1957 Arab Economic Unity Agreement, the 1964 Arab Common Market, the 1981
Gulf Cooperation Council, the 1989 Arab Cooperation Council and the 1989 Arab
Maghreb Union (Neaime, 2005). However, these agreements have generally not been
implemented. As a result, trade barriers remained high within the Arab region.
Things started changing in the 90s, when most Arab countries actually implemented a
trade liberalization process, simultaneously at multilateral, bilateral and regional level.
Indeed, a significant number of Arab countries signed the GATT agreement from
1990 onward, namely Tunisia (1990), the United Arab Emirates and Qatar (1996),
Jordan and Oman (2000) as well as Saudi Arabia (2005). At the same time, there has
been an increase in bilateral free trade agreements: for instance, Egypt concluded
agreements with Libya and Syria in 1990, with Tunisia, Lebanon and Jordan in 1998
as well as with Iraq in 2001. At the same time, Morocco concluded similar
agreements with Turkey (2005) and the USA (2006). Jordan also implemented a free
trade arrangement with the USA (2002). Finally, at the regional level, GAFTA was
signed in 1997 whereas the Agadir Agreement was concluded between Morocco,
Egypt, Jordan and Tunisia in 2004.
Among these numerous agreements - which very often overlap each other as a kind of
spaghetti regionalism - GAFTA is certainly the most far-reaching one. Indeed, this is
the first regional agreement which has been actually applied in the Arab region; as a
matter of fact, tariffs has been fully eliminated on 1.1.2005. Secondly, this agreement
covers all countries in the Arab region. Moreover, the contents of the agreement are
also far-reaching, first because it not only includes the removal of tariffs, but also
monetary, administrative and quantitative NTBs (quotas). It also provides for trade
liberalisation in agriculture (despite a transition period) as well as of rules of origins.
Finally, inter-Arab consultation is also expected with regard to services, research and
technological cooperation as well as intellectual property. Moreover, the agreement
19
encourages Arab countries to go quicker in the integration process, thanks to bilateral
or sub-regional agreements (Arab League, 1999). In this regard, the Agadir agreement
is considered to be in accordance with the GAFTA process and complementary to this
process.
The expected economic benefits from this far-reaching agreement are numerous and
well-known. GAFTA members are first expected to increase intra-regional trade,
thanks to the removal of trade barriers. This first gain is due to increased production
efficiency through the exploitation of comparative advantage. It is generally referred
to as the gain in a perfect competition framework (Robson, 1998). However,
additional gains must be taken into account. For example, the imperfect competition
framework makes it possible to identify the increased production efficiency due to
scale economies, the increased consumer utility due to product differentiation as well
as the improvement of the terms of trade due to the enhancement of international
competition and the decrease in import prices. Finally, GAFTA should help to
increase economic growth and trade through the dynamic effects of regional
integration. These dynamic effects especially include the role of FDI as well as sunk
costs (Baldwin and Venables, 1995).
Although there is currently a significant number of studies which are dedicated to
GAFTA, most of them remain very descriptive (Sekouti, 1999 ; Tahir, 1999;
2005; MINEFI, 2005; Momani, 2007, etc…)3. These studies very often describe trade
within the Arab world and discuss the expected consequences of GAFTA or other
regional agreements in the Arab area. They also identify the brakes and other
problems which make it difficult to achieve actual economic integration and
significant economic gains in this region. This description provides a first insight
about the possible effects of GAFTA. However, the lack of analytical tools, especially
theoretical or empirical modelling, makes it difficult to really quantify GAFTA
effects.
There is however a small number of analytical studies. For example, Neaime (2005)
considers the impact of monetary and financial integration, especially Foreign Direct 3 Refer to Part 1 for a detailed review of literature.
20
Investment (FDI) liberalisation across Arab countries. With regard to GAFTA trade
provisions, CATT (2005) assesses the GAFTA welfare effect on specific countries,
mainly Morocco and Tunisia. This assessment is achieved through computable
general equilibrium (CGE) modelling. Results show positive or negative welfare
effects, depending on the terms of trade. Bousseta (2004) also relies on CGE models
applied to Maghreb countries. Results conclude to a moderate rise in intra-Maghreb
trade due to GAFTA.
Dennis (2006) concentrates on trade facilitation within the MENA region. Indeed, it is
generally recognized that non tariff barriers, such as customs procedures, port
efficiency, standard and technical regulations, etc… must be reduced with tariffs in
order to improve the efficiency of a PTA. Using the GTAP-6 model, this author
shows that regional integration within the MENA area provides positive welfare
gains. However, these gains are twice less than regional integration between MENA
and the EU. He also shows that trade facilitation makes it possible to triple the welfare
gains. This highlights the importance of reducing NTBs for optimizing the effects of
PTAs. Similar results are found in Konan (2003) for Tunisia and Egypt.
Finally, Péridy (2005) focuses on the appraisal of the ex-ante trade effects of trade
liberalisation between Morocco, Tunisia, Egypt and Jordan (Agadir Agreement).
Thanks to a modified gravity model, this author shows limited trade effects, mainly
because of the lack of trade complementarity between these countries.
These analytical studies present some common features: They all provide an ex-ante
analysis of GAFTA effects; they all concern a limited number of countries within the
GAFTA area (mainly Maghreb countries); they are all based on a perfect competition
framework. As a result, they disregard some potential gains due to imperfect
competition and market structure4; None of them includes dynamic effects, due to
increasing growth or FDI. Finally, and surprisingly, very few studies focus on
GAFTA trade effects with the exception of Bousseta (2004) and Péridy (2005).
4 This is a major drawback since the new theoretical literature on CGE suggest that introducing imperfect competition provides significant changes in terms of simulation results compared with traditional CGE with perfect competition (Willenbockel, 2004; Roson, 2006).
21
Consequently, the present research project is aimed at filling the lack of literature by
providing additional analysis of GAFTA welfare and trade effects. Its contributions
are the following. First, it provides an ex-post appraisal of GAFTA effects through the
use of 1997-2005 data. These quantitative data are complemented by an original
inquiry driven in GAFTA countries. Second, it covers all the GATFA members which
have implemented the agreement as well as the countries which are expected to carry
out the agreement in the coming years. Third and very importantly, it not only
analyses the gains related to the perfect competition framework (exploitation of
comparative advantage, more efficient use of factors of production) but also the
additional gains due to imperfect competition (terms of trade improvement, reduction
in trade costs, existence of scale economies, greater product varieties for consumers)
as well as dynamic effects (and increase in foreign direct investment, growth effects)
and the impact of economic distortions (taxes/subsidies).
The main questions this proposal aims to address are the following:
- What is the qualitative and quantitative ex-post impact of GAFTA on welfare
and trade flows?
- Which countries and which industries have benefited the most (or the least)
from this GAFTA agreement?
- What is the trade potential of each GAFTA country with regard to the others?
- What is the role of trade costs within the GAFTA area, especially NTBs?
- What is the role of market structures (scale economies, product differentiation,
terms of trade) in the magnitude of GAFTA’s impact ?
- What are the main bottlenecks which reduce the GAFTA economic impact?
- Which policy recommendations can be driven from the results ?
A twofold methodological approach is carried out: as a first step, a microeconomic
analysis is implemented at firm level in selected Arab countries and selected
industries. The theoretical foundation of this analysis is based on new developments
in regional economic integration theory (Baldwin and Krugman, 1995). In this regard,
an extended theoretical model is first developed in order to identify the potential
welfare effects of regional integration. From this model, an empirical analysis is
carried out. It consists in inquiries aimed at obtaining opinions from the firms
concerning: the direct GAFTA trade effects due to tariff removals; the specific
22
GAFTA effects due imperfect competition (scale economies, product varieties, prices
and terms of trade), GAFTA dynamic effects (foreign direct investment, growth,
etc…) as well as the role of economic distortions (wages, taxes/subsidies) ; the brakes
and bottlenecks which impede more positive effects of GAFTA on production and
trade; the needs and recommendations for future GAFTA trade negotiations. These
inquiries are expected to provide a better understanding of the GAFTA effects at firm
level. They have been conducted in selected GAFTA countries (Egypt, Lebanon,
Jordan, Morocco, Saudi Arabia as well as Yemen) and in selected industries (textile,
ready-made garments, food, chemicals, petrochemicals). The interviews involved
firms, firm representatives, senior government officials or chambers of commerce.
A second aspect of the methodology is the development of a macroeconomic model
aimed at quantifying the trade impact of GAFTA and the precise effects of imperfect
competition factors. To that end, an original theoretical model is first developed,
based on new developments of bilateral trade models, including gravity models. This
makes it possible to take into account a coherent analytical framework which includes
imperfect competition and dynamic components of trade gains due to GAFTA
integration: reduction in trade costs (Anderson and van Wincoop 2004; Markusen and
Venables, 2005), scale economies and product varieties (Péridy, 2005), terms of trade
and price effects (Anderson and van Wincoop, 2003), sunk costs and expectations
(Baldwin and Krugman, 1989; Abedini, 2006) as well as foreign direct investment
(Baldwin and Venables, 1995).
From this theoretical background, an original econometric model is subsequently
estimated. It aims to quantify the direct economic impact of GAFTA as well as the
trade effects of each variable, including scale economies, product varieties, FDI, etc…
Three dimensions are included: 56 exporting and importing countries (of which 19
Arab countries) as well as a time period of 18 years (1988-2005). The econometric
analysis is based on the development of a large dataset which contains all the relevant
variables. Then, specific econometric analysis is undertaken in order to calculate scale
economies and product differentiation (Péridy, 2004). The whole model is
subsequently estimated by using new techniques with regard to endogeneity and
multiple heterogeneity (Abowd et al.1999; Wooldridge, 2001, Egger, 2004 and Wolff,
2006).
23
Given the methodological approach developed above, the outline of the present study
is the following. The first part is devoted to the description and a critical analysis of
economic integration and trade in the Arab world in the past decades. It includes a
first section which provides an overview of regional integration in the Arab world.
Particular emphasis is put on the provisions included in the GAFTA agreement. Its
limitations are also discussed. A second section is dedicated to the analysis of trade
flows in Arab countries, especially since the implementation of the GAFTA
agreement in 1998.
The second part aims to highlight the welfare effects of regional integration on
GAFTA countries. For that purpose, the various channels by which regional
integration can influence welfare must be identified. This is why the analysis
presented here starts from a short survey of the theory of PTA (section 1). In a second
section, an original theoretical model of regional integration is proposed. This model
includes four types of welfare effects due to regional integration: perfect competition,
imperfect competition, dynamic and economic distortion effects. Once identified,
these effects can be tested in section 3 in the case of GAFTA. This is achieved by the
implementation of an inquiry in selected GAFTA countries and selected industries.
Finally, part 3 is dedicated to the quantitative assessment of the trade effects due to
the GAFTA agreement. In a first section, a theoretical model is proposed as a
theoretical foundation. This model is an original combination of gravity models and
supply-demand export models. Its main contribution is to simultaneously include
gravity variables as well as export supply variables, especially scales economies and
product differentiation. In a second section, this model is applied to trade within
GAFTA countries. The main objective is to calculate the trade impact of the GAFTA
agreement on trade flows. For that purpose, the model is estimated in two steps. In the
first step, the model is estimated with the full country sample, which includes 56
exporting and importing countries, of which developed and emerging countries as
well as GAFTA countries. This makes it possible to test the significance of the
parameter estimates on a large scale, i.e. with a large number of countries and
observations. This also enables the comparison of the effects of several regional trade
arrangement, including GAFTA.
24
In a second step, the country sample is limited to GAFTA countries only as exporters
and importers. This makes it possible to highlight the trade specificities of these
countries. In particular, the estimation of the parameter corresponding to the bilateral
tariff variable gives a quantitative insight about the ex-post effects of the
implementation of GAFTA. In the two country samples, estimations are made over
the period 1988-2007. Finally, an estimation of trade creation and trade diversion is
proposed, as well as an estimation of trade potentials across GAFTA members.
25
References to Introduction
Abedini, J. (2005) “The Gravity Model and Sunk Costs”, 7th ETSG Conference,
Dublin, September.
Abedini, J. (2006) “An Investigation of the Role of Expectations in Trade: The Case
of the Gravity Model, 8th ETSG Conference, Vienna (Austria), September.
Abowd, J., F. Kramarz et D. Margolis (1999) “High Wage Workers and High Wage
Firms”, Econometrica, 67(2): 251-333.
Anderson, J. et E.van Wincoop (2003) “Gravity with Gravitas: A Solution to the
Border Puzzle”, American Economic Review, 93: 170-192.
Anderson, J. et E.van Wincoop (2004) “Trade costs”, Journal of Economic Literature,
42(3), p. 691-751.
Arab League (1999) “Documents sur la zone arabe de libre-échange”, secrétariat du
conseil économique et social, Le Caire.
Arellano, M. et S. Bond (1998) "Dynamic Panel Data Estimation Using DPD98 for
Gauss: A Guide for Users" CEMFI, Madrid.
Baldwin, R. and P. Krugman (1989) “Persistent Trade Effects of Large Exchange
Rate Shocks.” Quarterly Journal of Economics 104(4): 635-54.
Baldwin, R. and A. Venables (1995) “Regional Economic Integration”, in: G.
Grossman and K. Rogoff, Handbook of International Economics, North Holland.
Baltagi, B. (2006) "Forecasting with panel data," Discussion Paper Series 1:
Economic Studies 2006:25, Deutsche Bundesbank, Research Centre.
Bayar, A. (2005) « An Evaluation of the Benefits and Challenges of the South-South
Integration among the Mediterranean Partner countries, FEMISE Report, FEM-22-27.
26
Boussetta, M. (2004) « Espace Euro-méditerranéen et Coûts de la Non Intégration
Sud-Sud : le cas des pays du Maghreb, FEMISE Report, FEM-21-43.
CATT (2005) “Obstacles to South-South Integration, to Trade and to Foreign Direct
Investment: the MENA Countries Case”, FEMISE Report, FEM-22-36.
CEPII (2006) “MacMap Dataset”, CEPII and CNUCED-OMC.
CEUS (2005) “Integration and Enlargement of the European Union: Lessons for the
Arab Region”, FEMISE Report, FEM-22-07.
Dennis, A. (2006) “The impact of regional trade agreements and trade facilitation in
the Middle-East North Africa region”, World Bank Policy Research Working Paper,
3837.
Egger, P. (2004), On the Problem of Endogenous Unobserved Effects in the
Estimation of Gravity Models, Journal of Economic Integration, 19(1): 182-91.
Hadhri, A. (2001) « La Grande Zone Arabe de Libre-Echange et les Perspectives
d’Intégration Sud-Sud en Méditerranée », Conférence FEMISE, mars 2001.
Harrigan, J. (1994) « Scale Economies and the Volume of Trade », Review of
Economics and Statistics, 76(2): 321-328.
Kamrava (2004) “Structural impediments to economic globalization in the Middle-
East, Middle-East Journal, 6(4): 96-112.
Konan, D. (2003) “Alternative paths to prosperity: Economic integration among Arab
countries”, in Galal, A. and B. Hoeckman (eds), Arab Economic integration, Egyptian
center for economic studiesCairo and Brookings Institution Press, Whashington D.C.
27
Markusen, J. and A. Venables (2005) “A Multi-Country Approach to Factor-
Proportions Trade and Trade Costs” National Bureau of Economic Research, Inc,
NBER Working Papers: 11051
MINEFI (2005) « La Zone Arabe de Libre-Echange (GAFTA) », Ambassade de
France en Syrie, Mission Economique.
Neaime, S. (2005) « South South Trade, Monetary and Financial Integration and the
Euro-Mediterranean Partnership: An empirical Investigation”, FEMISE Report, FEM-
22-39.
Péridy (2004) “Trade effects of scale economies: Evidence from four EU countries ”,
Economics Letters, 83(3) : 399-403.
Péridy, N. (2005) “Towards a Pan-Arab free trade area: Assessing Trade Potential
Effects of the Agadir Agreement”, The Developing Economies, 43(3): 329-345.
Roson, R. (2006) “Introducing imperfect competition in CGE models: technical
aspects and implications”, Computational Economics, 28:29-49.
Robson, P. (1998) The Economics of International Integration, London: Routledge.
Sekouti, N. (1999) “The Arab Free Trade Area (AFTA): Potentialities & Effects”;
New economic developments and their impact on Arab economies, 1999, pp. 257-81,
Amsterdam; New York and Oxford: Elsevier Science, North-Holland.
Tahir, J. (1999) “ Free Economic Zones in Arab Countries in the Context of Arab
Free Trade Areas and World Trade Organization Arrangements: Trends and Future
Prospects”, New economic developments and their impact on Arab economies, 1999,
pp. 331-403, Amsterdam; New York and Oxford: Elsevier Science, North-Holland
Tovias, A. (2004) “Economic Cooperation Potential between the Mashrek Countries,
Turkey and Israel”, FEMISE Report, FEM21-18.
28
Willenbockel, D. (2004) “Specification cjoice and robustness in CGE trade policy
analysis with imperfect competition”, Economic Modelling, 21:1065-1099.
Wolff, F.C. (2006) “Estimation d’un Modèle Linéaire en Présence d’une Erreur
Compose Triple, LEN, Université de Nantes, mimeo.
Wooldridge, J. (2001) Econometric Analysis of Cross Section and Panel Data,
Cambridge : MIT Press.
Zarrouk, J. (2000) “The Greater Arab Free Trade Area: Limits and Possibilities”;
Studies in International Economics. Ann Arbor: University of Michigan Press,
pp.285-305
29
1. Regional integration and trade patterns in the Arab world5 This first part is devoted to the description and also a critical analysis of the
developments of economic integration and trade in the Arab world in the past
decades. The first section provides an overview of regional integration in this area.
Particular emphasis is put on the analysis of the provisions included in the GAFTA
agreement. Its limitations are also discussed. The second section is dedicated to the
analysis of trade flows in Arab countries, especially since the implementation of the
GAFTA agreement in 1998.
1.1 Overview of Arab Integration Development and GAFTA Contents
This section is aimed at presenting the history of regional integration in the Arab
world. This makes possible to assess more accurately the contents of the GAFTA
agreement compared with the previous attempts of economic integration.
1.1.1 Short History of Arab Integration:
Arab regional integration dates back to the 1950s. The first initiative was the Treaty
for Joint Defense and Economic Cooperation (TJDEC) signed by Egypt, Jordan,
Lebanon, Saudi Arabia, Syria and Yemen. TJDEC dealt with several political and
defense issues. However, it included an economic dimension as clarified in its second
provision which identified the establishment of an Economic Council from ministers
of the members who are concerned with economic issues. The agreement was highly
modest in achieving regional integration. In fact, the word “integration” was not even
stated, but rather “cooperation” was the word used. The agreement established the
Economic Council which was then transformed to the Economic and Social Council
(ESC), one of the most important bodies responsible for the Arab integration.
Although, by today’s standards TJDEC might be highly modest if evaluated by its
trade integration objectives, it should be noted that in the 1950s trade liberalization
and integration were not viewed as an important issue for development, especially in
5 The authors are grateful to Ms. Heba El Dikn and Mr. Ahmed Rostom for research assistance.
30
Arab countries which had merely gained their independence and where the
developmental policy adopted was based on import substitution (Kheir-El-Din and
Ghoneim, 2006a).
The first pragmatic initiative toward trade integration among the Arab countries was
The Agreement on Trade Facilitation and Regulating Transit Trade (ATFRTT) which
was signed in 1953 by a number of Arab countries. The 1953 ATFRTT was followed
in 1957 by Arab Economic Unity Agreement (AEUA). Both agreements included at
the beginning a limited set of countries which expanded gradually afterwards. They
focused mainly on granting preferential tariff treatments for products of Arab origin,
especially agricultural goods and minerals. ATFRTT and AEUA were politicized and
captured by special interests of different member countries which was reflected in the
amendments undertaken to serve such interests and changing the tariff scheduling.
Efforts to lower tariffs on manufactures were largely thwarted by Iraq, Saudi Arabia
and Yemen, which relied heavily on revenue on import duties. At the end, it was
obvious that conflicting interests led the agreements no where (Sabry, 2001; Dervis et.
al, 1998).
Ten years later, the failure of Arab countries in achieving regional trade integration
led them to enter into a new agreement, namely The Arab Common Market Agreement
(ACM) which was signed in 1964. The decree that announced the establishment of the
ACM did not mean the technical word of a common market, as it left it to be achieved
in the future whereas it dealt only with liberalization of intra-regional trade in the
form of free trade area (FTA). Four members (Egypt, Syria, Iraq and Jordan) of the
ACM which comprised around 13 countries focused on establishing a FTA following
the schedule of the ATFRTT in 1953 and the rest of the commodities should have
been liberalized with certain percentages each year to reach full liberalization of
agricultural goods in 1969 and for manufactured goods in 1974. ACM failed to attract
new members although it was flexible in its terms and had no binding commitments.
A committee that focused on the reasons for the failure of the agreement that was
established in 1972 ended up with pointing out several institutional failures which led
to the failure of the agreement, namely: 1) The decision of establishing a common
market was not the right decision in the right time; 2) There were no information on
the products needed to be traded; 3) The heavy governmental control of the trading
31
process; 4) The high dependence on tariff revenue; and 5) The differences in costs
structures because of the large differences in tariffs and surcharges on intermediate
goods (Sabry, 2001; Dervis, et. al, 1998).
As a reaction to the failure of the ACM in 1971, the idea of establishing a common
external tariff was abandoned. The Arab countries agreed to enter into a new
agreement in 1981, namely the Agreement on Facilitation and Development of Trade
(AFDT). AFDT was signed by 19 countries. It entered into force in 1983 and aimed at
reaching a FTA and establishing a customs union. The agreement was based on
adopting a positive list approach for selected products chosen on yearly basis. AFDT
in fact helped to resolve a number of obstacles as the settlement of payments and
some financial issues related to governments. The agreement added a 40% value
added as a rule for acquiring origin to be granted tariff exemptions. As with previous
agreements, the 1981 effort had little effect on trade liberalization or actual trade. It
lacked binding commitment to its terms and a timetable for implementation, and
featured a “positive list” approach, which was captured by special interests’ effects in
different countries (ESCWA, 2001; Dervis, et. al, 1998).
By the mid 1980s, Arab countries started adopting sub-regional agreements to
overcome the frequent failures of regional trials. The most important ones were the
Gulf Cooperation Council (GCC) which was signed in 1981 and the Arab Maghreb
Union (AMU) which was signed in 1989. By the early 1990s and as a result of the
proliferation of Regional Trade Agreements (RTAs) worldwide, the project of the
Arab trade integration was revived in the League of Arab Nations (LAN). However,
the implementation mechanism differed this time, where room for flexibility was less,
a negative list approach was adopted, and a strict time schedule was set, all featured in
Greater Arab Free Trade Area (GAFTA) (Sabry, 2001; Kheir-El-Din and Ghoneim,
2006a).
GAFTA refers to the declaration made by the Heads of Arab States, in the Cairo 1996
Arab Summit, adopting an executive program of the 1981 AFDT to reach a FTA with
zero-percent tariff rates in the year 2007. The Economic and Social Council (ESC) of
LAN approved the executive program in 1997. Such an initiation for reaching a FTA
was a trial to overcome the negative aspects of AFDT which was characterized by
32
vagueness in wording and limited positive list approach of liberalization. Initially, it
was planned to reduce the tariffs by 10% on yearly basis to reach a FTA in 10 years
(ending in 2007). However, a decision by the ESC in 2001 (based on the
recommendation of the Arab Summit in Amman 2001) has accelerated the
implementation period to reach zero-percent tariffs on 01/01/2005. AFDT was taken
as the basic legal document establishing the rules and principles of implementation. In
many ways, the 1981 agreement did not represent a free trade agreement per se.
However the Arab States decided to take the agreement as it was and then added the
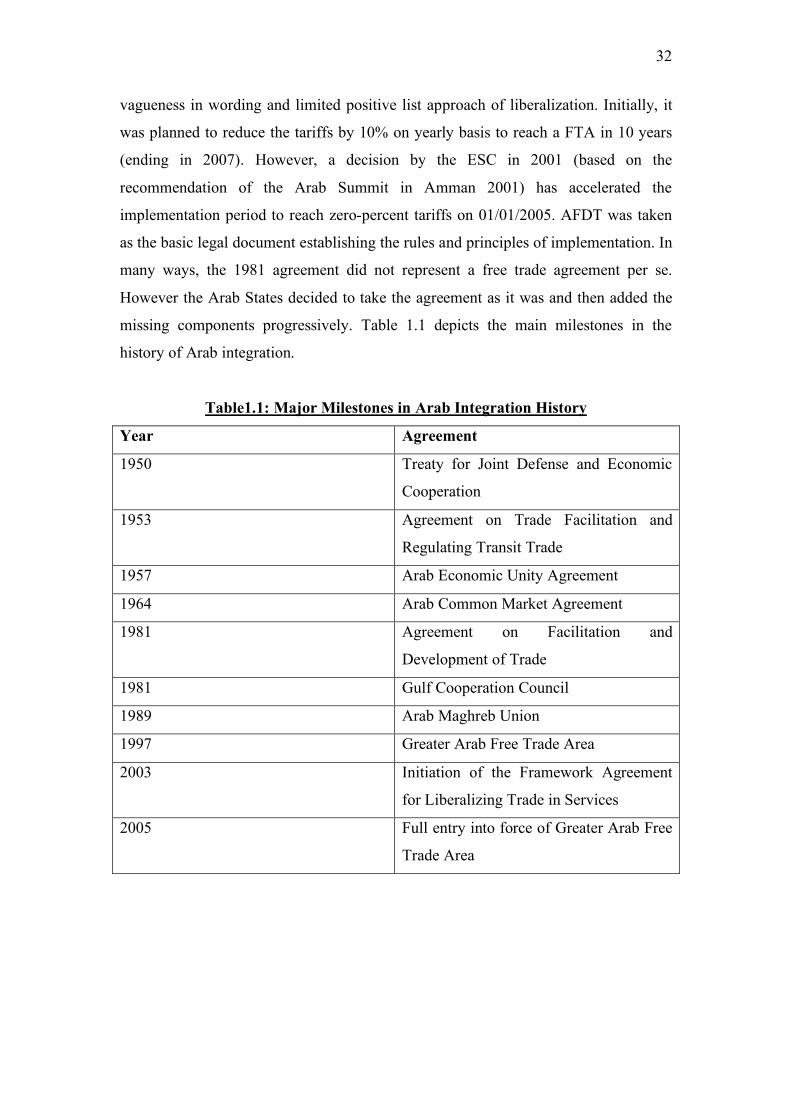
missing components progressively. Table 1.1 depicts the main milestones in the
history of Arab integration.
Table1.1: Major Milestones in Arab Integration History
Year Agreement
1950 Treaty for Joint Defense and Economic
Cooperation
1953 Agreement on Trade Facilitation and
Regulating Transit Trade
1957 Arab Economic Unity Agreement
1964 Arab Common Market Agreement
1981 Agreement on Facilitation and
Development of Trade
1981 Gulf Cooperation Council
1989 Arab Maghreb Union
1997 Greater Arab Free Trade Area
2003 Initiation of the Framework Agreement
for Liberalizing Trade in Services
2005 Full entry into force of Greater Arab Free
Trade Area
33
Initially, 146 out of the 22 Arab States joined the GAFTA and submitted their
schedules of commitments to the Arab League Secretariat. Four7 more member states
joined later. Currently there are 17 countries which apply GAFTA (LAN, 2008a)8.
GAFTA is only but one framework for Arab economic cooperation. GAFTA should
be viewed as the framework that is solely concerned with the liberalization of trade in
goods. To be able to understand the role of GAFTA properly, it should be noted that
other aspects of economic cooperation are being followed under different legal
frameworks than the GAFTA, but are also supervised by the ECS (Kheir-El-Din and
Ghoneim, 2006a).
If we compare GAFTA with its predecessors, we find that GAFTA represents a
significant improvement, and is by far the most outreaching agreement in terms of
coverage. In fact it can be safely argued that it is the first RTA among Arab countries
that has fixed dates with clear provisions. It adopts a negative list approach, versus its
predecessors which mainly depended on a positive list approach. It allowed for
exemptions to be in place for a specific time, and it set a specific deadline by which
such exemptions should be eliminated, which took place regarding the agricultural as
well as manufactured goods. It contained a specific schedule for tariff reductions
starting from a certain identified base year, which took place, and was even
accelerated. Its provisions were clear and flexible allowing its members to undertake
their liberalization efforts flexibly but in a disciplined way. By all means, GAFTA
represents a success when compared to its predecessors.
The economic benefits expected from this far-reaching regional integration are
numerous. For example, GAFTA members are first expected to increase intraregional
trade following the removal of trade barriers. Second, production efficiency should be
enhanced by exploiting comparative advantage and scale economies. Third,
competition within domestic markets is expected to increase with greater product
6 United Arab Emirates, Egypt, Kuwait , Saudi Arabia, Syria, Tunisia , Morocco, Sudan, Oman, Qatar, Lebanon , Iraq, Bahrain, and Libya. 7 Jordan, Palestine, Yemen, and Algeria. 8 United Arab Emirates, Egypt, Saudi Arabia, Palestine, Kuwait , Syria, Tunisia , Morocco, Jordan, Oman, Qatar, Lebanon , Iraq, Bahrain, Libya, Sudan, and Yemen. The countries that still did not join GAFTA include Algeria, Djibouti, Comoros, Somalia, and Mauritania. Algeria and Mauritania have already acceded but still did not started implementing GAFTA.
34
varieties for consumers as well as lower prices. Finally, GAFTA should help to
increase economic growth through the dynamic effects of regional integration.
In 2003, Arab countries initiated a separate agreement accompanying GAFTA on
liberalizing trade in services on a regional basis. The agreement is based on a GATS-
plus approach. In the period starting November 2004 till December 2007, four rounds
of negotiations were completed. The rounds were based on a request/offer approach.
In general terms, Arab countries showed enthusiasm in liberalizing trade in services.
However, it is too early to assess the outcomes of such negotiations as no concrete
commitments have been made so far. A number of studies pointed out that services
can play the role of the engine for enhancing integration among GAFTA members.
The expanded mobility of investment and labor, especially when compared to
merchandise goods could be the leading factor in the process of integration (Hoekman
and Messerlin, 2002b; Saidi, 2003).
However, GAFTA remains a perfect example of “shallow integration”. It suffers a
number of problems including the absence of a full fledged dispute settlement
mechanism, the inability to reach a detailed rules of origin scheme (which was
partially overcome by adopting detailed rules of origin for around 30-40% of total list
of traded goods since 1/1/2008)9 based on the approval of the Economic and Social
Council, a weak system of harmonized standards, no system of protection of
intellectual property rights, no harmonization of competition rules, no provision of
labor movement, and certainly the absence of a supranational power or a strong
leading Arab country that can force the members of GAFTA to agree on disputed
matters. In other words, mainly all aspects of “deep integration” are absent from
GAFTA, which is a necessary condition for the success of any integration scheme in a
globalized world. Hence, in a nutshell, despite the fact that GAFTA represents an
unprecedented achievement in terms of institutional set-up if compared to previous
trials of Arab trade integration, it still lacks the pillars of deep integration that ensure a
well functioning and effective RTA. This does not imply that efforts have not been
undertaken to deepen GAFTA. On the contrary, there are efforts undertaken to apply
detailed rules of origin as well as creation of an effective dispute settlement 9 The first six months of 2008 were supposed to represent a transitory period for GAFTA members to start fully adopting the detailed rules of origin, after which they should start implementing them following the agreement reached in the committee of rules of origin for GAFTA.
35
mechanism. Nevertheless, the efforts undertaken currently remain progressing at a
very slow pace which threaten the well-functioning of GAFTA.
GAFTA Current Status of Implementation
Information available on GAFTA points out that it has suffered problems which could
have affected negatively intraregional trade. A recent survey by the League of Arab
Nations (LAN) (2004) identified that most of trade frictions among GAFTA members
arise from issues related to standards or border transaction procedures dealing with
time and surcharges when crossing borders. LAN has started introducing several
initiatives for overcoming the lack of deep aspects of integration in GAFTA. Several
proposals have been put forward, including establishing a system for effective
implementation of conformity assessment procedures, enhancing efforts to harmonize
standards and establishing a system of Arab standards, overcoming problems
associated with existing quantitative or regulatory barriers to trade as public sector
exclusiveness of importation in some countries, and overcoming the overriding
obstacles of rules of origin (LAN, 2007). However, as pointed out in a recent survey
undertaken by LAN on the implementation status of GAFTA (LAN, 2008b) the
implementation of GAFTA still faces problems associated with standards, detailed
rules of origin, certificate of origin, trading costs, and movement of Arab
entrepreneurs. In many cases, national treatment of goods’ standards is not applied
where discrimination in favor of domestic goods takes place. Moreover, and despite
GAFTA members have eliminated tariffs completely in 2005, a number of GAFTA
members have introduced new (sur)charges on traded goods on the borders. In
addition, there are severe problems associated with inspection procedures which are
viewed as lengthy and cumbersome. In other words, a large number of GAFTA
provisions suffer from vagueness in implementation. Besides, the absence of deep
aspects of economic integration as full unification of standards and the system of its
implementation and institutions associated with market economy monitoring as
competition rules imply that GAFTA has been relatively preempted.
1.1.2 A Short Literature Review on GAFTA:
Arab countries are always characterized by having low intraregional trade. The
intraregional trade ranges around 10% of the total Arab world trade (see for example
36
LAN, 2006) whereas in the EU it ranges between 40 to 60%. Studies differ in
assessing whether intra GAFTA trade is low given the general characteristics of their
intra-regional trade, infrastructure, and level of development. However, most of the
studies point out that in general intra-Arab regional trade is weak10. The picture looks
differently if oil exports are excluded. In this case, the intra-regional exports show a
higher (relative) level. However, it still remains lower than other regions, such as the
EU.
Several studies have analyzed the reasons behind such weak trade integration among
Arab countries. Among such studies are Fischer, (1993), Fawzy (2003), Havrylyshyn,
Kheir-El-Din and Ghoneim (2006a). The aforementioned studies have identified the
trade trends among GAFTA members and the different economic, political, and
institutional reasons for such weak integration. Despite the importance of the
descriptive analysis of a large number of the aforementioned study, the majority of
those studies still lack the theoretical underpinning and empirical modeling, which
this study tries to provide.
Among the economic reasons identified for the weak integration are high similarity in
production and exports structure of Arab countries, i.e. the mismatch between exports
of the Arab countries and their imports (lack of complementarity), the dominating
ideology of import substitution, large size of public sector, relatively high tariff
protection, and low intra-industry trade (Havrylyshyn and Kunzel,1997) implying a
modest industrial base. Hoekman and Messerlin (2002a) identified that the small size
of GAFTA members’ economies (which are together less than that of Spain alone)
could have been a deterring factor in enhancing trade integration among GAFTA
countries. This implies that GAFTA if properly implemented could play a significant
role in enhancing economies of scale.
10 Al-Atrash and Youssef (2000) pointed out that intra GCC trade and intra Maghreb Union trade are relatively low whereas intra Mashrek trade is relatively high.
37
Among the political reasons were the absence of sincere political leadership
willingness to integrate, lack of credibility and feasibility among some Arab countries
to undertake the integration process, and absence of a regional leader and a federal
approach (including institutions with supra-national powers) to the process of
integration. All these factors created an atmosphere of mistrust among Arabs
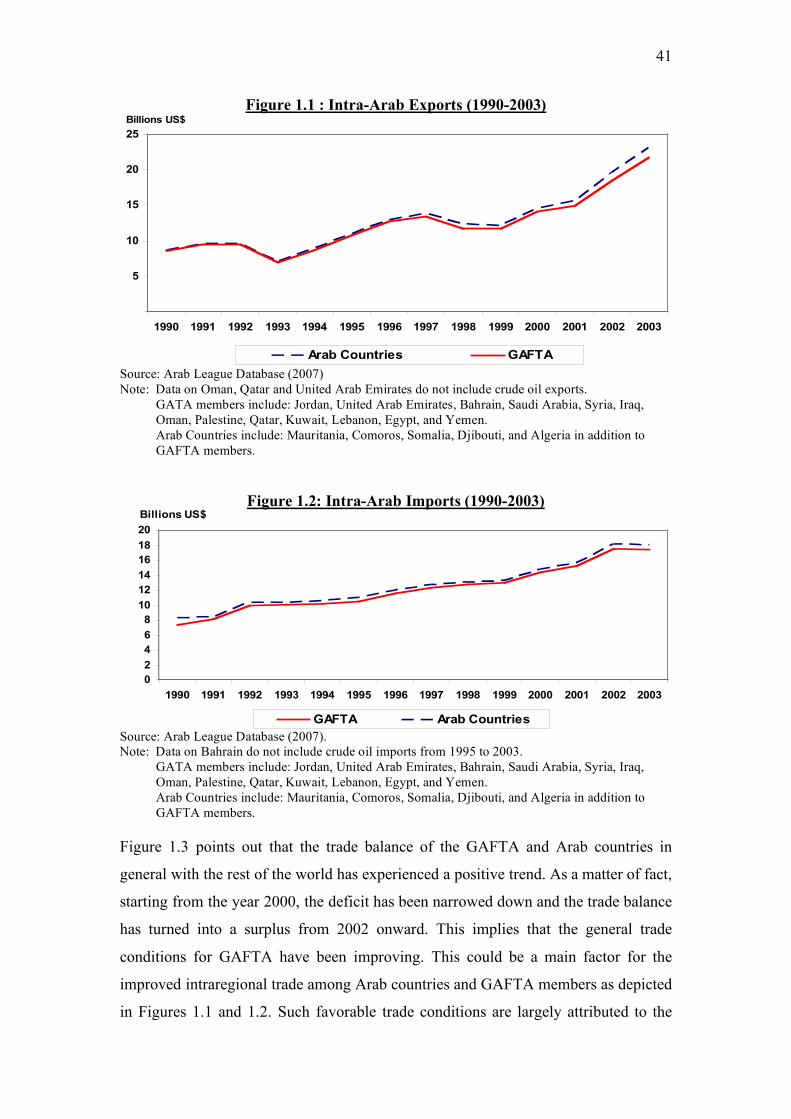
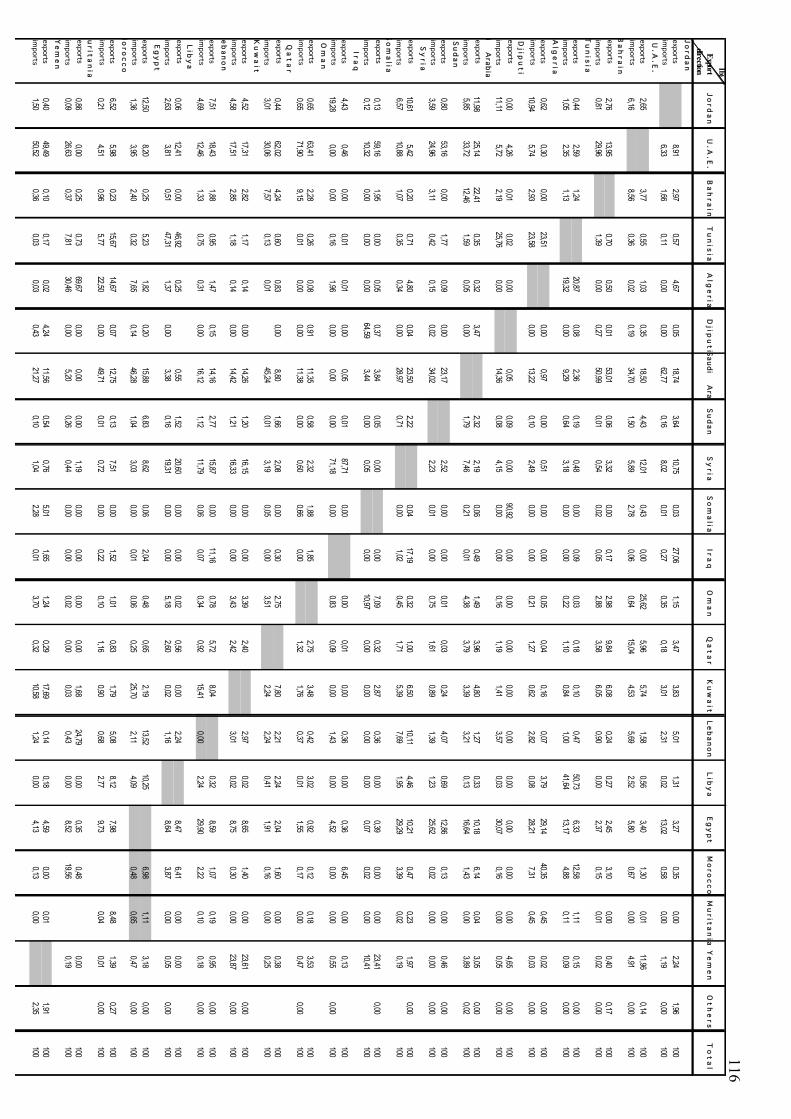
Source: Arab League Database (2007) Note: Data on Oman, Qatar and United Arab Emirates do not include crude oil exports.
GATA members include: Jordan, United Arab Emirates, Bahrain, Saudi Arabia, Syria, Iraq, Oman, Palestine, Qatar, Kuwait, Lebanon, Egypt, and Yemen. Arab Countries include: Mauritania, Comoros, Somalia, Djibouti, and Algeria in addition to GAFTA members.
Figure 1.2: Intra-Arab Imports (1990-2003)
Source: Arab League Database (2007). Note: Data on Bahrain do not include crude oil imports from 1995 to 2003.
GATA members include: Jordan, United Arab Emirates, Bahrain, Saudi Arabia, Syria, Iraq, Oman, Palestine, Qatar, Kuwait, Lebanon, Egypt, and Yemen. Arab Countries include: Mauritania, Comoros, Somalia, Djibouti, and Algeria in addition to GAFTA members.
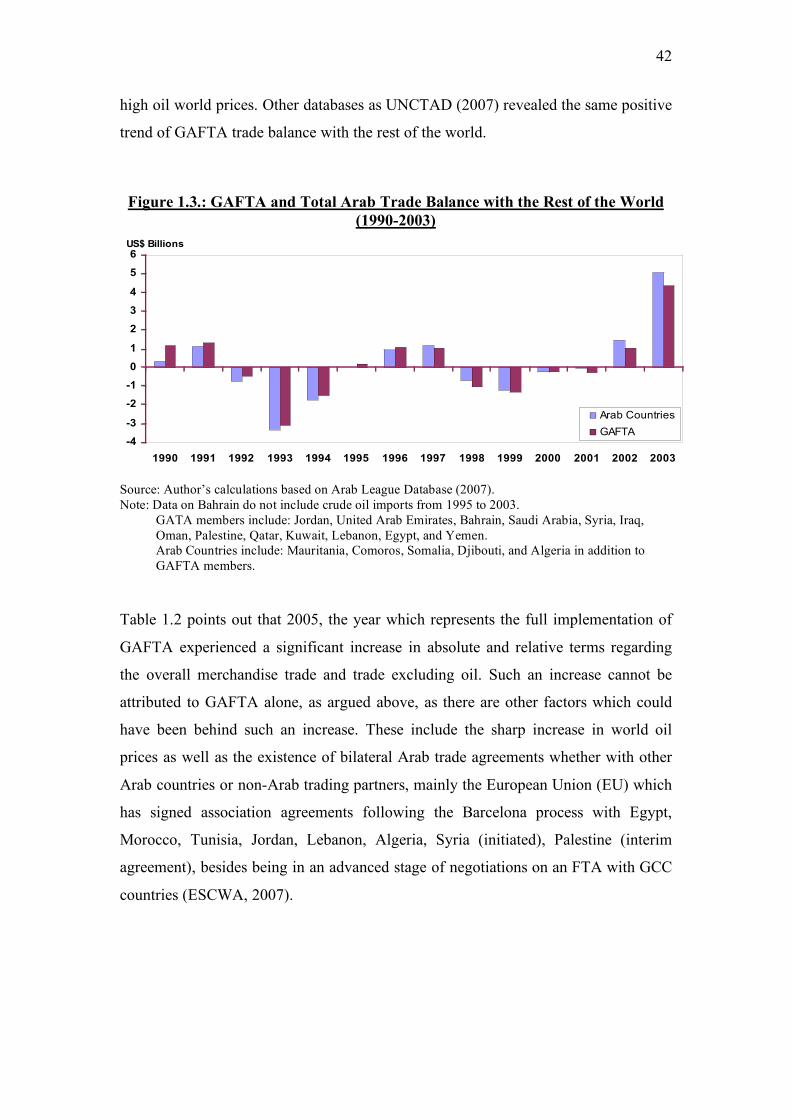
Figure 1.3 points out that the trade balance of the GAFTA and Arab countries in
general with the rest of the world has experienced a positive trend. As a matter of fact,
starting from the year 2000, the deficit has been narrowed down and the trade balance
has turned into a surplus from 2002 onward. This implies that the general trade
conditions for GAFTA have been improving. This could be a main factor for the
improved intraregional trade among Arab countries and GAFTA members as depicted
in Figures 1.1 and 1.2. Such favorable trade conditions are largely attributed to the
high oil world prices. Other databases as UNCTAD (2007) revealed the same positive
trend of GAFTA trade balance with the rest of the world.
Figure 1.3.: GAFTA and Total Arab Trade Balance with the Rest of the World
(1990-2003)
Source: Author’s calculations based on Arab League Database (2007). Note: Data on Bahrain do not include crude oil imports from 1995 to 2003.
GATA members include: Jordan, United Arab Emirates, Bahrain, Saudi Arabia, Syria, Iraq, Oman, Palestine, Qatar, Kuwait, Lebanon, Egypt, and Yemen. Arab Countries include: Mauritania, Comoros, Somalia, Djibouti, and Algeria in addition to GAFTA members.
Table 1.2 points out that 2005, the year which represents the full implementation of
GAFTA experienced a significant increase in absolute and relative terms regarding
the overall merchandise trade and trade excluding oil. Such an increase cannot be
attributed to GAFTA alone, as argued above, as there are other factors which could
have been behind such an increase. These include the sharp increase in world oil
prices as well as the existence of bilateral Arab trade agreements whether with other
Arab countries or non-Arab trading partners, mainly the European Union (EU) which
has signed association agreements following the Barcelona process with Egypt,
Ratio of intraregional trade to overall foreign trade
9.83 9.03 8.30 9.27 9.71 9.17 11.02 11.24
Ratio of intraregional trade to overall foreign trade excluding oil
13.55 13.67 14.87 14.74 14.69 13.50 16.53 17.98
Source: ESCWA (2007) Despite the relative and absolute increase in intraregional trade among Arab countries
in general and GAFTA members in particular, Arab countries remain characterized by
having low intraregional trade. The intraregional trade ranges around 10% of the total
Arab world trade (see Table 1.2 as well as LAN, 2006) whereas in the EU it ranges
between 53 to 60%. Studies differ in assessing whether intra GAFTA trade is low
given the general characteristics of their intraregional trade infrastructure. However,
most of the studies pointed out that in general intra-Arab regional trade is weak11. The
picture looks differently if oil exports are excluded. In this case, the intraregional
exports show a higher level (18% in 2005). Although it still remains lower than other
regions as the EU and APEC, it is comparable to other regional groupings including
developing countries as COMESA and ASEAN (see Figures 1.4 and 1.5).
In addition, intra-GAFTA exports increased at a faster rate than world exports,
especially in the recent period (Figures 1.6 and 1.7). Over the period 1997-2005, intra
GAFTA exports have increased by 15.1% at yearly average, whereas world exports
have risen by 7.9% only. It is also worth mentioning that intra-GAFTA exports have
increased slightly more than inter-GAFTA exports (14% in the most recent period).
11 Al Atrash and Youssef (2000) pointed out that intra GCC trade and intra Maghreb Union trade are relatively low whereas intra Mashrek trade is relatively high.
Figure 1.4: Share of Regional Exports as a Percentage of Total World (1948-2006)
Source: UN, Handbook of Statistics, 2007, online version. GAFTA members: Egypt, Libyan Arab Jamahiriya, Morocco, Sudan, Tunisia, Bahrain, Iraq, Jordan, Kuwait, Lebanon, Oman, Qatar, Saudi Arabia, Syrian Arab Republic, United Arab Emirates, and Yemen.
Figure 1. 5.: Share of Regional Exports as a Percentage of Total World (1948-2006)
Source: UN, Handbook of Statistics, 2007, online version. GAFTA members: Egypt, Libyan Arab Jamahiriya, Morocco, Sudan, Tunisia, Bahrain, Iraq, Jordan, Kuwait, Lebanon, Oman, Qatar, Saudi Arabia, Syrian Arab Republic, United Arab Emirates, and Yemen.
45
Figure 1.6.: GAFTA and World Trade Growth (1993-2005, %)
-5
0
5
10
15
20
25
30
1993
1994
1995
1996
1997
1998
1999
2000
2001
2002
2003
2004
2005
intra-GAFTA trade
World trade
Source: United Nations (2007) and WTO (2007), based on Abedini and Peridy (2008) Note: intra-GAFTA exports are estimated according to data available by keeping the same country sample for inter-annual comparisons.
Figure 1.7. : Intra and extra GAFTA trade in the periods 1993-1996 and 1997-2005 (average annual percentage change)
0%
2%
4%
6%
8%
10%
12%
14%
16%
GAFTA exports (intra) GAFTA exports (extra) world exports
1993-1996
1997-2005
Source: United Nations (2007) and WTO (2007) based on Abedini and Peridy (2008) As argued in section 1.1, the studies surveyed pointed out that there are two main
problems with Arab trade integration, namely the existing economic, political, and
institutional environment are not helping to provide a favourable environment for
Arab trade integration to flourish; and that Arab integration suffers from structural
problems associated with the similarity in production and trade structures. The last
46
few years that have elapsed marked a change in the two aforementioned problems
with GAFTA members experiencing a positive change in their economic, business,
and investment environments and adopting export oriented strategies. As for the
production and trade structures, Arab countries have experienced a high degree of
diversification in the number of products exported and imported over the last period
as revealed in Table 1.3, which points out the change in their traditional problem
associated with similar export profiles. This table reveals that at least ten GAFTA
members experienced an increase in the number of products exported, while only one
experienced a decrease. On the imports side, eleven GAFTA members experienced an
increase in the number of products imported and no country experienced a decline.
Table 1.3: Number of Merchandise Exports and Imports of GAFTA Members*
Country
Number of merchandise
products exported in 1995 (maximum 261)
Number of merchandise
products exported in 2005 (maximum 260)
Number of merchandise
products imported in 1995 (maximum 261)
Number of merchandise
products imported in 2005
(maximum 260) Bahrain 138 138 208 226 Egypt 164 240 237 253 Iraq 29 .. 76 .. Jordan 221 200 247 247 Kuwait 135 .. 205 .. Lebanon 180 240 236 238 Libya 29 .. 188 207 Morocco 169 198 236 248 Oman 189 202 244 257 Palestine .. .. .. .. Qatar 102 227 212 249 Saudi Arabia 220 .. 251 249 Sudan 19 41 185 243 Syria 131 161 .. .. Tunisia 193 200 242 242 United Arab Emirates 242 254 249 257 Yemen 70 109 180 215 *Number of products (at SITC, Revision 3, 3-digit group level) exported or imported by country. This figure includes only those products that are greater than 100,000 dollars or more than 0.3% of the country’s total exports or imports. Source: UNCTAD (2007), UNCTAD Handbook of Statistics 2006-07, Geneva: UNCTAD The above analysis points out that the developments of intraregional trade among
Arab countries are experiencing a positive trend. Trade in absolute and relative terms
is increasing accompanied by a better conducive business environment in Arab
countries which have opted for an export oriented strategy. Moreover, the structure of
exports and imports has shifted to being more diversified. All such factors have
contributed positively to enhance trade among GAFTA members. It is worth
47
mentioning that GAFTA itself and its proper implementation can be regarded as one
of the mechanisms of adopting an export oriented strategy and adhering to it.
However, based on the available data we cannot fully attribute the increase in the
intraregional trade to GAFTA alone, since the other factors at stake (income, prices,
etc…) have not been isolated (refer to part 3 for addressing this problem)
1.2.2 Analysis at Country Level:
The extent or level of importance of GAFTA members in intraregional trade differs
significantly. For example, in 2005 Saudi Arabia accounted for the lion’s share of
total intra Arab regional trade with a percentage of 21%, followed by Syria (14%) and
UAE (13%). The other countries continue to have modest shares (less than 10% of
their total trade) as shown in Figure 1.8.
However, this picture is not likely to remain the same, as the trends in countries are
changing significantly. Data of intraregional trade over the period 1998-2005 for
countries taken individually show different patterns (Figure 1.9.). There is a group of
countries where intraregional trade as percentage of their total trade increased,
whereas there are other groups where intra-regional trade as percentage of total trade
has either stagnated or even decreased. Among the group of countries which
experienced a continuous increase in the percentage of intraregional trade, we find
Bahrain, Egypt, Iraq, Jordan, Lebanon, Syria, Tunisia and Yemen. Syria and Lebanon
are among the countries which experienced the highest increase. Tunisia experienced
as well very high increasing rates, especially because this country started from a very
low level.
The group of countries where the percentage stagnated or experienced insignificant
changes includes Saudi Arabia, Kuwait, and Qatar. The third group of countries
which experienced a decrease include UAE, Oman, and Libya. Other Arab non-
GAFTA members have rather experienced a stagnating or declining trends (including
Algeria, Comoros, Mauritania, Somalia, and Sudan). The only exception of non-
GAFTA members which has experienced an increase has been Djibouti.
48
Bahrain; 6.2%
Egypt; 6.2%
Kuw ait; 4.0%
Morocco; 4.9%
Jordan; 9.2%
Comoros; 0.0%
Algeria; 2.9%
Yemen; 2.9%Tunisia; 6.4%
Syria; 12.0%
Sudan; 2.5%
Saudi Arabia; 26.9%
Qatar; 4.4%
Oman; 11.4%
Mauritania; 0.1%
Figure 1.8.: Distribution of Arab intraregional Trade, Exports
2005
Saudi Arabia; 21.1%
Qatar ; 3.1%
Oman; 5.0%
Lebanon; 3.4%
Kuwait; 4.0%
Jordan; 5.0%Iraq; 4.8%
Egypt; 6.6%Bahrain; 4.9%Other Arab countries;
11.8%
Yemen; 3.4%
Syrian Arab Republic;
14.0%
United Arab Emirates;
13.0%
1995
Source: Author’s calculations based on data extracted for UN ComTrade Database, online version.
49
Figure 1.9.: Ratio of Intraregional Trade to Foreign Trade in the Arab Countries (1998-2005) Source: ESCWA, 2007.
Algeria
0
1
2
3
4
5
1998 1999 2000 2001 2002 2003 2004 2005
%
Bahrain
0
5
10
15
20
25
1998 1999 2000 2001 2002 2003 2004 2005
%
Comoros
0
1
2
3
4
5
6
7
8
9
1998 1999 2000 2001 2002 2003 2004 2005
%
Djibuti
0
5
10
15
20
25
30
35
40
1998 1999 2000 2001 2002 2003 2004 2005
%
Egypt
0
2
4
6
8
10
12
14
16
1998 1999 2000 2001 2002 2003 2004 2005
%
Iraq
0
2
4
6
8
10
12
14
16
18
1998 1999 2000 2001 2002 2003 2004 2005
%
Jordan
0
5
10
15
20
25
30
35
40
1998 1999 2000 2001 2002 2003 2004 2005
%
Kuwait
0
1
2
3
4
5
6
7
8
1998 1999 2000 2001 2002 2003 2004 2005
%
Lebanon
0
5
10
15
20
25
30
1998 1999 2000 2001 2002 2003 2004 2005
%
Libya
0
1
2
3
4
5
6
7
8
9
1998 1999 2000 2001 2002 2003 2004 2005
%
Mauritania
0
1
2
3
4
5
1998 1999 2000 2001 2002 2003 2004 2005
%
Morocco
0
1
2
3
4
5
6
7
8
9
10
1998 1999 2000 2001 2002 2003 2004 2005
%
Oman
0
5
10
15
20
25
30
1998 1999 2000 2001 2002 2003 2004 2005
%
Qatar
0
2
4
6
8
10
12
14
1998 1999 2000 2001 2002 2003 2004 2005
%
Saudi Arabia
0
2
4
6
8
10
12
1998 1999 2000 2001 2002 2003 2004 2005
%
Somalia
0
10
20
30
40
50
60
1998 1999 2000 2001 2002 2003 2004 2005
%
Sudan
0
5
10
15
20
25
30
1998 1999 2000 2001 2002 2003 2004 2005
%
Syria
0
5
10
15
20
25
30
35
40
45
50
1998 1999 2000 2001 2002 2003 2004 2005
%
Tunisia
0
1
2
3
4
5
6
7
8
9
1998 1999 2000 2001 2002 2003 2004 2005
%
United Arab Emirates
0
1
2
3
4
5
6
7
8
9
1998 1999 2000 2001 2002 2003 2004 2005
%
Yemen
0
5
10
15
20
25
30
1998 1999 2000 2001 2002 2003 2004 2005
%
50
Such data analysis reveals that at the outset it is rather difficult to assess the impact of
GAFTA collectively, as the trends differ from one country to another with some
countries being heavily engaged in GAFTA whereas others have stabilized their level
of integration in GAFTA.
1.2.3 Analysis at commodity Level
To follow the trends in GAFTA commodity trade, we avoided the aggregation of
countries together as it leads to misleading results due to the absence of some GAFTA
members in some years. Hence, we decided to follow the analysis country by country
for which the data existed and we try to derive general results (Figure 1.10.). We used
the ComTrade database for this analysis utilizing the first level of disaggregation for
SITC12.
Algeria, though still did not apply GAFTA seems to be suffering from weak intra-
GAFTA exports, with the exception of mineral fuels, lubricants , and related materials
(3), which experienced a significant increase in 2005. There has been some
insignificant improvement in exporting chemicals (5), and to a lesser extent
manufactured goods (6) in 2005 compared to 1995 and 2000.
Bahrain has enjoyed a significant increase of its intra-GAFTA exports in a number of
commodities including crude material, inedible except fuel (2), manufactured goods
(6), and machinery and transport equipment (7). There has been as well some slight
improvement in exporting chemicals (5) and miscellaneous manufactured goods (8).
12 0 Food and live animals 1 Beverages and tobacco 2 Crude materials, inedible, except fuels 3 Mineral fuels, lubricants and related materials 4 Animal and vegetable oils and fats 5 Chemicals 6 Manufactured goods classified chiefly by material 7 Machinery and transport equipment 8 Miscellaneous manufactured articles 9 Commodities & transactions. Not classified according to kind
51
Egypt is among the countries which has experienced a significant increase in its intra
GAFTA exports in a large number of commodities over time. This has been the case
for food and live animals (0), crude material, inedible except fuel (2), mineral fuels,
lubricants and related materials (3), chemicals (5), manufactured goods (6) ,
machinery and transport equipment (7), and miscellaneous manufactured goods (8).
Jordan exhibits similar trends as Egypt, since it has experienced as well a significant
increase in its intra GAFTA exports in different commodity groups including food
and live animals (0), beverages and tobacco (1), crude material, inedible except fuel
(2), chemicals (5), manufactured goods (6), machinery and transport equipment (7), as
well as miscellaneous manufactured goods (8). Conversely, this country has
experienced a decline in exports of animal and vegetable oil and fats (4).
Data for Kuwait was available for 1995 and 2000 only. Kuwait has experienced a
significant increase in its intra GAFTA-exports in three commodity groups including
food and live animals (0), chemicals (5), and miscellaneous manufactured goods (8),
and a decrease in two commodity groupings, namely manufactured goods (6),
machinery and transport equipment (7).
Morocco does not seem to have expanded its intra-GAFTA exports significantly with
the exception of food and live animals (0). Manufactured goods (6) seems to have
stagnated in 2005 at their 1995 level after facing a significant decline in 2000,
whereas mineral fuels, lubricants and related materials (3) have increased slightly.
Other intra-GAFTA exports have experienced a significant decline including crude
material, inedible except fuel (2), chemicals (5), machinery and transport equipment
(7), and miscellaneous manufactured goods (8).
Oman is among GAFTA members which seem to have enjoyed high intra-GAFTA
exports growth rate for some products and at the same time a significant decline in
other products exports. It enjoyed a significant increase in food and live animals (0),
chemicals (5), manufactured goods (6), and not classified commodities (9) and to a
lesser extent animal and vegetable oil and fats (4). At the same time it faced a
significant decrease in mineral fuels, lubricants and related materials (3), and
52
machinery and transport equipment (7), and to a lesser extent miscellaneous
manufactured goods (8).
Qatar enjoyed a significant increase in its intra-GAFTA exports in two commodity
groupings namely chemicals (5) and machinery and transport equipment (7). On the
other hand, it experienced a significant decline in mineral fuels, lubricants and related
materials (3) as well as manufactured goods (6).
Data for Saudi Arabia exists only for 1995 and 2000. Saudi Arabia seems to have
been expanding its intra-GAFTA exports in several commodity groupings including
food and live animals (0), fuels, lubricants , and related materials (3), chemicals (5),
manufactured goods (6), machinery and transport equipment (7), and miscellaneous
manufactured goods (8).
Sudan seems to be expanding its intra-GAFTA exports as well in a number of
commodity groupings including food and live animals (0), crude material, inedible
except fuel (2), and fuels, lubricants and related materials (3), whereas animal and
vegetable oil and fats (4) seem to have been reduced significantly.
With regards to Syria, intra-GAFTA exports have increased in some commodity
groupings and declined in others. It has increased in food and live animals (0),
beverages and tobaccos (1), chemicals (5), and manufactured goods (6). On the other
hand, it has declined in crude material, inedible except fuel (2), fuels, lubricants , and
related materials (3), and miscellaneous manufactured goods (8).
Tunisia seems to be increasing its intra-GAFTA exports in 2005 in a significant
manner for a large number of commodity groupings after a decrease observed in 2000
including food and live animals (0), animal and vegetable oil and fats (4), chemicals
(5), manufactured goods (6), machinery and transport equipment (7), and
miscellaneous manufactured goods (8).
Data for United Arab Emirates (UAE) does not exist for 2005. UAE's intra GAFTA
exports seem to have experienced an increase in a large number of commodity
53
groupings including food and live animals (0), chemicals (5), manufactured goods (6),
machinery and transport equipment (7), and miscellaneous manufactured goods (8).
Finally, Yemen has also experienced a significant increase in a wide array of
commodity groupings in its intra-GAFTA exports including food and live animals (0),
beverages and tobacco (1), fuels, lubricants , and related materials (3), chemicals (5),
and machinery and transport equipment (7).
To sum up, the above analysis suggests that there are a number of commodity
groupings which seem to have enjoyed an increase in exports among a large number
of GAFTA members in their intra-GAFTA trade including food and live animals (0),
chemicals (5), manufactured goods (6), and machinery and transport equipment (7).
Fuels, lubricants, and related materials (3) and miscellaneous manufactured goods (8)
did enjoy some increase but not as significant as the first set of commodities.
Beverages and tobacco (1), crude material, inedible except fuel (2), and animal and
vegetable oil and fats (4), and not classified good (9) did not enjoy any significant
change in intra GAFTA exports over the period 1995-2005.
It seems that the majority of countries have increased their intra-GAFTA exports
though with different degree of variation among countries and when focusing on
commodities. The three countries that have least expanded their intra-GAFTA exports
include Morocco, Algeria and Qatar.
It is worth noting that the analysis on the commodity level in general is in line with
analysis on the country level. However, they are not identical. Reasons for divergence
in results include using different database, and the application of an aggregate
approach in the country level whereas on the commodity level, a more disaggregated
approach is utilized. Hence, for a country which has experienced for example, a
decrease in its intraregional trade in a number of commodities with an exception of an
increase in one or two commodity groupings, it might experience an overall increase
in the country analysis and appears modest in the commodity analysis.
54
Figure 1.10.: Intra-GAFTA Exports by Commodity (1995-2005)
Source: ComTrade database
0
100
200
300
400
500
600
700
800
900
1000
0 1 2 3 4 5 6 7 8 9Commodity Code
US$ millions
1995
2000
2005
Algeria
0
100
200
300
400
500
600
700
800
0 1 2 3 4 5 6 7 8 9Commodity Code
US$ millions
1995
2000
2005
Bahrain
0
100
200
300
400
500
600
700
800
0 1 2 3 4 5 6 7 8 9Commodity Code
US$ millions
1995
2000
2005
Egypt
0
100
200
300
400
500
600
0 1 2 3 4 5 6 7 8 9Commodity Code
US$ millions
1995
2000
2005
Jordan
Kuwait
0
20
40
60
80
100
120
140
160
180
0 1 2 3 4 5 6 7 8 9Commodity Code
US$ millions
1995
2000
Morocco
0
20
40
60
80
100
120
140
0 1 2 3 4 5 6 7 8 9Commodity Code
US$ millions
1995
2000
2005
Oman
0
100
200
300
400
500
600
700
800
900
1000
0 1 2 3 4 5 6 7 8 9Commodity Code
US$ millions
1995
2000
2005
Qatar
0
50
100
150
200
250
300
350
400
450
0 1 2 3 4 5 6 7 8Commodity Code
US$ millions
1995
2000
2005
0
2000
4000
6000
8000
10000
12000
14000
0 1 2 3 4 5 6 7 8 9Commodity Code
US$ millions
1995
2000
Saudi Arabia
0
20
40
60
80
100
120
140
0 1 2 3 4 5 6 7 8 9Commodity Code
US$ millions
1995
2000
2005
Sudan
Syria
0
100
200
300
400
500
600
700
0 1 2 3 4 5 6 7 8 9Commodity Code
US$ millions
1995
2000
2005
Tunisia
0
50
100
150
200
250
300
0 1 2 3 4 5 6 7 8 9Commodity Code
US$ millions
1995
2000
2005
0
50
100
150
200
250
0 1 2 3 4 5 6 7 8 9Commodity Code
US$ millions
1995
2000
2005
Yemen United Arab Emirates
0
500
1000
1500
2000
2500
3000
3500
4000
4500
0 1 2 3 4 5 6 7 8 9Commodity Code
US$ millions
2000
2005
55
References to part 1:
Abedini, J. and N. Péridy (2008), “The Greater Arab Free Trade Area (GAFTA): An
Estimation of its Trade Effects”, Journal of Economic Integration, forhtcoming
Al-Atrash, H. and T. Youssef (2000), “Is Arab Regional Integration Too Little”, IMF
Working Paper No. 00/10
Bayar, A. (2005), “An Evaluation of the Benefits and Challenges of the South-South
Integration among the Mediterranean Partner countries”, FEMISE Report, FEM-22-
27.
Boussetta, M. (2004), “Espace Euro-méditerranéen et Coûts de la Non Intégration
Sud-Sud: le cas des pays du Maghreb”, FEMISE Report, FEM-21-43.
CATT (2005), “Obstacles to South-South Integration, to Trade and to Foreign Direct
Investment: the MENA Countries Case”, FEMISE Report, FEM-22-36.
Dennis, A. (2006) “The impact of regional trade agreements and trade facilitation in
the Middle-East North Africa region”, World Bank Policy Research Working Paper,
3837.
Dervis, K., P. Bocok, and J. Devlin (1998) “Intraregional Trade among Arab
Countries: Building Competitive Economic Neighborhood” paper presented at the
Middle East Institute 52nd Annual Conference, Washington Dc.:, October, 1998
Devlin, J. and J. Page (2001), “Testing the Waters: Arab Integration,
Competitiveness, and the Euro-Med Agreements” in Dessus, S., J. Devlin and R.
Safadi (eds), Towards Arab and Euro-Med regional Integration, OECD, ERF and the
World Bank
Economic and Social Commission for West Asia (ESCWA) (2001), “Free Trade
Areas in the Arab region: Where Do We Go from Here?, ESCWA Document Nr.
E/ESCWA/ED/2001/4
56
Economic and Social Commission for West Asia (ESCWA) (2007), Annual Review of
Developments in Globalization and regional Integration in the Arab Countries, 2006,
New York: UN-ESCWA.
El-Erian, M. (1997), “Globalization and the Arab Economies: From Marginalization
to Integration”, Egyptian Center of Economic Studies (ECES) Working Paper No. 14,
Cairo: ECES.
Fawzy, S. (2003), “The Economics and Politics of Arab Economic Integration” in
Galal, Ahmed and Bernard Hoekman (eds.) Arab Economic Integration: Between
Hope and Reality, Brookings Institution Press and ECES.
Fischer, S. (1993), “Prospects for Regional Integration in the Middle East”, in de
Melo, J. and A. Panagariya (eds.), New Dimensions in Regional Integration,
Cambridge: Center for Economic Policy Research (CEPR) and Cambridge University
Press
Galal, A. (1996), “Incentives for Economic Integration in the Middle East: An
Egyptian Perspective” Egyptian Center of Economic Studies (ECES) Working Paper
No. 5, Cairo: ECES.
Galal, A. (2000), “Incentives for Economic Integration in the Middle East”, in
Hoekman, B. and H. Kheir-El-Din (eds) Trade Policy Developments in the Middle
East and North Africa, World Bank and ERF.
Hadhri A. (2001), “La Grande Zone Arabe de Libre-Echange et les Perspectives
d’Intégration Sud-Sud en Méditerranée”, Conférence FEMISE, mars 2001.
Havrylyshyn, O. and P. Kunzel (1997), “Intra-Industry Trade or Arab Countries: An
Indicator of Potential Competitiveness” IMF Working Paper No. WP/97/47.
57
Hoekman, B. and P. Messerlin (2002a), “Initial conditions and Incentives for Arab
Economic Integration: Can the European Union’s Success be Emulated”, Egyptian
Center of Economic Studies (ECES) Working Paper No. 75, Cairo: ECES.
Hoekman, B. and P. Messerlin (2002b), Harnessing Trade for Development and
Growth in the Middle East, Report by the Council on Foreign Relations Study Group
on Middle East Trade Options.
Kheir-El-Din, H. and A. F. Ghoneim (2006a), “Arab Trade Integration in Retrospect:
Comparison with the European Union Experience and Lessons Learnt” in Naglaa El
Ehwany (editor), Integration and Enlargement of the European Union: Lessons to be
for the Arab Region, A publication of the Center of European Studies and Knorad
Adenaur Foundation.
Kheir-El-Din, H. and A. F. Ghoneim (2006b), “The Economic and Regulatory Policy
Implications of Overlapping Preferential Trade Agreements in the Arab Countries:
The Case of Egypt”, Research project undertaken for IDRC. Project Coordinator
Hanaa Kheir-El-Din The Economic and Regulatory Policy Implications of
Overlapping Preferential Trade Agreements in the Arab Countries. Published as ERF
Special Report.
Kamrava (2004) “Structural impediments to economic globalization in the Middle-
East, Middle-East Journal, 6(4): 96-112.
Konan, D. E. (2003), “Alternative Paths to Prosperity: Economic Integration among
Arab Countries”, in Galal, Ahmed and Bernard Hoekman (eds.) Arab Economic
Integration: Between Hope and Reality, Brookings Institution Press and ECES.
League of Arab Nations (2004),Non Tariff Constraints based on Field Surveys and
their Relevance to Arab Countries’ Trade Policies, Comprehensive report of the
Economics Department, League of Arab Nations.
League of Arab Nations (2006), The Unified Arab Report, Cairo: LAN
58
League of Arab Nations (2007), unpublished reports on GAFTA related meetings and
their minutes.
League of Arab Nations (2008a), The Unified Arab Report, Cairo: LAN
League of Arab Nations (2008b), The Private Sector’s Perception on Realistic Needs
of GAFTA, What after Tariff Constraints, The 15th Report of the General Trade,
Industry, and Agriculture Federation of Arab Countries submitted to the Economic
and Social Council of League of Arab Nations
Limam, I. and A. Abdalla (1998), “Inter-Arab Trade and the Potential Success of
AFTA”, Arab Planning Institute (API) Working Paper Series No. 9806, Kuwait: API.
MINEFI (2005), “La Zone Arabe de Libre-Echange (GAFTA) ”, Ambassade de
France en Syrie, Mission Economique.
Momani, B. (2007) “A Middle East Free trade area: Economic interdependence and
peace considered”, The World Economy, 30(11): 1682-1700
Neaime S. (2005), “South South Trade, Monetary and Financial Integration and the
Euro-Mediterranean Partnership: An empirical Investigation”, FEMISE Report, FEM-
22-39.
Saidi, N. (2003), “Arab Economic Integration: An Awakening to Remove Barriers to
Prosperity”, Economic Research Forum (ERF) Working Paper Series No. 0322,
Cairo: ERF.
Sekouti N. (1999), “The Arab Free Trade Area (AFTA): Potentialities & Effects”,
New economic developments and their impact on Arab economies, pp. 257-81,
Amsterdam; New York and Oxford: Elsevier Science, North-Holland.
Tahir J. (1999), “Free Economic Zones in Arab Countries in the Context of Arab Free
Trade Areas and World Trade Organization Arrangements: Trends and Future
59
Prospects”, New economic developments and their impact on Arab economies, pp.
331-403, Amsterdam; New York and Oxford: Elsevier Science, North-Holland.
Tovias, A. (2004), “Economic Cooperation Potential between the Mashrek Countries,
Turkey and Israel”, FEMISE Report, FEM21-18.
United Nations (2007), Commodity trade statistics, COMTRADE database.
World Bank (2007), Middle East and North Africa Region: Economic Developments
and Prospects 2007, Job Creation in an Era of High Growth, Washington D.C.:
World Bank.
World Trade Organization (WTO) (2007), World Trade Organisation Trade Statistics,
Statistics Database, long run time series.
Zarrouk, J. (2000), “The Greater Arab Free Trade Area: Limits and Possibilities” in
Hoekman, B. and J. Zarrouk (eds.), Catching Up with the Competition: Trade
Opportunities and Challenges for Arab Countries, An Arbor: The University of
Michigan Press
Zarrouk, J. (2001), “Linkages Between Euro-Mediterranean and Arab Free Trade
Agreements” in Dessus, S., J. Devlin and R. Safadi (eds.), Towards Arab and Euro-
Med regional Integration, OECD, ERF and the World Bank
60
2. Welfare effects of GAFTA: From theory to inquiries
This section aims to highlight the effects of regional integration on GAFTA countries’
economies. For that purpose, the various channels by which regional integration can
influence welfare must be identified. This is why the analysis presented here starts
from a short survey of the theory of PTA (section 1). In a second section, an original
theoretical model of regional integration is proposed. This model includes four types
of welfare effects due to regional integration: perfect competition, imperfect
competition, dynamic and economic distortion effects. Once identified, these effects
can be tested in section 3 in the case of GAFTA. This can be achieved by the
implementation of an inquiry in various GAFTA countries.
2.1 A short survey of the theory of PTAs
The traditional theory of customs union, developed by Viner (1950), provides a first
understanding about the effects of regional economic integration. In particular, this
author shows that the net welfare impact of a customs union depends on the
magnitude of trade creation, in comparison with trade diversion. Kemp and Wan
(1976) go further by showing that a customs union improves the welfare of its
members without reducing that of the rest of the world. This can be achieved by
choosing an appropriate common external tariff (CET). However, until recently, this
Kemp-Van Pareto-improving customs union could not be extended to free trade areas.
This is due to the fact that member-specific tariff vectors imply that the domestic-
price vectors differ across member countries. As a result, the FTA generally fails to
equalize marginal rates of substitutions across its members. Some extensions of this
model take into account intermediate inputs (Krishna, 2005). They do not
significantly change the results obtained previously, but make it possible to discuss
more in detail the impact of trade deflection.
Given the difficulties to obtain a clear predictable welfare impact of a PTA, many
attempts have been made to refine the theory in order to identify member-country
characteristics that would ensure welfare improvement. In this regard, the mainstream
theory of customs unions and FTAs provides the following conditions for increasing
61
welfare (McMillan and McCann, 1981; Robson, 1998: Bhagwati et al., 1999,
Jovanovic, 2006).
- The demand for third countries’ exports must be low and that for partner
countries’ exports must be high.
- Trade barriers in third countries must be high.
- The initial tariff should be high and the common external tariff should be low
(this condition depends however on the elasticity of trade flows to the change
in tariffs)
- Member countries’ supply and demand should be strongly elastic to price
changes.
- The number of countries that participate in the customs union should be high
in order to reduce trade diversion.
- Partner countries should be competitive while offering similar production
structure. This makes easier the possibility of reallocation, which is source of
trade creation. In other words, partner countries should not be complementary.
- When the production overlap is significant, unit costs for the same product
should be different so as to maximize trade creation.
- The less developed the economies prior to integration, the higher the potential
opportunities for the benefits from specialization through regional integration.
- More recently, it has been increasingly recognized that geographic proximity
is an additional key predictor of trade creation and welfare improvement in
PTAs (Wonnacott and Lutz, 1987; Krugman, 1991; Summers (1991).
Although the mainstream theory provides interesting insights about the effects of
regional economic integration, it is based on very restrictive and sometimes irrelevant
assumptions (Pomfret 1997, 2003; Robson 1998; Jovanovic 2006). First of all, terms
of trade effects are neglected, as the demand for imports from the rest of the world is
assumed to be unchanged after the formation of a customs union. Second, competition
is assumed to be perfect. This implies that scale economies are disregarded as well as
product differentiation, imperfect information and trade costs (except tariffs). Third,
economies are static with constant expectations. As a result, economic growth,
technology, productivity as well as tastes and propensities to consume, invest and
import are given and fixed. In addition, there is no depreciation of the capital stock.
62
Factor mobility is also assumed to be perfect within a country, but is not allowed
across countries. This is to say that trade alone can ensure factor price equalization.
Thus, foreign direct investment (FDI) is disregarded. Finally, domestic distortions are
generally neglected in the standard mainstream theory.
Given these restrictive assumptions, the mainstream PTA model has been
significantly extended, especially in the past two decades.
One major recent improvement concerns the welfare impact fo FTAs. As already said,
the Kemp-Wan approach failed to show the conditions by which FTAs can be welfare
enhancing. However, Panagariya and Krishna (2002) solved this problem by showing
that FTAs necessarily increase welfare so long as the rules of origins are appropriately
selected. In other words, the external tariff can vary across countries as long as they
are selected to induce the same external trade flows for the member country with non
union members that initially prevailed. Grinols and Silva (2007) reached the same
finding within a simplified framework.
A second extension includes terms of trade effects. Mundell (1968) has shown first
that if the formation of a customs union affects the demand for imports from the rest
of the world, the union’s terms of trade will improve. This effect operates to reduce
the loss related to trade diversion, and it may suffice to eliminate this loss if the fall in
the price of the imported product is significant. Extending this analysis to FTAs gives
less clear results (Robson, 1998). As a matter of fact, it can be shown that the terms of
trade improvement will be smaller in the FTA than in the customs union.
Another channel by which the union can improve its terms of trade is related to its
size. Indeed, the greater the economic area of the tariff-levying unit, the more likely
the improvement in the union’s terms of trade. Moreover, the larger the customs
union, the greater its bargaining power related to tariff negotiations, and the more
likely terms of trade are favourable to the union (Wonnacott and Wonnacott, 1981).
A second extension introduces imperfect competition, especially economies of scale.
A first attempt is made by Corden (1972) within the Vinerian framework. It shows
that scale economies lead to two additional effects. The first is the “cost reduction
63
effect of realizing scale economies, which yields additional gains. The second effect is
“trade suppression”, which occurs when a partner increases its exports to the other
partner thanks to scale economies, at the expense of the rest of the world. This effect
increases the loss from trade diversion. Thus, this extension does not provide a clear
result about the overall effect of scale economies.
However, more recent studies clearly stress the gains from imperfect competition,
especially scale economies (Cox and Harris, 1985; Smith and Venables, 1988;
Baldwin and Venables, 1995). Starting with a general equilibrium framework with
imperfect competition, these authors use assumptions derived from the new trade
theory of international trade (Helpman and Krugman, 1985; Waples, 2004) with scale
economies and product differentiation. It must also be stressed that gains from scale
economies can occur when these economies are internal or external to the firm (El
Agraa, 1999).
The specification of trade costs, especially non tariff barriers (NTBs) is an additional
extension to the mainstream theory. In this regard, Baldwin (1994) shows in a
Vinerian framework that in principle, trade diversion vanishes when trade barriers are
made of NTBs only, because there is generally no tariff revenue. However, two cases
must be distinguished. If NTBs are purely cost-increasing (like customs formalities),
then any reduction in this cost is welfare increasing. However, if the NTBs are not
purely cost increasing (like rent-generating quotas), the reduction in trade cost can
still give rise to welfare-reducing trade diversion. In this last case however, trade
diversion remains less important with NTBs that with tariffs.
Dynamic effects of PTAs have also been increasingly investigated in recent years.
They relate to numerous means by which regional integration may influence the rate
of growth of GDP of the participating nations (Haveman et al., 2001). In particular,
the effects of technical efficiency have been explored in Baldwin (1992). In this
article, factor accumulation is taken into account and it is assumed that trade policy
can affect the steady state levels. This gives rise to dynamic investment and growth
effects, which impact on the production and the welfare of the economies. Measuring
this effect suggests that the size of this dynamic gain from trade can be significant,
depending on the wedge between social and private returns to capital. Another
64
popular dynamic effect concerns the reduction of monopoly power due to increased
competition within the PTA (Harris, 1997). In this case, prices fall and consumption
increases, suggesting a rise in welfare.
The final extension concerns domestic distortions, such as the presence of trade
unions which negotiate wage rates in excess of the equilibrium rates. Such distortions
can also be due to the role of government which introduces minimum wage
legislation. This results in a social average cost which lies below the private one.
Jones (1980) and El-Agraa (1999) show that the formation of a customs union in the
presence of domestic distortion in the home country leads to a fall in the cost-reducing
gain in the home country and a rise in the gains in the partner country, due notably to
an increase in its sales to the home country.
To sum up, the traditional economic gains from PTAs identified by the mainstream
theory must be supplemented by the additional gains mentioned above, especially
within an imperfect competition framework. One problem with recent theories of
customs unions is that they generally concentrate on one particular extension only, i.e.
scale economies, or technical efficiency or terms of trade. One exception is Baldwin
and Venables (1995) which include most of the extensions developed before in a
single framework. As a result, the formation of a PTA is assumed to affect welfare
through the various channels identified above, like trade creation and trade diversion,
NTBs, terms of trade, scale economies, product differentiation, etc… However, this
model is still limited by some restrictive assumptions. For example, labour is assumed
to be constant, technology and technical progress are disregarded as well as economic
growth, FDI as well as domestic distortions.
The next section goes further by proposing an original theoretical model which
incorporates these extensions.
65
2.2 Welfare effects of free trade area: A generalized model in imperfect
competition
This section proposes an extended version of Baldwin and Venables (1995). This
extension includes labour as a variable, technical progress, foreign direct investment
(FDI) as well as economic distortions.
Welfare of a representative consumer in a country can be represented by an indirect
utility function V(p+t, n, E), where p is the vector of border prices, t is the vector of
trade costs (including tariffs), n is the vector which accounts for the number of
product varieties available and E is the total spending on consumption.
Expenditure is the sum of factor revenue, profit and rent from trade barriers minus
investment I.
[ ] FDIItmTxrwatpXrKLwwwLE m +!+!!++"++!+= #),,()()( (1)
The reward accruing to labor is made of the equilibrium wages (w) as well as a
supplement corresponding to the domestic distortion due to wage negotiation at
higher price that equilibrium wages (such as a minimum wage). As a result, the actual
wage received by workers is wm. Capital K is rewarded according to the interest rate r.
It is also assumed that the two factors L and K are supplemented by exogenous
technical progress Π, in line with the Solow growth model.
Denoting X as the economy’s production vector, “a” the average costs at sector level
(which in turn depend on factor prices (r and w) and production per firm (x) in each
sector) and T taxes for each unit produced, then profits can be written as the
difference between total receipt (X(p+t)), and total costs (Xa(w,r,x)+XT).
The domestic trade rent is captured by αtm, where m is the net import vector. α is a
diagonal matrix that measures the nature of trade protection (α=1 means that the trade
protection is made of tariffs or other rent-making policy; α=0 means that no trade rent
is captured domestically, like in the case of quotas or other NTBs). As a result, if
66
trade protection is only made of tariffs, the rent is equal to tm. If it is made of quotas
only, then the rent is null.
Net foreign direct investment (FDI) is also added to the expenditure function since
foreign firms make it possible to increase the capital domestically available.
Totally differentiating the indirect utility function gives:
dEE
Vdn
n
Vtpd
tp
VdV
!
!+
!
!++
+!
!= )(
)( (2)
Denoting Vp+t the marginal utility of prices, Vn the marginal utility of varieties and VE
the marginal utility of expenses, dV can be rewritten as:
=> dEVdnVtPdVdV Entp +++= + )( (2’)
Dividing by VE, it comes:
dEdnV
VtPd
V
V
V
dV
E
n
E
tp
E
+++=+
)( (3)
From (1) and (2), we get:
dFDIdItmdtdmdXTatp
dxXadrXadwXatpXddKdrrdKdLwLdwdE xrwmm
+!++!!+
+!!!++"++++=
)()(
)(
## (4)
Replacing into (3) gives:
dFDIdItmdtdmdXTatpdxXadrXadwXa
tpXddKdrrdKdLwLdwdnV
VtPd
V
V
V
dV
xrw
mm
E
n
E
tp
E
+!++!!++!!!
++"+++++++=+
)()(
)()(
##
(5)
This equation can be simplified by the use of four assumptions. The first is the Roy
identity:
67
mXV
V
E
p!=+ (6)
The second is the Shephard’s lemma and factor clearing equation:
r
w
XaK
XaL
=
= (7)
Thirdly, it is assumed that dI generates a permanent change in the capital stock
yielding to a social rate of return rs discounted at rate ρ. This makes it possible to
write:
dIr
rdKs
!= (8)
Finally, using the Solow model, it can easily be shown that in case of demographical
change and technical progress, the steady state equilibrium of the economy gives:
dY=dL+dΠ (9)
In other words, the economy’ rate of growth (dY) is equal to the growth rate of the
population and the technical progress.
Using these assumptions and rearranging equation (5) provides:
mdpttmdtdmV
dV
E
!!!= )( "" (10) (a)
dnV
VdxXadXmtP
E
n
x+!!++ )( (b)
dYdFDIdIrs ++!!
"
#$$%
&'+ 1
( (c)
TdXdLwwm
!!+ )( (d)
68
Equation (10) summarizes the potential effects of PTAs on welfare since we have
shown previously that PTA can have an impact on all the components included in this
equation.
More precisely, line (a) of equation (8) provides the welfare effects of PTAs in
perfect competition. Indeed, αtdm is the trade volume effect. If trade barriers are only
made of tariffs, any rise in imports due to the fall in tariffs leads to a change in
welfare by tdm. This change will be positive if imports increase after the formation of
the customs union. As noted by Baldwin and Venables (1995), this first term is
equivalent to the standard Vinerian theory.
The second terms in line (a) is given by md(t-αt). This is a trade cost effect. It
measures the welfare impact of the changes in the trade barriers which do not lead to a
rent. For instance, if all barriers are made of tariffs (α=1), then, this cost is zero,
whereas if all barriers are NTBs without rent, then a reduction in these barriers gives
rise to an increase in welfare by mdt. This term was initially neglected by Viner and
this model clearly indicates that the reduction in NTBs within a PTA is an additional
source of welfare gain.
The third term in line (a) corresponds to terms of trade effect. As already mentioned
in the previous section, the formation of a PTA is expected to increase the terms of
trade of the union. As a result, the fall in the import price is an additional gain for a
PTA. However, as mentioned in the previous section, this gain is likely to be greater
the larger the PTA and the more significant its bargaining power. Moreover, such a
gain is higher if the PTA is a customs union rather than a free trade area.
Line (b) of equation provides welfare effects in imperfect competition. The first term
(p+t-a)dX is a production effect. This effect arises if there is a change in output in
industries where prices differ from average cost. The second term (Xaxdx) accounts
for the scale economies effect. It measures the value of changes in average costs
induced by changes in firm scale. The last term is a variety effect. It arises because the
number of product varieties available for the consumer is greater after the formation
of the PTA than before. Indeed, the number of product varieties originating from the
69
partner country increase in the domestic country. This increases the domestic welfare,
as shown by the new theory of international trade and PTAs.
Line (c) highlights the dynamic effects of PTAs. The first is the investment effect.
This effect can be negative because it reduces expenditures in the short run. As a
result, investment is instantaneously costly. In the long run however, it makes it
possible to increase capital accumulation. Overall, investment increases welfare
provided that the social rate of return exceeds depreciation.
The second dynamic effect is a growth effect, especially due to technical progress and
improved efficiency. As already mentioned in the previous section, this effect can be
potentially important.
A final dynamic component is related to FDI effects. If the formation of a PTA makes
it possible to increase FDI, from both the partners and third countries, this can lead to
additional gains.
Finally, line (d) in equation (8) highlight the impact of economic distortions. For
example, above equilibrium wages can lead to an additional welfare gain, since it
increases expenditures. However, the formation of a PTA doe not itself introduces this
distortion. In fact, in the domestic country, it has been shown that given this
distortion, a PTA leads to a reduction in the cost reduction effect (negative welfare
effect). Moreover, the tax effects may also be negative on the overall welfare. As a
result, if the formation of a PTA leads to increased taxes, welfare is likely to decline.
The theoretical model developed above makes it possible to identify the potential
effects of the formation of a PTA on welfare. These effects are summarized in Table
2.1.
70
Table 2.1: Expected Welfare effects of the formation of a PTA
As compared to the theoretical equation (6), equation (6’) exhibits specific effects, in
particular βi and δj. In line with Anderson and Van Wincoop (2003), these effects are
assumed to account for price effects, which are not possible to estimate directly,
especially for developing countries. A time effect ϕt is also included to capture
business cycles. More generally, these effects make it possible to take into account the
heterogeneity of the data. They also capture the effects of potential omitted variables
(Egger, 2004). They can be considered as fixed or random depending on the
specification of the model.
The other variables are tentatively measured or estimated as follows: GDPs are
measured at 1995 price in purchasing power parity (PPP). The statistical source used
is Cepii (Chelem Database).
The number of varieties (Ni) is proxied by the difference in GDP per capita between
the exporting and the importing country. Indeed, according to the new trade theory
(Krugman, 1995), inter-industry trade prevails when this difference (which measures
the economic distance between two countries) is great. In this case, all products are
homogenous. There is no differentiation and thus no different varieties offered to the
consumer. On the other hand, when the incomes per capita are identical, trade is of
intra-industry type only. In this case, all the products are differentiated and the
number of varieties available for the consumer is maximum. Calculations are carried
out from the United Nations database (Comtrade).
The geographical distance is calculated as a weighted index, which takes into account
the spatial distribution of population within each country (Clair et al, 2004; source:
Cepii, 2007).
Two alternative variables are used for measuring tariffs. The first is a direct measure
of average bilateral tariffs (source: TRAINS), which will be applied to the country
sample restricted to GAFTA countries only. As a second proxy, we use dummy
variables which correspond to regional economic integration. These dummies will be
used in the enlarged country sample, which covers the European Union (EU), the
North American Free Trade Area (NAFTA), the Latin American customs union
(MERCOSUR), the Euro-Mediterranean agreement (EUROMED) as well as GAFTA.
93
All these variables are expected to exhibit a positive coefficient, as in all cases,
regional integration has led to significant tariff cuts. However, these tariff cuts are
limited in the EUROMED area, because agricultural products have been excluded
from this agreement.
Lij is a dummy variable which takes the value 1 if a common language is spoken by at
least 10% of the population in each country pair (exporter and importer) and 0
otherwise (source: Cepii, 2007).
Border effects are measured by a dummy which is equal to zero for trade within a
country and one for trade across countries. This variable requires data on internal
exports, which are calculated as the difference between production and total exports
(this method is now standard in the empirical literature). Internal distance is measured
in the same way as international distance (Cepii, 2007).
Ajt denotes the degree of confidence of economic agents with regard to justice and law
in country j. This variable is a proxy for expectations. The higher confidence in the
importing country, the lower expected trade costs in this market. Therefore, a positive
value of a6 is expected. Data come from Kaufman et al. (2006).
The lagged export variable measures hysteresis in international trade. Indeed, due to
the presence of sunk costs, the firm which is willing to export must ensure before
exporting that she will be able to amortize these sunk costs. This requires that
exporting firms remains in the exporting market for a very long time (Baldwin and
Krugman, 1989).
The final variable to be estimated corresponds to scale economies. For that purpose,
we start from a production function with three factors: labour (L), capital (K) as well
as a time effect T which is supposed to capture technical change.
),,( TLKfY = (7)
The production Y is assumed to be homogenous of degree θ:
94
!kTLKfTkLkKf ),,(),,( = (8)
A translog approximation of Y is then used, following the method developed by Chan
and Mountain (1983), Kim (1992), Graham (2001) or Péridy (2004).
( ) ( )25
2
43210 log2
1log
2
1logloglog KeLeTeKeLeeY +++++=
2
97762
1loglogloglog TeKTeLTeKLe ++++ (9)
This function is homogenous of degree θ if:
!=+21ee
087=+ ee
02654=++ eee (10)
In the next step, we use first order conditions for output maximization subject to an
expenditure constraint. These conditions lead to the derivation of factor cost shares,
which represent the share of each factor expenditure in total cost15:
L
YSL
log
log1
!
!="
(11)
K
YSK
log
log1
!
!="
(12)
Normalizing the translog parameters by (1/θ) and differentiating the translog equation
result in the following translog production system:
( ) ( )
!!!!
"
#
$$$$
%
&
++++
+++++
=2*
9
*
8
*
7
*
6
2*
5
2*
4
*
3
*
2
*
1
*
0
2
1loglogloglog
log2
1log
2
1loglog
log
TeKTeLTeKLe
KeLeTeKeLee
Y ' (13)
TeKeLeeSL
*
7
*
6
*
4
*
1 loglog +++= (14)
TeLeKeeSK
*
8
*
6
*
5
*
2 loglog +++= (15)
15 For a complete derivation af the model, refer to Graham (2001).
95
With ei*=ei/θ ∀i=1,…,9
And the following constraints:
1*
2
*
1=+ ee
0*
8
*
7=+ ee
02*
6
*
5
*
4=++ eee (16)
Although the above system can be estimated efficiently, the factor shares add up to
one, which makes the system singular. The standard procedure for handling this
problem is to drop an arbitrary share equation from the system and to impose this
constraint (Greene, 2003). This makes it possible to produce the final non singular
system:
( ) ( )
!!!!
"
#
$$$$
%
&
++++
++++
=2*
9
*
8
*
7
*
6
2*
5
2*
4
*
3
*
1
*
0
2
1loglogloglog
log2
1log
2
1log
log
TeKTeLTeKLe
KeLeTeK
Lee
K
Y'
' (17)
TeKeLeeSL
*
7
*
6
*
4
*
1 loglog +++= (18)
0*
8
*
7=+ ee
02*
6
*
5
*
4=++ eee (19)
This system can be estimated using Full Information Maximum Likelihood (FIML),
following for instance Tsionas and Loizides (2001). Data used are derived from the
UNIDO industrial database (UNIDO, 2008). Production is measured by the value
added in manufacturing industries. As proxies for production factors, we used the
total number of employees as well as the cumulative growth fixed capital formation.
For most countries, estimations have been run over the period 1963-2003 (41 years).
However, for a significant number of GAFTA countries and other emerging countries,
the period taken into consideration is shorter because of the lack of data.
96
Estimations of scale economies are displayed in Table 3.1. With regard to GAFTA
members, it is striking to observe that most of them exhibit significant scale
economies, especially Maghreb countries as well as most Gulf countries. This can be
mainly explained by the fact that firms have still not reached their optimal size.
Another explanation is related to the case of imperfect competition characteristics,
especially concerning petroleum or chemical industries.
Table 3.1: Estimation of scale economies GAFTA countries EU and other OECD Emerging countries
Morocco 1.691 Bulgaria 1.589 Malaysia 1.602
Tunisia 1.562 Germany 1.401 Indonesia 1.587
Libya 1.558 Sweden 1.398 Thailand 1.499
Algeria 1.485 Iceland 1.388 China 1.381
Saudi Arabia 1.485 Austria 1.362 Ecuador 1.333
Qatar 1.455 Canada 1.339 Brazil 1.302
Jordan 1.441 Hungary 1.338 Argentina 1.122
Oman 1.408 Switzerland 1.333 Venezuela 1.109
UAE 1.355 USA 1.324 Chile 1.062
Syria 1.298 Netherlands 1.297 Colombia 0.701
Yemen 1.222 Poland 1.201
Kuwait 1.155 Turkey 1.200
Egypt 1.037 United Kingdom 1.169
France 1.163
Finland 1.150
Mexico 1.082
Spain 1.073
Italy 1.061
Israel 1.055
Ireland 1.025
Portugal 0.897
Greece 0.874
Compared to the other countries in our database, GAFTA countries generally show
higher scale economy levels that in OECD countries, which have generally reached
their optimal size. In addition, these levels are of similar magnitude to Asian
emerging countries (China, Indonesia, Malaysia, Thailand), but they are higher than
those found in most Southern American countries.
These finding suggest that GAFTA countries could take advantage of GAFTA
implementation in order to increase production efficiency as well as trade
competitiveness. In this regard, the impact of scale economies on trade will be
assessed quantitatively in the next section.
97
3.2 Estimation , results and Sensitivity Analysis
The model is estimated in two steps. In the first step, the full country sample is used.
It includes 56 exporting and importing countries, of which most developed and
emerging countries as well as GAFTA countries (see Table 2). This makes it possible
to test the significance of the parameter estimates on a large scale, i.e. with a large
number of countries and observations. This also enables the comparison of the effects
of several regional trade arrangements, including GAFTA.
Table 3.2: The country sample 1 Argentina 21 Malaysia 41 Djibouti 2 Austria 22 Morocco 42 Egypt 3 Brazil 23 Mexico 43 Iraq 4 Bulgaria 24 Netherlands 44 Jordan
5 Canada 25 Peru 45 Kuwait 6 Chile 26 Philippines 46 Lebanon 7 China 27 Poland 47 Libya
8 Colombia 28 Portugal 48 Mauritania 9 Denmark 29 Spain 49 Oman 10 Ecuador 30 Sweden 50 Qatar
11 Finland 31 Switzerland 51 Saudi Arabia 12 France 32 Thailand 52 Somalia 13 Germany 33 Tunisia 53 Sudan
14 Greece 34 Turkey 54 Syria 15 Hungary 35 United Kingdom 55 UAE16 Iceland 36 United States 56 Yemen
17 Indonesia 37 Venezuela18 Ireland 38 Algeria 19 Israel 39 Bahrain 20 Italy 40 Comoros
In a second step, the country sample is limited to GAFTA countries only as exporters
and importers. This makes it possible to highlight the trade specificities of these
countries. In particular, the estimation of the parameter corresponding to the bilateral
tariff variable gives a first insight about the ex-post effects of the implementation of
GAFTA. In the two country samples, estimations are made over the period 1988-
2007.
98
3.2.1 Econometric specification
Tables 3.3 to 3.5 show the parameter estimates corresponding to the trade equation
(6’). As a sensitivity analysis, several estimators have been tested. The first two ones
are the LSDV and GLS, which respectively correspond to the standard fixed effects
and random effects models (FEM and REM). The Hausman test tends to favour the
fixed effects model, since it shows that the GLS can be biased by the correlation
between the residuals and some independent variables (endogeneity bias)16. However,
the FEM cannot estimate the parameters related to the time invariant variables, such
as distance, language, border effects, etc… In order to overcome the endogeneity bias,
the Hausman and Taylor model (HTM) is also presented. This estimator has been
increasingly used in panel data econometrics which include several time invariant
variables, since Egger (2004). In the present paper, it has been implemented by taking
GDP as the variable correlated with the residual. This makes it possible to increase
the theta statistics to a value close to unity, which suggests that the remaining
endogeneity bias is very small17.
Transformed fixed and random effects models (TFEM, TREM) are also presented in
the estimation results. They address the multiple heterogeneity of our dataset. Indeed,
as mentioned previously, our data exhibit heterogeneity across exporting countries,
importing countries, country pairs and time (quadruple heterogeneity). The TFEM and
TREM reduce the number of specific effects without losing any information
concerning the effect which has been removed. As a matter of fact, the specific time
effect has been withdrawn first by calculating the group average of each variable.
Secondly, the first difference of each variable has been computed. This makes it
possible to remove the time effect in the model, which can then be re-estimated with
the transformed variables without losing any information (for additional details, see
Abowd et al.1999 and Wooldridge, 2001).
16 The relevance of the FEM is also highlighted by the Wald tests, which point out the significance of all the specific effects, i.e. the export countries’ effects, the import countries’ effects, the bilateral effects as well as the specific time effects. 17 For additional details about this estimator, refer to Greene (2003).
99
The final estimator is the GMM proposed by Arellano, Bond and Bover (ABB)18. It
can estimate a dynamic model while addressing the potential bias due to the
correlation between the lagged dependent variable and any independent variable.
Basically, the structure of the model is similar to the static HTM described previously.
However, compared to HTM, the ABB approach provides additional efficiency gains
through GMM, by using a larger set of moment conditions (Greene, 2003).
Whatever the estimator considered in the tables, it is striking to observe that the
parameter estimates are remarkably stable across the various estimators. This is a first
indication concerning the robustness of the results. As an additional sensitivity
analysis, regressions have also been controlled and corrected for heteroskedasticity
and autocorrelation. Finally, multicolinearity is checked through the calculation of the
variance inflation factor. The latter remains at low levels (1.25), which is well below
the upper limit which is generally admitted (10).
3.2.2 Estimation results
a) Results for the full country sample
Table 3.3 exhibits the estimation corresponding to all the countries including in our
sample, i.e. 56 countries. Results are consistent with the theoretical expectations
derived previously. As a matter of fact, exports increase with the GDP in the
exporting or the importing countries. Similarly, exports decrease with the distance
between partner countries, whereas they rise if these countries speak a common
language. These results are commonly found in the traditional literature which applies
gravity model.
Results are also consistent with new developments in the gravity equation. For
example, border effects are always significant at the 1% level. This means that
crossing a frontier strongly reduces trade as compared with commodities which are
exchanged within a country, in accordance with McCallum (1995). Moreover,
expectations also play a significant role, as shown by the significant and positive
parameter estimates (Abedini, 2008). 18 Refer to Arellano and Bond (1998)
100
Table 3.3: Estimation Results (Full country sample)
where logHXijt reflects the hypothetical intra-GAFTA trade without the GAFTA
agreement.
We then define the net trade creation (NTC) as the difference between actual and
hypothetical intra-GAFTA exports:
ijtijt HXXNTC != (21)
Replacing HXijt from equation (21) into equation (20) and giving GAFTAijt and
NOGAFTAijt the value corresponding to the implementation of the GAFTA agreement
case (GAFTAijt = NOGAFTAijt =e), we find:
( ) eNTCXX ijtijt ln')ln(ln 66 !! ++"= (22)
This allows us to derive the net trade creation:
!"
#$%
&'=
+66'
11
((e
XNTC ijt
(13)
From this equation and the parameters α6 and α’6 estimated previously, we can
calculate that over the period 1997-2005, the GAFTA regional arrangement increased
intra-regional Arab trade by about 26.6% using the HTM estimator. This
correspondsto a gross trade creation of about 35.2% which is more than that estimated
in Abedini and Peridy (2008). The reason for this is that the present study takes into
104
account not only the traditional trade gains due to economic integration, but also gains
due to imperfect competition.
b) Results for the restricted country sample (GAFTA countries only)
Restricting the exporting and importing countries to GAFTA members only makes
it possible to highlight the specificities of these countries in terms of trade
determinants (Table 3.5). GDP and distance are significant and of similar
magnitude to the full country sample. The same remark also applies to the lagged
dependent variable19.
The tariff variable is also significant. This suggests that the reduction in tariff
barriers in the GAFTA area have actually increased intra-GAFTA trade. Looking
at the parameter estimates, it can be argued that 1% reduction in tariffs has led to a
0.2%/0.3% increase in trade within the GAFTA area. As a result, GAFTA trade
effects are significant. This correlates the results found in the previous table,
where the GAFTA dummy variable was significant.
However, compared with Table 3.4, there are some differences with the other
variables. In particular, the variables related to imperfect competition are
generally of lower magnitude (expectations and varieties) and sometimes become
insignificant (scale economies). These results are consistent with those already
found with the inquiry in Part 2. Indeed, we have concluded that imperfect
competition effects of GAFTA were small or neutral, especially with regard to
scale economies and the number of varieties. Such a conclusion is also valid here.
The main explanation can be found in market structures, where products are
poorly differentiated, consumer tastes are similar, and trade is mainly inter-
industrial. As a result, trade or welfare gains due to imperfect competition are
small compared to those found in Northern countries, especially the EU. Another
explanation can be found in GAFTA provisions, which ignore deep integration,
contrary to the European experience, especially since the implementation of the 19 The variable related to the common language has been dropped because all GAFTA countries speak the same language, i.e. Arabic.
105
European Single Market, which made it possible to take advantage of the gains in
imperfect competition.
Table 3.5: Estimation Results (GAFTA countries only)
* significant at 1%, ** significant at 5%, *** significant at 10%
c) An estimation of trade potentials
The model estimated previously can be used to calculate trade potentials across
GAFTA countries, thanks to the estimation of the residuals. Table 3.6 shows the
actual/fitted export ratio calculated for each country pairs at a yearly average
(1997-2006).
Table 3.6: Actua/Fitted export ratios in GAFTA countries importing\exporting Morocco Tunisia Algeria Egypt Jordan Kuwait Lybia Oman Qatar Saudi ArabiaSyria UAE Yemen