46
HOUSING MARKET REPORT 2019 MAY

HOUSING MARKETREPORT
2019M AY

‘Using our skills, we may be able to build stairs out of the stones which block our way.’
Count István Széchenyi
HOUSING MARKETREPORT
2019M AY

Published by the Magyar Nemzeti Bank
Publisher in charge: Eszter Hergár
H-1054 Budapest, Szabadság tér 9.
www.mnb.hu
ISSN 2498-6348 (print)
ISSN 2498-6712 (on-line)
Housing Market Report
(May 2019)
The analysis was prepared by Zita Fellner, Ákos Bereczki, Gábor Hajnal, Danila Pankov, Krisztián Szűcs, Sándor Winkler
(Directorate Financial System Analysis, Directorate Economic Forecast and Analysis)
The publication was approved by Márton Nagy
HOUSING MARKET REPORT • MAY 2019 3
The housing market represents a key area at the level of individual economic operators (households, financial institutions), as well as at the level of the national economy. Housing market developments are closely related to financial stability issues and also fundamentally determine the short- and long-term prospects of economic activity. Overall, it can be stated that the housing market is intrinsically linked to all areas of the national economy. Housing market developments, in particular the volatility of housing prices, influence the savings and consumption decisions of the household sector through its financial position, and also influence the portfolio, profitability and lending activity of financial institutions through the stock of mortgage loan collateral.
The ‘Housing Market Report’ aims to provide a comprehensive view of current trends on the Hungarian housing market and to identify and present the macroeconomic processes which influence housing market supply and demand. With this publication, the Magyar Nemzeti Bank regularly presents the relevant developments on the Hungarian housing market on a semi-annual basis.
The real estate market and within that the housing market is of key importance for the Magyar Nemzeti Bank in relation to fulfilling its primary tasks, based on inflation and economic considerations as well as financial stability aspects. The development of real estate market supply directly influences economic growth, while oversupply and inadequate supply can also have serious financial stability consequences. Housing price appreciation improves the financial position of households, prompting them to increase consumption, which influences both economic growth and inflation. Price appreciation also boosts the lending capacity of financial institutions by reducing their expected losses, which again invigorates the economy through lending growth. The correlation between the mortgage loan market and housing prices deserves particular attention: during business cycles, a mutually reinforcing relationship can develop between bank lending and housing prices.
The ‘Housing Market Report’ provides deeper insight into the factors behind market developments and the system of interactions between individual market agents by presenting a complex, wide-ranging set of information. The housing market already features in central banks’ publications, both in Hungary and at the international level, but typically from the point of view of the main topic of the respective publication. Consequently, the ‘Housing Market Report’ represents a unique central bank publication at the international level as well, due to its integrated presentation of the macroeconomic and financial stability aspects of the real estate market. The set of information used by the publication includes the following:
• The presentation of the macroeconomic environment influencing the housing market is based on the information contained in the MNB’s Inflation Report.1 Key statistical variables relating to the housing market include changes in the volume of gross value added, developments in real income and unemployment, and changes in the yield environment.
• The analysis of current housing market developments primarily relies on the information provided by the Hungarian Central Statistical Office. Information on changes in housing market turnover and housing prices can be divided into the differences between new and used housing market developments. In addition to this, data on the regional heterogeneity of the housing market are also used.
• The analysis of the residential mortgage loan market primarily relies on the balance sheet data of credit institutions and the interest statistics collected by the MNB; information on the qualitative features of lending developments collected in the Lending Survey2 is also used.
1 Magyar Nemzeti Bank, Inflation Report: http://www.mnb.hu/en/publications/reports/inflation-report2 Magyar Nemzeti Bank, Lending Survey: https://www.mnb.hu/en/financial-stability/publications/lending-survey
Published by the Magyar Nemzeti Bank
Publisher in charge: Eszter Hergár
H-1054 Budapest, Szabadság tér 9.
www.mnb.hu
ISSN 2498-6348 (print)
ISSN 2498-6712 (on-line)

HOUSING MARKET REPORT • MAY 2019 5
Contents
1 Executive Summary 7
2 Macroeconomic environment 92.1 Hungarian housing market demand 92.2 Hungarian housing market supply 11
3 Current housing market trends 163.1 Domestic housing market developments 163.2 Supply of new homes 273.3 An international outlook on housing market processes 34
4 Features of the residential mortgage loan market 36
List of boxes
Box 1: Impact of home constructions on GDP, by assessing sectoral relations 14Box 2: The analysis of the regional heterogeneity of Budapest’s housing market 20Box 3: The effect of the extension of HPS in 2016 and the reduced VAT for new homes
on the housing market 25Box 4: Conclusions of the session of the housing market section of the Real Estate Market
Advisory Board (LITT) 31

HOUSING MARKET REPORT • MAY 2019 7
1 Executive Summary
In 2018 the upswing of the domestic housing market continued within an environment of strong demand, which was also manifest in the dynamic growth of house prices and in the increase in the number of market transactions. However, the territorial differences in the domestic housing market continued to strengthen during the year. In 2018 house prices grew by 15.2 per cent nationally according to the MNB’s aggregate nominal house price index, which means slightly faster dynamics compared to the 14.6 per cent experienced in 2017. In real terms, house prices rose by 11.6 per cent in 2018 nationally. Considering price dynamics by settlement type, it is safe to say that the price gap continued to widen between larger and smaller settlements. In Budapest house prices grew by 22.9 per cent on a nominal basis in 2018, which means meaningfully faster dynamics compared to the 15.8 per cent registered in 2017. In rural cities the annual growth of house prices increased from 13.3 per cent in the previous year to 18.2 per cent, while in villages it decreased from 16.9 per cent to 2.3 per cent. The level of average square metre prices registered in villages therefore constituted only 21.6 per cent of the average level in Budapest in 2018, the value of which was still 36.2 in 2012.
Despite the dynamic increase, as a national average housing prices are still below the level justified by the economic fundamentals, while prices in Budapest have exceeded that level by some 15 per cent, therefore the risk of overvalued house prices in the capital has increased significantly. However, if we break down the housing market conditions of the capital, we can discover meaningful differences. Firstly, in the inner districts the ratio of investors may be higher partly because of tourism, secondly, the presence of foreign home buyers is also focused here, and thirdly, new housing developments are mainly present in the inner districts. At the beginning of the current housing market cycle, house prices in the inner districts started to increase more rapidly compared to the outer districts, which tendency has now reversed owing to the upward pressure on prices exerted by demand crowded out by the higher price level. Housing market experts estimate the ratio of investors in the capital at about 35 to 40 per cent, whose presence, according to the Housing and Real Estate Market Advisory Board (LITT), on the one hand alleviates the upwards pressure on rents, on the other hand, by renovating properties they improve the quality of the housing stock.
The upswing of the housing market is supported by several factors from the demand side. The underlying waging processes determining incomes further strengthened in 2018, and the financial position of households has also improved, due to a savings inclination that is high by historical comparison. Meanwhile, housing loans lent by credit institutions increased by 31 per cent in 2018, and nominally the value of new housing loans reached the same levels as around the time of the crisis, but in real terms they fall short of it. This reduces risks in the structure of indebtedness so that by the end of 2018 the issue of variable rate loans with an interest rate period of less than one year had been practically terminated, partly as a result of regulatory measures.
The family protection measures announced by the Government could substantially increase general demand in the housing market. In small localities affected by the rural HPS (Home Purchase Subsidy Scheme for Families), 43 per cent of transactions completed in 2017 and 2018 and involving properties larger than 90 m2 remained below the value of HUF 10 million, therefore the relatively high amounts of the HPS support increase the attraction of these small settlements significantly. Earlier, the extension of HPS in 2016 and the temporarily reduced VAT rate of new homes also had a meaningful impact on the domestic housing market. In Budapest the distribution of newly built apartments according to floor space changed: after the amendment of HPS, construction of relatively more housing units larger than 60 m2 started. According to our estimates, in addition, after the reduction of the VAT rate the price of new homes decreased by 9 per cent compared to the prices of used homes, i.e. 60 per cent of the tax cut benefited parties other than the consumers.
In 2018 36.7 home construction permits were issued and 17.7 thousand new homes were built, which means a decrease of 3.4 per cent and an increase of 22.9 per cent respectively, compared to 2017. According to the current plans of developers, deliveries of new apartments may peak in 2019, with approximately 29 thousand apartments. However, from 2020 the

MAGYAR NEMZETI BANK
HOUSING MARKET REPORT • MAY 20198
supply of new homes could become substantially tighter, for reasons including the end of the temporary term of validity of the reduced VAT rate and the uncertainty preceding the decision. In the deliveries of new homes, a decrease of 59 per cent can be expected in Budapest and 74 per cent in rural areas, compared to 2019. In total, the supply of new homes cannot keep pace with demand, and the number of newly announced homes falls short of the new homes purchased in the respective periods of time. As conveyed in the meeting of LITT, real estate professionals attribute the setback in the number of constructions of new homes mainly to the VAT rate having been restored to its original high rate and the cyclically high construction capacity demand of the state. Expanding the construction industry and within that, home constructions, to a healthy level would be desirable not only because of the currently low renewal rate of the housing stock by regional comparison but because it would also substantially promote economic growth. According to our calculations, the construction of ten thousand additional new apartments could create value added corresponding to 0.6-0.7 of GDP for 2018 and as many as 55 thousand jobs.
HOUSING MARKET REPORT • MAY 2019 9
2 Macroeconomic environment
In 2018 the surge of demand in the housing market continued, and the underlying income and financial processes still paint a favourable picture. The waging processes determining current incomes have further increased, and the financial position of households has also improved, due to an inclination to save that is high by historical comparison. The outflow of housing loans also continued at a brisk pace in the second half of 2018. The above phenomena predict brisk demand in the housing market, with favourable long-term income prospects. Responding to the demand, the housing market shows further growth in supply, although the supply adaptation of the sector is still slower compared to the earlier real estate market cycle, which can be primarily explained by the difficulties of obtaining skilled labour as well as by other production factors. The growth rate of housing prices continues to exceed the rate of the increase in housing construction costs, thus although this difference has somewhat attenuated over the last two quarters, the profitability of the housing market further increased, which has a favourable impact on the inclination for development. On the other hand, the dynamic wage outflow and shortages in the labour force that amplify it, coupled with the accelerating increase in construction expenditures could mitigate the encouraging force of housing construction from the cost side of the construction industry. The family protection measures supporting home creation announced this year could support demand for homes by residents in the coming years.
2.1 HUNGARIAN HOUSING MARKET DEMAND
The boost in the domestic housing market continued into the second half of 2018, which was supported on the demand side by the surge in the income processes of households; the favourable financing environment on the one hand, and to a significant extent, by the increasing utilization of government programmes stimulating home constructions, on the other. As a result of increasing demand, housing prices continued to rise, and in parallel with that the volume of new housing loan placements has continued to increase.
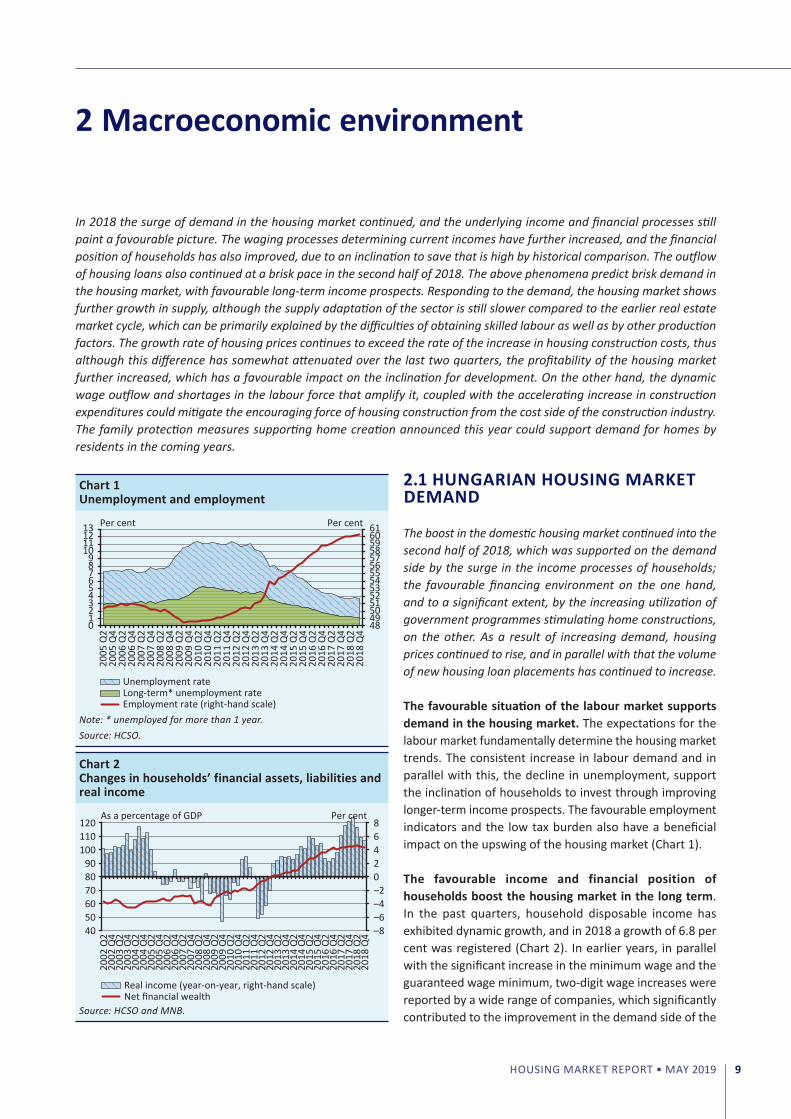
The favourable situation of the labour market supports demand in the housing market. The expectations for the labour market fundamentally determine the housing market trends. The consistent increase in labour demand and in parallel with this, the decline in unemployment, support the inclination of households to invest through improving longer-term income prospects. The favourable employment indicators and the low tax burden also have a beneficial impact on the upswing of the housing market (Chart 1).
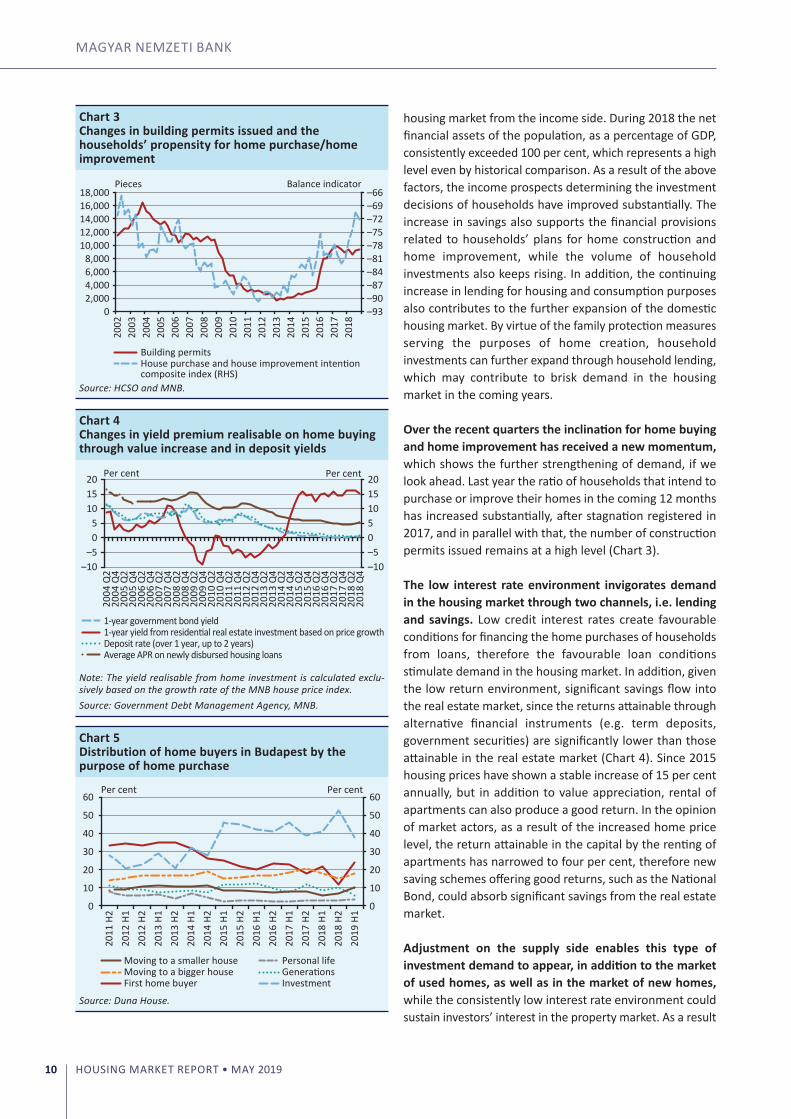
The favourable income and financial position of households boost the housing market in the long term. In the past quarters, household disposable income has exhibited dynamic growth, and in 2018 a growth of 6.8 per cent was registered (Chart 2). In earlier years, in parallel with the significant increase in the minimum wage and the guaranteed wage minimum, two-digit wage increases were reported by a wide range of companies, which significantly contributed to the improvement in the demand side of the
Chart 1Unemployment and employment
48 49 50 51 52 53 54 55 56 57 58 59 60 61
0 1 2 3 4 5 6 7 8 9
10 11 12 13
2005
Q2
2005
Q4
2006
Q2
2006
Q4
2007
Q2
2007
Q4
2008
Q2
2008
Q4
2009
Q2
2009
Q4
2010
Q2
2010
Q4
2011
Q2
2011
Q4
2012
Q2
2012
Q4
2013
Q2
2013
Q4
2014
Q2
2014
Q4
2015
Q2
2015
Q4
2016
Q2
2016
Q4
2017
Q2
2017
Q4
2018
Q2
2018
Q4
Per centPer cent
Unemployment rateLong-term* unemployment rateEmployment rate (right-hand scale)
Note: * unemployed for more than 1 year.Source: HCSO.
Chart 2Changes in households’ financial assets, liabilities and real income
–8 –6 –4 –2 0 2 4 6 8
40 50 60 70 80 90
100 110 120
2002
Q2
2002
Q4
2003
Q2
2003
Q4
2004
Q2
2004
Q4
2005
Q2
2005
Q4
2006
Q2
2006
Q4
2007
Q2
2007
Q4
2008
Q2
2008
Q4
2009
Q2
2009
Q4
2010
Q2
2010
Q4
2011
Q2
2011
Q4
2012
Q2
2012
Q4
2013
Q2
2013
Q4
2014
Q2
2014
Q4
2015
Q2
2015
Q4
2016
Q2
2016
Q4
2017
Q2
2017
Q4
2018
Q2
2018
Q4
Per cent
Real income (year-on-year, right-hand scale)Net financial wealth
As a percentage of GDP
Source: HCSO and MNB.
MAGYAR NEMZETI BANK
HOUSING MARKET REPORT • MAY 201910
housing market from the income side. During 2018 the net financial assets of the population, as a percentage of GDP, consistently exceeded 100 per cent, which represents a high level even by historical comparison. As a result of the above factors, the income prospects determining the investment decisions of households have improved substantially. The increase in savings also supports the financial provisions related to households’ plans for home construction and home improvement, while the volume of household investments also keeps rising. In addition, the continuing increase in lending for housing and consumption purposes also contributes to the further expansion of the domestic housing market. By virtue of the family protection measures serving the purposes of home creation, household investments can further expand through household lending, which may contribute to brisk demand in the housing market in the coming years.
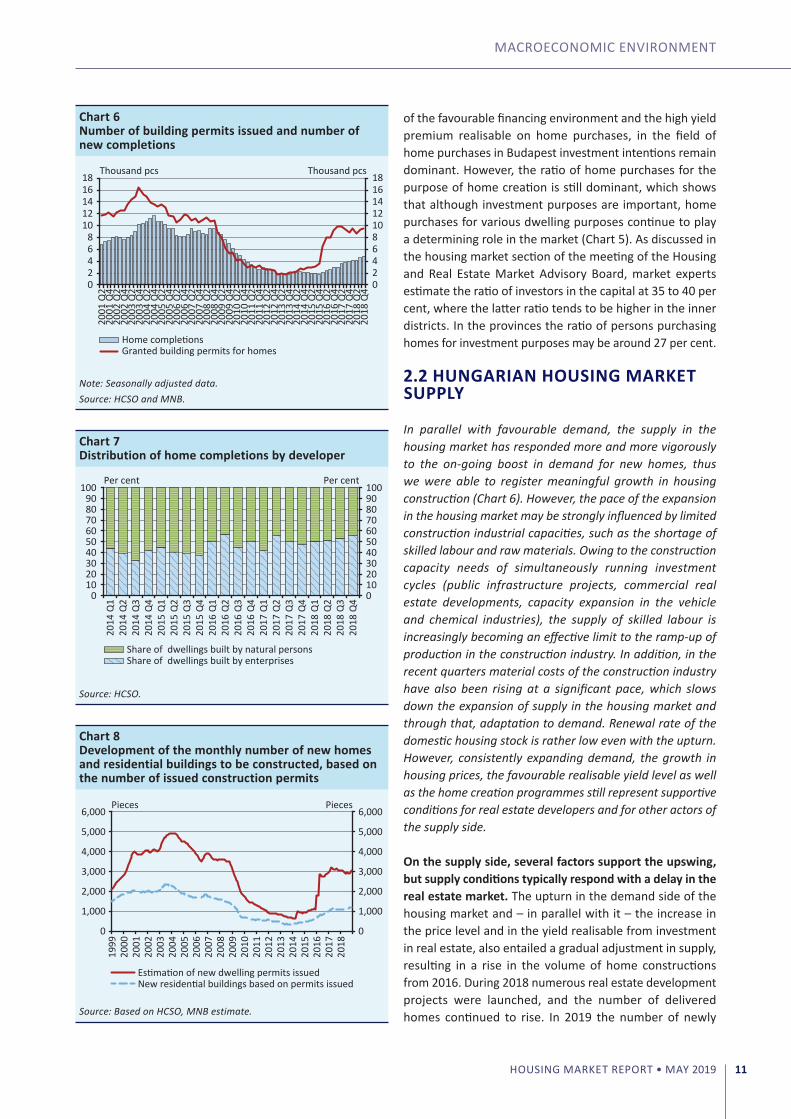
Over the recent quarters the inclination for home buying and home improvement has received a new momentum, which shows the further strengthening of demand, if we look ahead. Last year the ratio of households that intend to purchase or improve their homes in the coming 12 months has increased substantially, after stagnation registered in 2017, and in parallel with that, the number of construction permits issued remains at a high level (Chart 3).
The low interest rate environment invigorates demand in the housing market through two channels, i.e. lending and savings. Low credit interest rates create favourable conditions for financing the home purchases of households from loans, therefore the favourable loan conditions stimulate demand in the housing market. In addition, given the low return environment, significant savings flow into the real estate market, since the returns attainable through alternative financial instruments (e.g. term deposits, government securities) are significantly lower than those attainable in the real estate market (Chart 4). Since 2015 housing prices have shown a stable increase of 15 per cent annually, but in addition to value appreciation, rental of apartments can also produce a good return. In the opinion of market actors, as a result of the increased home price level, the return attainable in the capital by the renting of apartments has narrowed to four per cent, therefore new saving schemes offering good returns, such as the National Bond, could absorb significant savings from the real estate market.
Adjustment on the supply side enables this type of investment demand to appear, in addition to the market of used homes, as well as in the market of new homes, while the consistently low interest rate environment could sustain investors’ interest in the property market. As a result
Chart 3Changes in building permits issued and the households’ propensity for home purchase/home improvement
–93 –90 –87 –84 –81 –78 –75 –72 –69 –66
0 2,000 4,000 6,000 8,000
10,000 12,000 14,000 16,000 18,000
2002
20
03
2004
20
05
2006
20
07
2008
20
09
2010
20
11
2012
20
13
2014
20
15
2016
20
17
2018
Building permitsHouse purchase and house improvement intention composite index (RHS)
Pieces Balance indicator
Source: HCSO and MNB.
Chart 4Changes in yield premium realisable on home buying through value increase and in deposit yields
–10 –5 0 5 10 15 20
–10 –5 0 5
10 15 20
2004
Q2
2004
Q4
2005
Q2
2005
Q4
2006
Q2
2006
Q4
2007
Q2
2007
Q4
2008
Q2
2008
Q4
2009
Q2
2009
Q4
2010
Q2
2010
Q4
2011
Q2
2011
Q4
2012
Q2
2012
Q4
2013
Q2
2013
Q4
2014
Q2
2014
Q4
2015
Q2
2015
Q4
2016
Q2
2016
Q4
2017
Q2
2017
Q4
2018
Q2
2018
Q4
Per centPer cent
1-year government bond yield1-year yield from residential real estate investment based on price growthDeposit rate (over 1 year, up to 2 years)Average APR on newly disbursed housing loans
Note: The yield realisable from home investment is calculated exclu-sively based on the growth rate of the MNB house price index.Source: Government Debt Management Agency, MNB.
Chart 5Distribution of home buyers in Budapest by the purpose of home purchase
0
10
20
30
40
50
60
0
10
20
30
40
50
60
2011
H2
2012
H1
2012
H2
2013
H1
2013
H2
2014
H1
2014
H2
2015
H1
2015
H2
2016
H1
2016
H2
2017
H1
2017
H2
2018
H1
2018
H2
2019
H1
Per centPer cent
Investment
Personal life
First home buyerMoving to a bigger houseMoving to a smaller house
Generations
Source: Duna House.
MACRoECoNoMIC ENVIRoNMENT
HOUSING MARKET REPORT • MAY 2019 11
of the favourable financing environment and the high yield premium realisable on home purchases, in the field of home purchases in Budapest investment intentions remain dominant. However, the ratio of home purchases for the purpose of home creation is still dominant, which shows that although investment purposes are important, home purchases for various dwelling purposes continue to play a determining role in the market (Chart 5). As discussed in the housing market section of the meeting of the Housing and Real Estate Market Advisory Board, market experts estimate the ratio of investors in the capital at 35 to 40 per cent, where the latter ratio tends to be higher in the inner districts. In the provinces the ratio of persons purchasing homes for investment purposes may be around 27 per cent.
2.2 HUNGARIAN HOUSING MARKET SUPPLY
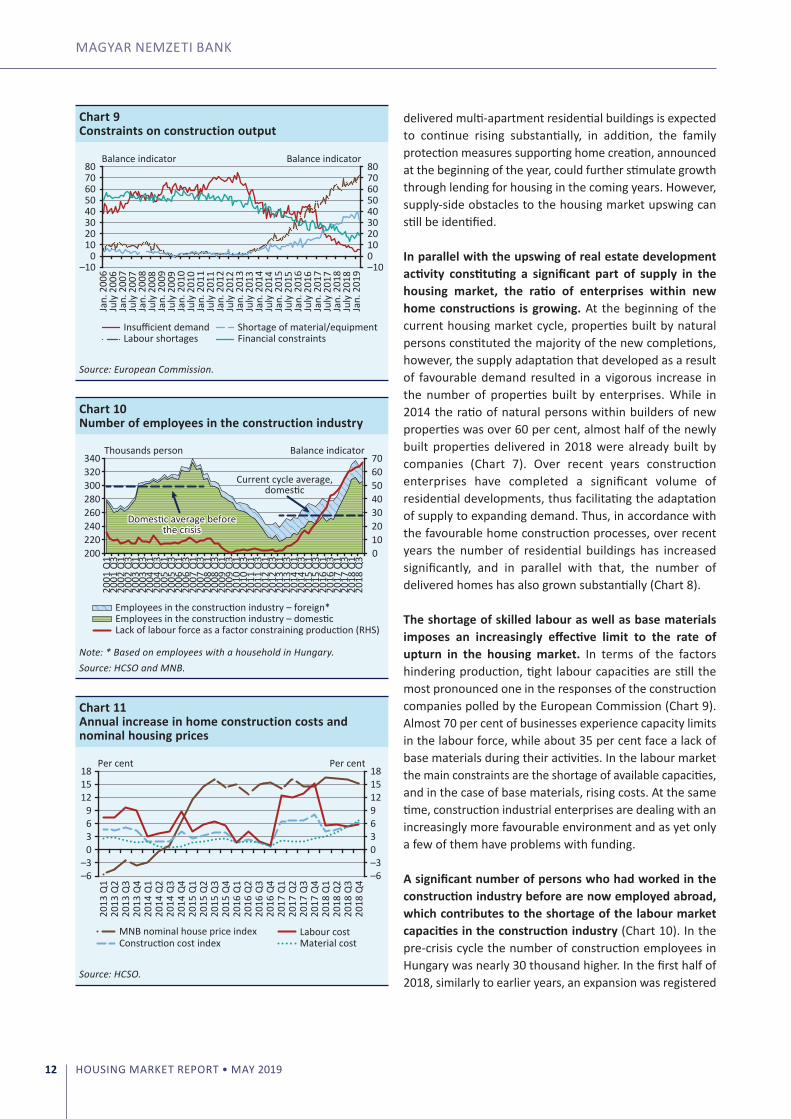
In parallel with favourable demand, the supply in the housing market has responded more and more vigorously to the on-going boost in demand for new homes, thus we were able to register meaningful growth in housing construction (Chart 6). However, the pace of the expansion in the housing market may be strongly influenced by limited construction industrial capacities, such as the shortage of skilled labour and raw materials. Owing to the construction capacity needs of simultaneously running investment cycles (public infrastructure projects, commercial real estate developments, capacity expansion in the vehicle and chemical industries), the supply of skilled labour is increasingly becoming an effective limit to the ramp-up of production in the construction industry. In addition, in the recent quarters material costs of the construction industry have also been rising at a significant pace, which slows down the expansion of supply in the housing market and through that, adaptation to demand. Renewal rate of the domestic housing stock is rather low even with the upturn. However, consistently expanding demand, the growth in housing prices, the favourable realisable yield level as well as the home creation programmes still represent supportive conditions for real estate developers and for other actors of the supply side.
On the supply side, several factors support the upswing, but supply conditions typically respond with a delay in the real estate market. The upturn in the demand side of the housing market and – in parallel with it – the increase in the price level and in the yield realisable from investment in real estate, also entailed a gradual adjustment in supply, resulting in a rise in the volume of home constructions from 2016. During 2018 numerous real estate development projects were launched, and the number of delivered homes continued to rise. In 2019 the number of newly
Chart 6Number of building permits issued and number of new completions
0 2 4 6 8 10 12 14 16 18
0 2 4 6 8
10 12 14 16 18
2001
Q2
2001
Q4
2002
Q2
2002
Q4
2003
Q2
2003
Q4
2004
Q2
2004
Q4
2005
Q2
2005
Q4
2006
Q2
2006
Q4
2007
Q2
2007
Q4
2008
Q2
2008
Q4
2009
Q2
2009
Q4
2010
Q2
2010
Q4
2011
Q2
2011
Q4
2012
Q2
2012
Q4
2013
Q2
2013
Q4
2014
Q2
2014
Q4
2015
Q2
2015
Q4
2016
Q2
2016
Q4
2017
Q2
2017
Q4
2018
Q2
2018
Q4
Thousand pcsThousand pcs
Home completionsGranted building permits for homes
Note: Seasonally adjusted data.Source: HCSO and MNB.
Chart 7Distribution of home completions by developer
0 10 20 30 40 50 60 70 80 90 100
0 10 20 30 40 50 60 70 80 90
100
2014
Q1
2014
Q2
2014
Q3
2014
Q4
2015
Q1
2015
Q2
2015
Q3
2015
Q4
2016
Q1
2016
Q2
2016
Q3
2016
Q4
2017
Q1
2017
Q2
2017
Q3
2017
Q4
2018
Q1
2018
Q2
2018
Q3
2018
Q4
Per centPer cent
Share of dwellings built by natural personsShare of dwellings built by enterprises
Source: HCSO.
Chart 8Development of the monthly number of new homes and residential buildings to be constructed, based on the number of issued construction permits
0
1,000
2,000
3,000
4,000
5,000
6,000
0
1,000
2,000
3,000
4,000
5,000
6,000
1999
20
00
2001
20
02
2003
20
04
2005
20
06
2007
20
08
2009
20
10
2011
20
12
2013
20
14
2015
20
16
2017
20
18
Pieces Pieces
Estimation of new dwelling permits issuedNew residential buildings based on permits issued
Source: Based on HCSO, MNB estimate.
MAGYAR NEMZETI BANK
HOUSING MARKET REPORT • MAY 201912
delivered multi-apartment residential buildings is expected to continue rising substantially, in addition, the family protection measures supporting home creation, announced at the beginning of the year, could further stimulate growth through lending for housing in the coming years. However, supply-side obstacles to the housing market upswing can still be identified.
In parallel with the upswing of real estate development activity constituting a significant part of supply in the housing market, the ratio of enterprises within new home constructions is growing. At the beginning of the current housing market cycle, properties built by natural persons constituted the majority of the new completions, however, the supply adaptation that developed as a result of favourable demand resulted in a vigorous increase in the number of properties built by enterprises. While in 2014 the ratio of natural persons within builders of new properties was over 60 per cent, almost half of the newly built properties delivered in 2018 were already built by companies (Chart 7). over recent years construction enterprises have completed a significant volume of residential developments, thus facilitating the adaptation of supply to expanding demand. Thus, in accordance with the favourable home construction processes, over recent years the number of residential buildings has increased significantly, and in parallel with that, the number of delivered homes has also grown substantially (Chart 8).
The shortage of skilled labour as well as base materials imposes an increasingly effective limit to the rate of upturn in the housing market. In terms of the factors hindering production, tight labour capacities are still the most pronounced one in the responses of the construction companies polled by the European Commission (Chart 9). Almost 70 per cent of businesses experience capacity limits in the labour force, while about 35 per cent face a lack of base materials during their activities. In the labour market the main constraints are the shortage of available capacities, and in the case of base materials, rising costs. At the same time, construction industrial enterprises are dealing with an increasingly more favourable environment and as yet only a few of them have problems with funding.
A significant number of persons who had worked in the construction industry before are now employed abroad, which contributes to the shortage of the labour market capacities in the construction industry (Chart 10). In the pre-crisis cycle the number of construction employees in Hungary was nearly 30 thousand higher. In the first half of 2018, similarly to earlier years, an expansion was registered
Chart 9Constraints on construction output
–10 0
10 20 30 40 50 60 70 80
–10 0 10 20 30 40 50 60 70 80
Jan.
200
6Ju
ly 2
006
Jan.
200
7Ju
ly 2
007
Jan.
200
8Ju
ly 2
008
Jan.
200
9Ju
ly 2
009
Jan.
201
0Ju
ly 2
010
Jan.
201
1Ju
ly 2
011
Jan.
201
2Ju
ly 2
012
Jan.
201
3Ju
ly 2
013
Jan.
201
4Ju
ly 2
014
Jan.
201
5Ju
ly 2
015
Jan.
201
6Ju
ly 2
016
Jan.
201
7Ju
ly 2
017
Jan.
201
8Ju
ly 2
018
Jan.
201
9
Balance indicator Balance indicator
Insufficient demandLabour shortages
Shortage of material/equipmentFinancial constraints
Source: European Commission.
Chart 10Number of employees in the construction industry
0 10 20 30 40 50 60 70
200 220 240 260 280 300 320 340
2001
Q1
2001
Q3
2002
Q1
2002
Q3
2003
Q1
2003
Q3
2004
Q1
2004
Q3
2005
Q1
2005
Q3
2006
Q1
2006
Q3
2007
Q1
2007
Q3
2008
Q1
2008
Q3
2009
Q1
2009
Q3
2010
Q1
2010
Q3
2011
Q1
2011
Q3
2012
Q1
2012
Q3
2013
Q1
2013
Q3
2014
Q1
2014
Q3
2015
Q1
2015
Q3
2016
Q1
2016
Q3
2017
Q1
2017
Q3
2018
Q1
2018
Q3
Balance indicatorThousands person
Employees in the construction industry – foreign*Employees in the construction industry – domesticLack of labour force as a factor constraining production (RHS)
Domestic average beforethe crisis
Current cycle average,domestic
Note: * Based on employees with a household in Hungary. Source: HCSO and MNB.
Chart 11Annual increase in home construction costs and nominal housing prices
–6 –3 0 3 6 9 12 15 18
–6 –3
0 3 6 9
12 15 18
2013
Q1
2013
Q2
2013
Q3
2013
Q4
2014
Q1
2014
Q2
2014
Q3
2014
Q4
2015
Q1
2015
Q2
2015
Q3
2015
Q4
2016
Q1
2016
Q2
2016
Q3
2016
Q4
2017
Q1
2017
Q2
2017
Q3
2017
Q4
2018
Q1
2018
Q2
2018
Q3
2018
Q4
Per centPer cent
MNB nominal house price indexConstruction cost index
Labour costMaterial cost
Source: HCSO.
MACRoECoNoMIC ENVIRoNMENT
HOUSING MARKET REPORT • MAY 2019 13
in the number of people employed in the construction industry in Hungary, however, in the second half of the year the employment level in the sector stagnated.
According to the data of HCSO, the increase in home construction costs continued into 2018. According to the official statistics, the annual dynamics of housing prices continues to exceed the rise in construction costs, which may contribute to the adaptation of the supply side. In 2017 the gap between the construction cost index and the housing price index narrowed substantially, after that, in 2018, the dynamics of construction costs attenuated at the beginning of the year, then was steadily approaching the growth rate of housing prices. Based on these, in total last year the profitability of home developers once again increased, although to a lesser extent than in the earlier quarters. According to the experience of market actors, construction costs may have been rising at a higher pace than measured officially, which somewhat nuances the picture. In the fourth quarter of 2018 costs spent on construction materials were rising at a historical rapid pace and exceeded the growth of labour costs (Chart 11). Looking ahead, the strong wage growth, the shortage of skilled labour as well as the accelerating rise in construction material prices together may reduce the profitability of developers.
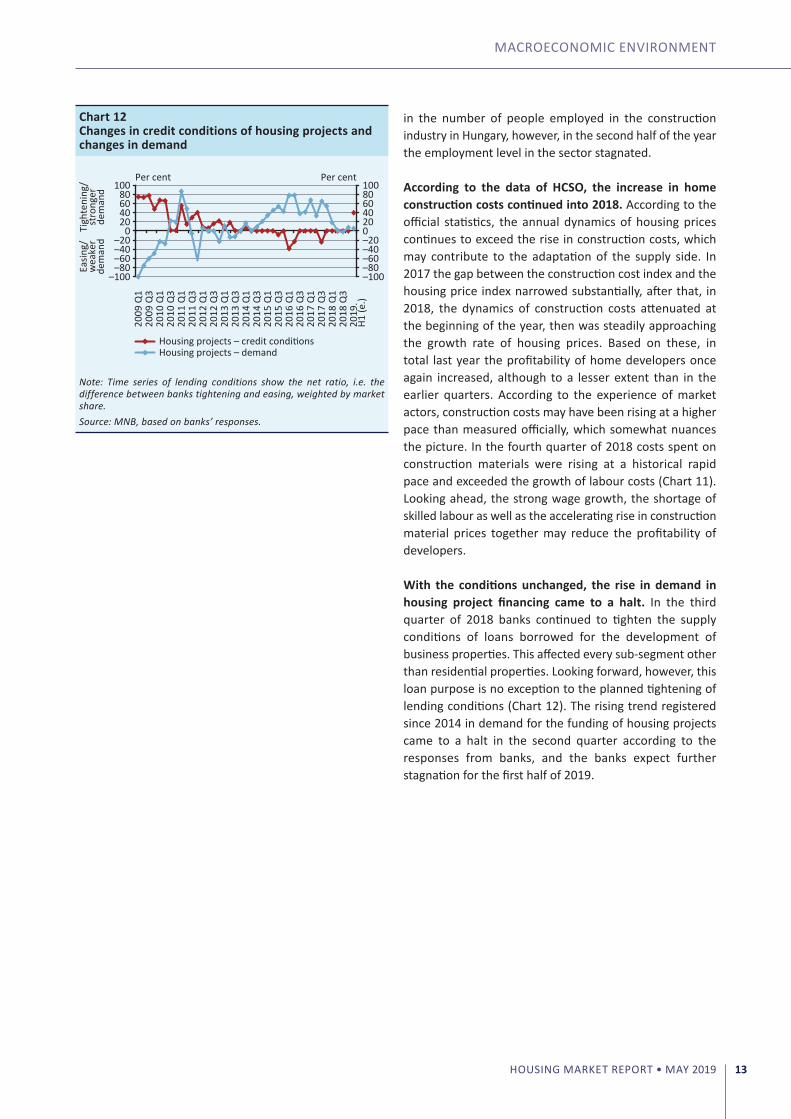
With the conditions unchanged, the rise in demand in housing project financing came to a halt. In the third quarter of 2018 banks continued to tighten the supply conditions of loans borrowed for the development of business properties. This affected every sub-segment other than residential properties. Looking forward, however, this loan purpose is no exception to the planned tightening of lending conditions (Chart 12). The rising trend registered since 2014 in demand for the funding of housing projects came to a halt in the second quarter according to the responses from banks, and the banks expect further stagnation for the first half of 2019.
Chart 12Changes in credit conditions of housing projects and changes in demand
–100 –80 –60 –40 –20
0 20 40 60 80
100
–100 –80 –60 –40 –20 0 20 40 60 80 100
Tigh
teni
ng/
stro
nger
dem
and
Easin
g/w
eake
rde
man
d
2009
Q1
2009
Q3
2010
Q1
2010
Q3
2011
Q1
2011
Q3
2012
Q1
2012
Q3
2013
Q1
2013
Q3
2014
Q1
2014
Q3
2015
Q1
2015
Q3
2016
Q1
2016
Q3
2017
Q1
2017
Q3
2018
Q1
2018
Q3
2019
. H1
(e.)
Per centPer cent
Housing projects – credit conditionsHousing projects – demand
Note: Time series of lending conditions show the net ratio, i.e. the difference between banks tightening and easing, weighted by market share.Source: MNB, based on banks’ responses.
MAGYAR NEMZETI BANK
HOUSING MARKET REPORT • MAY 201914
Box 1Impact of home constructions on GDP, by assessing sectoral relations
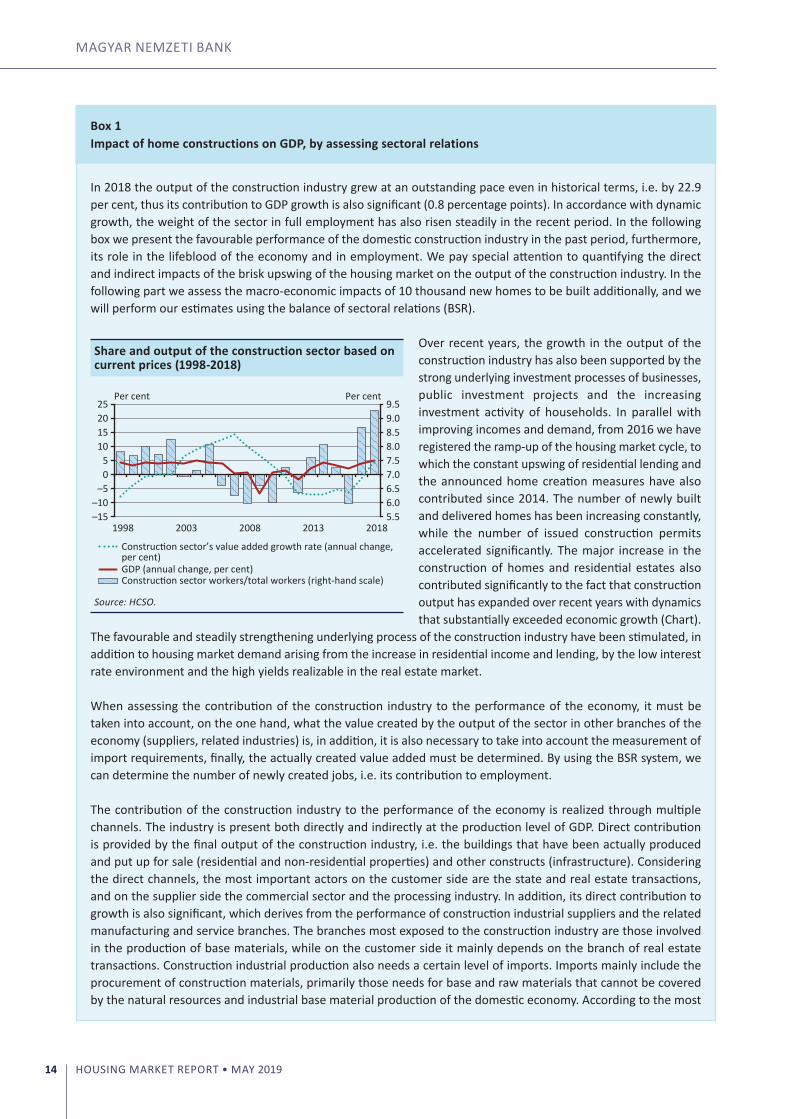
In 2018 the output of the construction industry grew at an outstanding pace even in historical terms, i.e. by 22.9 per cent, thus its contribution to GDP growth is also significant (0.8 percentage points). In accordance with dynamic growth, the weight of the sector in full employment has also risen steadily in the recent period. In the following box we present the favourable performance of the domestic construction industry in the past period, furthermore, its role in the lifeblood of the economy and in employment. We pay special attention to quantifying the direct and indirect impacts of the brisk upswing of the housing market on the output of the construction industry. In the following part we assess the macro-economic impacts of 10 thousand new homes to be built additionally, and we will perform our estimates using the balance of sectoral relations (BSR).
over recent years, the growth in the output of the construction industry has also been supported by the strong underlying investment processes of businesses, public investment projects and the increasing investment activity of households. In parallel with improving incomes and demand, from 2016 we have registered the ramp-up of the housing market cycle, to which the constant upswing of residential lending and the announced home creation measures have also contributed since 2014. The number of newly built and delivered homes has been increasing constantly, while the number of issued construction permits accelerated significantly. The major increase in the construction of homes and residential estates also contributed significantly to the fact that construction output has expanded over recent years with dynamics that substantially exceeded economic growth (Chart).
The favourable and steadily strengthening underlying process of the construction industry have been stimulated, in addition to housing market demand arising from the increase in residential income and lending, by the low interest rate environment and the high yields realizable in the real estate market.
When assessing the contribution of the construction industry to the performance of the economy, it must be taken into account, on the one hand, what the value created by the output of the sector in other branches of the economy (suppliers, related industries) is, in addition, it is also necessary to take into account the measurement of import requirements, finally, the actually created value added must be determined. By using the BSR system, we can determine the number of newly created jobs, i.e. its contribution to employment.
The contribution of the construction industry to the performance of the economy is realized through multiple channels. The industry is present both directly and indirectly at the production level of GDP. Direct contribution is provided by the final output of the construction industry, i.e. the buildings that have been actually produced and put up for sale (residential and non-residential properties) and other constructs (infrastructure). Considering the direct channels, the most important actors on the customer side are the state and real estate transactions, and on the supplier side the commercial sector and the processing industry. In addition, its direct contribution to growth is also significant, which derives from the performance of construction industrial suppliers and the related manufacturing and service branches. The branches most exposed to the construction industry are those involved in the production of base materials, while on the customer side it mainly depends on the branch of real estate transactions. Construction industrial production also needs a certain level of imports. Imports mainly include the procurement of construction materials, primarily those needs for base and raw materials that cannot be covered by the natural resources and industrial base material production of the domestic economy. According to the most
Share and output of the construction sector based on current prices (1998-2018)
5.5 6.06.5 7.0 7.5 8.0 8.5 9.0 9.5
–15 –10
–5 0 5
10 15 20 25
1998 2003 2008 2013 2018
Per centPer cent
Construction sector’s value added growth rate (annual change,per cent)GDP (annual change, per cent)Construction sector workers/total workers (right-hand scale)
Source: HCSO.
MACRoECoNoMIC ENVIRoNMENT
HOUSING MARKET REPORT • MAY 2019 15
recent estimate of the BSR system created by HCSo, an import ratio of 23.6 per cent belongs to the final output of the construction industry. The import requirements of the construction industry are substantially lower than those of the entire national economy, which is mainly due to the low import needs of constructs.
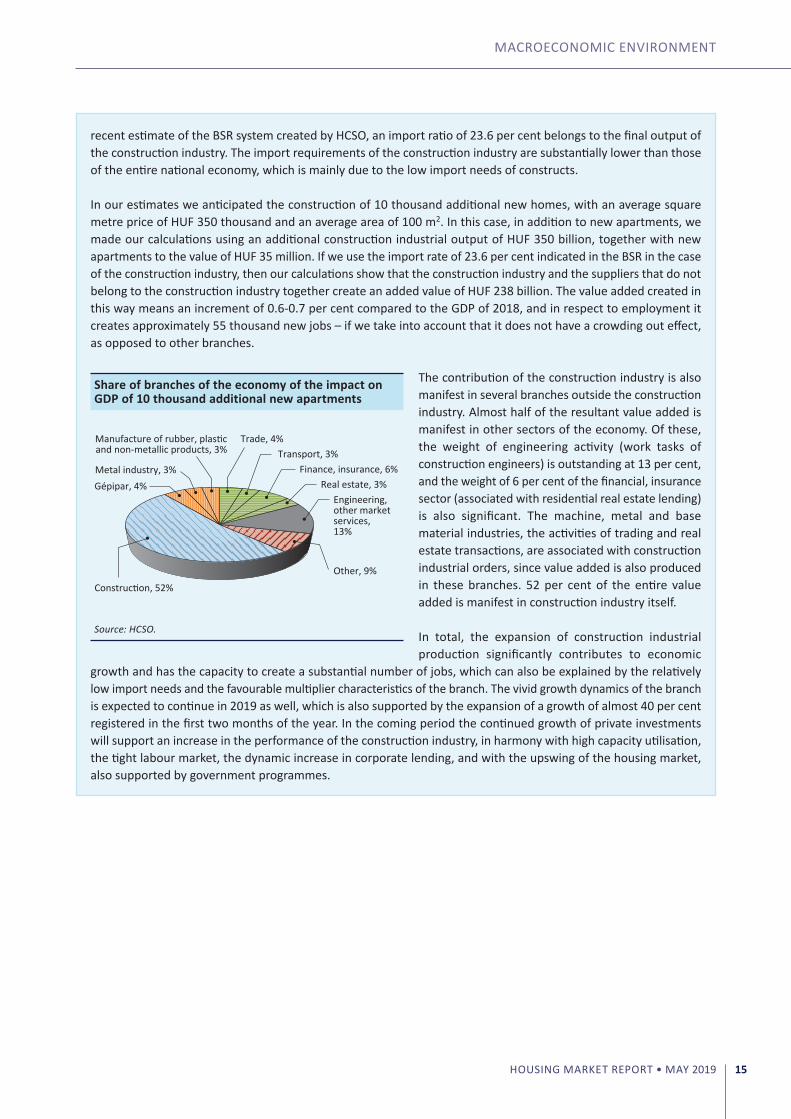
In our estimates we anticipated the construction of 10 thousand additional new homes, with an average square metre price of HUF 350 thousand and an average area of 100 m2. In this case, in addition to new apartments, we made our calculations using an additional construction industrial output of HUF 350 billion, together with new apartments to the value of HUF 35 million. If we use the import rate of 23.6 per cent indicated in the BSR in the case of the construction industry, then our calculations show that the construction industry and the suppliers that do not belong to the construction industry together create an added value of HUF 238 billion. The value added created in this way means an increment of 0.6-0.7 per cent compared to the GDP of 2018, and in respect to employment it creates approximately 55 thousand new jobs – if we take into account that it does not have a crowding out effect, as opposed to other branches.
The contribution of the construction industry is also manifest in several branches outside the construction industry. Almost half of the resultant value added is manifest in other sectors of the economy. of these, the weight of engineering activity (work tasks of construction engineers) is outstanding at 13 per cent, and the weight of 6 per cent of the financial, insurance sector (associated with residential real estate lending) is also significant. The machine, metal and base material industries, the activities of trading and real estate transactions, are associated with construction industrial orders, since value added is also produced in these branches. 52 per cent of the entire value added is manifest in construction industry itself.
In total, the expansion of construction industrial production significantly contributes to economic
growth and has the capacity to create a substantial number of jobs, which can also be explained by the relatively low import needs and the favourable multiplier characteristics of the branch. The vivid growth dynamics of the branch is expected to continue in 2019 as well, which is also supported by the expansion of a growth of almost 40 per cent registered in the first two months of the year. In the coming period the continued growth of private investments will support an increase in the performance of the construction industry, in harmony with high capacity utilisation, the tight labour market, the dynamic increase in corporate lending, and with the upswing of the housing market, also supported by government programmes.
Share of branches of the economy of the impact on GDP of 10 thousand additional new apartments
Manufacture of rubber, plasticand non-metallic products, 3%
Trade, 4%Transport, 3%
Finance, insurance, 6%Real estate, 3%
Engineering, other market services, 13%
Other, 9%
Construction, 52%
Gépipar, 4%Metal industry, 3%
Source: HCSO.
HOUSING MARKET REPORT • MAY 201916
3 Current housing market trends
The upswing of the domestic housing market continued into 2018, but the territorial disparities of the housing market further increased. Last year housing prices increased by 15.2 per cent nominally, according to the aggregated housing price index of the MNB, this equals a growth of 11.6 per cent in real terms. Considering the development of housing prices, in 2018 the price gap between small and large settlements further widened. In Budapest within one year housing prices increased by 22.9 per cent, while in villages the annual dynamics of the prices fell significantly, from 16.9 per cent in 2017 to 2.3 per cent by 2018. In Budapest, as a result of the significant increase housing prices now exceed the level justified by the fundamentals, therefore the risk of overvaluation increased significantly, but nationally no similar processes have been observed so far. Within Budapest the conditions of the housing market show significant disparities. Both the new developments and the foreign buyers appear mainly in the inner districts, while the increased pace of price rises registered at the beginning of the cycle pushed demand further out, and also drove up the prices in the outer districts of Budapest. The ratio of persons seeking investment properties in the capital can be estimated at 35 to 40 per cent according to market experts, whose presence can be useful in terms of the supply of rental apartments and the renovation of the stock of used homes. Looking ahead, certain elements of the Family Protection Action Plan announced by the Government may also support the maintenance of the brisk demand in the housing market, of which the rural Home Purchase Subsidy Scheme for Families (rural HPS) may substantially increase demand in the eligible small communities.
In 2018 the number of new housing construction permits decreased somewhat, while the number of newly delivered homes kept increasing compared to 2017. Based on the currently running developments, 2019 could become a record year in terms of new deliveries. Compared to 17.7 thousand new homes in 2018, in 2019 29 thousand new homes are expected to be delivered. However, from 2020 the supply of new homes could tighten substantially. In Budapest the number of new deliveries could decrease by 59, and in the provinces by 74 per cent, according to the current plans of home developers. The end of the transitional period of the reduced VAT rate plays a substantial role in the setback of the supply of new homes. In total, the annual renewal of 0.4 per cent of the domestic housing stock is still the lowest value of the region.
3.1 DOMESTIC HOUSING MARKET DEVELOPMENTS
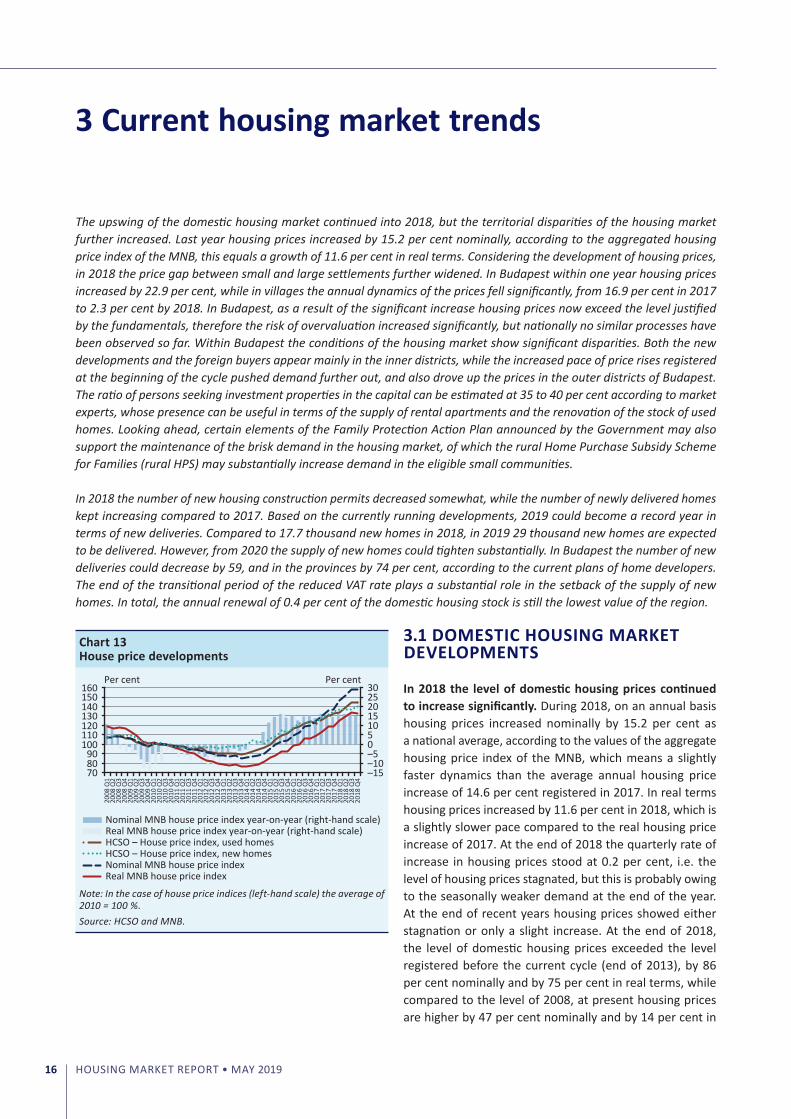
In 2018 the level of domestic housing prices continued to increase significantly. During 2018, on an annual basis housing prices increased nominally by 15.2 per cent as a national average, according to the values of the aggregate housing price index of the MNB, which means a slightly faster dynamics than the average annual housing price increase of 14.6 per cent registered in 2017. In real terms housing prices increased by 11.6 per cent in 2018, which is a slightly slower pace compared to the real housing price increase of 2017. At the end of 2018 the quarterly rate of increase in housing prices stood at 0.2 per cent, i.e. the level of housing prices stagnated, but this is probably owing to the seasonally weaker demand at the end of the year. At the end of recent years housing prices showed either stagnation or only a slight increase. At the end of 2018, the level of domestic housing prices exceeded the level registered before the current cycle (end of 2013), by 86 per cent nominally and by 75 per cent in real terms, while compared to the level of 2008, at present housing prices are higher by 47 per cent nominally and by 14 per cent in
Chart 13House price developments
2008
Q1
2008
Q2
2008
Q3
2008
Q4
2009
Q1
2009
Q2
2009
Q3
2009
Q4
2010
Q1
2010
Q2
2010
Q3
2010
Q4
2011
Q1
2011
Q2
2011
Q3
2011
Q4
2012
Q1
2012
Q2
2012
Q3
2012
Q4
2013
Q1
2013
Q2
2013
Q3
2013
Q4
2014
Q1
2014
Q2
2014
Q3
2014
Q4
2015
Q1
2015
Q2
2015
Q3
2015
Q4
2016
Q1
2016
Q2
2016
Q3
2016
Q4
2017
Q1
2017
Q2
2017
Q3
2017
Q4
2018
Q1
2018
Q2
2018
Q3
2018
Q4
–15 –10 –5 0 5 10 15 20 25 30
70
90
110
130
150
80
100
120
140
160 Per centPer cent
Nominal MNB house price index year-on-year (right-hand scale)Real MNB house price index year-on-year (right-hand scale)HCSO – House price index, used homesHCSO – House price index, new homesNominal MNB house price indexReal MNB house price index
Note: In the case of house price indices (left-hand scale) the average of 2010 = 100 %.Source: HCSO and MNB.
CURRENT HoUSING MARKET TRENDS
HOUSING MARKET REPORT • MAY 2019 17
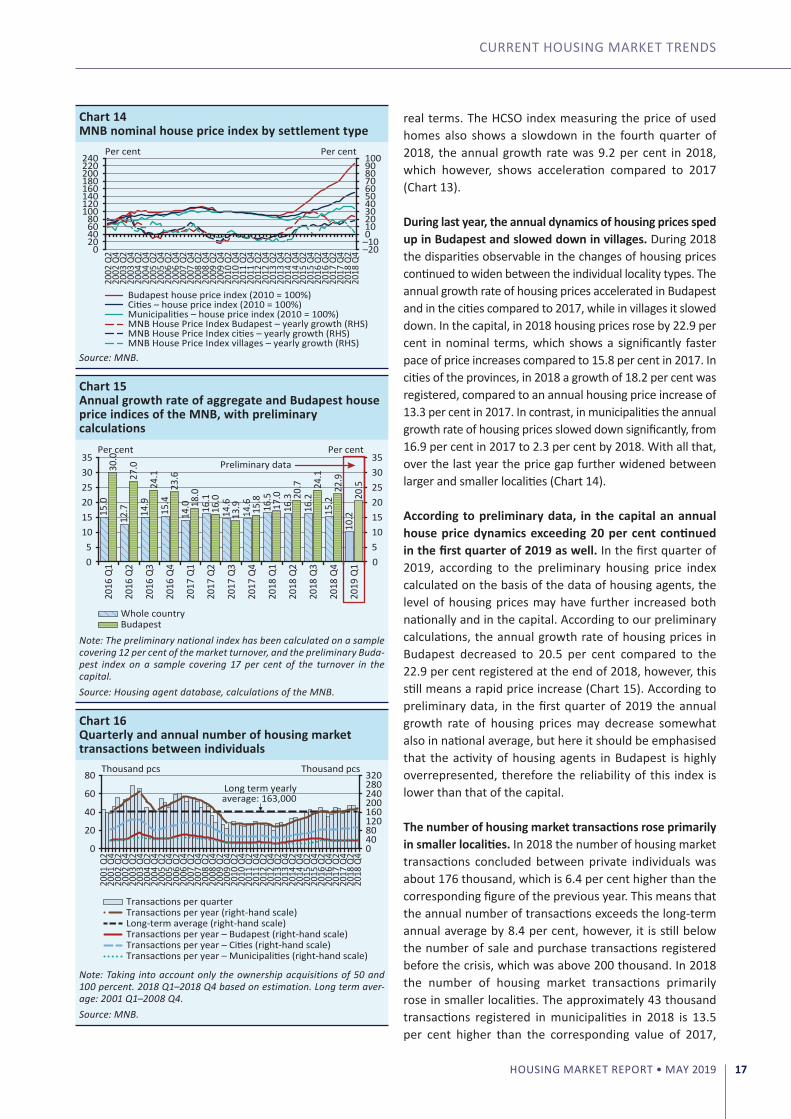
real terms. The HCSo index measuring the price of used homes also shows a slowdown in the fourth quarter of 2018, the annual growth rate was 9.2 per cent in 2018, which however, shows acceleration compared to 2017 (Chart 13).
During last year, the annual dynamics of housing prices sped up in Budapest and slowed down in villages. During 2018 the disparities observable in the changes of housing prices continued to widen between the individual locality types. The annual growth rate of housing prices accelerated in Budapest and in the cities compared to 2017, while in villages it slowed down. In the capital, in 2018 housing prices rose by 22.9 per cent in nominal terms, which shows a significantly faster pace of price increases compared to 15.8 per cent in 2017. In cities of the provinces, in 2018 a growth of 18.2 per cent was registered, compared to an annual housing price increase of 13.3 per cent in 2017. In contrast, in municipalities the annual growth rate of housing prices slowed down significantly, from 16.9 per cent in 2017 to 2.3 per cent by 2018. With all that, over the last year the price gap further widened between larger and smaller localities (Chart 14).
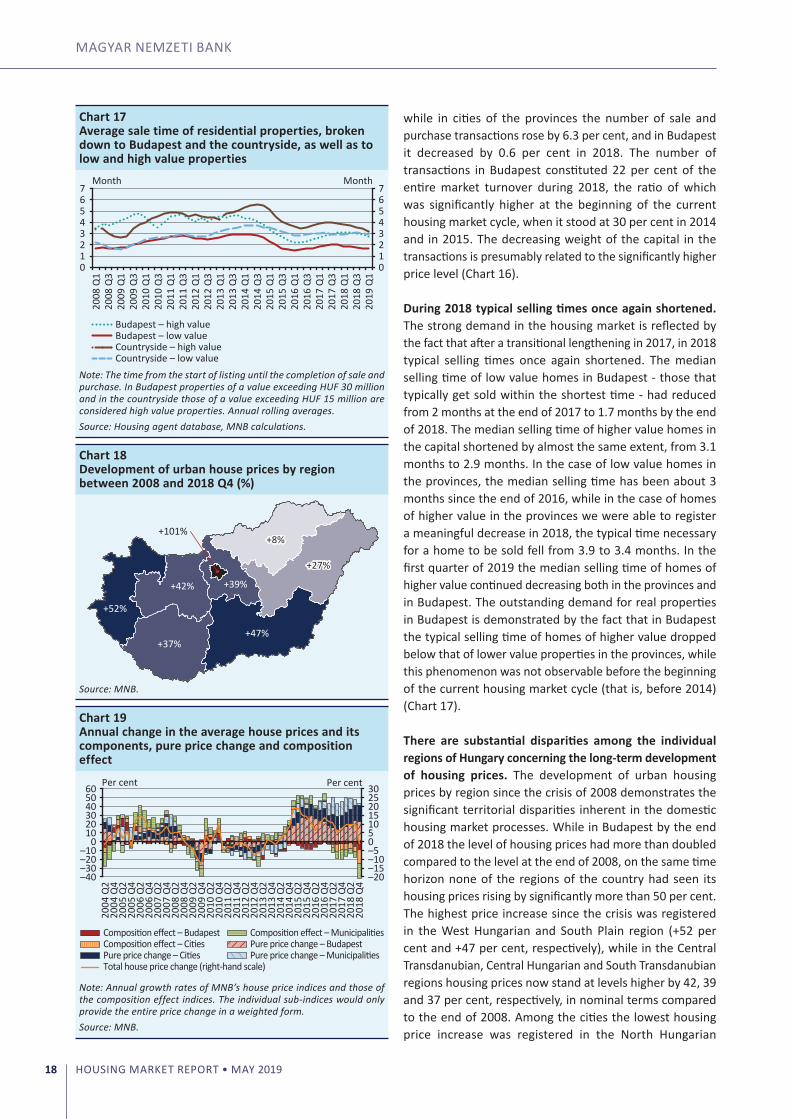
According to preliminary data, in the capital an annual house price dynamics exceeding 20 per cent continued in the first quarter of 2019 as well. In the first quarter of 2019, according to the preliminary housing price index calculated on the basis of the data of housing agents, the level of housing prices may have further increased both nationally and in the capital. According to our preliminary calculations, the annual growth rate of housing prices in Budapest decreased to 20.5 per cent compared to the 22.9 per cent registered at the end of 2018, however, this still means a rapid price increase (Chart 15). According to preliminary data, in the first quarter of 2019 the annual growth rate of housing prices may decrease somewhat also in national average, but here it should be emphasised that the activity of housing agents in Budapest is highly overrepresented, therefore the reliability of this index is lower than that of the capital.
The number of housing market transactions rose primarily in smaller localities. In 2018 the number of housing market transactions concluded between private individuals was about 176 thousand, which is 6.4 per cent higher than the corresponding figure of the previous year. This means that the annual number of transactions exceeds the long-term annual average by 8.4 per cent, however, it is still below the number of sale and purchase transactions registered before the crisis, which was above 200 thousand. In 2018 the number of housing market transactions primarily rose in smaller localities. The approximately 43 thousand transactions registered in municipalities in 2018 is 13.5 per cent higher than the corresponding value of 2017,
Chart 14MNB nominal house price index by settlement type
–20 –10 0 10 20 30 40 50 60 70 80 90 100
0 20 40 60 80
100 120 140 160 180 200 220 240
2002
Q2
2002
Q4
2003
Q2
2003
Q4
2004
Q2
2004
Q4
2005
Q2
2005
Q4
2006
Q2
2006
Q4
2007
Q2
2007
Q4
2008
Q2
2008
Q4
2009
Q2
2009
Q4
2010
Q2
2010
Q4
2011
Q2
2011
Q4
2012
Q2
2012
Q4
2013
Q2
2013
Q4
2014
Q2
2014
Q4
2015
Q2
2015
Q4
2016
Q2
2016
Q4
2017
Q2
2017
Q4
2018
Q2
2018
Q4
Per centPer cent
Budapest house price index (2010 = 100%)
Municipalities – house price index (2010 = 100%)Cities – house price index (2010 = 100%)
MNB House Price Index Budapest – yearly growth (RHS)MNB House Price Index cities – yearly growth (RHS)MNB House Price Index villages – yearly growth (RHS)
Source: MNB.
Chart 15Annual growth rate of aggregate and Budapest house price indices of the MNB, with preliminary calculations
15.0
12.7
14.9
15.4
14.0
16.1
14.6
14.6
16.5
16.3
16.2
15.2
10.2
30.0
27.0
24.1
23.6
18.0
16.0
13.9
15.8
17.0
20.7
24.1
22.9
20.5
0 5 10 15 20 25 30 35
0 5
10 15 20 25 30 35
2016
Q1
2016
Q2
2016
Q3
2016
Q4
2017
Q1
2017
Q2
2017
Q3
2017
Q4
2018
Q1
2018
Q2
2018
Q3
2018
Q4
2019
Q1
Per centPer cent
Whole countryBudapest
Preliminary data
Note: The preliminary national index has been calculated on a sample covering 12 per cent of the market turnover, and the preliminary Buda-pest index on a sample covering 17 per cent of the turnover in the capital.Source: Housing agent database, calculations of the MNB.
Chart 16Quarterly and annual number of housing market transactions between individuals
0 40 80 120 160 200 240 280 320
0
20
40
60
80
2001
Q2
2001
Q4
2002
Q2
2002
Q4
2003
Q2
2003
Q4
2004
Q2
2004
Q4
2005
Q2
2005
Q4
2006
Q2
2006
Q4
2007
Q2
2007
Q4
2008
Q2
2008
Q4
2009
Q2
2009
Q4
2010
Q2
2010
Q4
2011
Q2
2011
Q4
2012
Q2
2012
Q4
2013
Q2
2013
Q4
2014
Q2
2014
Q4
2015
Q2
2015
Q4
2016
Q2
2016
Q4
2017
Q2
2017
Q4
2018
Q2
2018
Q4
Thousand pcs Thousand pcs
Transactions per quarterTransactions per year (right-hand scale)Long-term average (right-hand scale)Transactions per year – Budapest (right-hand scale)Transactions per year – Cities (right-hand scale)Transactions per year – Municipalities (right-hand scale)
Long term yearlyaverage: 163,000
Note: Taking into account only the ownership acquisitions of 50 and 100 percent. 2018 Q1–2018 Q4 based on estimation. Long term aver-age: 2001 Q1–2008 Q4.Source: MNB.
MAGYAR NEMZETI BANK
HOUSING MARKET REPORT • MAY 201918
while in cities of the provinces the number of sale and purchase transactions rose by 6.3 per cent, and in Budapest it decreased by 0.6 per cent in 2018. The number of transactions in Budapest constituted 22 per cent of the entire market turnover during 2018, the ratio of which was significantly higher at the beginning of the current housing market cycle, when it stood at 30 per cent in 2014 and in 2015. The decreasing weight of the capital in the transactions is presumably related to the significantly higher price level (Chart 16).
During 2018 typical selling times once again shortened. The strong demand in the housing market is reflected by the fact that after a transitional lengthening in 2017, in 2018 typical selling times once again shortened. The median selling time of low value homes in Budapest - those that typically get sold within the shortest time - had reduced from 2 months at the end of 2017 to 1.7 months by the end of 2018. The median selling time of higher value homes in the capital shortened by almost the same extent, from 3.1 months to 2.9 months. In the case of low value homes in the provinces, the median selling time has been about 3 months since the end of 2016, while in the case of homes of higher value in the provinces we were able to register a meaningful decrease in 2018, the typical time necessary for a home to be sold fell from 3.9 to 3.4 months. In the first quarter of 2019 the median selling time of homes of higher value continued decreasing both in the provinces and in Budapest. The outstanding demand for real properties in Budapest is demonstrated by the fact that in Budapest the typical selling time of homes of higher value dropped below that of lower value properties in the provinces, while this phenomenon was not observable before the beginning of the current housing market cycle (that is, before 2014) (Chart 17).
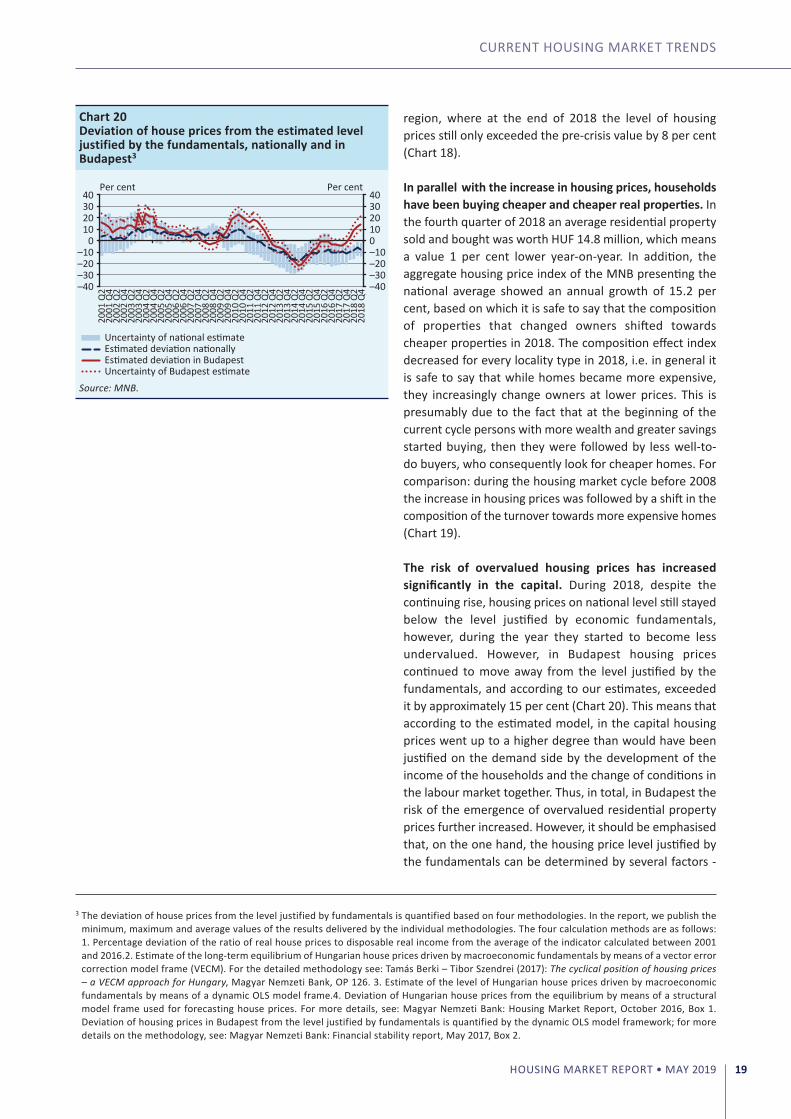
There are substantial disparities among the individual regions of Hungary concerning the long-term development of housing prices. The development of urban housing prices by region since the crisis of 2008 demonstrates the significant territorial disparities inherent in the domestic housing market processes. While in Budapest by the end of 2018 the level of housing prices had more than doubled compared to the level at the end of 2008, on the same time horizon none of the regions of the country had seen its housing prices rising by significantly more than 50 per cent. The highest price increase since the crisis was registered in the West Hungarian and South Plain region (+52 per cent and +47 per cent, respectively), while in the Central Transdanubian, Central Hungarian and South Transdanubian regions housing prices now stand at levels higher by 42, 39 and 37 per cent, respectively, in nominal terms compared to the end of 2008. Among the cities the lowest housing price increase was registered in the North Hungarian
Chart 17Average sale time of residential properties, broken down to Budapest and the countryside, as well as to low and high value properties
0 1 2 3 4 5 6 7
0 1 2 3 4 5 6 7
2008
Q1
2008
Q3
2009
Q1
2009
Q3
2010
Q1
2010
Q3
2011
Q1
2011
Q3
2012
Q1
2012
Q3
2013
Q1
2013
Q3
2014
Q1
2014
Q3
2015
Q1
2015
Q3
2016
Q1
2016
Q3
2017
Q1
2017
Q3
2018
Q1
2018
Q3
2019
Q1
Month Month
Budapest – high valueBudapest – low valueCountryside – high valueCountryside – low value
Note: The time from the start of listing until the completion of sale and purchase. In Budapest properties of a value exceeding HUF 30 million and in the countryside those of a value exceeding HUF 15 million are considered high value properties. Annual rolling averages.Source: Housing agent database, MNB calculations.
Chart 18Development of urban house prices by region between 2008 and 2018 Q4 (%)
+101%+8%
+27%
+47%+37%
+42% +39%
+52%
Source: MNB.
Chart 19Annual change in the average house prices and its components, pure price change and composition effect
–20 –15 –10 –5 0 5 10 15 20 25 30
–40 –30 –20 –10
0 10 20 30 40 50 60
2004
Q2
2004
Q4
2005
Q2
2005
Q4
2006
Q2
2006
Q4
2007
Q2
2007
Q4
2008
Q2
2008
Q4
2009
Q2
2009
Q4
2010
Q2
2010
Q4
2011
Q2
2011
Q4
2012
Q2
2012
Q4
2013
Q2
2013
Q4
2014
Q2
2014
Q4
2015
Q2
2015
Q4
2016
Q2
2016
Q4
2017
Q2
2017
Q4
2018
Q2
2018
Q4
Per centPer cent
Pure price change – BudapestPure price change – Cities Pure price change – Municipalities
Composition effect – BudapestComposition effect – Cities
Composition effect – Municipalities
Total house price change (right-hand scale)
Note: Annual growth rates of MNB’s house price indices and those of the composition effect indices. The individual sub-indices would only provide the entire price change in a weighted form.Source: MNB.
CURRENT HoUSING MARKET TRENDS
HOUSING MARKET REPORT • MAY 2019 19
3 The deviation of house prices from the level justified by fundamentals is quantified based on four methodologies. In the report, we publish the minimum, maximum and average values of the results delivered by the individual methodologies. The four calculation methods are as follows: 1. Percentage deviation of the ratio of real house prices to disposable real income from the average of the indicator calculated between 2001 and 2016.2. Estimate of the long-term equilibrium of Hungarian house prices driven by macroeconomic fundamentals by means of a vector error correction model frame (VECM). For the detailed methodology see: Tamás Berki – Tibor Szendrei (2017): The cyclical position of housing prices – a VECM approach for Hungary, Magyar Nemzeti Bank, oP 126. 3. Estimate of the level of Hungarian house prices driven by macroeconomic fundamentals by means of a dynamic oLS model frame.4. Deviation of Hungarian house prices from the equilibrium by means of a structural model frame used for forecasting house prices. For more details, see: Magyar Nemzeti Bank: Housing Market Report, october 2016, Box 1. Deviation of housing prices in Budapest from the level justified by fundamentals is quantified by the dynamic oLS model framework; for more details on the methodology, see: Magyar Nemzeti Bank: Financial stability report, May 2017, Box 2.
region, where at the end of 2018 the level of housing prices still only exceeded the pre-crisis value by 8 per cent (Chart 18).
In parallel with the increase in housing prices, households have been buying cheaper and cheaper real properties. In the fourth quarter of 2018 an average residential property sold and bought was worth HUF 14.8 million, which means a value 1 per cent lower year-on-year. In addition, the aggregate housing price index of the MNB presenting the national average showed an annual growth of 15.2 per cent, based on which it is safe to say that the composition of properties that changed owners shifted towards cheaper properties in 2018. The composition effect index decreased for every locality type in 2018, i.e. in general it is safe to say that while homes became more expensive, they increasingly change owners at lower prices. This is presumably due to the fact that at the beginning of the current cycle persons with more wealth and greater savings started buying, then they were followed by less well-to-do buyers, who consequently look for cheaper homes. For comparison: during the housing market cycle before 2008 the increase in housing prices was followed by a shift in the composition of the turnover towards more expensive homes (Chart 19).
The risk of overvalued housing prices has increased significantly in the capital. During 2018, despite the continuing rise, housing prices on national level still stayed below the level justified by economic fundamentals, however, during the year they started to become less undervalued. However, in Budapest housing prices continued to move away from the level justified by the fundamentals, and according to our estimates, exceeded it by approximately 15 per cent (Chart 20). This means that according to the estimated model, in the capital housing prices went up to a higher degree than would have been justified on the demand side by the development of the income of the households and the change of conditions in the labour market together. Thus, in total, in Budapest the risk of the emergence of overvalued residential property prices further increased. However, it should be emphasised that, on the one hand, the housing price level justified by the fundamentals can be determined by several factors -
Chart 20Deviation of house prices from the estimated level justified by the fundamentals, nationally and in Budapest3
–40 –30 –20 –10 0 10 20 30 40
–40 –30 –20 –10
0 10 20 30 40
2001
Q2
2001
Q4
2002
Q2
2002
Q4
2003
Q2
2003
Q4
2004
Q2
2004
Q4
2005
Q2
2005
Q4
2006
Q2
2006
Q4
2007
Q2
2007
Q4
2008
Q2
2008
Q4
2009
Q2
2009
Q4
2010
Q2
2010
Q4
2011
Q2
2011
Q4
2012
Q2
2012
Q4
2013
Q2
2013
Q4
2014
Q2
2014
Q4
2015
Q2
2015
Q4
2016
Q2
2016
Q4
2017
Q2
2017
Q4
2018
Q2
2018
Q4
Per cent Per cent
Uncertainty of national estimateEstimated deviation nationallyEstimated deviation in BudapestUncertainty of Budapest estimate
Source: MNB.
MAGYAR NEMZETI BANK
HOUSING MARKET REPORT • MAY 201920
Box 2The analysis of the regional heterogeneity of Budapest’s housing market
not included in the model -, such as investment demand for the short-term letting out of downtown properties, also supported by the meaningful growth of tourism. on the other hand, such overvaluation was registered earlier as well, when similarly to the current cycle, it was not the housing market that represented the main source of the risk. In the capital the overvalued housing prices after the crisis were caused by the rapid deterioration of the fundamentals, while at present they are rather caused by prices rising faster than the fundamentals. In order to gain a better understanding of the processes of the housing market in Budapest, in our second box we present the conditions of the housing market of the capital in a segmented way.
In this box we assess the processes of the housing market in Budapest in more detail, in order to gain a deeper insight into the regional disparities inherent in the conditions of the housing market of the capital. Although considering the
entirety of Budapest we can register overvalued house prices compared to the level justified by the economic fundamentals (based on the income of households and unemployment), this is not necessarily manifest in the individual districts of the capital, since in the conditions of the housing market, in the renovation of the housing stock, and even in the characteristics of homebuyers we can see radically different pictures in various neighbourhoods of the capital.
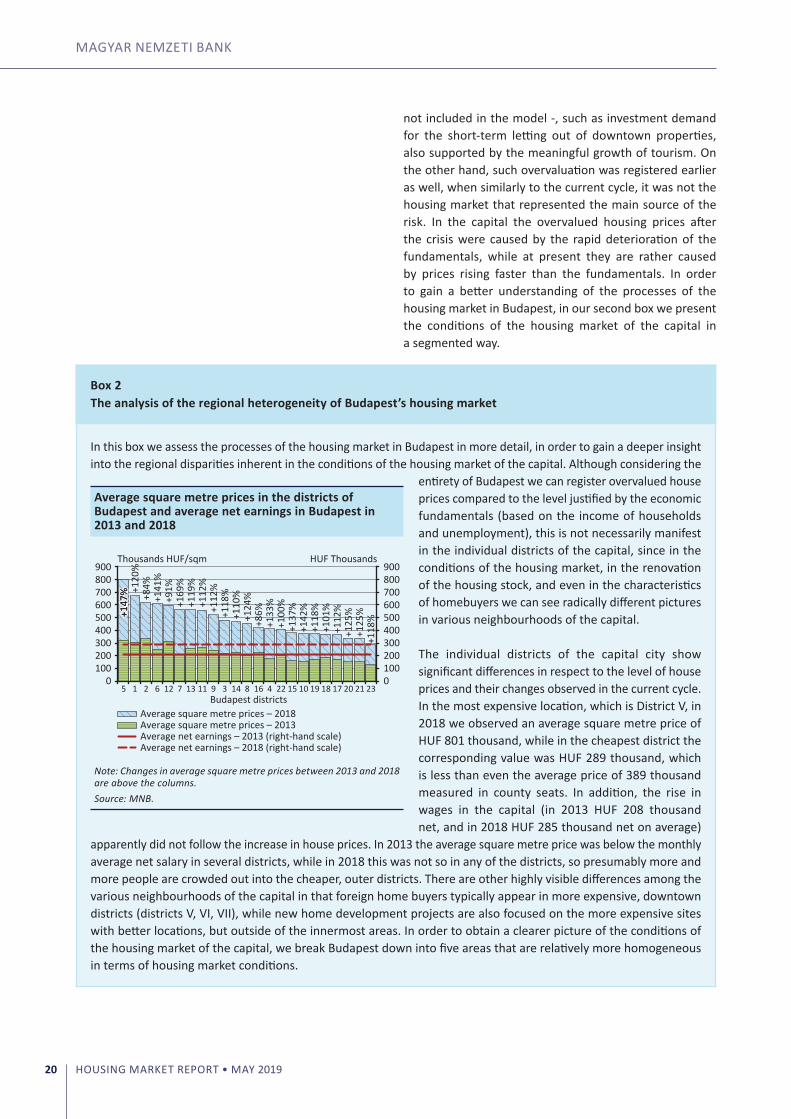
The individual districts of the capital city show significant differences in respect to the level of house prices and their changes observed in the current cycle. In the most expensive location, which is District V, in 2018 we observed an average square metre price of HUF 801 thousand, while in the cheapest district the corresponding value was HUF 289 thousand, which is less than even the average price of 389 thousand measured in county seats. In addition, the rise in wages in the capital (in 2013 HUF 208 thousand net, and in 2018 HUF 285 thousand net on average)
apparently did not follow the increase in house prices. In 2013 the average square metre price was below the monthly average net salary in several districts, while in 2018 this was not so in any of the districts, so presumably more and more people are crowded out into the cheaper, outer districts. There are other highly visible differences among the various neighbourhoods of the capital in that foreign home buyers typically appear in more expensive, downtown districts (districts V, VI, VII), while new home development projects are also focused on the more expensive sites with better locations, but outside of the innermost areas. In order to obtain a clearer picture of the conditions of the housing market of the capital, we break Budapest down into five areas that are relatively more homogeneous in terms of housing market conditions.
Average square metre prices in the districts of Budapest and average net earnings in Budapest in 2013 and 2018
+147
%+1
47% +1
20%
+84%
+141
%+9
1%+1
69%
+119
%+1
12%
+112
%+1
18%
+110
%+1
24%
+86%
+133
%+1
00%
+137
%+1
42%
+118
%+1
01%
+112
%+1
25%
+125
%+1
18%
0 100 200 300 400 500 600 700 800 900
0 100 200 300 400 500 600 700 800 900
5 1 2 6 12 7 13 11 9 3 14 8 16 4 22 15 10 19 18 17 20 21 23
HUF ThousandsThousands HUF/sqm
Budapest districtsAverage square metre prices – 2018Average square metre prices – 2013Average net earnings – 2013 (right-hand scale)Average net earnings – 2018 (right-hand scale)
Note: Changes in average square metre prices between 2013 and 2018 are above the columns.Source: MNB.
CURRENT HoUSING MARKET TRENDS
HOUSING MARKET REPORT • MAY 2019 21
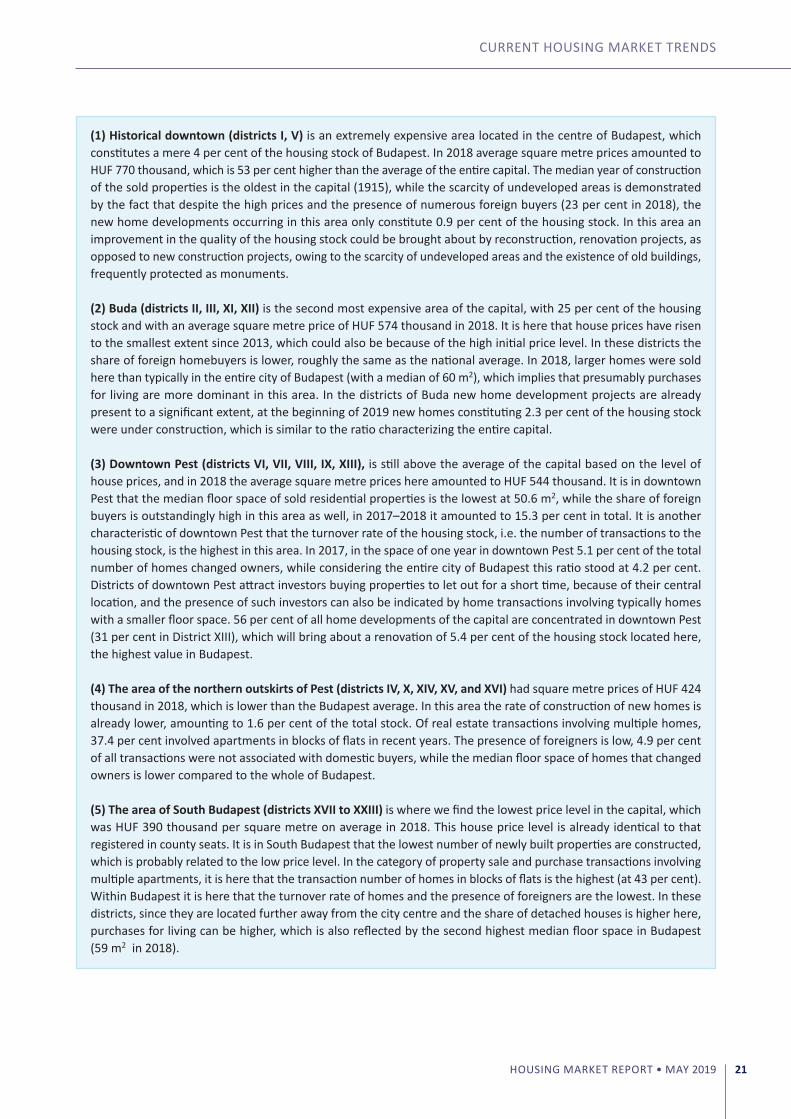
(1) Historical downtown (districts I, V) is an extremely expensive area located in the centre of Budapest, which constitutes a mere 4 per cent of the housing stock of Budapest. In 2018 average square metre prices amounted to HUF 770 thousand, which is 53 per cent higher than the average of the entire capital. The median year of construction of the sold properties is the oldest in the capital (1915), while the scarcity of undeveloped areas is demonstrated by the fact that despite the high prices and the presence of numerous foreign buyers (23 per cent in 2018), the new home developments occurring in this area only constitute 0.9 per cent of the housing stock. In this area an improvement in the quality of the housing stock could be brought about by reconstruction, renovation projects, as opposed to new construction projects, owing to the scarcity of undeveloped areas and the existence of old buildings, frequently protected as monuments.
(2) Buda (districts II, III, XI, XII) is the second most expensive area of the capital, with 25 per cent of the housing stock and with an average square metre price of HUF 574 thousand in 2018. It is here that house prices have risen to the smallest extent since 2013, which could also be because of the high initial price level. In these districts the share of foreign homebuyers is lower, roughly the same as the national average. In 2018, larger homes were sold here than typically in the entire city of Budapest (with a median of 60 m2), which implies that presumably purchases for living are more dominant in this area. In the districts of Buda new home development projects are already present to a significant extent, at the beginning of 2019 new homes constituting 2.3 per cent of the housing stock were under construction, which is similar to the ratio characterizing the entire capital.
(3) Downtown Pest (districts VI, VII, VIII, IX, XIII), is still above the average of the capital based on the level of house prices, and in 2018 the average square metre prices here amounted to HUF 544 thousand. It is in downtown Pest that the median floor space of sold residential properties is the lowest at 50.6 m2, while the share of foreign buyers is outstandingly high in this area as well, in 2017–2018 it amounted to 15.3 per cent in total. It is another characteristic of downtown Pest that the turnover rate of the housing stock, i.e. the number of transactions to the housing stock, is the highest in this area. In 2017, in the space of one year in downtown Pest 5.1 per cent of the total number of homes changed owners, while considering the entire city of Budapest this ratio stood at 4.2 per cent. Districts of downtown Pest attract investors buying properties to let out for a short time, because of their central location, and the presence of such investors can also be indicated by home transactions involving typically homes with a smaller floor space. 56 per cent of all home developments of the capital are concentrated in downtown Pest (31 per cent in District XIII), which will bring about a renovation of 5.4 per cent of the housing stock located here, the highest value in Budapest.
(4) The area of the northern outskirts of Pest (districts IV, X, XIV, XV, and XVI) had square metre prices of HUF 424 thousand in 2018, which is lower than the Budapest average. In this area the rate of construction of new homes is already lower, amounting to 1.6 per cent of the total stock. of real estate transactions involving multiple homes, 37.4 per cent involved apartments in blocks of flats in recent years. The presence of foreigners is low, 4.9 per cent of all transactions were not associated with domestic buyers, while the median floor space of homes that changed owners is lower compared to the whole of Budapest.
(5) The area of South Budapest (districts XVII to XXIII) is where we find the lowest price level in the capital, which was HUF 390 thousand per square metre on average in 2018. This house price level is already identical to that registered in county seats. It is in South Budapest that the lowest number of newly built properties are constructed, which is probably related to the low price level. In the category of property sale and purchase transactions involving multiple apartments, it is here that the transaction number of homes in blocks of flats is the highest (at 43 per cent). Within Budapest it is here that the turnover rate of homes and the presence of foreigners are the lowest. In these districts, since they are located further away from the city centre and the share of detached houses is higher here, purchases for living can be higher, which is also reflected by the second highest median floor space in Budapest (59 m2 in 2018).
MAGYAR NEMZETI BANK
HOUSING MARKET REPORT • MAY 201922
Comparative housing market figures for different areas of Budapest
Historical downtown
(I. V.)
Buda (II. III. XI. XII.)
Pest downtown
(VI. VII. VIII. IX.
XIII.)
Pest north
suburb (IV. X. XIV.
XV. XV)
South Budapest
(XVII.-XXIII.)
Budapest total
Housing stock
Housing stock at the beginning of 2018 36,798 225,242 225,010 227,863 201,242 916,155
Number of new homes under development in early 2019 321 5 116 12 192 3 560 700 21 889
Renewal rate of housing stock (%) 0.9 2.3 5.4 1.6 0.3 2.4
House prices
Average price in 2013 (HUF million) 21.7 19.7 12.5 11.9 11.8 14.4
Average price in 2018 (HUF million) 47.7 34.4 27.4 22.9 21.8 27.4
Average square metre price in 2018 (HUF thousands) 769.7 573.6 543.9 423.8 389.9 502.1
Growth of house prices compared to 2013 (%) 135.9 134.3 163.8 160.5 164.8 156.8
Average annual growth rate 2014–16 (%) 23.3 17.8 22.8 19.3 18.3 19.3
Average annual growth rate 2017–18 (%) 14.1 16.0 17.1 20.3 21.5 18.8
Attributions of sold homes
Share of panel dwellings among condominiums (2013–2018, %) 0.1 21.3 4.8 37.4 43.3 19.3
Median year of building in 2018 1915 1978 1940 1976 1980 1970
Median floor area in 2018 66.0 60.4 50.6 52.0 59.0 55.0
Attributions of buyers
Share of foreign buyers in 2017–18 (%) 23.1 4.8 15.3 4.9 3.3 8.4
Median age of buyers in 2018 (years) 46.0 44.0 43.0 42.0 43.0 43.0
Attributions of the market
Rotational speed in 2017 (%) 3.8 3.8 5.1 4.1 3.6 4.2
Average sale time in 2018 (%) 4.1 4.4 4.3 3.3 3.8 4.0
Average bargain in 2018 (%) –5.3 –3.0 –2.8 –2.6 –3.6 –3.0
Note: The turnover rate is the ratio of the housing stock and the number of residential property transactions.Source: MNB, housing agent database.
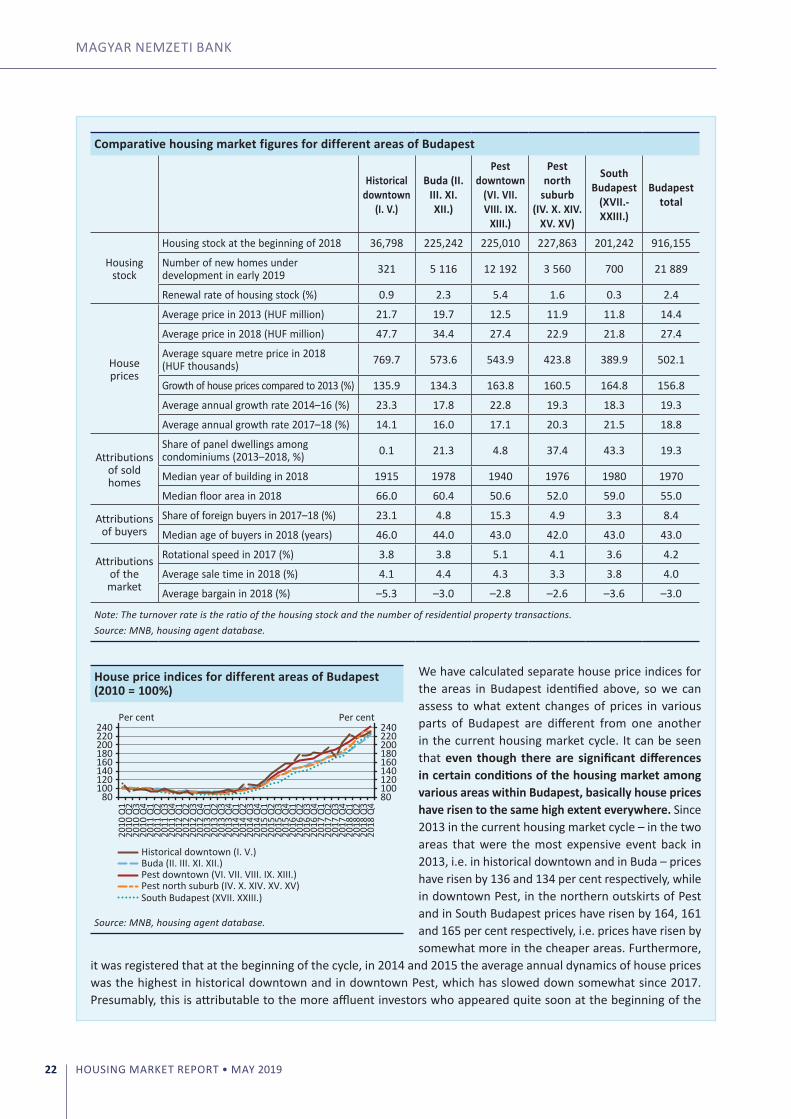
We have calculated separate house price indices for the areas in Budapest identified above, so we can assess to what extent changes of prices in various parts of Budapest are different from one another in the current housing market cycle. It can be seen that even though there are significant differences in certain conditions of the housing market among various areas within Budapest, basically house prices have risen to the same high extent everywhere. Since 2013 in the current housing market cycle – in the two areas that were the most expensive event back in 2013, i.e. in historical downtown and in Buda – prices have risen by 136 and 134 per cent respectively, while in downtown Pest, in the northern outskirts of Pest and in South Budapest prices have risen by 164, 161 and 165 per cent respectively, i.e. prices have risen by somewhat more in the cheaper areas. Furthermore,
it was registered that at the beginning of the cycle, in 2014 and 2015 the average annual dynamics of house prices was the highest in historical downtown and in downtown Pest, which has slowed down somewhat since 2017. Presumably, this is attributable to the more affluent investors who appeared quite soon at the beginning of the
House price indices for different areas of Budapest (2010 = 100%)
80 100 120 140 160 180 200 220 240
80 100 120 140 160 180 200 220 240
2010
Q1
2010
Q2
2010
Q3
2010
Q4
2011
Q1
2011
Q2
2011
Q3
2011
Q4
2012
Q1
2012
Q2
2012
Q3
2012
Q4
2013
Q1
2013
Q2
2013
Q3
2013
Q4
2014
Q1
2014
Q2
2014
Q3
2014
Q4
2015
Q1
2015
Q2
2015
Q3
2015
Q4
2016
Q1
2016
Q2
2016
Q3
2016
Q4
2017
Q1
2017
Q2
2017
Q3
2017
Q4
2018
Q1
2018
Q2
2018
Q3
2018
Q4
Per cent Per cent
Historical downtown (I. V.)Buda (II. III. XI. XII.)Pest downtown (VI. VII. VIII. IX. XIII.)Pest north suburb (IV. X. XIV. XV. XV)South Budapest (XVII. XXIII.)
Source: MNB, housing agent database.
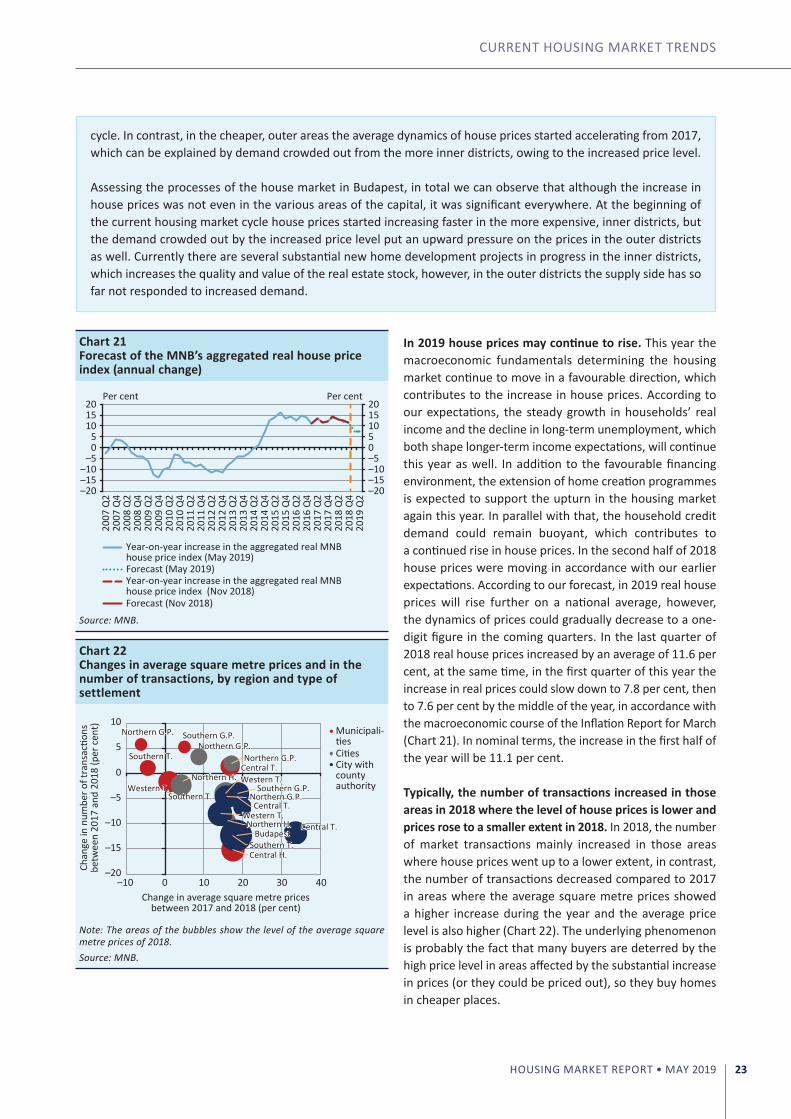
CURRENT HoUSING MARKET TRENDS
HOUSING MARKET REPORT • MAY 2019 23
cycle. In contrast, in the cheaper, outer areas the average dynamics of house prices started accelerating from 2017, which can be explained by demand crowded out from the more inner districts, owing to the increased price level.
Assessing the processes of the house market in Budapest, in total we can observe that although the increase in house prices was not even in the various areas of the capital, it was significant everywhere. At the beginning of the current housing market cycle house prices started increasing faster in the more expensive, inner districts, but the demand crowded out by the increased price level put an upward pressure on the prices in the outer districts as well. Currently there are several substantial new home development projects in progress in the inner districts, which increases the quality and value of the real estate stock, however, in the outer districts the supply side has so far not responded to increased demand.
In 2019 house prices may continue to rise. This year the macroeconomic fundamentals determining the housing market continue to move in a favourable direction, which contributes to the increase in house prices. According to our expectations, the steady growth in households’ real income and the decline in long-term unemployment, which both shape longer-term income expectations, will continue this year as well. In addition to the favourable financing environment, the extension of home creation programmes is expected to support the upturn in the housing market again this year. In parallel with that, the household credit demand could remain buoyant, which contributes to a continued rise in house prices. In the second half of 2018 house prices were moving in accordance with our earlier expectations. According to our forecast, in 2019 real house prices will rise further on a national average, however, the dynamics of prices could gradually decrease to a one-digit figure in the coming quarters. In the last quarter of 2018 real house prices increased by an average of 11.6 per cent, at the same time, in the first quarter of this year the increase in real prices could slow down to 7.8 per cent, then to 7.6 per cent by the middle of the year, in accordance with the macroeconomic course of the Inflation Report for March (Chart 21). In nominal terms, the increase in the first half of the year will be 11.1 per cent.
Typically, the number of transactions increased in those areas in 2018 where the level of house prices is lower and prices rose to a smaller extent in 2018. In 2018, the number of market transactions mainly increased in those areas where house prices went up to a lower extent, in contrast, the number of transactions decreased compared to 2017 in areas where the average square metre prices showed a higher increase during the year and the average price level is also higher (Chart 22). The underlying phenomenon is probably the fact that many buyers are deterred by the high price level in areas affected by the substantial increase in prices (or they could be priced out), so they buy homes in cheaper places.
Chart 21Forecast of the MNB’s aggregated real house price index (annual change)
–20 –15 –10
–5 0 5
10 15 20
–20 –15 –10 –5 0 5 10 15 20
2007
Q2
2007
Q4
2008
Q2
2008
Q4
2009
Q2
2009
Q4
2010
Q2
2010
Q4
2011
Q2
2011
Q4
2012
Q2
2012
Q4
2013
Q2
2013
Q4
2014
Q2
2014
Q4
2015
Q2
2015
Q4
2016
Q2
2016
Q4
2017
Q2
2017
Q4
2018
Q2
2018
Q4
2019
Q2
Per cent Per cent
Year-on-year increase in the aggregated real MNB house price index (Nov 2018)
Year-on-year increase in the aggregated real MNB house price index (May 2019)Forecast (May 2019)
Forecast (Nov 2018)
Source: MNB.
Chart 22Changes in average square metre prices and in the number of transactions, by region and type of settlement
Northern G.P.
Northern H.
Northern H.
Northern G.P.Northern G.P.
Northern G.P.
Southern G.P.
Southern G.P.
Southern T.
Southern T.
Southern T.
Central T.
Central T.
Central T.
Central H.
Western T.
Western T.
Western T.
Budapest
–20
–15
–10
–5
0
5
10
–10 0 10 20 30 40
Chan
ge in
num
ber o
f tra
nsac
tions
betw
een
2017
and
201
8 (p
er c
ent)
Change in average square metre pricesbetween 2017 and 2018 (per cent)
Municipali-tiesCitiesCity withcounty authority
Note: The areas of the bubbles show the level of the average square metre prices of 2018. Source: MNB.
MAGYAR NEMZETI BANK
HOUSING MARKET REPORT • MAY 201924
4 Government Decree 44/2019. (III. 12.), Government Resolution 1110/2019. (III. 12.) and Government Decree 46/2019. (III. 12.). Link: https://magyarkozlony.hu/dokumentumok/8df1cd00eb92a1a572206a7d837511ec6bc27ed4/megtekintes
The price gap between the capital and the countryside keeps widening, while small localities affected by rural HPS lag behind compared to other areas of the country. In 2018, the difference in house price levels between Budapest and localities of the countryside, especially the smaller ones, continued to widen. By 2018 the average square metre prices registered in county seats were only as high as 48 per cent of the average value in the capital, while in 2013 this figure was still 63 per cent. In the case of settlements in the countryside this difference decreased from 57 per cent to 39 per cent, while in the case of villages from 33 to 21 per cent. We can observe even higher differences if we assess small localities affected by rural HPS separately. According to the announcement of the Government, within the rural HPS programme the support under HPS is significantly expanded in small localities of less than 5 thousand persons, showing a declining population. A substantially lower house price level is registered in localities meeting the conditions of the programme. The average square metre prices constituted only 18 per cent of the average value in Budapest in 2018 (Chart 23).
Approximately 2.5 thousand small localities, 79 per cent of all localities, will participate in the rural HPS programme, the rate of the support is significant compared to the values of the transactions. Supplemented by the rural HPS programme, certain elements of the Family Protection Action Plan,4 the low interest loan scheme of prenatal baby support, which can be spent on any purpose, including housing, could substantially increase demand in the housing market, in which the rural HPS is targeted at small localities. In small localities affected by rural HPS properties are significantly cheaper compared to other localities, thus the relatively high amounts of the HPS support could make these localities significantly more attractive. In localities affected by the conditions of the programme, in 2017 and 2018 43 per cent of transactions of properties exceeding 90 m2 were below HUF 10 million (which is the maximum support available under rural HPS for the purchase and renovation of used homes, Chart 24). However, since these localities are located less favourably and have lower infrastructure quality, the large ramp-up of demand for living properties could be somewhat limited.
Chart 23Average square metre price by type of settlement (average of Budapest = 100%)
0 20 40 60 80 100 120 140
0 20 40 60 80
100 120 140
2008
2009
2010
2011
2012
2013
2014
2015
2016
2017
2018
Per cent Per cent
Inner districts Outer districtsCounty seats
CitiesMunicipalities Budapest average
Municipalities with no rural HPS
Rural HPS municipalities
Source: MNB.
Chart 24Distribution of housing transactions in 2017-18 by market value in settlements meeting the requirements of rural HPS and other settlements
2% 2% 2% 3% 5% 6%
80%
6% 10% 14% 13% 13% 12%
32% 43 per cent under HUF 10 million
05101520253035404550
Per cent Per cent
0102030405060708090
0–2.5M HUF
2.5–5M HUF
5–7.5M HUF
7.5–10M HUF
10–12.5M HUF
12.5–15M HUF
Above15 MHUFValue of transaction
Other settlementsSettlements meet the requirements of rural HPS
Note: Based on transactions of residential properties exceeding 90 m2. Source: MNB.
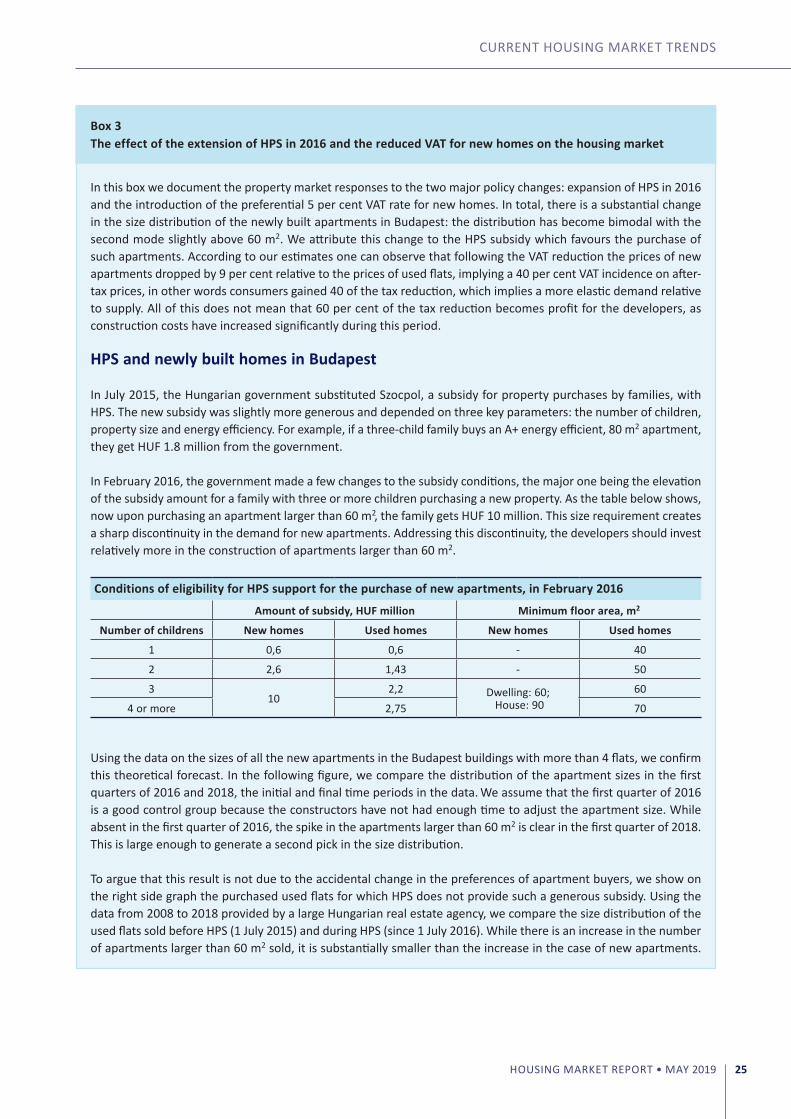
CURRENT HoUSING MARKET TRENDS
HOUSING MARKET REPORT • MAY 2019 25
Box 3The effect of the extension of HPS in 2016 and the reduced VAT for new homes on the housing market
In this box we document the property market responses to the two major policy changes: expansion of HPS in 2016 and the introduction of the preferential 5 per cent VAT rate for new homes. In total, there is a substantial change in the size distribution of the newly built apartments in Budapest: the distribution has become bimodal with the second mode slightly above 60 m2. We attribute this change to the HPS subsidy which favours the purchase of such apartments. According to our estimates one can observe that following the VAT reduction the prices of new apartments dropped by 9 per cent relative to the prices of used flats, implying a 40 per cent VAT incidence on after-tax prices, in other words consumers gained 40 of the tax reduction, which implies a more elastic demand relative to supply. All of this does not mean that 60 per cent of the tax reduction becomes profit for the developers, as construction costs have increased significantly during this period.
HPS and newly built homes in Budapest
In July 2015, the Hungarian government substituted Szocpol, a subsidy for property purchases by families, with HPS. The new subsidy was slightly more generous and depended on three key parameters: the number of children, property size and energy efficiency. For example, if a three-child family buys an A+ energy efficient, 80 m2 apartment, they get HUF 1.8 million from the government.
In February 2016, the government made a few changes to the subsidy conditions, the major one being the elevation of the subsidy amount for a family with three or more children purchasing a new property. As the table below shows, now upon purchasing an apartment larger than 60 m2, the family gets HUF 10 million. This size requirement creates a sharp discontinuity in the demand for new apartments. Addressing this discontinuity, the developers should invest relatively more in the construction of apartments larger than 60 m2.
Conditions of eligibility for HPS support for the purchase of new apartments, in February 2016
Amount of subsidy, HUF million Minimum floor area, m2
Number of childrens New homes Used homes New homes Used homes
1 0,6 0,6 - 40
2 2,6 1,43 - 50
310
2,2 Dwelling: 60; House: 90
60
4 or more 2,75 70
Using the data on the sizes of all the new apartments in the Budapest buildings with more than 4 flats, we confirm this theoretical forecast. In the following figure, we compare the distribution of the apartment sizes in the first quarters of 2016 and 2018, the initial and final time periods in the data. We assume that the first quarter of 2016 is a good control group because the constructors have not had enough time to adjust the apartment size. While absent in the first quarter of 2016, the spike in the apartments larger than 60 m2 is clear in the first quarter of 2018. This is large enough to generate a second pick in the size distribution.
To argue that this result is not due to the accidental change in the preferences of apartment buyers, we show on the right side graph the purchased used flats for which HPS does not provide such a generous subsidy. Using the data from 2008 to 2018 provided by a large Hungarian real estate agency, we compare the size distribution of the used flats sold before HPS (1 July 2015) and during HPS (since 1 July 2016). While there is an increase in the number of apartments larger than 60 m2 sold, it is substantially smaller than the increase in the case of new apartments.
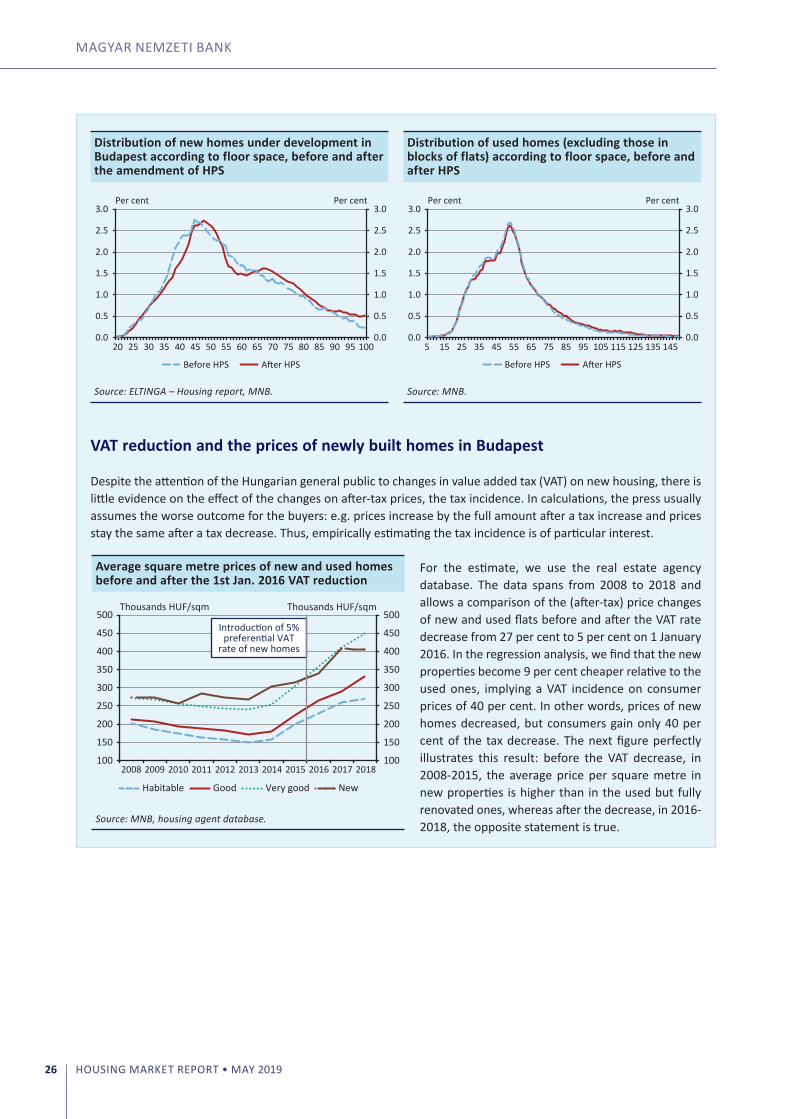
MAGYAR NEMZETI BANK
HOUSING MARKET REPORT • MAY 201926
VAT reduction and the prices of newly built homes in Budapest
Despite the attention of the Hungarian general public to changes in value added tax (VAT) on new housing, there is little evidence on the effect of the changes on after-tax prices, the tax incidence. In calculations, the press usually assumes the worse outcome for the buyers: e.g. prices increase by the full amount after a tax increase and prices stay the same after a tax decrease. Thus, empirically estimating the tax incidence is of particular interest.
For the estimate, we use the real estate agency database. The data spans from 2008 to 2018 and allows a comparison of the (after-tax) price changes of new and used flats before and after the VAT rate decrease from 27 per cent to 5 per cent on 1 January 2016. In the regression analysis, we find that the new properties become 9 per cent cheaper relative to the used ones, implying a VAT incidence on consumer prices of 40 per cent. In other words, prices of new homes decreased, but consumers gain only 40 per cent of the tax decrease. The next figure perfectly illustrates this result: before the VAT decrease, in 2008-2015, the average price per square metre in new properties is higher than in the used but fully renovated ones, whereas after the decrease, in 2016-2018, the opposite statement is true.
Distribution of new homes under development in Budapest according to floor space, before and after the amendment of HPS
Source: ELTINGA – Housing report, MNB.
Distribution of used homes (excluding those in blocks of flats) according to floor space, before and after HPS
Source: MNB.
Average square metre prices of new and used homes before and after the 1st Jan. 2016 VAT reduction
100
150
200
250
300
350
400
450
500
100
150
200
250
300
350
400
450
500
2008 2009 2010 2011 2012 2013 2014 2015 2016 2017 2018
Thousands HUF/sqm Thousands HUF/sqm
Introduction of 5%preferential VAT
rate of new homes
Habitable Good Very good New
Source: MNB, housing agent database.
0.0
0.5
1.0
1.5
2.0
2.5
3.0
0.0
0.5
1.0
1.5
2.0
2.5
3.0
0.0
0.5
1.0
1.5
2.0
2.5
3.0
20 25 30 35 40 45 50 55 60 65 70 75 80 85 90 95 100
Per cent Per cent
0.0
0.5
1.0
1.5
2.0
2.5
3.0 Per centPer cent
Before HPS After HPS
5 15 25 35 45 55 65 75 85 95 105 115 125 135 145
Before HPS After HPS
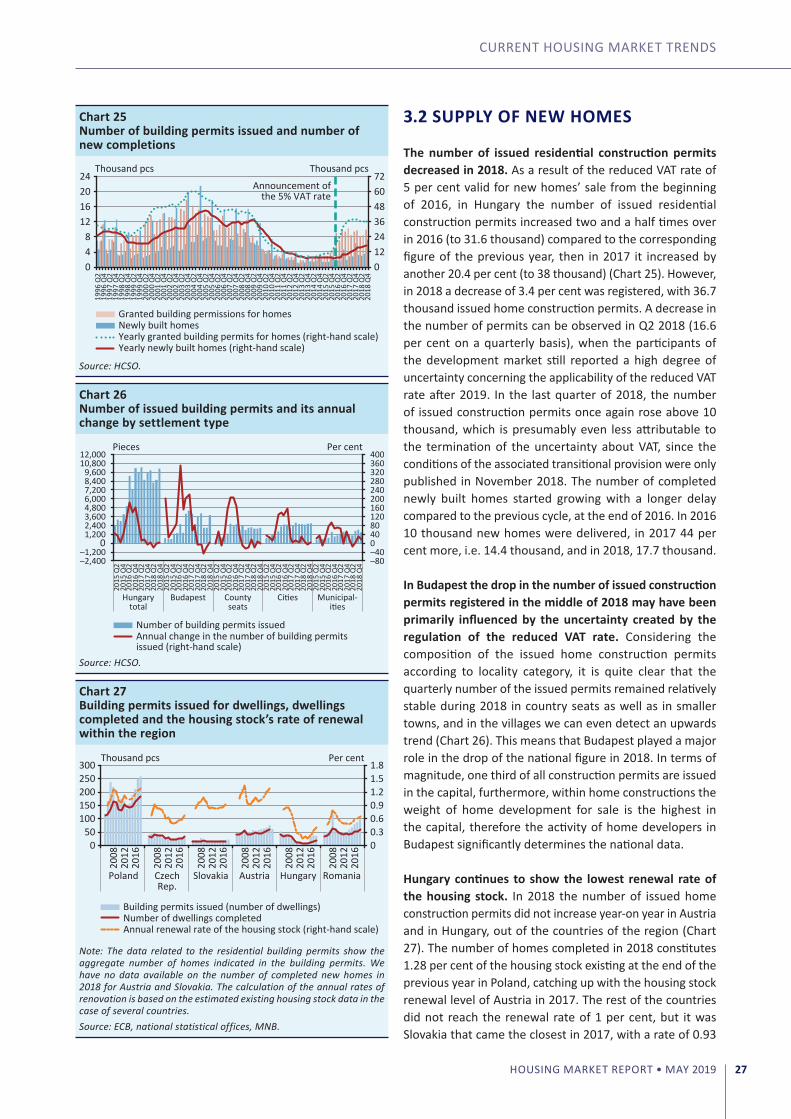
CURRENT HoUSING MARKET TRENDS
HOUSING MARKET REPORT • MAY 2019 27
3.2 SUPPLY OF NEW HOMES
The number of issued residential construction permits decreased in 2018. As a result of the reduced VAT rate of 5 per cent valid for new homes’ sale from the beginning of 2016, in Hungary the number of issued residential construction permits increased two and a half times over in 2016 (to 31.6 thousand) compared to the corresponding figure of the previous year, then in 2017 it increased by another 20.4 per cent (to 38 thousand) (Chart 25). However, in 2018 a decrease of 3.4 per cent was registered, with 36.7 thousand issued home construction permits. A decrease in the number of permits can be observed in Q2 2018 (16.6 per cent on a quarterly basis), when the participants of the development market still reported a high degree of uncertainty concerning the applicability of the reduced VAT rate after 2019. In the last quarter of 2018, the number of issued construction permits once again rose above 10 thousand, which is presumably even less attributable to the termination of the uncertainty about VAT, since the conditions of the associated transitional provision were only published in November 2018. The number of completed newly built homes started growing with a longer delay compared to the previous cycle, at the end of 2016. In 2016 10 thousand new homes were delivered, in 2017 44 per cent more, i.e. 14.4 thousand, and in 2018, 17.7 thousand.
In Budapest the drop in the number of issued construction permits registered in the middle of 2018 may have been primarily influenced by the uncertainty created by the regulation of the reduced VAT rate. Considering the composition of the issued home construction permits according to locality category, it is quite clear that the quarterly number of the issued permits remained relatively stable during 2018 in country seats as well as in smaller towns, and in the villages we can even detect an upwards trend (Chart 26). This means that Budapest played a major role in the drop of the national figure in 2018. In terms of magnitude, one third of all construction permits are issued in the capital, furthermore, within home constructions the weight of home development for sale is the highest in the capital, therefore the activity of home developers in Budapest significantly determines the national data.
Hungary continues to show the lowest renewal rate of the housing stock. In 2018 the number of issued home construction permits did not increase year-on year in Austria and in Hungary, out of the countries of the region (Chart 27). The number of homes completed in 2018 constitutes 1.28 per cent of the housing stock existing at the end of the previous year in Poland, catching up with the housing stock renewal level of Austria in 2017. The rest of the countries did not reach the renewal rate of 1 per cent, but it was Slovakia that came the closest in 2017, with a rate of 0.93
Chart 25Number of building permits issued and number of new completions
1996
Q2
1996
Q4
1997
Q2
1997
Q4
1998
Q2
1998
Q4
1999
Q2
1999
Q4
2000
Q2
2000
Q4
2001
Q2
2001
Q4
2002
Q2
2002
Q4
2003
Q2
2003
Q4
2004
Q2
2004
Q4
2005
Q2
2005
Q4
2006
Q2
2006
Q4
2007
Q2
2007
Q4
2008
Q2
2008
Q4
2009
Q2
2009
Q4
2010
Q2
2010
Q4
2011
Q2
2011
Q4
2012
Q2
2012
Q4
2013
Q2
2013
Q4
2014
Q2
2014
Q4
2015
Q2
2015
Q4
2016
Q2
2016
Q4
2017
Q2
2017
Q4
2018
Q2
2018
Q4
0 12 24 36 48 60 72
0 4 8
12 16 20 24
Thousand pcs Thousand pcs
Granted building permissions for homesNewly built homesYearly granted building permits for homes (right-hand scale)Yearly newly built homes (right-hand scale)
Announcement ofthe 5% VAT rate
Source: HCSO.
Chart 26Number of issued building permits and its annual change by settlement type
–80 –40 0 40 80 120 160 200 240 280 320 360 400
–2,400 –1,200
0 1,200 2,400 3,600 4,800 6,000 7,200 8,400 9,600
10,800 12,000
2015
Q2
2015
Q4
2016
Q2
2016
Q4
2017
Q2
2017
Q4
2018
Q2
2018
Q4
2015
Q2
2015
Q4
2016
Q2
2016
Q4
2017
Q2
2017
Q4
2018
Q2
2018
Q4
2015
Q2
2015
Q4
2016
Q2
2016
Q4
2017
Q2
2017
Q4
2018
Q2
2018
Q4
2015
Q2
2015
Q4
2016
Q2
2016
Q4
2017
Q2
2017
Q4
2018
Q2
2018
Q4
2015
Q2
2015
Q4
2016
Q2
2016
Q4
2017
Q2
2017
Q4
2018
Q2
2018
Q4
Hungarytotal
Budapest Countyseats
Cities Municipal-ities
Per centPieces
Number of building permits issuedAnnual change in the number of building permits issued (right-hand scale)
Source: HCSO.
Chart 27Building permits issued for dwellings, dwellings completed and the housing stock’s rate of renewal within the region
0 0.3 0.6 0.9 1.2 1.5 1.8
0 50
100 150 200 250 300
2008
20
12
2016
2008
20
12
2016
2008
20
12
2016
2008
20
12
2016
2008
20
12
2016
2008
20
12
2016
Poland CzechRep.
Slovakia Austria Hungary Romania
Per centThousand pcs
Building permits issued (number of dwellings)Number of dwellings completedAnnual renewal rate of the housing stock (right-hand scale)
Note: The data related to the residential building permits show the aggregate number of homes indicated in the building permits. We have no data available on the number of completed new homes in 2018 for Austria and Slovakia. The calculation of the annual rates of renovation is based on the estimated existing housing stock data in the case of several countries. Source: ECB, national statistical offices, MNB.
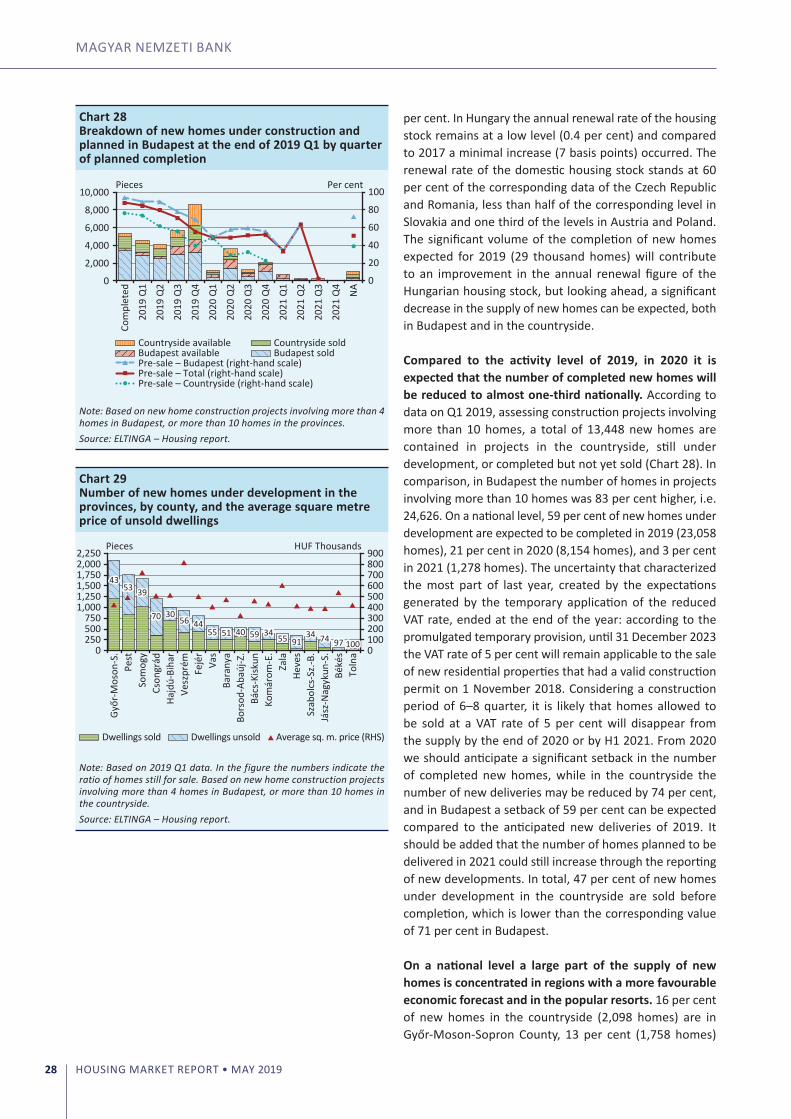
MAGYAR NEMZETI BANK
HOUSING MARKET REPORT • MAY 201928
per cent. In Hungary the annual renewal rate of the housing stock remains at a low level (0.4 per cent) and compared to 2017 a minimal increase (7 basis points) occurred. The renewal rate of the domestic housing stock stands at 60 per cent of the corresponding data of the Czech Republic and Romania, less than half of the corresponding level in Slovakia and one third of the levels in Austria and Poland. The significant volume of the completion of new homes expected for 2019 (29 thousand homes) will contribute to an improvement in the annual renewal figure of the Hungarian housing stock, but looking ahead, a significant decrease in the supply of new homes can be expected, both in Budapest and in the countryside.
Compared to the activity level of 2019, in 2020 it is expected that the number of completed new homes will be reduced to almost one-third nationally. According to data on Q1 2019, assessing construction projects involving more than 10 homes, a total of 13,448 new homes are contained in projects in the countryside, still under development, or completed but not yet sold (Chart 28). In comparison, in Budapest the number of homes in projects involving more than 10 homes was 83 per cent higher, i.e. 24,626. on a national level, 59 per cent of new homes under development are expected to be completed in 2019 (23,058 homes), 21 per cent in 2020 (8,154 homes), and 3 per cent in 2021 (1,278 homes). The uncertainty that characterized the most part of last year, created by the expectations generated by the temporary application of the reduced VAT rate, ended at the end of the year: according to the promulgated temporary provision, until 31 December 2023 the VAT rate of 5 per cent will remain applicable to the sale of new residential properties that had a valid construction permit on 1 November 2018. Considering a construction period of 6–8 quarter, it is likely that homes allowed to be sold at a VAT rate of 5 per cent will disappear from the supply by the end of 2020 or by H1 2021. From 2020 we should anticipate a significant setback in the number of completed new homes, while in the countryside the number of new deliveries may be reduced by 74 per cent, and in Budapest a setback of 59 per cent can be expected compared to the anticipated new deliveries of 2019. It should be added that the number of homes planned to be delivered in 2021 could still increase through the reporting of new developments. In total, 47 per cent of new homes under development in the countryside are sold before completion, which is lower than the corresponding value of 71 per cent in Budapest.
On a national level a large part of the supply of new homes is concentrated in regions with a more favourable economic forecast and in the popular resorts. 16 per cent of new homes in the countryside (2,098 homes) are in Győr-Moson-Sopron County, 13 per cent (1,758 homes)
Chart 28Breakdown of new homes under construction and planned in Budapest at the end of 2019 Q1 by quarter of planned completion
0
20
40
60
80
100
0
2,000
4,000
6,000
8,000
10,000
Com
plet
ed
2019
Q1
2019
Q2
2019
Q3
2019
Q4
2020
Q1
2020
Q2
2020
Q3
2020
Q4
2021
Q1
2021
Q2
2021
Q3
2021
Q4
NA
Per centPieces
Countryside available Countryside soldBudapest available Budapest soldPre-sale – Budapest (right-hand scale)
Pre-sale – Countryside (right-hand scale)Pre-sale – Total (right-hand scale)
Note: Based on new home construction projects involving more than 4 homes in Budapest, or more than 10 homes in the provinces.Source: ELTINGA – Housing report.
Chart 29Number of new homes under development in the provinces, by county, and the average square metre price of unsold dwellings
4353 39
70 3056 44
55 51 40 59 3455 91
34 74 97 100 0 100 200 300 400 500 600 700 800 900
0 250 500 750
1,000 1,250 1,500 1,750 2,000 2,250
Győr
-Mos
on-S
. Pe
st
Som
ogy
Cson
grád
Ha
jdú-
Biha
r Ve
szpr
ém
Fejé
r Va
s Ba
rany
a Bo
rsod
-Aba
új-Z
. Bá
cs-K
iskun
Ko
már
om-E
. Za
la
Heve
s Sz
abol
cs-S
z.-B
. Já
sz-N
agyk
un-S
. Bé
kés
Toln
a
HUF ThousandsPieces
Average sq. m. price (RHS)Dwellings sold Dwellings unsold
Note: Based on 2019 Q1 data. In the figure the numbers indicate the ratio of homes still for sale. Based on new home construction projects involving more than 4 homes in Budapest, or more than 10 homes in the countryside. Source: ELTINGA – Housing report.
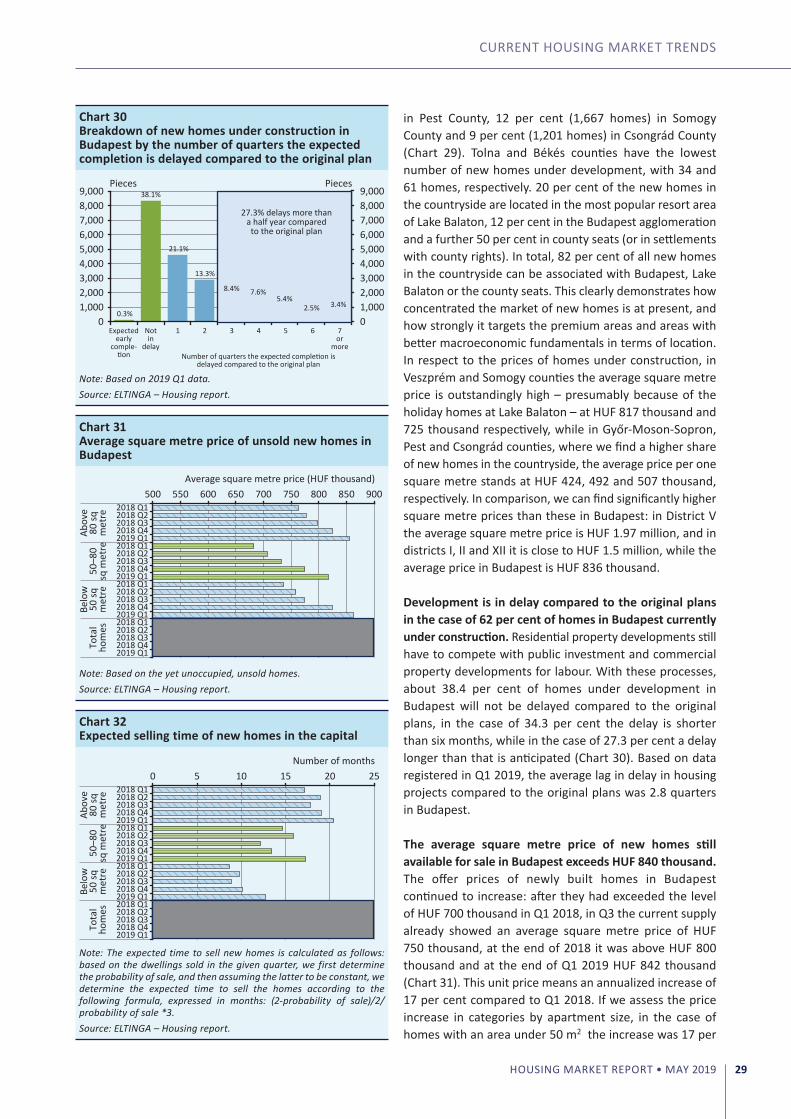
CURRENT HoUSING MARKET TRENDS
HOUSING MARKET REPORT • MAY 2019 29
in Pest County, 12 per cent (1,667 homes) in Somogy County and 9 per cent (1,201 homes) in Csongrád County (Chart 29). Tolna and Békés counties have the lowest number of new homes under development, with 34 and 61 homes, respectively. 20 per cent of the new homes in the countryside are located in the most popular resort area of Lake Balaton, 12 per cent in the Budapest agglomeration and a further 50 per cent in county seats (or in settlements with county rights). In total, 82 per cent of all new homes in the countryside can be associated with Budapest, Lake Balaton or the county seats. This clearly demonstrates how concentrated the market of new homes is at present, and how strongly it targets the premium areas and areas with better macroeconomic fundamentals in terms of location. In respect to the prices of homes under construction, in Veszprém and Somogy counties the average square metre price is outstandingly high – presumably because of the holiday homes at Lake Balaton – at HUF 817 thousand and 725 thousand respectively, while in Győr-Moson-Sopron, Pest and Csongrád counties, where we find a higher share of new homes in the countryside, the average price per one square metre stands at HUF 424, 492 and 507 thousand, respectively. In comparison, we can find significantly higher square metre prices than these in Budapest: in District V the average square metre price is HUF 1.97 million, and in districts I, II and XII it is close to HUF 1.5 million, while the average price in Budapest is HUF 836 thousand.
Development is in delay compared to the original plans in the case of 62 per cent of homes in Budapest currently under construction. Residential property developments still have to compete with public investment and commercial property developments for labour. With these processes, about 38.4 per cent of homes under development in Budapest will not be delayed compared to the original plans, in the case of 34.3 per cent the delay is shorter than six months, while in the case of 27.3 per cent a delay longer than that is anticipated (Chart 30). Based on data registered in Q1 2019, the average lag in delay in housing projects compared to the original plans was 2.8 quarters in Budapest.
The average square metre price of new homes still available for sale in Budapest exceeds HUF 840 thousand. The offer prices of newly built homes in Budapest continued to increase: after they had exceeded the level of HUF 700 thousand in Q1 2018, in Q3 the current supply already showed an average square metre price of HUF 750 thousand, at the end of 2018 it was above HUF 800 thousand and at the end of Q1 2019 HUF 842 thousand (Chart 31). This unit price means an annualized increase of 17 per cent compared to Q1 2018. If we assess the price increase in categories by apartment size, in the case of homes with an area under 50 m2 the increase was 17 per
Chart 30Breakdown of new homes under construction in Budapest by the number of quarters the expected completion is delayed compared to the original plan
0.3%
38.1%
27.3% delays more thana half year comparedto the original plan
21.1%
13.3%
8.4% 7.6%5.4%
2.5% 3.4%
0 1,000 2,000 3,000 4,000 5,000 6,000 7,000 8,000 9,000
0 1,000 2,000 3,000 4,000 5,000 6,000 7,000 8,000 9,000
Expectedearly
comple-tion
Notin
delay
1 2 3 4 5 6 7or
moreNumber of quarters the expected completion is
delayed compared to the original plan
Pieces Pieces
Note: Based on 2019 Q1 data.Source: ELTINGA – Housing report.
Chart 31Average square metre price of unsold new homes in Budapest
500 550 600 650 700 750 800 850 900
2019 Q12018 Q42018 Q32018 Q22018 Q12019 Q12018 Q42018 Q32018 Q22018 Q12019 Q12018 Q42018 Q32018 Q22018 Q12019 Q12018 Q42018 Q32018 Q22018 Q1
Tota
lho
mes
Belo
w50
sqm
etre
50–8
0sq
met
re
Abov
e80
sqm
etre
Average square metre price (HUF thousand)
Note: Based on the yet unoccupied, unsold homes.Source: ELTINGA – Housing report.
Chart 32Expected selling time of new homes in the capital
0 5 10 15 20 25Number of months
2019 Q12018 Q42018 Q32018 Q22018 Q12019 Q12018 Q42018 Q32018 Q22018 Q12019 Q12018 Q42018 Q32018 Q22018 Q12019 Q12018 Q42018 Q32018 Q22018 Q1
Tota
lho
mes
Belo
w50
sqm
etre
50–8
0sq
met
re
Abov
e80
sqm
etre
Note: The expected time to sell new homes is calculated as follows: based on the dwellings sold in the given quarter, we first determine the probability of sale, and then assuming the latter to be constant, we determine the expected time to sell the homes according to the following formula, expressed in months: (2-probability of sale)/2/probability of sale *3.Source: ELTINGA – Housing report.
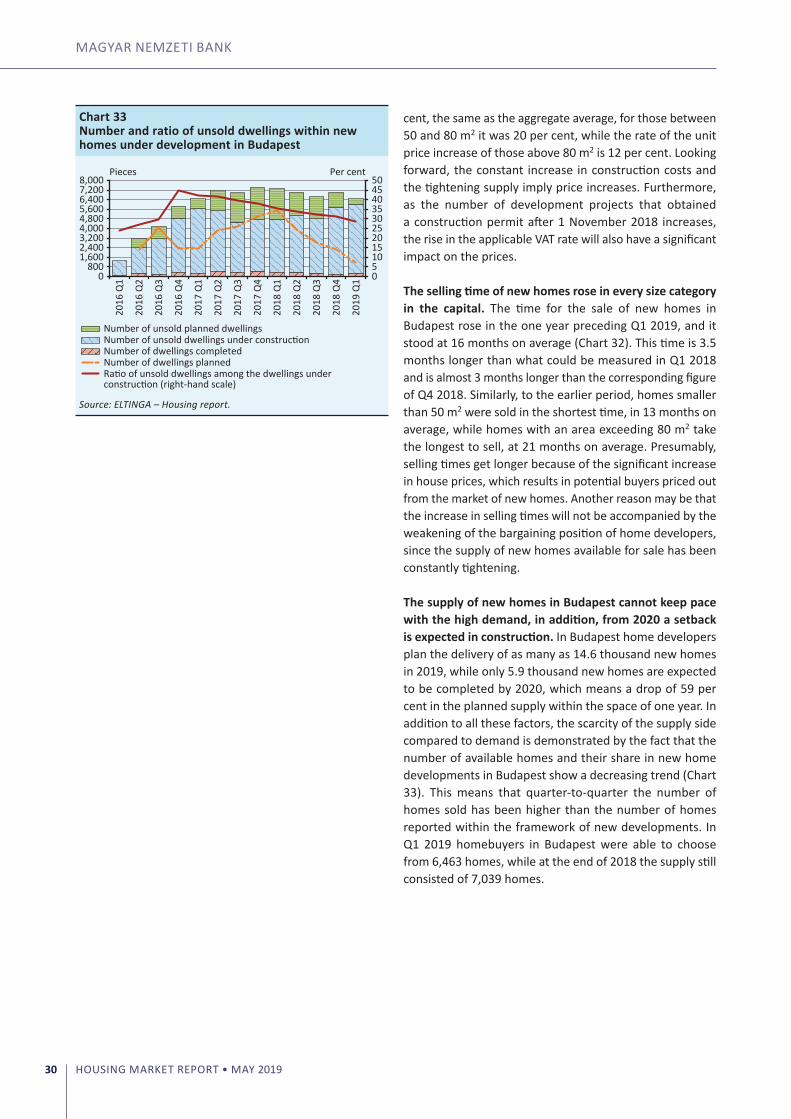
MAGYAR NEMZETI BANK
HOUSING MARKET REPORT • MAY 201930
cent, the same as the aggregate average, for those between 50 and 80 m2 it was 20 per cent, while the rate of the unit price increase of those above 80 m2 is 12 per cent. Looking forward, the constant increase in construction costs and the tightening supply imply price increases. Furthermore, as the number of development projects that obtained a construction permit after 1 November 2018 increases, the rise in the applicable VAT rate will also have a significant impact on the prices.
The selling time of new homes rose in every size category in the capital. The time for the sale of new homes in Budapest rose in the one year preceding Q1 2019, and it stood at 16 months on average (Chart 32). This time is 3.5 months longer than what could be measured in Q1 2018 and is almost 3 months longer than the corresponding figure of Q4 2018. Similarly, to the earlier period, homes smaller than 50 m2 were sold in the shortest time, in 13 months on average, while homes with an area exceeding 80 m2 take the longest to sell, at 21 months on average. Presumably, selling times get longer because of the significant increase in house prices, which results in potential buyers priced out from the market of new homes. Another reason may be that the increase in selling times will not be accompanied by the weakening of the bargaining position of home developers, since the supply of new homes available for sale has been constantly tightening.
The supply of new homes in Budapest cannot keep pace with the high demand, in addition, from 2020 a setback is expected in construction. In Budapest home developers plan the delivery of as many as 14.6 thousand new homes in 2019, while only 5.9 thousand new homes are expected to be completed by 2020, which means a drop of 59 per cent in the planned supply within the space of one year. In addition to all these factors, the scarcity of the supply side compared to demand is demonstrated by the fact that the number of available homes and their share in new home developments in Budapest show a decreasing trend (Chart 33). This means that quarter-to-quarter the number of homes sold has been higher than the number of homes reported within the framework of new developments. In Q1 2019 homebuyers in Budapest were able to choose from 6,463 homes, while at the end of 2018 the supply still consisted of 7,039 homes.
Chart 33Number and ratio of unsold dwellings within new homes under development in Budapest
0
10
20
30
40
5
15
25
35
4550
0 800
1,600 2,400 3,200 4,000 4,800 5,600 6,400 7,200 8,000
2016
Q1
2016
Q2
2016
Q3
2016
Q4
2017
Q1
2017
Q2
2017
Q3
2017
Q4
2018
Q1
2018
Q2
2018
Q3
2018
Q4
2019
Q1
Pieces Per cent
Number of unsold planned dwellingsNumber of unsold dwellings under constructionNumber of dwellings completedNumber of dwellings plannedRatio of unsold dwellings among the dwellings under construction (right-hand scale)
Source: ELTINGA – Housing report.
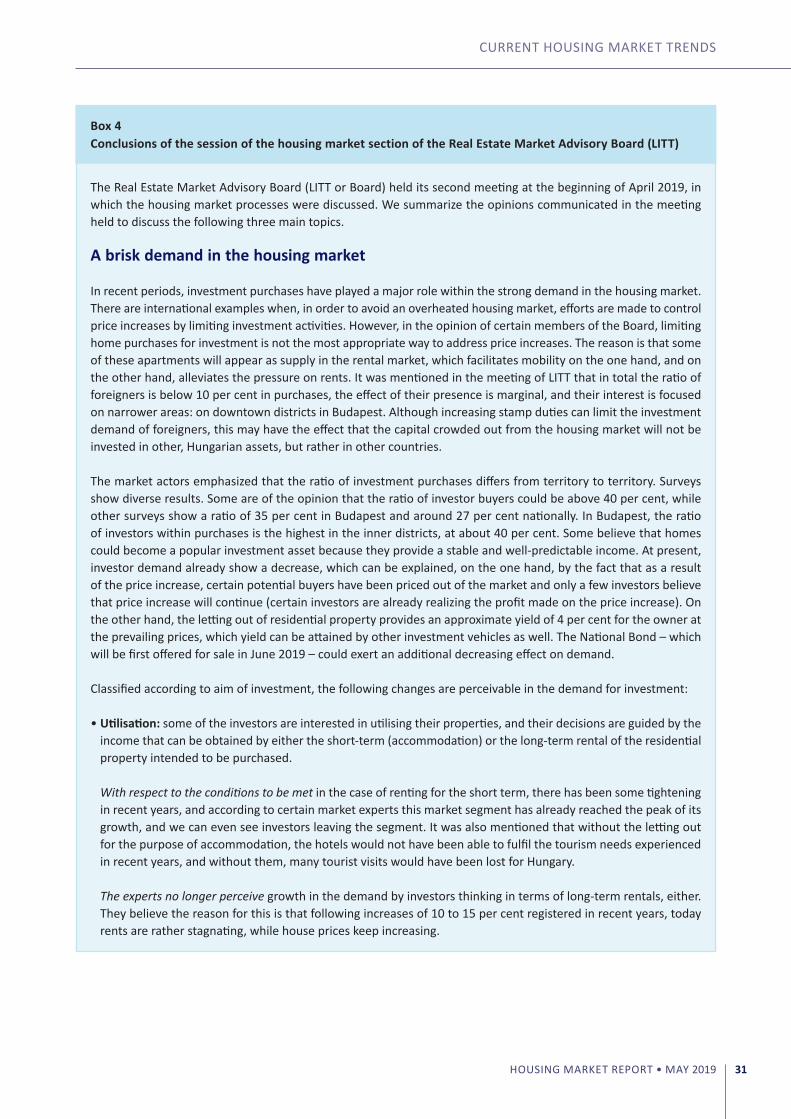
CURRENT HoUSING MARKET TRENDS
HOUSING MARKET REPORT • MAY 2019 31
Box 4Conclusions of the session of the housing market section of the Real Estate Market Advisory Board (LITT)
The Real Estate Market Advisory Board (LITT or Board) held its second meeting at the beginning of April 2019, in which the housing market processes were discussed. We summarize the opinions communicated in the meeting held to discuss the following three main topics.
A brisk demand in the housing market
In recent periods, investment purchases have played a major role within the strong demand in the housing market. There are international examples when, in order to avoid an overheated housing market, efforts are made to control price increases by limiting investment activities. However, in the opinion of certain members of the Board, limiting home purchases for investment is not the most appropriate way to address price increases. The reason is that some of these apartments will appear as supply in the rental market, which facilitates mobility on the one hand, and on the other hand, alleviates the pressure on rents. It was mentioned in the meeting of LITT that in total the ratio of foreigners is below 10 per cent in purchases, the effect of their presence is marginal, and their interest is focused on narrower areas: on downtown districts in Budapest. Although increasing stamp duties can limit the investment demand of foreigners, this may have the effect that the capital crowded out from the housing market will not be invested in other, Hungarian assets, but rather in other countries.
The market actors emphasized that the ratio of investment purchases differs from territory to territory. Surveys show diverse results. Some are of the opinion that the ratio of investor buyers could be above 40 per cent, while other surveys show a ratio of 35 per cent in Budapest and around 27 per cent nationally. In Budapest, the ratio of investors within purchases is the highest in the inner districts, at about 40 per cent. Some believe that homes could become a popular investment asset because they provide a stable and well-predictable income. At present, investor demand already show a decrease, which can be explained, on the one hand, by the fact that as a result of the price increase, certain potential buyers have been priced out of the market and only a few investors believe that price increase will continue (certain investors are already realizing the profit made on the price increase). on the other hand, the letting out of residential property provides an approximate yield of 4 per cent for the owner at the prevailing prices, which yield can be attained by other investment vehicles as well. The National Bond – which will be first offered for sale in June 2019 – could exert an additional decreasing effect on demand.
Classified according to aim of investment, the following changes are perceivable in the demand for investment:
• Utilisation: some of the investors are interested in utilising their properties, and their decisions are guided by the income that can be obtained by either the short-term (accommodation) or the long-term rental of the residential property intended to be purchased.
With respect to the conditions to be met in the case of renting for the short term, there has been some tightening in recent years, and according to certain market experts this market segment has already reached the peak of its growth, and we can even see investors leaving the segment. It was also mentioned that without the letting out for the purpose of accommodation, the hotels would not have been able to fulfil the tourism needs experienced in recent years, and without them, many tourist visits would have been lost for Hungary.
The experts no longer perceive growth in the demand by investors thinking in terms of long-term rentals, either. They believe the reason for this is that following increases of 10 to 15 per cent registered in recent years, today rents are rather stagnating, while house prices keep increasing.
MAGYAR NEMZETI BANK
HOUSING MARKET REPORT • MAY 201932
• Price increase: other investors are not so much motivated by the development of rents, but rather purchase homes in the hope of being able to sell them later, at higher prices.
Within this type of investors, those investors have a significant role who also create value added by purchasing homes in poor condition and then reselling them to investors following the renovation. According to some experts, the presence of such investors brings benefits to the market, as they increase the supply of high-quality homes in Budapest. It is mainly the possibility of accessing building capacities that could influence the activity of this segment. Assuming that a residential property needs extensive renovation work once every 20 years in order to maintain its quality, given the domestic residential property stock of 4.4 million units, 200 thousand apartments would have to be renovated annually. In recent years, approximately 60 to 80 per cent of this volume was actually renovated, typically owing to lack of funds, but reaching this level was facilitated by the renovation activity of investors also creating value added.
For those buyers who only purchase for the increase in prices, Budapest has been the most favourable investment location in the past few years, however, there are types of homes for which no significant price increase can be expected any longer. It was also held that owing to price appreciation, countryside cities may become new targets for investors in the future, and of these the larger cities of East Hungary could be the most preferred locations.
The lack of an institutional rental apartment sector in Hungary
In Hungary the number of private renters is significantly higher than the number of renters operating within an institutional framework. At the meeting of the Board several experts pointed out that there are virtually no institutional investors in the domestic market of rental apartments. The development of the institutional rental apartment sector could support the adoption of more prudent investment decisions in the housing market, compared to the decisions of private individuals. This is because in an environment of decreasing house prices private investors will decide to exit more easily, while institutional investors invest in the long term, and they can wait for several years for another market upturn, if price trends are not favourable. The emergence of an institutional sector of rental apartments would make it easier to meet the demand for residential rental properties, furthermore, institutional investors would provide more stable demand from the point of view of the developers. The ratio of user-owned residential properties is high in Hungary in international comparison, and a large part of the assets of households is constituted by residential properties. At the same time, in countries with institutional markets of rental residential properties, apartment rentals provide a relevant, long-term alternative to purchase, and in light of the increase in house prices there could be increasing demand for that in Hungary as well.
It was also mentioned that in Hungary there are limiting factors to the development of the sector that arise from the regulatory framework. one of these factors is VAT regulation, since the VAT payable on institutional real property rental is 27 per cent in Hungary, and because of this institutional rental cannot compete with rental by private individuals. The existing regulations on the legal relationship of leasing was mentioned as another limiting factor, concerning which a regulatory framework supporting long-term rental should be established, with the availability of international examples. It was mentioned in the meeting that in the long term the matter of the development of the institutional rental property sector needs to be addressed, since without this it is not possible to expand the supply of residential properties to the appropriate extent.
Decreasing supply in the housing market
Within the housing market supply, most of the residential properties available are used homes, the price difference between used and new residential properties has been moving dynamically. When the price of new homes is increasing, the price of used homes will also go up. Currently the housing market is characterized by very strong demand, which is also supported by the macro-economic (wages, unemployment, interest rate environment) and the regulatory environment (extended HPS, rural HPS). Most of 2018 was characterized by uncertainty in respect to the reduced VAT rate of 5 per cent, which resulted in a major setback in new-home development projects in
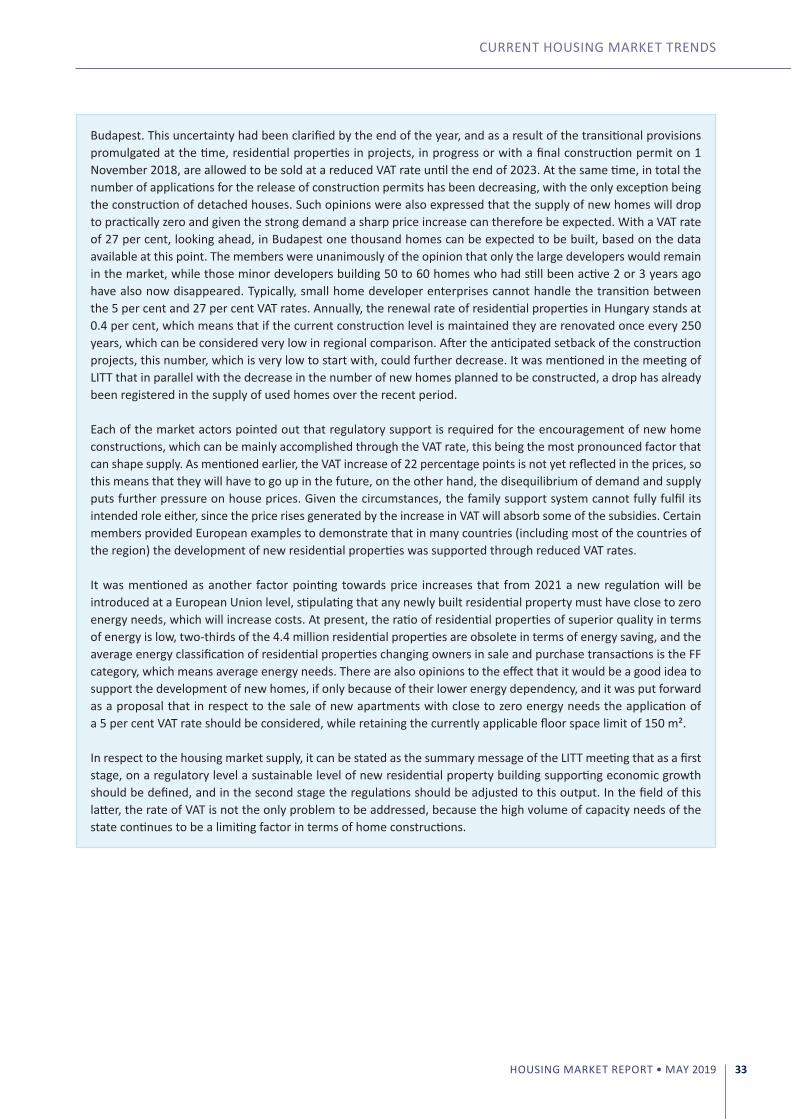
CURRENT HoUSING MARKET TRENDS
HOUSING MARKET REPORT • MAY 2019 33
Budapest. This uncertainty had been clarified by the end of the year, and as a result of the transitional provisions promulgated at the time, residential properties in projects, in progress or with a final construction permit on 1 November 2018, are allowed to be sold at a reduced VAT rate until the end of 2023. At the same time, in total the number of applications for the release of construction permits has been decreasing, with the only exception being the construction of detached houses. Such opinions were also expressed that the supply of new homes will drop to practically zero and given the strong demand a sharp price increase can therefore be expected. With a VAT rate of 27 per cent, looking ahead, in Budapest one thousand homes can be expected to be built, based on the data available at this point. The members were unanimously of the opinion that only the large developers would remain in the market, while those minor developers building 50 to 60 homes who had still been active 2 or 3 years ago have also now disappeared. Typically, small home developer enterprises cannot handle the transition between the 5 per cent and 27 per cent VAT rates. Annually, the renewal rate of residential properties in Hungary stands at 0.4 per cent, which means that if the current construction level is maintained they are renovated once every 250 years, which can be considered very low in regional comparison. After the anticipated setback of the construction projects, this number, which is very low to start with, could further decrease. It was mentioned in the meeting of LITT that in parallel with the decrease in the number of new homes planned to be constructed, a drop has already been registered in the supply of used homes over the recent period.
Each of the market actors pointed out that regulatory support is required for the encouragement of new home constructions, which can be mainly accomplished through the VAT rate, this being the most pronounced factor that can shape supply. As mentioned earlier, the VAT increase of 22 percentage points is not yet reflected in the prices, so this means that they will have to go up in the future, on the other hand, the disequilibrium of demand and supply puts further pressure on house prices. Given the circumstances, the family support system cannot fully fulfil its intended role either, since the price rises generated by the increase in VAT will absorb some of the subsidies. Certain members provided European examples to demonstrate that in many countries (including most of the countries of the region) the development of new residential properties was supported through reduced VAT rates.
It was mentioned as another factor pointing towards price increases that from 2021 a new regulation will be introduced at a European Union level, stipulating that any newly built residential property must have close to zero energy needs, which will increase costs. At present, the ratio of residential properties of superior quality in terms of energy is low, two-thirds of the 4.4 million residential properties are obsolete in terms of energy saving, and the average energy classification of residential properties changing owners in sale and purchase transactions is the FF category, which means average energy needs. There are also opinions to the effect that it would be a good idea to support the development of new homes, if only because of their lower energy dependency, and it was put forward as a proposal that in respect to the sale of new apartments with close to zero energy needs the application of a 5 per cent VAT rate should be considered, while retaining the currently applicable floor space limit of 150 m².
In respect to the housing market supply, it can be stated as the summary message of the LITT meeting that as a first stage, on a regulatory level a sustainable level of new residential property building supporting economic growth should be defined, and in the second stage the regulations should be adjusted to this output. In the field of this latter, the rate of VAT is not the only problem to be addressed, because the high volume of capacity needs of the state continues to be a limiting factor in terms of home constructions.
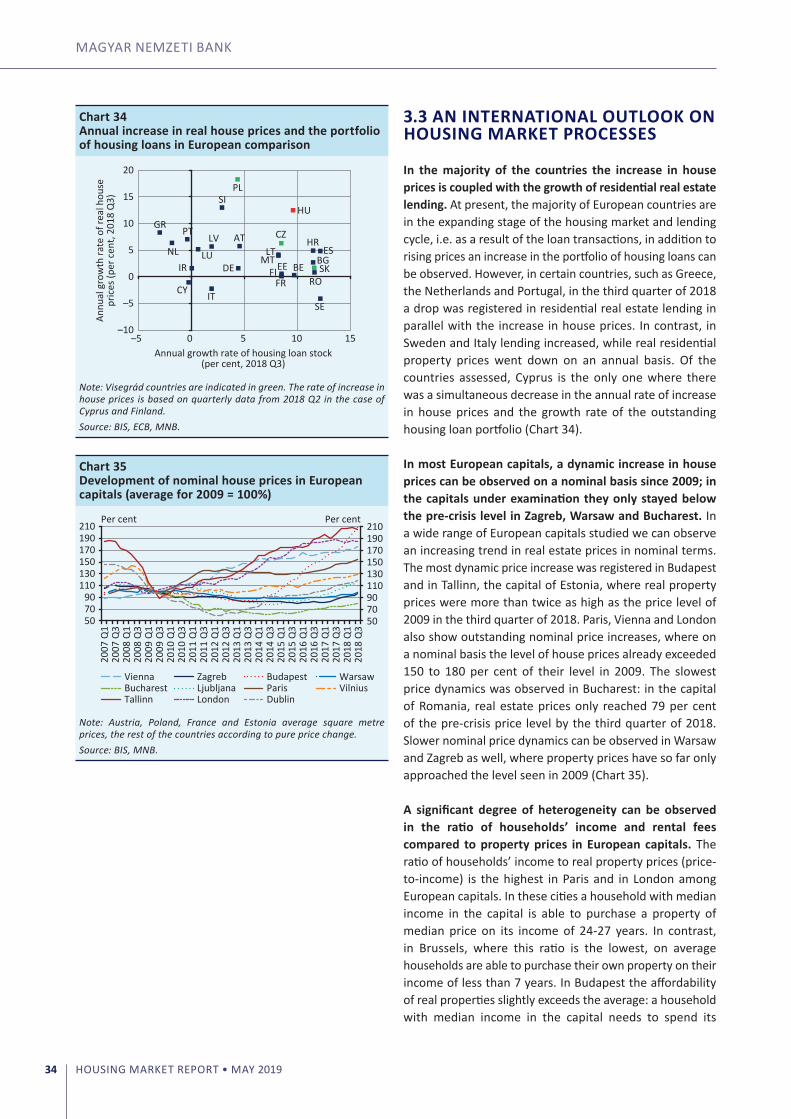
MAGYAR NEMZETI BANK
HOUSING MARKET REPORT • MAY 201934
3.3 AN INTERNATIONAL OUTLOOK ON HOUSING MARKET PROCESSES
In the majority of the countries the increase in house prices is coupled with the growth of residential real estate lending. At present, the majority of European countries are in the expanding stage of the housing market and lending cycle, i.e. as a result of the loan transactions, in addition to rising prices an increase in the portfolio of housing loans can be observed. However, in certain countries, such as Greece, the Netherlands and Portugal, in the third quarter of 2018 a drop was registered in residential real estate lending in parallel with the increase in house prices. In contrast, in Sweden and Italy lending increased, while real residential property prices went down on an annual basis. of the countries assessed, Cyprus is the only one where there was a simultaneous decrease in the annual rate of increase in house prices and the growth rate of the outstanding housing loan portfolio (Chart 34).
In most European capitals, a dynamic increase in house prices can be observed on a nominal basis since 2009; in the capitals under examination they only stayed below the pre-crisis level in Zagreb, Warsaw and Bucharest. In a wide range of European capitals studied we can observe an increasing trend in real estate prices in nominal terms. The most dynamic price increase was registered in Budapest and in Tallinn, the capital of Estonia, where real property prices were more than twice as high as the price level of 2009 in the third quarter of 2018. Paris, Vienna and London also show outstanding nominal price increases, where on a nominal basis the level of house prices already exceeded 150 to 180 per cent of their level in 2009. The slowest price dynamics was observed in Bucharest: in the capital of Romania, real estate prices only reached 79 per cent of the pre-crisis price level by the third quarter of 2018. Slower nominal price dynamics can be observed in Warsaw and Zagreb as well, where property prices have so far only approached the level seen in 2009 (Chart 35).
A significant degree of heterogeneity can be observed in the ratio of households’ income and rental fees compared to property prices in European capitals. The ratio of households’ income to real property prices (price-to-income) is the highest in Paris and in London among European capitals. In these cities a household with median income in the capital is able to purchase a property of median price on its income of 24-27 years. In contrast, in Brussels, where this ratio is the lowest, on average households are able to purchase their own property on their income of less than 7 years. In Budapest the affordability of real properties slightly exceeds the average: a household with median income in the capital needs to spend its
Chart 34Annual increase in real house prices and the portfolio of housing loans in European comparison
AT
BEBG
CY
CZ
DE EEES
FIFR
GR
HR
HU
IR
IT
LTLU
LV
MTNL
PL
PT
RO
SE
SI
SK
–10
–5
0
5
10
15
20
–5 0 5 10 15
Annu
al g
row
th ra
te o
f rea
l hou
sepr
ices
(per
cen
t, 20
18 Q
3)
Annual growth rate of housing loan stock(per cent, 2018 Q3)
Note: Visegrád countries are indicated in green. The rate of increase in house prices is based on quarterly data from 2018 Q2 in the case of Cyprus and Finland.Source: BIS, ECB, MNB.
Chart 35Development of nominal house prices in European capitals (average for 2009 = 100%)
50 70 90 110 130 150 170 190 210
50 70 90
110 130 150 170 190 210
2007
Q1
2007
Q3
2008
Q1
2008
Q3
2009
Q1
2009
Q3
2010
Q1
2010
Q3
2011
Q1
2011
Q3
2012
Q1
2012
Q3
2013
Q1
2013
Q3
2014
Q1
2014
Q3
2015
Q1
2015
Q3
2016
Q1
2016
Q3
2017
Q1
2017
Q3
2018
Q1
2018
Q3
Per cent Per cent
Tallinn
ViennaLjubljanaLondon
Paris VilniusDublin
BucharestZagreb Budapest Warsaw
Note: Austria, Poland, France and Estonia average square metre prices, the rest of the countries according to pure price change.Source: BIS, MNB.

CURRENT HoUSING MARKET TRENDS
HOUSING MARKET REPORT • MAY 2019 35
income of roughly 15 years to purchase a property in the capital. of the capitals of the rest of the Visegrád countries, the affordability of residential properties in Prague is similar to the Hungarian capital, while in Bratislava and Warsaw the value of the indicator is only 12 years. In addition, home affordability is also significantly influenced by the financing costs prevailing in the individual countries. of the European capitals, the ratio of rent compared to property prices (price-to-rent) is the highest in Paris, where the value of a property of median price equals the rent for almost 40 years, i.e. here renting is relatively cheaper than purchasing a home. In contrast, in Lisbon and in Sofia this ratio stands at 16.4 only, which demonstrates that in these cities rents are outstandingly high compared to property prices. of the capitals of Visegrád countries, Prague stands out in terms of the relative affordability of property rental, where the value of a property of median price equals the rent for 28 years. In Budapest, the value of this ratio is almost identical to the European average, while in Bratislava and Warsaw it is below the average (Chart 36).
The excessive rise in house prices continues to pose a risk in several European countries. According to the calculations of the European Systemic Risk Board (ESRB), as a result of this persistent rise, house prices have already significantly exceeded the level justified by macroeconomic fundamentals in several European countries. of the 28 member states, the estimates show an overvalued price level in 15, while in the case of the remaining 13 member states it is undervalued compared to the fundamentals. This means that compared to the first quarter of 2018, the number of member states that show signs of overvaluation has increased by two (the Netherlands and Slovenia). In total, since the previous period the valuation level has increased in the case of 16 countries, but in 8 of these we cannot yet talk about overvaluation. In 2016 the ESRB issued a warning for eight countries, stating that the risks emerging in the housing markets could have consequences on financial stability in the medium term. In most of these latter countries it has been observed that house prices are significantly overvalued, in addition, the risks have not attenuated since the end of 2016 (Chart 37).
Chart 36Price-to-income and price-to-rent ratios in European capitals
0 5 10 15 20 25 30 35 40
0 5
10 15 20 25 30 35 40
Paris
Stoc
khol
mLj
ublja
naLo
ndon
Prag
ueBe
rlin
Vien
naHe
lsink
iZa
greb
Athe
nsLu
xem
bour
gBu
dape
stVi
lniu
sTa
llinn
Cope
nhag
enBr
atisla
vaAm
ster
dam
Rom
eW
arsa
wM
adrid
Buch
ares
tRi
gaBr
usse
lsLi
sbon
Sofia
Year Year
Price-to-rent ratio Price-to-income ratioAverage price-to-rent Average price-to-income
Note: The price-to-income ratio is the ratio between median real property prices and annual income of households with median disposable income, while the price-to-rent ratio is the ratio between average real property prices on the outskirts and the annual fee payable for the rental right of these properties. Capitals of Visegrád countries are shown with a different pattern.Source: Numbeo.com.
Chart 37Deviation of house prices from the estimated level justified by the fundamentals in European comparison
–40 –30 –20 –10 0 10 20 30 40 50 60 70
–40 –30 –20 –10
0 10 20 30 40 50 60 70
SE
LU
AT
BE*
GB
CZ
FR
DK* DE
EM
U 1
9 PT
NL SI
LV
ES
SK
FI
HR*
HU
BG
MT IE
EE
CY
* IT
PL
GR
LT
RO
Per cent Per cent
Average estimation (2018 Q1)Uncertainty of all estimations (2018 Q3)
Average estimation (2016 Q3)
Note: In the case of countries marked with *, based on 2018 Q1 or Q2 data. Hungary based on ESRB estimate. Countries in red were warned by the ESRB in 2016.Source: ESRB Risk Dashboard.
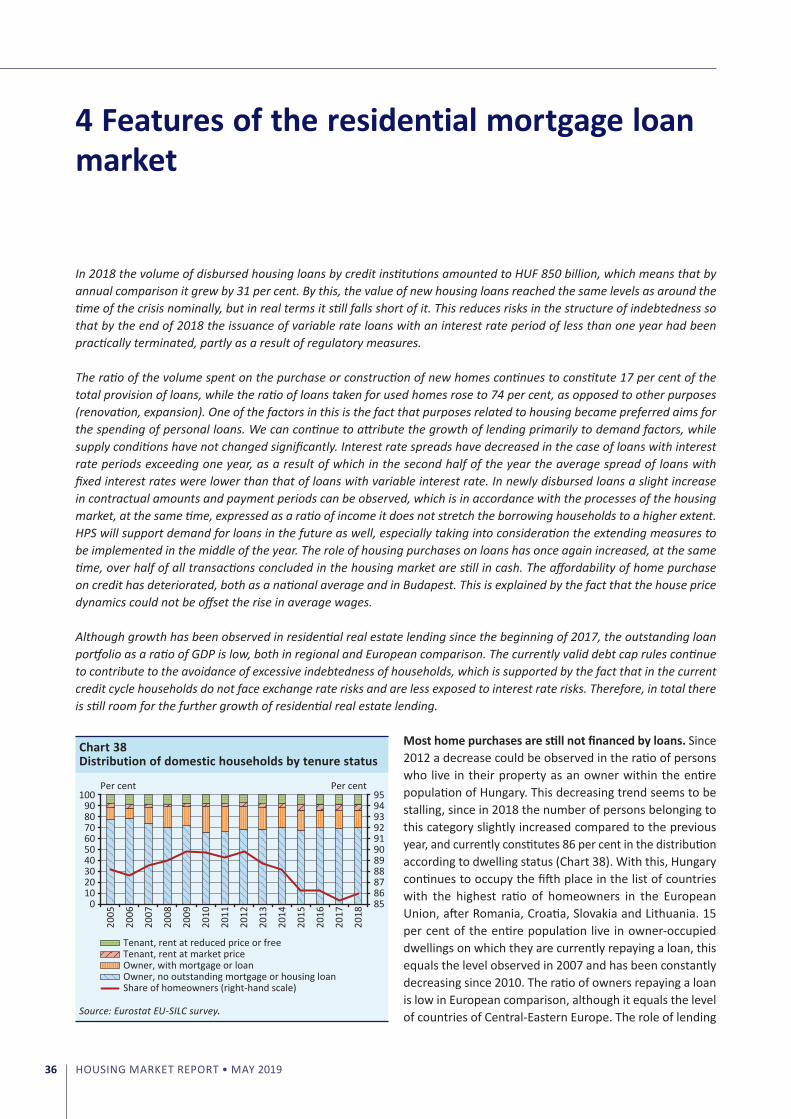
HOUSING MARKET REPORT • MAY 201936
4 Features of the residential mortgage loan market
In 2018 the volume of disbursed housing loans by credit institutions amounted to HUF 850 billion, which means that by annual comparison it grew by 31 per cent. By this, the value of new housing loans reached the same levels as around the time of the crisis nominally, but in real terms it still falls short of it. This reduces risks in the structure of indebtedness so that by the end of 2018 the issuance of variable rate loans with an interest rate period of less than one year had been practically terminated, partly as a result of regulatory measures.
The ratio of the volume spent on the purchase or construction of new homes continues to constitute 17 per cent of the total provision of loans, while the ratio of loans taken for used homes rose to 74 per cent, as opposed to other purposes (renovation, expansion). One of the factors in this is the fact that purposes related to housing became preferred aims for the spending of personal loans. We can continue to attribute the growth of lending primarily to demand factors, while supply conditions have not changed significantly. Interest rate spreads have decreased in the case of loans with interest rate periods exceeding one year, as a result of which in the second half of the year the average spread of loans with fixed interest rates were lower than that of loans with variable interest rate. In newly disbursed loans a slight increase in contractual amounts and payment periods can be observed, which is in accordance with the processes of the housing market, at the same time, expressed as a ratio of income it does not stretch the borrowing households to a higher extent. HPS will support demand for loans in the future as well, especially taking into consideration the extending measures to be implemented in the middle of the year. The role of housing purchases on loans has once again increased, at the same time, over half of all transactions concluded in the housing market are still in cash. The affordability of home purchase on credit has deteriorated, both as a national average and in Budapest. This is explained by the fact that the house price dynamics could not be offset the rise in average wages.
Although growth has been observed in residential real estate lending since the beginning of 2017, the outstanding loan portfolio as a ratio of GDP is low, both in regional and European comparison. The currently valid debt cap rules continue to contribute to the avoidance of excessive indebtedness of households, which is supported by the fact that in the current credit cycle households do not face exchange rate risks and are less exposed to interest rate risks. Therefore, in total there is still room for the further growth of residential real estate lending.
Most home purchases are still not financed by loans. Since 2012 a decrease could be observed in the ratio of persons who live in their property as an owner within the entire population of Hungary. This decreasing trend seems to be stalling, since in 2018 the number of persons belonging to this category slightly increased compared to the previous year, and currently constitutes 86 per cent in the distribution according to dwelling status (Chart 38). With this, Hungary continues to occupy the fifth place in the list of countries with the highest ratio of homeowners in the European Union, after Romania, Croatia, Slovakia and Lithuania. 15 per cent of the entire population live in owner-occupied dwellings on which they are currently repaying a loan, this equals the level observed in 2007 and has been constantly decreasing since 2010. The ratio of owners repaying a loan is low in European comparison, although it equals the level of countries of Central-Eastern Europe. The role of lending
Chart 38Distribution of domestic households by tenure status
85 86 87 88 89 90 91 92 93 94 95
0 10 20 30 40 50 60 70 80 90
100
2005
2006
2007
2008
2009
2010
2011
2012
2013
2014
2015
2016
2017
2018
Per cent Per cent
Owner, no outstanding mortgage or housing loanOwner, with mortgage or loanTenant, rent at market priceTenant, rent at reduced price or free
Share of homeowners (right-hand scale)
Source: Eurostat EU-SILC survey.
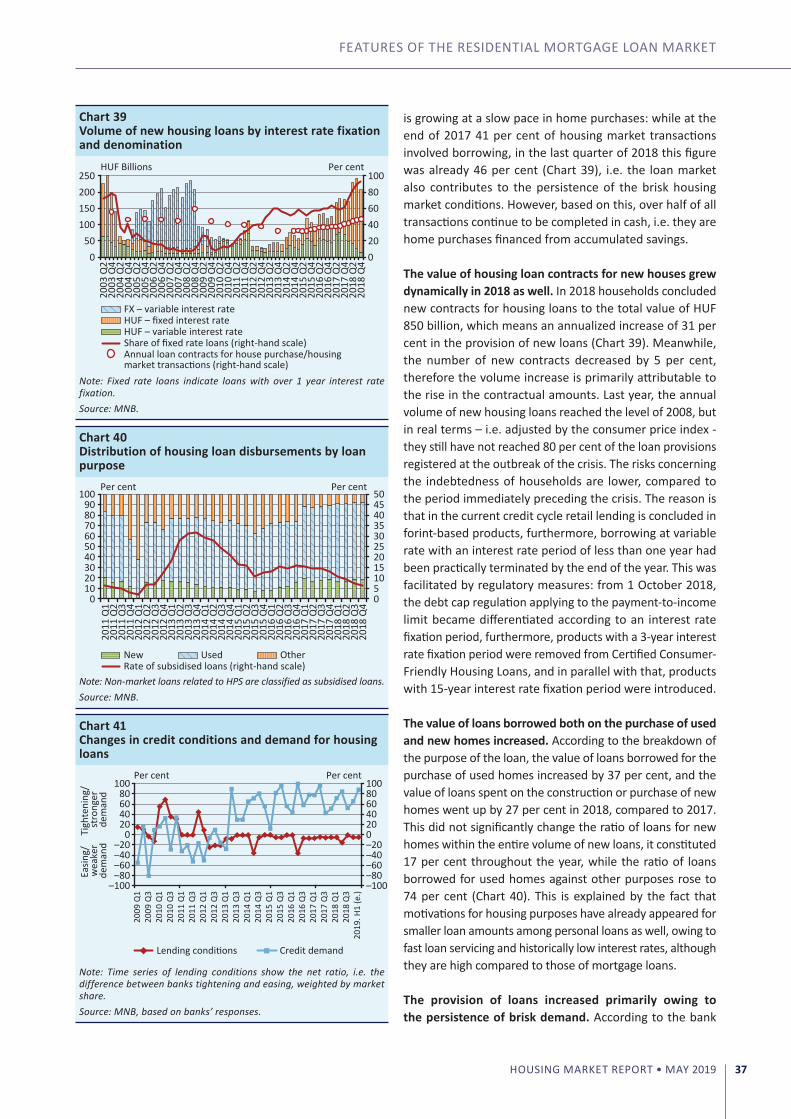
FEATURES oF THE RESIDENTIAL MoRTGAGE LoAN MARKET
HOUSING MARKET REPORT • MAY 2019 37
is growing at a slow pace in home purchases: while at the end of 2017 41 per cent of housing market transactions involved borrowing, in the last quarter of 2018 this figure was already 46 per cent (Chart 39), i.e. the loan market also contributes to the persistence of the brisk housing market conditions. However, based on this, over half of all transactions continue to be completed in cash, i.e. they are home purchases financed from accumulated savings.
The value of housing loan contracts for new houses grew dynamically in 2018 as well. In 2018 households concluded new contracts for housing loans to the total value of HUF 850 billion, which means an annualized increase of 31 per cent in the provision of new loans (Chart 39). Meanwhile, the number of new contracts decreased by 5 per cent, therefore the volume increase is primarily attributable to the rise in the contractual amounts. Last year, the annual volume of new housing loans reached the level of 2008, but in real terms – i.e. adjusted by the consumer price index - they still have not reached 80 per cent of the loan provisions registered at the outbreak of the crisis. The risks concerning the indebtedness of households are lower, compared to the period immediately preceding the crisis. The reason is that in the current credit cycle retail lending is concluded in forint-based products, furthermore, borrowing at variable rate with an interest rate period of less than one year had been practically terminated by the end of the year. This was facilitated by regulatory measures: from 1 october 2018, the debt cap regulation applying to the payment-to-income limit became differentiated according to an interest rate fixation period, furthermore, products with a 3-year interest rate fixation period were removed from Certified Consumer-Friendly Housing Loans, and in parallel with that, products with 15-year interest rate fixation period were introduced.
The value of loans borrowed both on the purchase of used and new homes increased. According to the breakdown of the purpose of the loan, the value of loans borrowed for the purchase of used homes increased by 37 per cent, and the value of loans spent on the construction or purchase of new homes went up by 27 per cent in 2018, compared to 2017. This did not significantly change the ratio of loans for new homes within the entire volume of new loans, it constituted 17 per cent throughout the year, while the ratio of loans borrowed for used homes against other purposes rose to 74 per cent (Chart 40). This is explained by the fact that motivations for housing purposes have already appeared for smaller loan amounts among personal loans as well, owing to fast loan servicing and historically low interest rates, although they are high compared to those of mortgage loans.
The provision of loans increased primarily owing to the persistence of brisk demand. According to the bank
Chart 39Volume of new housing loans by interest rate fixation and denomination
0 20 40 60 80 100
0 50
100 150 200 250
2003
Q2
2003
Q4
2004
Q2
2004
Q4
2005
Q2
2005
Q4
2006
Q2
2006
Q4
2007
Q2
2007
Q4
2008
Q2
2008
Q4
2009
Q2
2009
Q4
2010
Q2
2010
Q4
2011
Q2
2011
Q4
2012
Q2
2012
Q4
2013
Q2
2013
Q4
2014
Q2
2014
Q4
2015
Q2
2015
Q4
2016
Q2
2016
Q4
2017
Q2
2017
Q4
2018
Q2
2018
Q4
Per centHUF Billions
FX – variable interest rateHUF – fixed interest rateHUF – variable interest rateShare of fixed rate loans (right-hand scale)Annual loan contracts for house purchase/housing market transactions (right-hand scale)
Note: Fixed rate loans indicate loans with over 1 year interest rate fixation. Source: MNB.
Chart 40Distribution of housing loan disbursements by loan purpose
0 5 10 15 20 25 30 35 40 45 50
0 10 20 30 40 50 60 70 80 90
100
2011
Q1
2011
Q2
2011
Q3
2011
Q4
2012
Q1
2012
Q2
2012
Q3
2012
Q4
2013
Q1
2013
Q2
2013
Q3
2013
Q4
2014
Q1
2014
Q2
2014
Q3
2014
Q4
2015
Q1
2015
Q2
2015
Q3
2015
Q4
2016
Q1
2016
Q2
2016
Q3
2016
Q4
2017
Q1
2017
Q2
2017
Q3
2017
Q4
2018
Q1
2018
Q2
2018
Q3
2018
Q4
Per cent Per cent
New Used OtherRate of subsidised loans (right-hand scale)
Note: Non-market loans related to HPS are classified as subsidised loans. Source: MNB.
Chart 41Changes in credit conditions and demand for housing loans
–100 –80 –60 –40 –20 0 20 40 60 80 100
–100 –80 –60 –40 –20
0 20 40 60 80
100
2009
Q1
2009
Q3
2010
Q1
2010
Q3
2011
Q1
2011
Q3
2012
Q1
2012
Q3
2013
Q1
2013
Q3
2014
Q1
2014
Q3
2015
Q1
2015
Q3
2016
Q1
2016
Q3
2017
Q1
2017
Q3
2018
Q1
2018
Q3
2019
. H1
(e.)
Per cent Per cent
Lending conditions Credit demand
Tigh
teni
ng/
stro
nger
dem
and
Easin
g/
wea
ker
dem
and
Note: Time series of lending conditions show the net ratio, i.e. the difference between banks tightening and easing, weighted by market share. Source: MNB, based on banks’ responses.
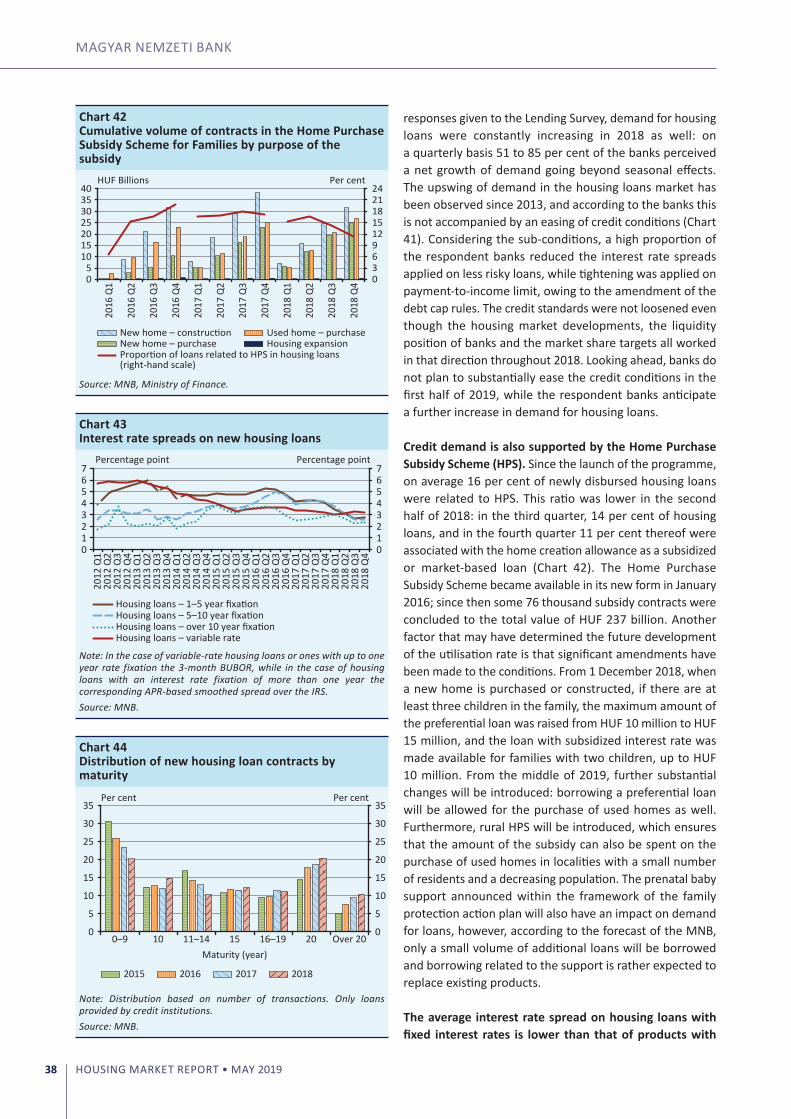
MAGYAR NEMZETI BANK
HOUSING MARKET REPORT • MAY 201938
responses given to the Lending Survey, demand for housing loans were constantly increasing in 2018 as well: on a quarterly basis 51 to 85 per cent of the banks perceived a net growth of demand going beyond seasonal effects. The upswing of demand in the housing loans market has been observed since 2013, and according to the banks this is not accompanied by an easing of credit conditions (Chart 41). Considering the sub-conditions, a high proportion of the respondent banks reduced the interest rate spreads applied on less risky loans, while tightening was applied on payment-to-income limit, owing to the amendment of the debt cap rules. The credit standards were not loosened even though the housing market developments, the liquidity position of banks and the market share targets all worked in that direction throughout 2018. Looking ahead, banks do not plan to substantially ease the credit conditions in the first half of 2019, while the respondent banks anticipate a further increase in demand for housing loans.
Credit demand is also supported by the Home Purchase Subsidy Scheme (HPS). Since the launch of the programme, on average 16 per cent of newly disbursed housing loans were related to HPS. This ratio was lower in the second half of 2018: in the third quarter, 14 per cent of housing loans, and in the fourth quarter 11 per cent thereof were associated with the home creation allowance as a subsidized or market-based loan (Chart 42). The Home Purchase Subsidy Scheme became available in its new form in January 2016; since then some 76 thousand subsidy contracts were concluded to the total value of HUF 237 billion. Another factor that may have determined the future development of the utilisation rate is that significant amendments have been made to the conditions. From 1 December 2018, when a new home is purchased or constructed, if there are at least three children in the family, the maximum amount of the preferential loan was raised from HUF 10 million to HUF 15 million, and the loan with subsidized interest rate was made available for families with two children, up to HUF 10 million. From the middle of 2019, further substantial changes will be introduced: borrowing a preferential loan will be allowed for the purchase of used homes as well. Furthermore, rural HPS will be introduced, which ensures that the amount of the subsidy can also be spent on the purchase of used homes in localities with a small number of residents and a decreasing population. The prenatal baby support announced within the framework of the family protection action plan will also have an impact on demand for loans, however, according to the forecast of the MNB, only a small volume of additional loans will be borrowed and borrowing related to the support is rather expected to replace existing products.
The average interest rate spread on housing loans with fixed interest rates is lower than that of products with
Chart 42Cumulative volume of contracts in the Home Purchase Subsidy Scheme for Families by purpose of the subsidy
0 3 6 9 12 15 18 21 24
0 5
10 15 20 25 30 35 40
2016
Q1
2016
Q2
2016
Q3
2016
Q4
2017
Q1
2017
Q2
2017
Q3
2017
Q4
2018
Q1
2018
Q2
2018
Q3
2018
Q4
Per centHUF Billions
New home – constructionNew home – purchase
Used home – purchaseHousing expansion
Proportion of loans related to HPS in housing loans(right-hand scale)
Source: MNB, Ministry of Finance.
Chart 43Interest rate spreads on new housing loans
0 1 2 3 4 5 6 7
0 1 2 3 4 5 6 7
2012
Q1
2012
Q2
2012
Q3
2012
Q4
2013
Q1
2013
Q2
2013
Q3
2013
Q4
2014
Q1
2014
Q2
2014
Q3
2014
Q4
2015
Q1
2015
Q2
2015
Q3
2015
Q4
2016
Q1
2016
Q2
2016
Q3
2016
Q4
2017
Q1
2017
Q2
2017
Q3
2017
Q4
2018
Q1
2018
Q2
2018
Q3
2018
Q4
Percentage point Percentage point
Housing loans – 1–5 year fixationHousing loans – 5–10 year fixation
Housing loans – variable rateHousing loans – over 10 year fixation
Note: In the case of variable-rate housing loans or ones with up to one year rate fixation the 3-month BUBOR, while in the case of housing loans with an interest rate fixation of more than one year the corresponding APR-based smoothed spread over the IRS. Source: MNB.
Chart 44Distribution of new housing loan contracts by maturity
0
5
10
15
20
25
30
35
0
5
10
15
20
25
30
35
0–9 10 11–14 15 16–19 20 Over 20
Per cent Per cent
Maturity (year)
2015 2016 2017 2018
Note: Distribution based on number of transactions. Only loans provided by credit institutions. Source: MNB.

FEATURES oF THE RESIDENTIAL MoRTGAGE LoAN MARKET
HOUSING MARKET REPORT • MAY 2019 39
variable interest rates. In 2018, the average APR of newly borrowed housing loans with variable interest rates, for interest rate periods not longer than 5 years and those not longer than 10 years somewhat increased, while the credit costs of loans with an interest rate fixation of 5 to 10 years decreased. At the same time, the average interest rate spread has not changed for loans with variable interest rates, and in the case of loans with fixed interest rates, it decreased by 0.5–1.5 percentage points compared to the end of 2017 (Chart 43). Taking this into account, the spread on loans with fixed interest rates was lower than the spread of loans with variable rate with an interest rate period of less than one year. Last year a significant rearrangement took place in the distribution of new loans according to interest rate fixation: while in the last quarter of 2017 almost 40 per cent of the total provision carried variable rate with an interest rate period of less than one year, in the fourth quarter of 2018 it was only 7 per cent. By the end of the year, the ratio of products less exposed to interest rate risk and with an interest period of at least 5 years had risen to 60 per cent of the entire volume of housing loans disbursed.
The maturity and contractual amount of new housing loans slightly increased. The maturity of disbursed housing loans has been increasing since 2015: since 2015 the share of loans with a maturity of less than 10 years has decreased from 30 per cent to 20 per cent, mainly in parallel with an increase in maturities of 20 years or longer (Chart 44). This can be explained partly by the composition effect, since the share of housing loans for renovation and extension, typically borrowed for a shorter-term, has decreased. Broken down into the purpose of the loan, the average maturity of loans borrowed for the construction of new homes has become longer by almost one and a half years compared to the end of 2017, in the case of loans borrowed for the purchase of new or used homes a decrease was registered, to 18.5 and 16.5 years, respectively. In the new credit cycle a shift can be observed in the distribution of the contract amounts as well: the share of loans under HUF 5 million decreased from 50 per cent to 30 per cent in 4 years, while loans above HUF 15 million have made a pronounced appearance (Chart 45).
The increased loan amounts are offset by longer maturities and the improving income situation. Given the higher contract amounts, no substantial shift has been observed in the distribution of the payment-to-income ratio (Chart 46). This can be explained, on the one hand, by the increase in the contractual maturity mentioned above, and on the other hand, the improving income situation may also contribute to households not having to stretch themselves financially in order to afford to pay the monthly instalment, even taking into account the rising house prices.
Chart 45Distribution of new housing loan contracts by contract size
0
10
20
30
40
50
60
0
10
20
30
40
50
60
0–4 5–9 10–14 15–19 20 andabove
Per cent Per cent
Contract size (HUF M)
2015 2016 2017 2018
Note: Distribution based on number of transactions. Only loans provided by credit institutions. Source: MNB.
Chart 46Distribution of new housing loan contracts by PTI ratio
0 2 4 6 8 10 12 14 16 18
0 2 4 6 8
10 12 14 16 18
0–5
5–10
10–1
5
15–2
0
20–2
5
25–3
0
30–3
5
35–4
0
40–4
5
45–5
0
50–5
5
55–6
0
Per cent Per cent
Payment-to-income ratio (%)2015 2016 2017 2018
Note: Distribution based on number of transactions. Only loans provided by credit institutions. Source: MNB.
Chart 47Housing Affordability Index, HAI
–15 –12 –9 –6 –3 0 3 6 9 12 15 18
0.5 0.6 0.7 0.8 0.9 1.0 1.1 1.2 1.3 1.4 1.5 1.6
2002
Q2
2002
Q4
2003
Q2
2003
Q4
2004
Q2
2004
Q4
2005
Q2
2005
Q4
2006
Q2
2006
Q4
2007
Q2
2007
Q4
2008
Q2
2008
Q4
2009
Q2
2009
Q4
2010
Q2
2010
Q4
2011
Q2
2011
Q4
2012
Q2
2012
Q4
2013
Q2
2013
Q4
2014
Q2
2014
Q4
2015
Q2
2015
Q4
2016
Q2
2016
Q4
2017
Q2
2017
Q4
2018
Q2
2018
Q4
Per cent
Effect of interest rate (right-hand scale)
Effect of average wages (right-hand scale)Effect of house prices (right-hand scale)
Housing Affordability Index (HAI)ConstraintHAI (Budapest)
Favourable effectof base rate cut
Unfavourable effectof house price increase
Note: HAI shows how many times the income of a household with two average wages covers the income necessary for the purchase of an average (65 m2) home on a loan. Parameters of the loan product, except for the interest rate, are constant until maturity. LTV = 70%, PTI = 30%, maturity = 15 years. Source: MNB.

MAGYAR NEMZETI BANK
HOUSING MARKET REPORT • MAY 201940
The affordability of purchasing homes on credit has deteriorated significantly, both nationally and in Budapest. The credit-financed purchase of an average property by a double income household with average income became less affordable in 2018 (Chart 47). This is due to the fact that the increase in average wages could not offset the impact of the increase in property prices. The increase in average interest rates primarily resulted from the composition effect, since during the year the ratio of loan products with fixed interest rate and higher credit costs rose substantially. In the property market of Budapest, the possibility of credit financing has deteriorated, and in terms of its level it has developed much more adversely than the national average. This was due to the fact that the growth rate in house prices in the capital exceeded the national average and relative to that, wages increased more slowly.
There is still significant room for expanding residential real estate lending. Although the portfolio of housing loans has been growing since the beginning of 2017 as a result of loan transactions, the loan portfolio as a percentage of GDP only started increasing in the second half of 2018, and at the end of the year it stood at 8 per cent (Chart 48). This is a significant shortfall both in regional and European comparison, since in the Visegrád countries the value of the loan/GDP indicator is 20 per cent on average, and in the EU it is 41 per cent. Therefore, in total there is still considerable room in the domestic economy for the household sector to raise the housing loan portfolio.
Chart 48Housing credit-to-GDP in European comparison
0 20 40 60 80 100
0 20 40 60 80
100
Denm
ark
Swed
enN
ethe
rland
sU
nite
d Ki
ngdo
mLu
xem
bour
gPo
rtug
alFr
ance
Spai
nCy
prus
Finl
and
Mal
taGe
rman
yBe
lgiu
mSl
ovak
iaGr
eece
Esto
nia
Aust
riaIre
land
Czec
h Re
publ
icIta
lyPo
land
Lith
uani
aCroa
tiaLa
tvia
Slov
enia
Bulg
aria
Hung
ary
Rom
ania
Per cent Per cent
Housing credit-to-GDP 2018 Q4EU average V4 average
Source: ECB.

42
Count István Széchenyi(21 September 1791 – 8 April 1860)
Politician, writer, economist, minister for transport in the Batthyány government whom Lajos Kossuth referred to as ‘the greatest Hungarian’. His father, Count Ferenc Széchényi established the Hungarian National Museum and Library; his mother, Julianna Festetich was the daughter of Count György Festetich, the founder of Georgikon, an institution for the teaching of agricultural sciences.
With his ideas – whose message remains relevant even today – and his activities both as a writer and a politician, István Széchenyi laid the foundation for modern Hungary. He is one of the most eminent and significant figures in Hungarian politics whose name is associated with reforms in the Hungarian economy, transportation and sports. He is also known as the founder and eponym of numerous public benefit institutions, a traveller all across Europe and an explorer of England as well as the champion of economic and political development at the time. István Széchenyi recognised that Hungary needed reforms in order to rise, and considered paving the way for a Hungary set on the path of industrialisation and embourgeoisement to be his calling in life.
Published in 1830, his Credit outlined the embourgeoisement of Hungary and summarised its economic and social programme. Count Széchenyi intended this writing to make the nobility aware of the importance of the country’s desperate need for a social and economic transformation. Another work of his, Stádium [Stage of Development] (1833) listed the cornerstones of his reform programme in 12 points, including the voluntary and compulsory liberation of serfs; the abrogation of avicitas (inalienable status of noble property); the right of possession for the peasantry; and the freedom of industry and commerce. This work of Széchenyi already conveyed the idea of equality before the law and the general and proportionate sharing of taxation.
After the revolution in 1848 István Széchenyi joined the Batthyány government and as minister embarked vigorously on implementing his transportation programme.

HOUSING MARKET REPORT
May 2019
Print: Pauker–Prospektus–SPL consortium
H-8200 Veszprém, Tartu u. 6.

mnb.hu©MAGYAR NEMZETI BANK
H-1054 BUDAPEST, SZABADSÁG SQUARE 9.


