31
PDB LIKE A PRO PHILIP BAUER @StarzelDe pbauer
| Date post: | 16-Apr-2017 |
| Category: |
Software |
| Upload: | philip-bauer |
| View: | 127 times |
| Download: | 1 times |

PDB LIKE A PROPHILIP BAUER
@StarzelDe
pbauer


THE BASICS

PHILIP BAUER: PDB LIKE A PRO PYCON.DE 2016
The Basics
▸ l[ist]List source code for the current file
▸ n[ext]Continue execution until the next line
▸ s[tep] Execute the current line, stop at the first possible occasion
▸ r[eturn] Continue execution until the current function returns
▸ c[ontinue] Continue execution, only stop when a breakpoint is encountered

PHILIP BAUER: PDB LIKE A PRO PYCON.DE 2016
The Basics II
▸ w[here] Show stack trace. Recent frame at bottom
▸ u[p] Move to older frame in stack trace
▸ d[own] Move to newer frame in stack trace
▸ b[reakpoint] Set a new breakpoint. tbreak Temporary breakpoint
▸ a[rgs]Print the argument list of the current function.

PIMP MY PDB

PIMP MY PDB
Some Enhancements
▸ pdb++
▸ ipdb
▸ bpdb
▸ pudb
▸ and…

PIMP MY PDB
pdb in python 3.2+
▸ ll | longlist List all source code for the current function or frame.
▸ sourceTry to get source code for the given object and display it.
▸ …

PIMP MY PDB
ipdb
▸ + features
▸ - dependencies
▸ - weird sqllite
▸ - need to use ``import ipdb; ipdb.set_trace()``

PIMP MY PDB
pudb
▸ + features
▸ +/- UI
▸ - need to use import pudb; pudb.set_trace()

TEXT

PIMP MY PDB
▸ it’s actually called pdbpp
▸ + features
▸ + no problematic dependencies
▸ + drop-in-replacement
▸ - needs configuration to not break readline
pdb++

DEMO PDB++

PIMP MY PDB
pdb++
▸ you’ll need a file ~/.fancycompleterrc.py

pdb++
▸ Syntax highlighting
▸ ll | longlistList all source code for the current function or frame.
▸ track EXPRESSION
▸ display EXPRESSION
▸ source EXPRESSION
▸ obj?
▸ obj.__class__??
▸ Sticky mode
PIMP MY PDB

Give pdb++ a try!
The person you trust
PIMP MY PDB

INTROSPECTION

INTROSPECTION
python stuff you should know
▸ dir(obj) - bäh!
▸ help(obj)
▸ help(obj.__class__)
▸ pp locals()
▸ obj.__dict__
▸ obj.__class__.__dict__
▸ pp dict(obj.__class__.__dict__)

INTROSPECTION
the inspect module
▸ It’s what is used by other nice tools
▸ import inspect
▸ print inspect.getsource(obj.__class__)
▸ inspect.getmro(obj.__class__)

ADVANCED TIPS

▸ break if some condition applies
▸ very useful in loops
▸ you need it in try/except blocks (e.g. indexing)
TIPS AND TRICKS
Conditional Breakpoints
TIPS AND TRICKS
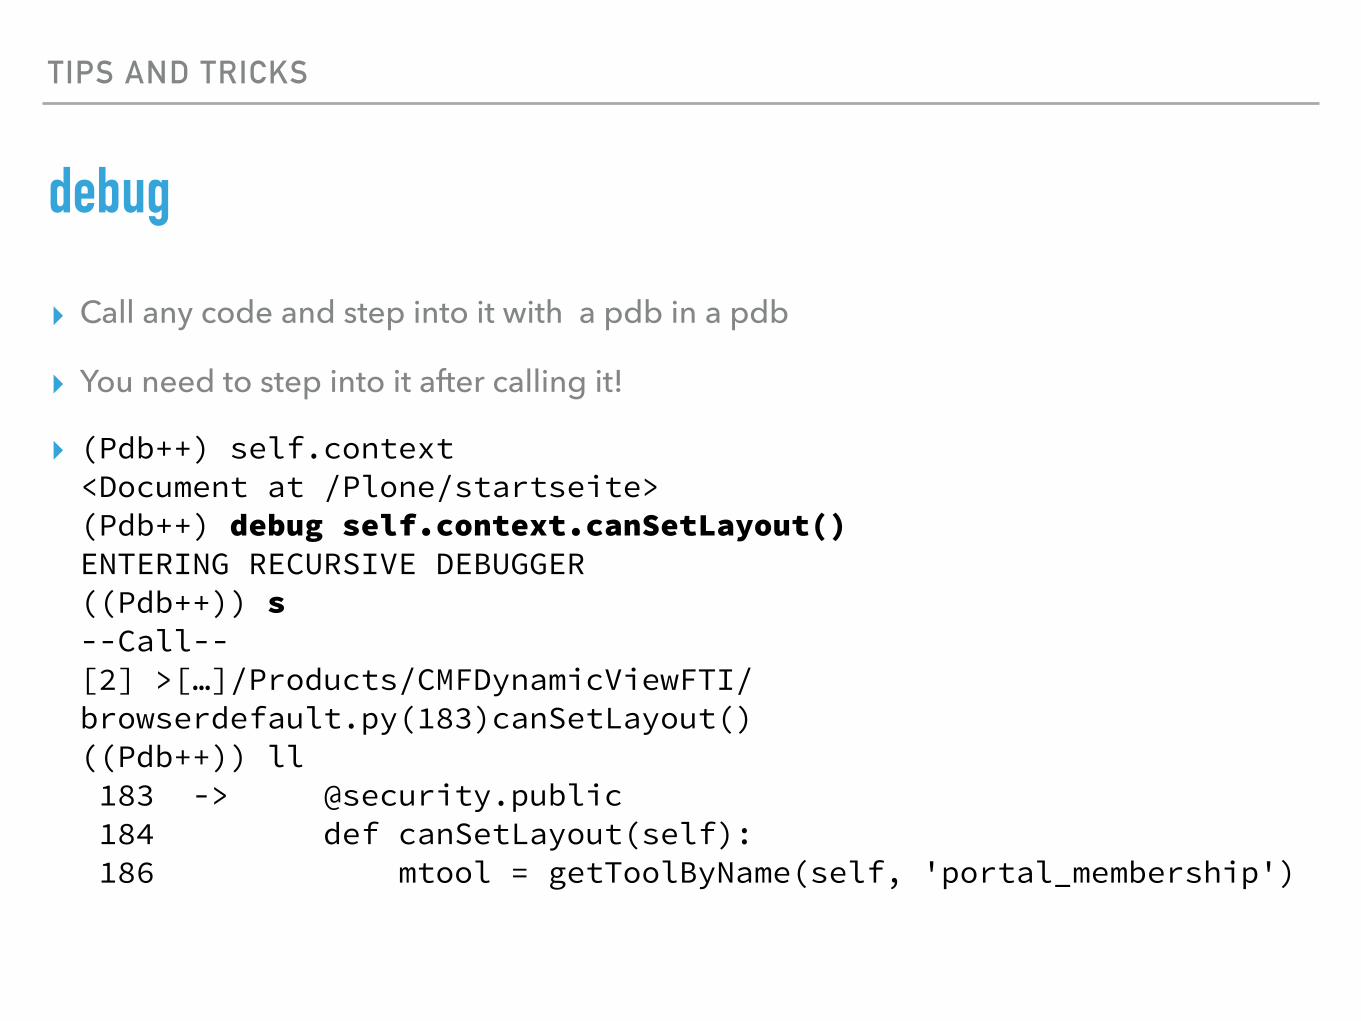
debug
▸ Call any code and step into it with a pdb in a pdb
▸ You need to step into it after calling it!
▸ (Pdb++) self.context<Document at /Plone/startseite> (Pdb++) debug self.context.canSetLayout() ENTERING RECURSIVE DEBUGGER ((Pdb++)) s--Call--[2] >[…]/Products/CMFDynamicViewFTI/browserdefault.py(183)canSetLayout() ((Pdb++)) ll 183 -> @security.public 184 def canSetLayout(self): 186 mtool = getToolByName(self, 'portal_membership')

DEMO DEBUG

▸ Whenever there is a traceback you end up in a pdb!
▸ try: run_your_stuff() except: import pdb; pdb.set_trace()
▸ Plone: Products.PDBDebugMode
▸ Disable when migrating/reindexing
TIPS AND TRICKS
Post-Mortem Debugging

▸ Drops you in a pdb whenever a test fails or errors
▸ Zope/Plone: bin/test -D pytest & nosetest: pytest / nosetest --pdb unittest: need to wrap in try/except
▸ Test-Driven Debug-Driven Development
TIPS AND TRICKS
Post-Mortem Testing


▸ add a config-file ~/.pdbrc
▸ alias inspect import inspect; print inspect.getsource(%1)
▸ alias help !print help(%1)
TIPS AND TRICKS
Customize your pdb

TEXT
Sentry
▸ Collect tracebacks from production-environments
▸ The traceback includes all arguments for all stacks
▸ OpenSource / Django
▸ github.com/getsentry/sentry
▸ Available as a service: sentry.io
▸ starzel.de is working on a DebOps/Ansible role for Sentry

SUMMARY

SUMMARY
What to take away
▸ learn the basics
▸ try pdb++
▸ learn introspection
▸ try debug callable()
▸ use post-mortem-debugging
▸ always use pretty-print
▸ use Sentry to debug errors on production

QUESTIONS
Philip Bauer
@StarzelDe
pbauer
All Fotos by Philip Bauer. Taken in Boothbay, Maine October 2016


