Page 1
55
GeoScience Engineering Volume LV (2009), No.1
http://gse.vsb.cz p. 55-68, ISSN 1802-5420
STUDY OF COMPATIBILITY OF METHODS FOR LIQUID LIMIT MEASUREMENT ACCORDING TO CZECH STATE STANDARD
AND NEWLY ADOPTED EUROPEAN STANDARD
STUDIE KOMPATIBILITY METOD PRO MĚŘENÍ VLHKOSTI NA MEZI TEKUTOSTI DLE ČSN A NOVĚ PŘIJÍMANÉ EVROPSKÉ
NORMY
Lucie FOJTOVÁ 1, Marian MARSCHALKO
2, Radka FRANEKOVÁ
3, Luděk KOVÁŘ
4
1
Ing, Institute of geological engineering, Faculty of Mining and Geology,
VSB-Technical University Ostrava
tř. 17. listopadu, Ostrava - Poruba, tel. (+420) 59 732 3505
e-mail: [email protected]
2
doc. Ing. Ph.D., Institute of geological engineering, Faculty of Mining and Geology,
VSB-Technical University Ostrava
tř. 17. listopadu, Ostrava - Poruba, tel. (+420) 59 732 3505
[email protected]
3
Bc., Institute of geological engineering, Faculty of Mining and Geology,
VSB-Technical University Ostrava
tř. 17. listopadu, Ostrava - Poruba, tel. (+420) 59 732 3505
radka.franeková[email protected]
4
Ing., Ph.D.,
K-Geo, Mastná, Ostrava, tel. (+420)59 611 7633,
e-mail: [email protected]
Abstract
The goal of the publication is a correlation between the methodology of liquid limit determination using
Casagrande bowls according to the Czech state standard being valid as yet and the methodology on a principle of
the conical test according to a newly adopted European standard. It allows a better link of utilization of an
extensive statistical set of investigations realized for purposes of foundation engineering in past that are available
in Geofond for newly conducted engineering geological studies according to the new European standard related
to water contents at the liquid limit for wide-spread clay soils. The sample values ranged from 21.49 to 49.56 %
according to Casagrande and in the conical test they ranged from 24.11 to 51.07 %. The difference of the results
for identical samples reached values from 1.15 to 4.19 %. The studied mean difference coefficient between
methods amounts to 2.55 %.
Abstrakt
Cílem publikace je studium korelace mezi metodikou stanovení vlhkosti na mezi tekutosti pomocí
Casagrandeho misek dosud platné české státní normy a metodikou založenou na principu kuželové zkoušky dle
nově implementované evropské normy. To umožní lepší návaznost využití rozsáhlého statistického souboru
průzkumů realizovaných pro účely zakládání staveb v minulosti, které jsou k dispozici v Geofondu, na nově
prováděné inženýrskogeologické průzkumy dle nové evropské normy v souvislosti s vlhkostí na mezi tekutosti
pro velmi rozšířené jílovité zeminy. Rozpětí hodnot u zjištěných vzorků se pohybovalo od 21,49 do 49,56 % dle
Casagrandeho a u kuželové zkoušky se pohybovalo v hodnotách od 24,11 do 51,07 %. Rozdíl výsledků u
identických vzorků dosahoval hodnot od 1,15 do 4,19 %. Studovaný průměrný rozdílový koeficient mezi
metodami má hodnotu 2,55 %.
Key words: liquid limit measurement, compatibility of standards, engineering geology, Ostrava Basin
Page 2
56
GeoScience Engineering Volume LV (2009), No.1
http://gse.vsb.cz p. 55-68, ISSN 1802-5420
1 INTRODUCTION
The goal of the study is to analyze a correlation between the methodology of the liquid limit measurement
using Casagrande bowls according to CSN and the methodology on the principle of the conical test according to
the European standard. It would allow a better compatibility and link of utilization of an extensive statistical set
of investigations realized for purposes of foundation engineering related to the liquid limit.
In the first stage a comparative study has been carried out of both above mentioned methodologies, which
represent a theoretical basis for subsequently realized laboratory works.
Within Ostrava Basin after specifying localities a sampling of fine grained soils was performed. The
subsequent study in laboratories of the firm K - GEO was focused on laboratory tests of the taken samples by the
methods of Casagrande bowls and conical test.
In the last stage a comparative analysis was realized to determine a correlative dependence which is an
important aid for engineering geological practice.
2 ESSENTIAL TERMINOLOGY AND STANDARDS SUBJECT
The following technical specifications describe the test methods for determination of consistency limits of
soil. Cohesive soils are mixtures of clay, dust and sandy grains. In nature they can contain bound and free water.
The quantity of bound water increases in soil with a portion and type of a clay mineral and exchangeable cations.
Moisture-dependant physical condition of cohesive soil is a so-called consistency condition. Consistency limits
are liquid limit, plastic limit and shrinkage limit. These limits are called as “consistency or Atterberg limits”
(according to a Norwegian specialist Atterberg who first used them for characterizing soils.
Liquid limit is understood to be soil moisture expressed in % of mass of dried soil (i.e. soil dried at the
temperature from 100 to 110°C) to a constant mass, when the soil changes from plastic to liquid state. A test
sample can be acquired from natural soil or from soil from which a material caught during grading on a sieve of
a mesh size of 0.4 mm (or the nearest), was removed. Within the standard cones are used with shapes of 60
g / 60° and 80 g / 30°.
Liquid limit wL is an empirically determined water content for which the soil changes from a liquid to
plastic state.
Plastic limit is the lowest water content of soil whereat the soil is plastic. The determination of the plastic
limit is usually performed simultaneously with the determination of the liquid limit.
Plastic limit wP is an empirically determined water content whereat the soil is so much dried it loses its
plasticity.
Plasticity index IP is an arithmetic difference between the liquid limit and the plastic limit of soil.
Liquidity index IL is a difference of natural water content and the plastic limit in proportion to the
plasticity index of soil..
Consistency index IL is a difference of the liquid limit and natural water content of soil in proportion to its
plasticity index.
Activity index IA is a ratio of the plasticity index to the portion of the clay size fraction of soil.
Clay size fraction CF is a dry weight of grains with equivalent diameter equal to or less than 0.002 mm,
divided by the total dry weight of a test sample (or by dry weight of a test sample after removing the coarse
fraction).
Coarse fraction is particles of soil that are held on a sieve of mesh size of 4 mm.
The liquid limit wL is determined through the use of Casagrande device or Vasiljev cone. Through the
first method we determine the liquid limit when a sample of soil with a horizontal and smooth surface placed in
the bowl of the device and divided by a grooving tool into two parts which need 25 hits of the bowl to the base to
close the gap between them in a length of 12.5+-0.5 mm namely at a rate of 2 hits per second. A detailed
procedure is imposed by the Czech state standard ČSN 72 1014 – Laboratory determination of liquid limit of
soils. While using the cone such water content matches to the liquid limit whereat the smooth metal cone with a
apex angle of 30° and weight of 80 g placed on a smooth surface of a sample sinks into a depth of 20 mm during
five seconds by self-weight. The procedure is given in the new European standard ČSN CEN ISO/TS 17892/12:
Geotechnical investigation and testing – Laboratory testing of soils – Part 12: Determination of consistency
limits.
Page 3
57
GeoScience Engineering Volume LV (2009), No.1
http://gse.vsb.cz p. 55-68, ISSN 1802-5420
3 THEORY TO STANDARDS
3.1 Resumé of standards
3.1.1 ČSN 72 1014 Laboratory determination of liquid limit of soils
This technical specification describes in total three methods of determination of consistency limits,
namely determination the liquid limit using a bowl in a standard way, determination of the liquid limit using a
bowl by a one-point method and determination of the liquid limit using a cone (Vasiljev). Whereas the subject of
the study according to an older standard was only to determinate the liquid limit through the use of a bowl by the
one-point method which was used in past most, the method is specified in this section.
The soil in a preparatory stage gets dried in the open air, and then it is disintegrated by a rubber spatula
and passed through a sieve of 0.5 mm. A portion of the soil which falls through the sieve from the total quantity
of the entire sample is recorded.
To perform the test correctly it is necessary to set the device accurately and prepare carefully the sample.
Minimum weight of a soil for the one-point method is 50 g. Pugging should last at least 10 minutes. The
water content of soil has to be such the cake of soil closes the gap after 25 hits of the bowl.
The soil will be then set to an airtight weighing bottle and aged at least for 24 hours under a usual room
temperature. Immediately prior to test the soil is pugged for at least one minute.
From the pugged paste a part of soil is removed and put to the bowl on the place where the bowl bears
against a bearing plate. The soil surface in the bowl has to be smoothed with a knife to a plane parallel with the
bearing plate. The soil cake in the bowl should have in the highest point a maximum thickness of 1 cm. With a
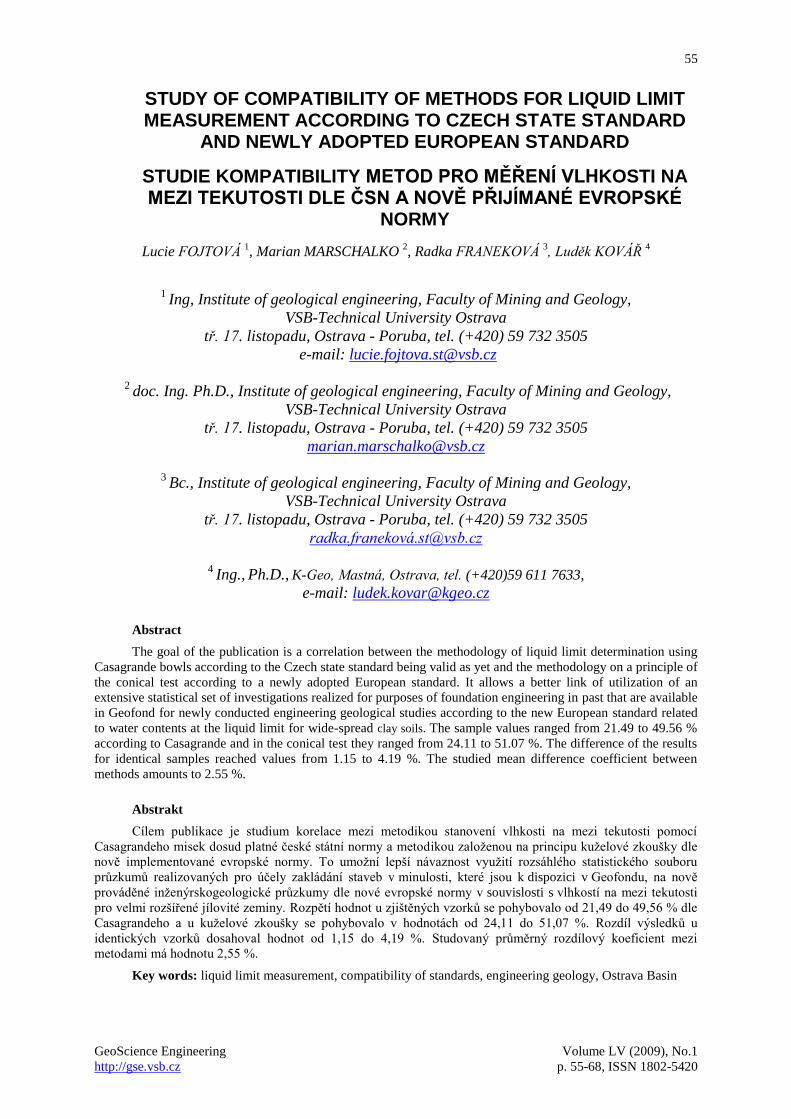
cutting knife (Fig. 1a) a groove is cut (squeezed) in the soil cake, whose axis goes through the centre of the bowl
suspension (Fig. 1b). Then the device is turned on and the bowl with the cut soil cake is allowed to fall from the
height of 1 cm on the bearing plate. The process needs to be interrupted in the instant when both cake halves join
at the bottom of the groove to the required length of 12.5 mm (+-0.5 mm). The number of hits that were
necessary both halves of soil cake to join is recorded. This number of hits N may not be higher than 30 and lower
than 20, otherwise the test has to be repeated.
From both cake halves a soil sample is taken somewhere from the centre in the amount of about 10 g and
placed to the air-sealed weighing bottle. For the sample water content will be determined according to the ČSN
72 1012 standard (Laboratory determination of soil water content).
During assessment the water content is assessed from the taken sample according to the ČSN 72 1012
standard matching to the appropriate number of hits of the bowl N. The liquid limit wL is then determined
according to the formula as follows:
12,0
25
Nww NL
where wN is the water content related to the soil that joined after N hits,
0.12 is a tangent of the function line “water content - number of hits”.
Moisture values at the liquid limit are set forth in integer percentage of dry weight.
As for the result of the liquid limit wL it is necessary to note that it was determined by the one-point
method and also the ratio from the total quantity of soil the grains of diameter of 0.5 mm take.
Fig. 1a (left) Spatula, knife and cutting knife (photo author, 2008) Fig. 1b (right) Casagrande device with a
groove in the middle of the bowl before joining both cakes (foto autor, 2008)
Page 4
58
GeoScience Engineering Volume LV (2009), No.1
http://gse.vsb.cz p. 55-68, ISSN 1802-5420
3.1.2 ČSN CEN ISO/TS 17892/12: Geotechnical investigation and testing – Laboratory testing
of soils – Part 12: Determination of consistency limits of soils.
The technical specification describes determination of the liquid limit using the cone test and
determination of plasticity limits. With regard to the study of the liquid limit in this section only the procedure
using the cone test will be explained for its determination.
For this test a cone was adopted with parameters - 60 g (weight)/ 60° (apex angle) and 80 g/ 30° and was
proved that the acquired test results of the liquid limit using these shapes of cones are identical.
The test ought to run if possible on soil in its natural condition. In order to determine the liquid limit it is
necessary to have about 200 g of soil passed through a sieve with a mesh size of 0.4 mm or the nearest. It is
possible to determine the liquid limit also by a wet method (sedimentation up to pure water, which is time
consuming and hardly realizable, see Annex 2, sections 6 – 15), however taking into consideration that the
method was not a subject of investigation, it will not be described in more detail in this chapter. Provided that
there is a large-grained material in soil it is necessary to be removed. The preference should be given rather to
manual removal of grains than to wet sifting.
The prepared paste is properly mixed and if necessary we can add such quantity of distilled water the first
penetration to achieve values to 7 mm for the cone of 60 g/ 60° and 15 mm for the cone of 30 g/ 80°.
A part of the mixed soil is moved with a flat knife to a clean and dry bowl whereas the tendency is not to
mix the test sample with air. It is necessary to take off the excess soil with a yardstick by reason of creation of a
smooth flat surface.
The penetration cone locked in a lifted position has to be lowered down so that it nearly meets the soil
surface. The cone is in a correct position if and only if the cone tip will mark the soil surface while moving
gently with the bowl.
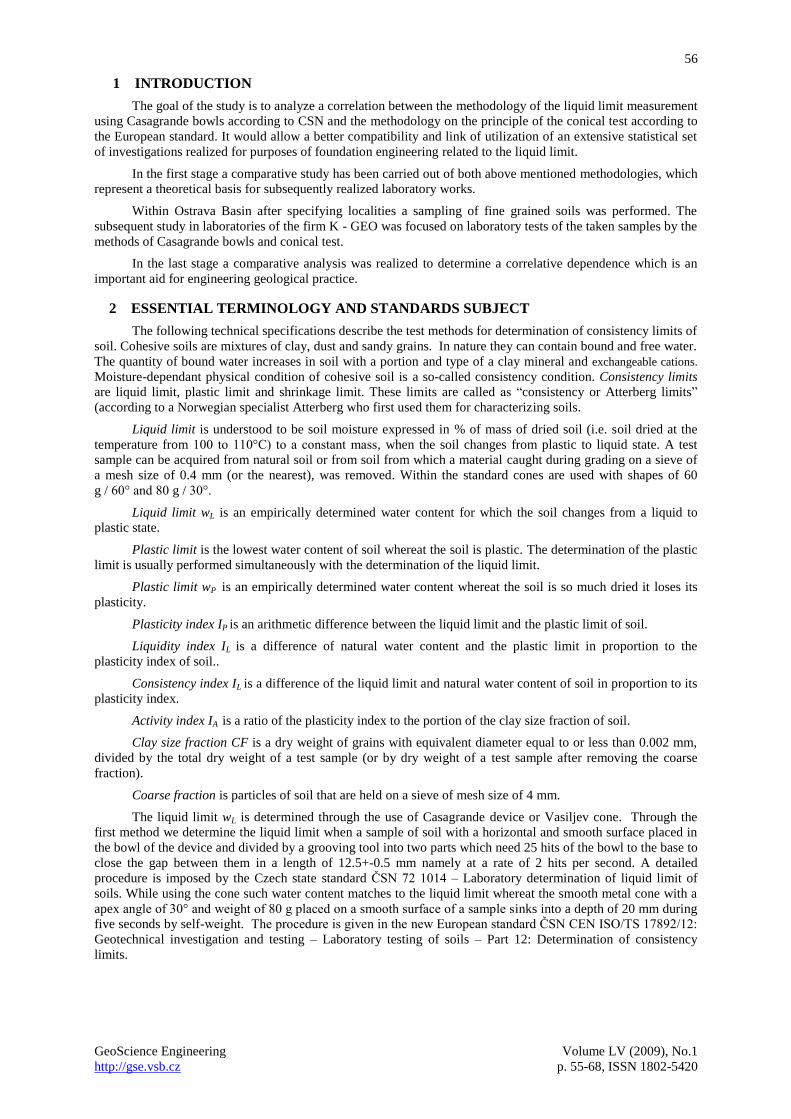
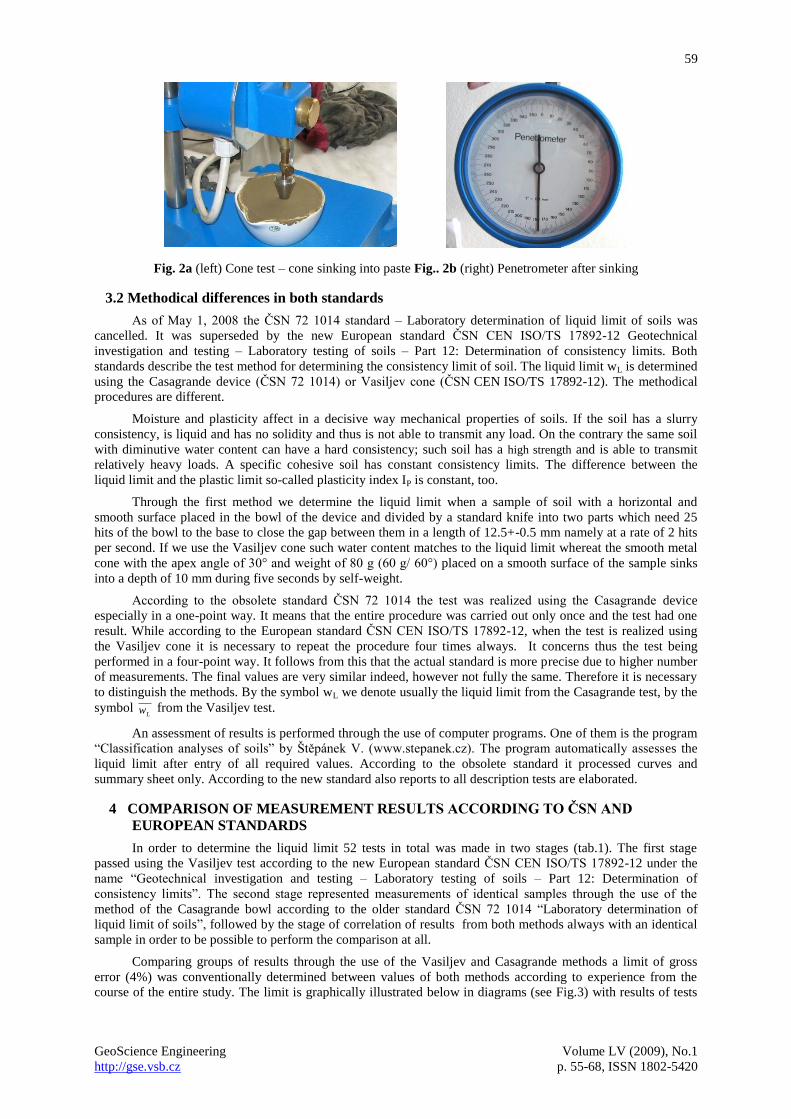
Then the cone is released and left in the lowered position for 5 s +- 1s (Figs. 2a,b). Provided that the
device is not equipped with an automatic releasing and locking device it is necessary to mind any jolt of the
device not to happen while releasing.
Penetration by the cone (depth of cone sinking) is calculated as a difference between the initial and final
positions of the cone shank and rounded to 0.1 mm.
Then the cone is pulled out and cleaned and a little of wet soil is added to the bowl so that no air bubble is
created. The surface is leveled.
It is necessary to repeat the procedure till the difference between two following penetrations is lower than
0.5 mm for the cone of 80 g/ 30° and 0.4 mm for the cone of 60 g/ 60°. The average of two last penetrations has
to be calculated.
From the penetration zone of the cone a sample (+-10 g) is taken, for which moisture is determined
according to the CEN ISO/TS 17892-1 standard – Geotechnical investigation and testing – Laboratory testing of
soils – Part 1: Determination of water content.
It is necessary to repeat the whole procedure at least three times (total 4 tests) using the identical test
sample, but with a different water content. The quantity of water dried (or delivered) has to be such that the
range of penetration values to be covered by four and more repeating tests.
As for the test results the relation of the water content (%) and the cone penetration is plotted in
semilogarithmic scale with the water content on the horizontal axis and the cone penetration in logarithmic scale
on the vertical axis. Then the best line substitution is depicted, i.e. the connecting line of the plotted points.
From the diagram the water content has to be read that corresponds to 10 mm of the cone penetration while using
the cone of 60 g/ 60° or the water content matching to 20 mm of the cone penetration while using the cone of 80
g/ 30°.
Page 5
59
GeoScience Engineering Volume LV (2009), No.1
http://gse.vsb.cz p. 55-68, ISSN 1802-5420
Fig. 2a (left) Cone test – cone sinking into paste Fig.. 2b (right) Penetrometer after sinking
3.2 Methodical differences in both standards
As of May 1, 2008 the ČSN 72 1014 standard – Laboratory determination of liquid limit of soils was
cancelled. It was superseded by the new European standard ČSN CEN ISO/TS 17892-12 Geotechnical
investigation and testing – Laboratory testing of soils – Part 12: Determination of consistency limits. Both
standards describe the test method for determining the consistency limit of soil. The liquid limit wL is determined
using the Casagrande device (ČSN 72 1014) or Vasiljev cone (ČSN CEN ISO/TS 17892-12). The methodical
procedures are different.
Moisture and plasticity affect in a decisive way mechanical properties of soils. If the soil has a slurry
consistency, is liquid and has no solidity and thus is not able to transmit any load. On the contrary the same soil
with diminutive water content can have a hard consistency; such soil has a high strength and is able to transmit
relatively heavy loads. A specific cohesive soil has constant consistency limits. The difference between the
liquid limit and the plastic limit so-called plasticity index IP is constant, too.
Through the first method we determine the liquid limit when a sample of soil with a horizontal and
smooth surface placed in the bowl of the device and divided by a standard knife into two parts which need 25
hits of the bowl to the base to close the gap between them in a length of 12.5+-0.5 mm namely at a rate of 2 hits
per second. If we use the Vasiljev cone such water content matches to the liquid limit whereat the smooth metal
cone with the apex angle of 30° and weight of 80 g (60 g/ 60°) placed on a smooth surface of the sample sinks
into a depth of 10 mm during five seconds by self-weight.
According to the obsolete standard ČSN 72 1014 the test was realized using the Casagrande device
especially in a one-point way. It means that the entire procedure was carried out only once and the test had one
result. While according to the European standard ČSN CEN ISO/TS 17892-12, when the test is realized using
the Vasiljev cone it is necessary to repeat the procedure four times always. It concerns thus the test being
performed in a four-point way. It follows from this that the actual standard is more precise due to higher number
of measurements. The final values are very similar indeed, however not fully the same. Therefore it is necessary
to distinguish the methods. By the symbol wL we denote usually the liquid limit from the Casagrande test, by the
symbol Lw from the Vasiljev test.
An assessment of results is performed through the use of computer programs. One of them is the program
“Classification analyses of soils” by Štěpánek V. (www.stepanek.cz). The program automatically assesses the
liquid limit after entry of all required values. According to the obsolete standard it processed curves and
summary sheet only. According to the new standard also reports to all description tests are elaborated.
4 COMPARISON OF MEASUREMENT RESULTS ACCORDING TO ČSN AND
EUROPEAN STANDARDS
In order to determine the liquid limit 52 tests in total was made in two stages (tab.1). The first stage
passed using the Vasiljev test according to the new European standard ČSN CEN ISO/TS 17892-12 under the
name “Geotechnical investigation and testing – Laboratory testing of soils – Part 12: Determination of
consistency limits”. The second stage represented measurements of identical samples through the use of the
method of the Casagrande bowl according to the older standard ČSN 72 1014 “Laboratory determination of
liquid limit of soils”, followed by the stage of correlation of results from both methods always with an identical
sample in order to be possible to perform the comparison at all.
Comparing groups of results through the use of the Vasiljev and Casagrande methods a limit of gross
error (4%) was conventionally determined between values of both methods according to experience from the
course of the entire study. The limit is graphically illustrated below in diagrams (see Fig.3) with results of tests
Page 6
60
GeoScience Engineering Volume LV (2009), No.1
http://gse.vsb.cz p. 55-68, ISSN 1802-5420
(yellow line). It is recommended to repeat the tests with values over the mentioned limit. The full group of
measurements involved 9.43 % inapplicable (with gross error over 4%) values.
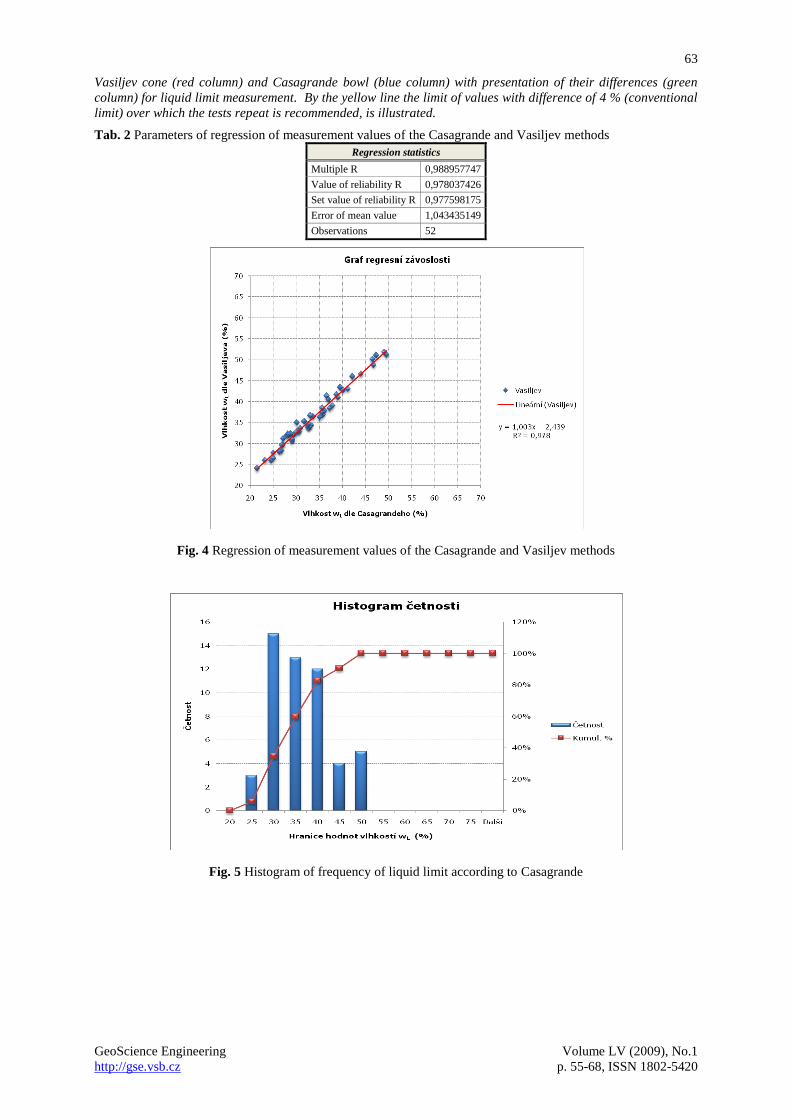
Regression diagrams (see Fig. 4) show a dependence of the test results according to Casagrande on the
results according to Vasiljev. The used regression allows analyzing the way in which values of one or more
independent variables affect the value of one dependant variable. The linear regression being applied at the two
methods of measurements was carried out using one of the most widely used least squares methods by alignment
of the set of observations.
The value of reliability should utmost tend to the number 1, for it is the value representing the condition
with the highest accuracy of the given value. For the complete group of the conducted tests the value is 0.9780
(see Tab. 2), which means the results are relatively very exact. Also the error of mean value 1.043 is low for the
results (see Tab. 2).
A statistical evaluation was performed, whose parameters are presented in Tab. 3.
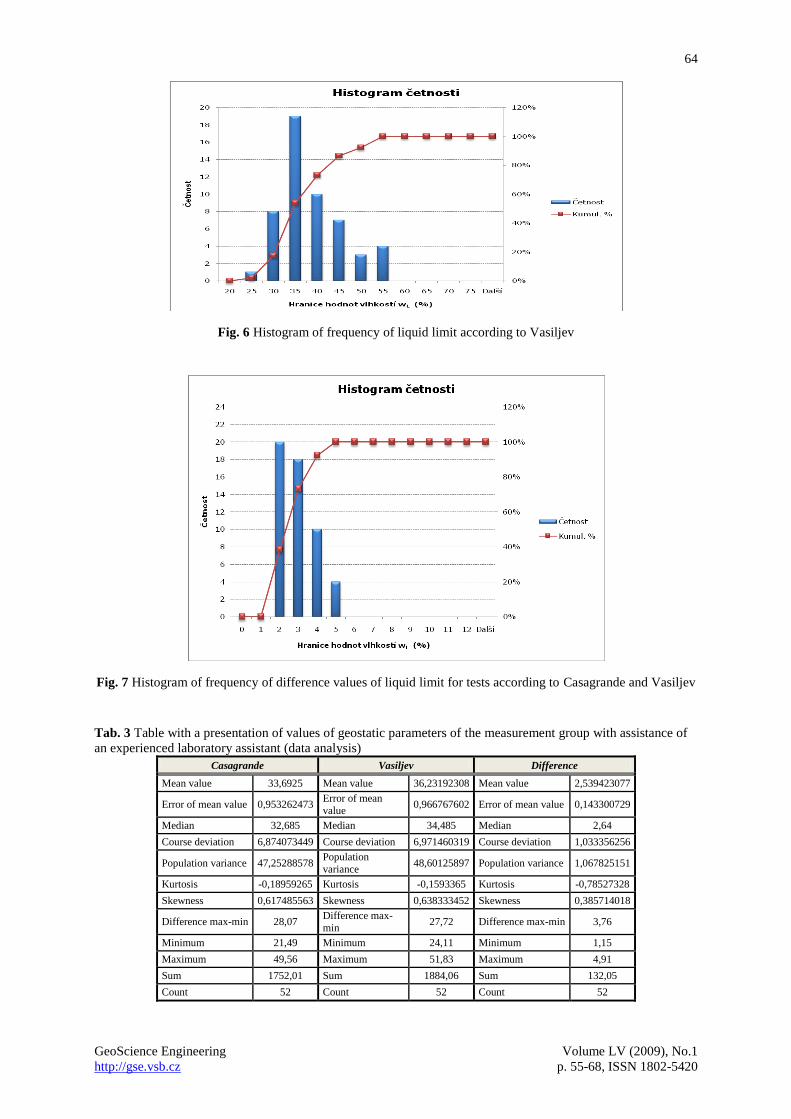
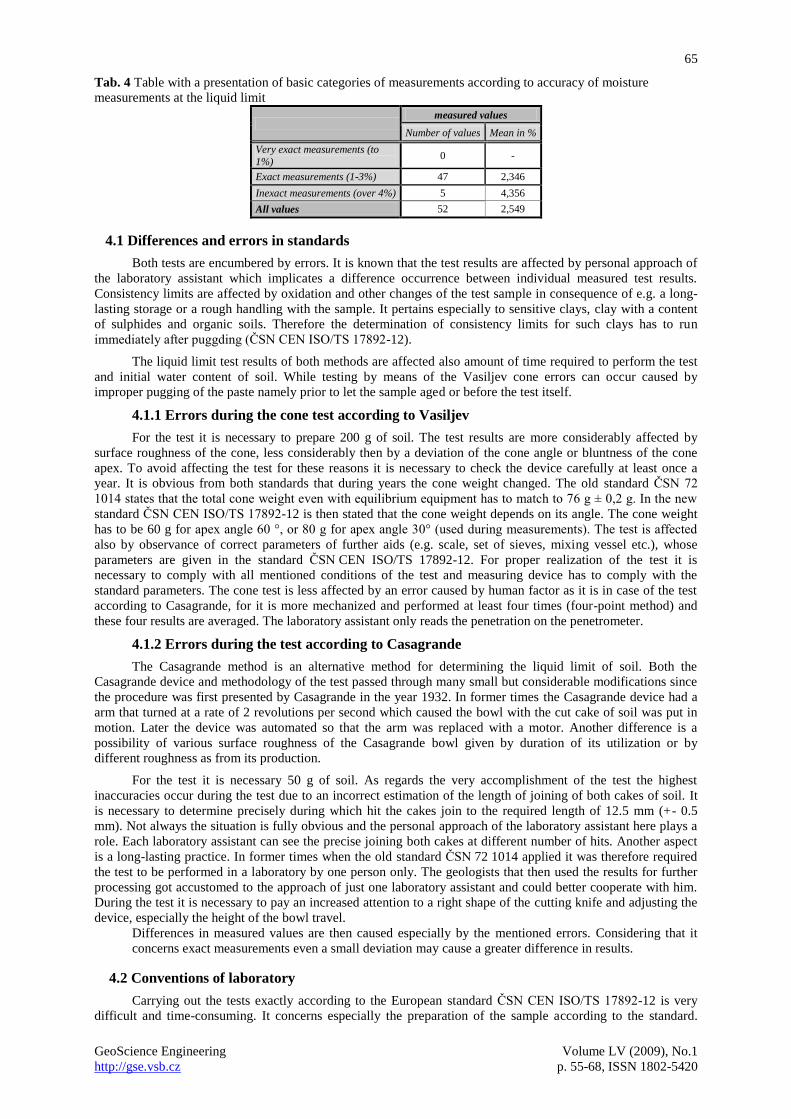
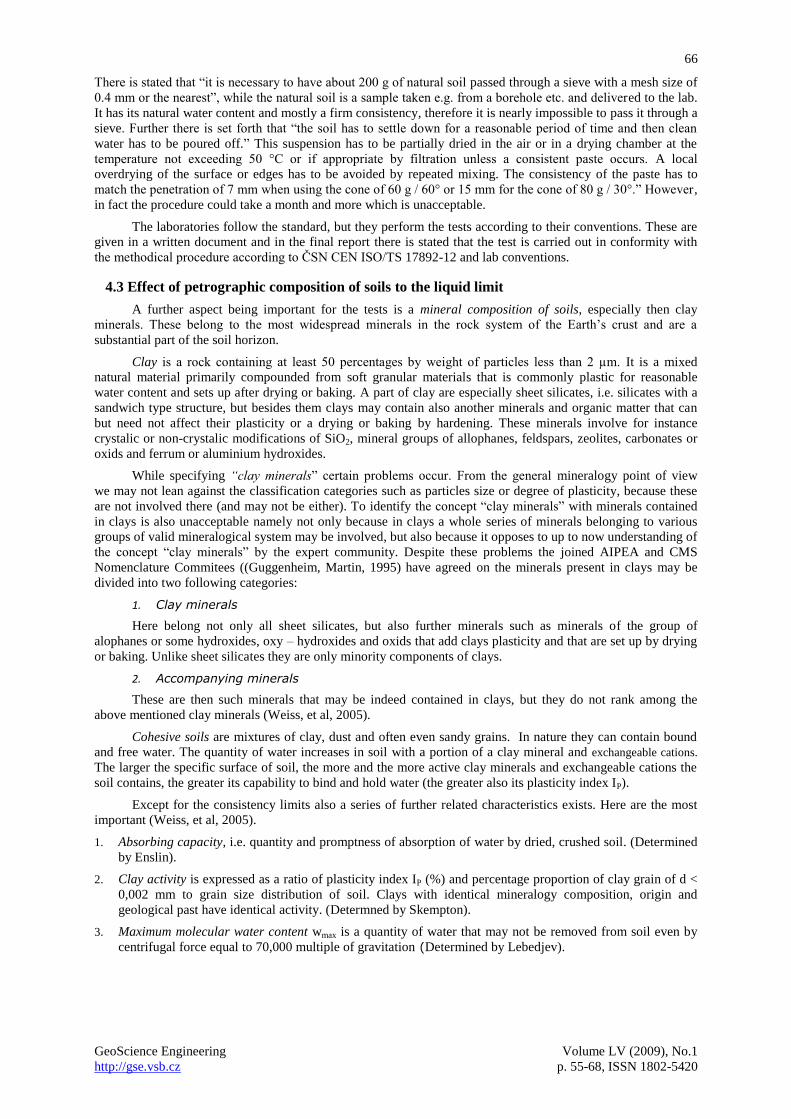
Mean value is a parameter of distribution of a random variable that is defined as weighted mean of the
given distribution. The mean of the results difference was 2.549%. More transparently it is illustrated in Tab. 4
and in histograms of frequency (see Fig. 5, obr. 6, obr. 7).
Median is the value of the argument X with the highest absolute frequency, which means that
approximately 50% values are higher and 50% lower than the value. There are not great deviations in both
groups of measurements for the statistical value.
Standard deviation expresses, how the values differ from the mean value (mean values – Tab. 3).
Population variance represents so-called characteristics of variability (Tab. 3).
Kurtosis determines a relative kurtosis or flatness of distribution in comparison with normal distribution.
During the calculation of kurtosis biquadrate is used. Kurtosis is negative, which means that the distribution is
relatively flat.
Skewness denotes an asymmetry degree of the value distribution round the mean value. Positive skewness
denotes a distribution with an asymmetric side that deviates towards more positive values. Negative skewness
denotes a distribution with an asymmetric side that deviates towards more negative values. During calculation of
skewness the third power is used. The measured results are skewed positively.
Minimum is the smallest measured value (Tab. 3).
Maximum is the highest measured value (Tab. 3).
Difference min – max is the difference between the lowest and the highest values. (Tab. 1, obr. 3 a tab. 4).
Sum is a sum of all measured values (Tab. 3).
Count is a total number of values (Tab. 3).
Page 7
61
GeoScience Engineering Volume LV (2009), No.1
http://gse.vsb.cz p. 55-68, ISSN 1802-5420
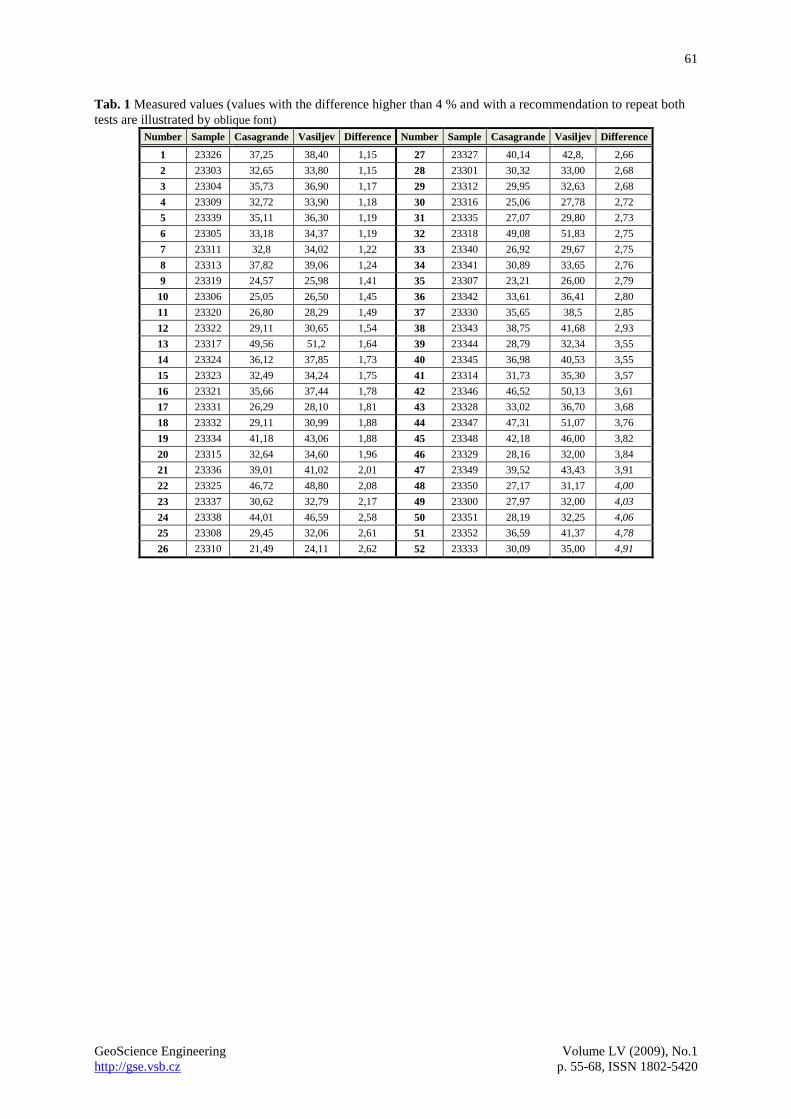
Tab. 1 Measured values (values with the difference higher than 4 % and with a recommendation to repeat both
tests are illustrated by oblique font)
Number Sample Casagrande Vasiljev Difference Number Sample Casagrande Vasiljev Difference
1 23326 37,25 38,40 1,15 27 23327 40,14 42,8, 2,66
2 23303 32,65 33,80 1,15 28 23301 30,32 33,00 2,68
3 23304 35,73 36,90 1,17 29 23312 29,95 32,63 2,68
4 23309 32,72 33,90 1,18 30 23316 25,06 27,78 2,72
5 23339 35,11 36,30 1,19 31 23335 27,07 29,80 2,73
6 23305 33,18 34,37 1,19 32 23318 49,08 51,83 2,75
7 23311 32,8 34,02 1,22 33 23340 26,92 29,67 2,75
8 23313 37,82 39,06 1,24 34 23341 30,89 33,65 2,76
9 23319 24,57 25,98 1,41 35 23307 23,21 26,00 2,79
10 23306 25,05 26,50 1,45 36 23342 33,61 36,41 2,80
11 23320 26,80 28,29 1,49 37 23330 35,65 38,5 2,85
12 23322 29,11 30,65 1,54 38 23343 38,75 41,68 2,93
13 23317 49,56 51,2 1,64 39 23344 28,79 32,34 3,55
14 23324 36,12 37,85 1,73 40 23345 36,98 40,53 3,55
15 23323 32,49 34,24 1,75 41 23314 31,73 35,30 3,57
16 23321 35,66 37,44 1,78 42 23346 46,52 50,13 3,61
17 23331 26,29 28,10 1,81 43 23328 33,02 36,70 3,68
18 23332 29,11 30,99 1,88 44 23347 47,31 51,07 3,76
19 23334 41,18 43,06 1,88 45 23348 42,18 46,00 3,82
20 23315 32,64 34,60 1,96 46 23329 28,16 32,00 3,84
21 23336 39,01 41,02 2,01 47 23349 39,52 43,43 3,91
22 23325 46,72 48,80 2,08 48 23350 27,17 31,17 4,00
23 23337 30,62 32,79 2,17 49 23300 27,97 32,00 4,03
24 23338 44,01 46,59 2,58 50 23351 28,19 32,25 4,06
25 23308 29,45 32,06 2,61 51 23352 36,59 41,37 4,78
26 23310 21,49 24,11 2,62 52 23333 30,09 35,00 4,91
Page 8
62
GeoScience Engineering Volume LV (2009), No.1
http://gse.vsb.cz p. 55-68, ISSN 1802-5420
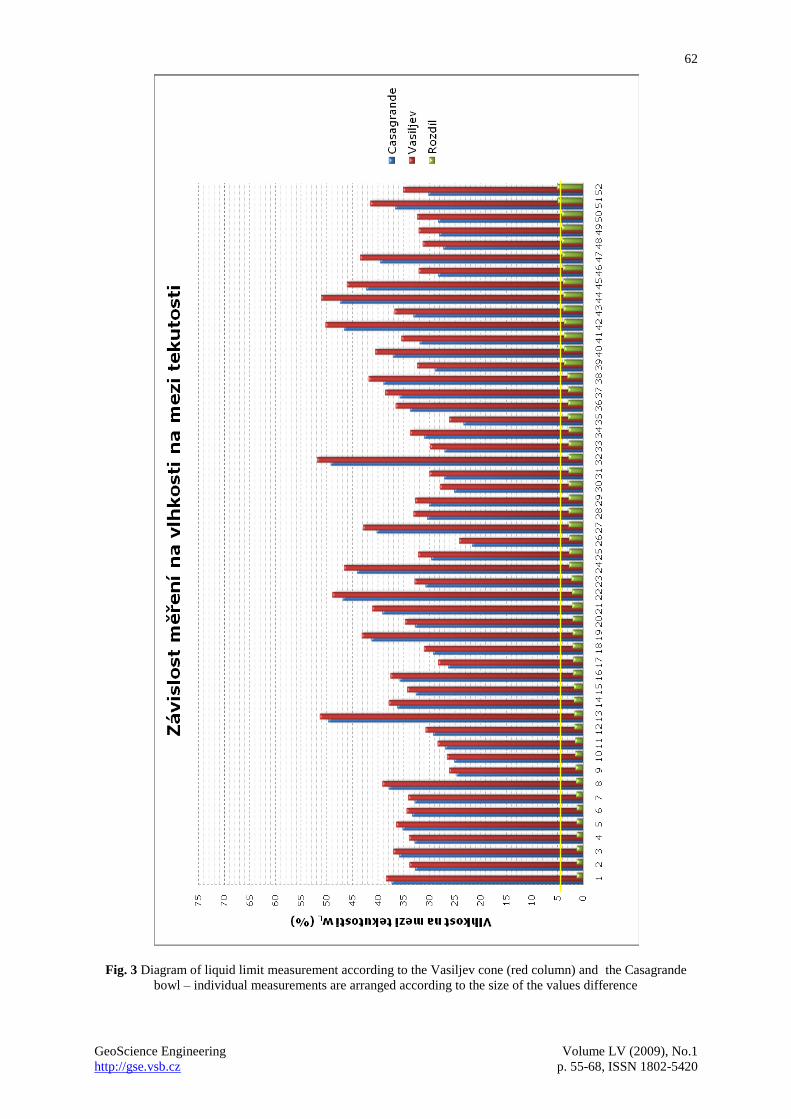
Fig. 3 Diagram of liquid limit measurement according to the Vasiljev cone (red column) and the Casagrande
bowl – individual measurements are arranged according to the size of the values difference
Page 9
63
GeoScience Engineering Volume LV (2009), No.1
http://gse.vsb.cz p. 55-68, ISSN 1802-5420
Vasiljev cone (red column) and Casagrande bowl (blue column) with presentation of their differences (green
column) for liquid limit measurement. By the yellow line the limit of values with difference of 4 % (conventional
limit) over which the tests repeat is recommended, is illustrated.
Tab. 2 Parameters of regression of measurement values of the Casagrande and Vasiljev methods
Regression statistics
Multiple R 0,988957747
Value of reliability R 0,978037426
Set value of reliability R 0,977598175
Error of mean value 1,043435149
Observations 52
Fig. 4 Regression of measurement values of the Casagrande and Vasiljev methods
Fig. 5 Histogram of frequency of liquid limit according to Casagrande
Page 10
64
GeoScience Engineering Volume LV (2009), No.1
http://gse.vsb.cz p. 55-68, ISSN 1802-5420
Fig. 6 Histogram of frequency of liquid limit according to Vasiljev
Fig. 7 Histogram of frequency of difference values of liquid limit for tests according to Casagrande and Vasiljev
Tab. 3 Table with a presentation of values of geostatic parameters of the measurement group with assistance of
an experienced laboratory assistant (data analysis)
Casagrande Vasiljev Difference
Mean value 33,6925 Mean value 36,23192308 Mean value 2,539423077
Error of mean value 0,953262473 Error of mean
value 0,966767602 Error of mean value 0,143300729
Median 32,685 Median 34,485 Median 2,64
Course deviation 6,874073449 Course deviation 6,971460319 Course deviation 1,033356256
Population variance 47,25288578 Population
variance 48,60125897 Population variance 1,067825151
Kurtosis -0,18959265 Kurtosis -0,1593365 Kurtosis -0,78527328
Skewness 0,617485563 Skewness 0,638333452 Skewness 0,385714018
Difference max-min 28,07 Difference max-
min 27,72 Difference max-min 3,76
Minimum 21,49 Minimum 24,11 Minimum 1,15
Maximum 49,56 Maximum 51,83 Maximum 4,91
Sum 1752,01 Sum 1884,06 Sum 132,05
Count 52 Count 52 Count 52
Page 11
65
GeoScience Engineering Volume LV (2009), No.1
http://gse.vsb.cz p. 55-68, ISSN 1802-5420
Tab. 4 Table with a presentation of basic categories of measurements according to accuracy of moisture
measurements at the liquid limit
measured values
Number of values Mean in %
Very exact measurements (to
1%) 0 -
Exact measurements (1-3%) 47 2,346
Inexact measurements (over 4%) 5 4,356
All values 52 2,549
4.1 Differences and errors in standards
Both tests are encumbered by errors. It is known that the test results are affected by personal approach of
the laboratory assistant which implicates a difference occurrence between individual measured test results.
Consistency limits are affected by oxidation and other changes of the test sample in consequence of e.g. a long-
lasting storage or a rough handling with the sample. It pertains especially to sensitive clays, clay with a content
of sulphides and organic soils. Therefore the determination of consistency limits for such clays has to run
immediately after puggding (ČSN CEN ISO/TS 17892-12).
The liquid limit test results of both methods are affected also amount of time required to perform the test
and initial water content of soil. While testing by means of the Vasiljev cone errors can occur caused by
improper pugging of the paste namely prior to let the sample aged or before the test itself.
4.1.1 Errors during the cone test according to Vasiljev
For the test it is necessary to prepare 200 g of soil. The test results are more considerably affected by
surface roughness of the cone, less considerably then by a deviation of the cone angle or bluntness of the cone
apex. To avoid affecting the test for these reasons it is necessary to check the device carefully at least once a
year. It is obvious from both standards that during years the cone weight changed. The old standard ČSN 72
1014 states that the total cone weight even with equilibrium equipment has to match to 76 g ± 0,2 g. In the new
standard ČSN CEN ISO/TS 17892-12 is then stated that the cone weight depends on its angle. The cone weight
has to be 60 g for apex angle 60 °, or 80 g for apex angle 30° (used during measurements). The test is affected
also by observance of correct parameters of further aids (e.g. scale, set of sieves, mixing vessel etc.), whose
parameters are given in the standard ČSN CEN ISO/TS 17892-12. For proper realization of the test it is
necessary to comply with all mentioned conditions of the test and measuring device has to comply with the
standard parameters. The cone test is less affected by an error caused by human factor as it is in case of the test
according to Casagrande, for it is more mechanized and performed at least four times (four-point method) and
these four results are averaged. The laboratory assistant only reads the penetration on the penetrometer.
4.1.2 Errors during the test according to Casagrande
The Casagrande method is an alternative method for determining the liquid limit of soil. Both the
Casagrande device and methodology of the test passed through many small but considerable modifications since
the procedure was first presented by Casagrande in the year 1932. In former times the Casagrande device had a
arm that turned at a rate of 2 revolutions per second which caused the bowl with the cut cake of soil was put in
motion. Later the device was automated so that the arm was replaced with a motor. Another difference is a
possibility of various surface roughness of the Casagrande bowl given by duration of its utilization or by
different roughness as from its production.
For the test it is necessary 50 g of soil. As regards the very accomplishment of the test the highest
inaccuracies occur during the test due to an incorrect estimation of the length of joining of both cakes of soil. It
is necessary to determine precisely during which hit the cakes join to the required length of 12.5 mm (+- 0.5
mm). Not always the situation is fully obvious and the personal approach of the laboratory assistant here plays a
role. Each laboratory assistant can see the precise joining both cakes at different number of hits. Another aspect
is a long-lasting practice. In former times when the old standard ČSN 72 1014 applied it was therefore required
the test to be performed in a laboratory by one person only. The geologists that then used the results for further
processing got accustomed to the approach of just one laboratory assistant and could better cooperate with him.
During the test it is necessary to pay an increased attention to a right shape of the cutting knife and adjusting the
device, especially the height of the bowl travel.
Differences in measured values are then caused especially by the mentioned errors. Considering that it
concerns exact measurements even a small deviation may cause a greater difference in results.
4.2 Conventions of laboratory
Carrying out the tests exactly according to the European standard ČSN CEN ISO/TS 17892-12 is very
difficult and time-consuming. It concerns especially the preparation of the sample according to the standard.
Page 12
66
GeoScience Engineering Volume LV (2009), No.1
http://gse.vsb.cz p. 55-68, ISSN 1802-5420
There is stated that “it is necessary to have about 200 g of natural soil passed through a sieve with a mesh size of
0.4 mm or the nearest”, while the natural soil is a sample taken e.g. from a borehole etc. and delivered to the lab.
It has its natural water content and mostly a firm consistency, therefore it is nearly impossible to pass it through a
sieve. Further there is set forth that “the soil has to settle down for a reasonable period of time and then clean
water has to be poured off.” This suspension has to be partially dried in the air or in a drying chamber at the
temperature not exceeding 50 °C or if appropriate by filtration unless a consistent paste occurs. A local
overdrying of the surface or edges has to be avoided by repeated mixing. The consistency of the paste has to
match the penetration of 7 mm when using the cone of 60 g / 60° or 15 mm for the cone of 80 g / 30°.” However,
in fact the procedure could take a month and more which is unacceptable.
The laboratories follow the standard, but they perform the tests according to their conventions. These are
given in a written document and in the final report there is stated that the test is carried out in conformity with
the methodical procedure according to ČSN CEN ISO/TS 17892-12 and lab conventions.
4.3 Effect of petrographic composition of soils to the liquid limit
A further aspect being important for the tests is a mineral composition of soils, especially then clay
minerals. These belong to the most widespread minerals in the rock system of the Earth’s crust and are a
substantial part of the soil horizon.
Clay is a rock containing at least 50 percentages by weight of particles less than 2 µm. It is a mixed
natural material primarily compounded from soft granular materials that is commonly plastic for reasonable
water content and sets up after drying or baking. A part of clay are especially sheet silicates, i.e. silicates with a
sandwich type structure, but besides them clays may contain also another minerals and organic matter that can
but need not affect their plasticity or a drying or baking by hardening. These minerals involve for instance
crystalic or non-crystalic modifications of SiO2, mineral groups of allophanes, feldspars, zeolites, carbonates or
oxids and ferrum or aluminium hydroxides.
While specifying “clay minerals” certain problems occur. From the general mineralogy point of view
we may not lean against the classification categories such as particles size or degree of plasticity, because these
are not involved there (and may not be either). To identify the concept “clay minerals” with minerals contained
in clays is also unacceptable namely not only because in clays a whole series of minerals belonging to various
groups of valid mineralogical system may be involved, but also because it opposes to up to now understanding of
the concept “clay minerals” by the expert community. Despite these problems the joined AIPEA and CMS
Nomenclature Commitees ((Guggenheim, Martin, 1995) have agreed on the minerals present in clays may be
divided into two following categories:
1. Clay minerals
Here belong not only all sheet silicates, but also further minerals such as minerals of the group of
alophanes or some hydroxides, oxy – hydroxides and oxids that add clays plasticity and that are set up by drying
or baking. Unlike sheet silicates they are only minority components of clays.
2. Accompanying minerals
These are then such minerals that may be indeed contained in clays, but they do not rank among the
above mentioned clay minerals (Weiss, et al, 2005).
Cohesive soils are mixtures of clay, dust and often even sandy grains. In nature they can contain bound
and free water. The quantity of water increases in soil with a portion of a clay mineral and exchangeable cations.
The larger the specific surface of soil, the more and the more active clay minerals and exchangeable cations the
soil contains, the greater its capability to bind and hold water (the greater also its plasticity index IP).
Except for the consistency limits also a series of further related characteristics exists. Here are the most
important (Weiss, et al, 2005).
1. Absorbing capacity, i.e. quantity and promptness of absorption of water by dried, crushed soil. (Determined
by Enslin).
2. Clay activity is expressed as a ratio of plasticity index IP (%) and percentage proportion of clay grain of d <
0,002 mm to grain size distribution of soil. Clays with identical mineralogy composition, origin and
geological past have identical activity. (Determned by Skempton).
3. Maximum molecular water content wmax is a quantity of water that may not be removed from soil even by
centrifugal force equal to 70,000 multiple of gravitation (Determined by Lebedjev).
Page 13
67
GeoScience Engineering Volume LV (2009), No.1
http://gse.vsb.cz p. 55-68, ISSN 1802-5420
5 CONCLUSION
The subject of the study is the liquid limit that is an empirically determined state at which a transition
from a softly plastic to liquid (pasty) state occurs, therefore after its achieving soil starts to behave as a liquid
substance.
The liquid limit measurement is principal especially for finding consistency states playing a decisive role
for determining the key standard characteristics of soils representing important geotechnical parameters of fine-
grained soils (as categories of foundation soil according to the standard ČSN 73 1001 Foundation soil under
spread footing) for investigations of the so-called first geotechnical category. It is an input parameter for
calculation of the consistency and plasticity indices of soils being interconnected with the above mentioned.
The study was realized by two methodologies of liquid limit measurements by the Casagrande bowls and
cone tests by Vasiljev. The finding was not based only on comparison of two differing methods for one
parameter, but also on discovery of an important continuity of the older Czech standard (ČSN 72 1014
Laboratory determination of liquid limit of soils) and the newly implemented European standard (ČSN CEN
ISO/TS 17892/12: Geotechnical investigation and testing – Laboratory testing of soils – Part 12: Determination
of consistency limits. Further meaning is bound to utilization of a large file of in-past-realized engineering
geological investigations with determination of the parameter and on a need to use them at present in newly
realized investigations according to the found correlation state. Archive works are available through the Geofond
of the Czech Republic.
The study was assessed based on 52 realized laboratory tests, whereas each test was carried out on the
same sample of foundation soil. Initial procedure insisted in cutting by a knife, drying in a drying chamber,
sorting using electric mill, additional watering by distilled water and mixing. In conclusion before realization of
the tests the sample set up for 24 hours for the purpose of even distribution of moisture.
Subsequently the Casagrande bowl test and the Vasiljev cone test were realized. It is important to
perceive the cone test is according to the standard carried out four times on an identical sample, while the
Casagrande method only once. Another significant differences are obvious both in using of devices and
performance of the test itself.
The sample values ranged from 21.49 to 49.56 % according to Casagrande and in the conical test they
ranged from 24.11 to 51.07 %. The difference of the results for identical samples reached values from 1.15 to
4.19 %. Mean difference coefficient between the methods is 2.549 %.
It is possible to use the mean difference coefficients in future as correlation coefficients, whereas it would
be necessary to precise their application by a larger file of comparing tests. However, their finding is important,
because it facilitates the application of the archive values according to Casagrande and at present realized tests
by Vasiljev in one engineering geological investigation within the same locality.
REFERENCES
[1] ČSN 72 1012 Laboratorní stanovení vlhkosti zemin, Praha: Český normalizační institut, 2005, 16 s.
[2] ČSN 72 1014 Laboratorní stanovení meze tekutosti zemin, Praha, ÚMN, 1968, 9 s.
[3] ČSN 73 1001 - Zakládání staveb. Základová půda pod plošnými základy
[4] ČSN CEN ISO/ TS 17892 – 12 Geotechnický průzkum a zkoušení – Laboratorní zkoušky zemin – Část
12: Stanovení konzistenčních mezí, Praha: Český normalizační institut, 2005. 15 s.
[5] ČSN CEN ISO/TS 17892-1 Geotechnický průzkum a zkoušení - Laboratorní zkoušky zemin - Část 1:
Stanovení vlhkosti zemin, Praha: Český normalizační institut, 2005. 12 s.
[6] Guggenheim, S., Martin, RT.: Definition of clay and clay mineral. Joint report of the AIPEA
nomenclature and CMS nomenclature committees. Clays Clay Miner 43, 1995, pp. 255-256
[7] Hulla, J., Šimek, J., Turček, P.: Mechanika zemín a zakladanie stavieb, Bratislava, Alfa, 1991, 336 s.
[8] Šimek, J., Jesenák, J., Eichler, J., Vaníček, I.: Mechanika zemin. 1.vyd., Praha, SNTL, 1990, 388 s.
[9] Šucha, V.: Íly v geologických procesoch, Acta Geologica Universitatis Comenianae, ISBN, 2001, 159 s.
[10] Weiss, Z., Kužvart, M. Jílové minerály – jejich nanostruktura a využití, Praha, Karolinum, 2005, 281 s.
RESUMÉ
V podmínkách Evropské unie při implementaci nové legislativy v geotechnice vyvstala problematika
kompatibility metod pro měření vlhkosti na mezi tekutosti stanovované podle Českých státních norem a
přijímaných evropských norem. Existující ČSN stanovovala vlhkost na mezi tekutosti pomocí tzv. Casagrandeho
misek, přičemž nová evropská norma pomocí kuželové zkoušky. Studovaná kompatibilita má řadu velmi
Page 14
68
GeoScience Engineering Volume LV (2009), No.1
http://gse.vsb.cz p. 55-68, ISSN 1802-5420
důležitých praktických konsekvencí. Jedná se především o desetitisíce provedených průzkumů realizovaných
v celé České republice podle předchozí metodiky, které bychom mohli využívat při budoucích
inženýrskogeologických průzkumech v rámci etapy archivního studia dosavadní prozkoumanosti. Je však nutno
při studiu parametru vlhkosti na mezi tekutosti znát korelační vztah těchto dvou parametrů stanovených dvěmi
rozdílnými metodami.
Vlhkost na mezi tekutosti je stav empiricky stanovený, při kterém nastává přechod z měkce plastického
do tekutého (kašovitého) stavu, tudíž po jeho dosažení se zemina začíná chovat jako tekutá látka.
Pomocí Casagrandeho misek získáme vlhkost na mezi tekutosti tehdy, když se koláček zeminy, s
vodorovným a uhlazeným povrchem, umístěný v misce přístroje a rozdělený normovým nožem na dvě části, slije
po 25 úderech misky o podložku v délce 12,5 0,5 mm, a to při rychlosti dvou úderů za sekundu.
U kuželové zkoušky je metodika založena na tom, že mezí tekutosti je ta vlhkost, při níž se hladký
kovový kužel se středovým úhlem 30° a s hmotností 80 g, položený na uhlazený povrch vzorku, zaboří vlastní
tíhou do hloubky 20 mm během 5 sekund.
Podrobný postup předepisuje norma „ČSN CEN ISO/TS 17892/12: Geotechnický průzkum a zkoušení –
laboratorní zkoušky zemin – Část 12: Stanovení konzistenčních mezí“. Touto normou se nahrazuje „ČSN 72
1014 Laboratorní stanovení meze tekutosti zemin“.
Vlhkost na mezi tekutosti je zásadní zejména pro zjišťovaní konzistenčních stavů, které mají rozhodující
význam pro stanovení směrných normových charakteristik zemin, které představují důležité geotechnické
parametry jemnozrnných zemin (jako tříd základové půdy dle normy ČSN 73 1001 Základová půda pod
plošnými základy) pro průzkumy tzv. první geotechnické kategorie. Je vstupním parametrem pro výpočet
Indexu konzistence a Indexu plasticity, které s výše uvedeným úzce souvisí.
Práce byla realizována na základě 52 laboratorních zkoušek, přičemž každá zkouška byla provedena na
tomtéž vzorku základové půdy.
Rozpětí hodnot u zjištěných vzorků se pohybovalo od 21,49 do 49,56 % dle Casagrandeho a u kuželové
zkoušky se pohybovalo v hodnotách od 24,11 do 51,07 %. Rozdíl výsledků u identických vzorků dosahoval
hodnot od 1,15 do 4,19 %. Průměrný rozdílový koeficient mezi metodami je 2,549 %. Průměrné rozdílové
koeficienty je možno v budoucnu použít jako korelační součinitele, přičemž jejich použití by bylo třeba upřesnit
ještě větším souborem porovnávacích zkoušek. Nicméně, jejich zjištění je důležité, protože usnadní použití
archivních hodnot dle Casagrandeho a v současnosti realizovaných zkoušek dle Vasiljeva u jednoho
inženýrskogeologického průzkumu v rámci stejné lokality.


![Michael Vallance & Yukiko Shibata Mirai Daigaku, Japan 4-1-60.pdfThe JALT CALL Journal 2008 [Vol. 4.1] — 61. Vallance & Shibata: Effective implementation of interactive podcasting](https://static.dokumenty.site/doc/80x56/5f2b15eaf37b49391e2ad76f/michael-vallance-yukiko-shibata-mirai-daigaku-japan-4-1-60pdf-the-jalt-call.jpg)


