FINANCIAL MANAGEMENT INTRODUCTION : - Financial management is the life of every business enterprise. A business under taking at a given point time can be viewed as a pool of funds raised from various sources like inventory and the source of internal financing. The funds raised from these sources are utilized for. 1.Acquiring fixed Assets needs for the production of goods and services. 2.Inventories that facilitate production and sales accountants receivables owned by customers. 3. Cash and marketable securities used for liquidity purpose and business transactions. MEANING : - The pool of funds at a given point of time is static. But over a period it changes. The change in 1
Transcript
FINANCIAL MANAGEMENT
INTRODUCTION: -
Financial management is the life of every business enterprise. A business
under taking at a given point time can be viewed as a pool of funds raised from
various sources like inventory and the source of internal financing. The funds
raised from these sources are utilized for.
1. Acquiring fixed Assets needs for the production of goods and services.
2. Inventories that facilitate production and sales accountants receivables
owned by customers.
3. Cash and marketable securities used for liquidity purpose and business
transactions.
MEANING: -
The pool of funds at a given point of time is static. But over a period it
changes. The change in the funds positions of a company is known as funds
flow. In an ongoing business enterprise, the funds flow through out the
enterprise, continually. The object of the subject financial management is to
direct the flow of these funds as per a given plan. Thus the financial
management concerns it self with the management of funds of an enterprise.
1
NATURE OF FINANCIAL MANAGEMENT: -
The term financial management can be defined as the management of
flow of funds in a firm and it deals with the financial decision making of the
firm. . I.e. it is concerned with overall managerial decision making in general
and with the management of economic resources in particular.
Finance has emerged as a distinct area of study during second half of the
twentieth century. Initially it was a part of economics .the evolution of finance
function and the changes in its scope appeared due to two factors namely
1.The continuous growth and diversity in business and
2.The gradual appearance of new financial analytical tools.
The subject of financial management is of immense interest to both
academicians and practicing managers. It is of great interest to academicians
because the subject is still developing and there are still certain areas where
controversies exist for which no unanimous solutions have been reaching as yet.
Practicing managers are interested in this subject because among the most
crucial decisions of the firms are those which relate to finance and an
understanding of the theory of financial management provides them with
conceptual and analytical insights to make those decisions skillfully.
2
SCOPE OF FINANCIAL MANAGEMENT
Initially the finance manager function was limited to raising funds as and
when the need arise. Once the funds are procured his function was over.
However, over a period of time the scope of his function has tremendously
widened. His presence is required at every moment whenever any decision
having involvement of funds is to be taken. Now a days, the financial manager,
is required to look in to the financial implications of any decision in the firm.
Since every activity in a business organizations, be it purchase, production,
marketing or capital expenditures has a financial implications, the financial
function is inter linked with all other areas. In particular the finance manager
has to focus his attention on
1.procuring the required quantum of funds as and when necessary, at the lowest
cost,
2.investing these funds in various assets in the most profitable way, and
3. Distributing returns to shareholders in order to satisfy their expectations from
the firm.
These three functions of the finance manager encompasses most the
financial events in any firm, thus, the functions of finance manager may be
summarized to include the following.
3
1. Overall financial planning and control
2. Raising funds from different sources
3. Selection of fixed assets
4. Management of working capital, and
5. Any other individual financial event.
The financial manager is usually faced with following distinct scenarios.
What should be the size of firm and how fast should it grow?
What are the various types of assets to be acquired?
What should be the pattern of raising funds from various sources?
Depending up on the nature and size of the firm the financial manager is
required to perform all or some of these functions from time to time. While
performing these functions he is required to take different decisions, which can
be broadly classified in to three groups. Those
1. Relating to resource allocation. (Investment decision)
2. Those covering the financing of these investments. (The financing or capital
structure decision)
3. And those determining how much cash be taken out and how much re-
invested. (The dividend decision)
Investment Decisions:
This comprises decisions relating to investments in both capital and
current assets. The finance manager has to evaluate different capital investment
proposals and select the best keeping in view the overall objective of the
enterprise.
4
The investment in current assets will depend on the credit and inventory
policies pursued by the enterprise. The credit policy is determined keeping in
view the need of growth in sales and the availability of finance. Similarly, the
inventory policy will be set up taking in to account the requirements of
production, the market trend to the price of raw materials and the availability of
funds.
Financing Decision: -
Financing decision is the second important function to be performed by
the financial manager. Broadly, he must decide when, where and how to acquire
funds to meet the firm’s investment needs. The financial manager is concerned
with determining the best financial mix on capital structure for his firm. Once
the financial manager is able to determine the best combination of debt and
equity he must raise the appropriate amount through best available sources.
Dividend Decision: -
Dividend decision is the third major financial decision. The financial
manager must decide whether the firm should distribute all profits, or retain
them or distribute a portion and retain the balance. The optimum dividend
policy is one, which maximizes the market value of the firm’s shares. Thus, if
shareholders are not in different to firm’s dividend policy, the financial manager
must determine the optimum dividend payout ratio
5
OBJECTIVES OF FINANCIAL MANAGEMENT
Efficient financial management requires the existence of some objectives
or goals because judgment as to whether or not a financial decision is efficient
must be made in the light of some objective. Although various objectives are
possible we assume two objectives of financial management.
These are:
1. Profit maximization:
It is traditionally been argued that the objective of a company is to earn
profit; hence the objective of financial management is also profit maximization.
This implies that the finance manager has to make his decisions in a manner so
that the profits of the concern are maximized. Each alternative, therefore, is to
be seen as to whether or not it gives maximum profit.
However, profit maximization cannot be the sole objective of company. It is
at best a limited objective. If profit is given undue importance, a number of
problems can arise. Some these have been discussed below:
I) the term profit is vague. It does not clarify what exactly it mean. It conveys
different meaning to different people. For example, profit may be in short term
or long term period, it may be total profit are rate of profit etc.
ii) Profit maximization has to be attempted with a realization of risks involved.
There is a direct relation between risk and profit. Many risky propositions yield
high profit. Higher the risk, higher is the possibility of profits. If profit
maximization is the only goal, then risk factor is altogether ignored. This
implies that finance manager will accept highly risky proposals also, if they
6
give high profits. In practice, however, risk is very important consideration and
has to be balanced with the profit objective.
iii) Profit maximization, as an objective does not take in to account the time
pattern of returns. Proposal A may give a higher amount of profits as compared
to proposal B. yet if the returns began to flow say 09 years later, proposal B
may be preferred which may have lower overall profits but the returns flow is
more early and quick.
iv) Profit maximization, as an objective is too narrow. It fails to take into
account the social considerations as also the obligations to various interests of
workers, consumers, society, as well as ethical trade practices. if these factors
are ignored, a company cannot survive for long. Profit maximization at the cost
of social and moral obligations is a shortsighted policy.
2. Wealth maximization:
A company, which has profit maximization as its objective, may adopt policies
yielding exorbitant profits in the short run which are unhealthy for the growth,
survival and overall interest of the business. A company may not undertake
planned and prescribed shutdowns of the plan for maintenance, etc. for simply
to maximize its profit in the short run. If this reduces the life of a plant say by 5
years, the company is ignoring maintenance only at its own peril although it
may have greater profits in the short run. Hence, it is commonly agreed that the
objective of a firm should be to maximize its value or wealth.
How do we measure the value/wealth of a firm? According to van Horne,
“value of a firm is represented by the market price of the company’s common
stock…. the market price of a firms stock represents the focal judgement of all
7
market participants as to what the value of the particular firm is. It takes in to
account present and prospective future earnings per share, the timing and risk of
these earning, the dividend policy of the firm and many other factors that bear
up on the market price of the stock. The market price serves as a performance
index or report card of the firm’s progress. It indicates how well management is
doing on behalf of stockholders.”
There is no doubt that prices in the share market, at a given point of time,
are the result of a curious mixture of many factors like general economic
outlook, particular outlook of the companies under consideration, technical
factors and even mass psychology. However taken on a long-term basis, the
market prices of a company’s shares do reflect the value, which the various
parties put on a company. Normally, this value is a function of two factors:
(a) The likely rate of earnings per share of the company; and
(b)The capitalization rate.
The likely rate of earnings per share (EPS) depends up on the assessment
as to how a profitability of a company is going to operate in the future or what it
is likely to earn against each of its ordinary shares. Thus, if a company is likely
to earn annually Rs 5 on its share of rs09, its share will have a higher market
value than a company which earns Rs 4 for its Rs 09 share each year, of course,
presuming that other factors remaining same. A likely earnings per share is an
important factor considered by the shareholders in valuing a company.
The capitalization rate also reflects the linking of the various investors
of the company. If a company earns a high rate of earnings per share through
risky operations or risky financing pattern, the investors will not look up on its
8
share with favor. To that extent, the market value of the shares of such a
company will be low. An easy way to determine the capitalization rate is to start
with fixed deposit interest rates of banks. Suppose an investor gets a return of
Rs 09 percent from a bank on a one year fixed deposit. However, if he has to
invest in shares, he may want a higher return in view of the risks involved. How
much higher would his expectation be, would depend upon the risks involved in
the particular share which in turn depends on company’s policies, past record,
the type of business and the confidence which the management can command.
Thus, capitalization rate is the cumulative result of the assessment of the various
shareholders regarding the risky ventures; the investors will put in their money
if they get higher return as compared to that from a low risk rate.
The market value of share thus a function of the earnings per share and
the capitalization rate.
Since the profit maximization criteria cannot be applied in real world
situations because of its technical limitation the finance manager has to ensure
that his decisions are such that the market value of the shares of the company is
maximum in the long run. This implies that the financial policy has to be such
that it optimizes the earnings per share, keeping in view the risk and other
factors in mind. Wealth maximization is, therefore, a better objective for a
commercial undertaking since it represents both return and risk.
There is now a growing emphasis on social and other obligations of an
enterprise. It cannot be denied that in the case of undertakings, especially those
in the public sector, the question of maximization of wealth has to be seen in the
contest of social and other obligations of an enterprise.
9
It must be clearly understood that financial decision-making is related to
the objective of the business. The finance manager has to ensure that there is a
positive impact of each financial decision on the furtherance of the business
objectives. One of the main objective of an undertaking may be to
“progressively build up the capability to undertake the design and development
of air-craft engines, helicopters, etc….” a finance manager in such an
undertaking will allocate funds in a manner so that this objective is fulfilled
although such an allocation may not necessarily maximize wealth.
The Changing Scenario Of Financial Management In India: -
Modern financial management has come a long way from the traditional
corporate finance. The finance manager is working in a challenging
environment, which changes continuously. As the economy is opening up and
global resources are being tapped, the opportunities available to finance
managers virtually have no limits.
At the same time he must understand the risks entailing all his decisions
very well. Financial management is passing through an era of experimentation
and excitements as a large part of the finance activities carried out today were
unheard a few years ago. A few instances of this can be mentioned as: --
1. Interest rates have been freed from regulation. Treasury operations therefore
have to be more sophisticated as the interest rates are fluctuating. Minimum cost
of capital necessitates anticipating interest movements.
2. The rupee has become fully convertible on current account.
10
3. Optimum debt equity mix is possible. The firms have to take the advantage of
the financial leverage to increase the shareholders wealth. However using
financial leverage necessarily makes a business vulnerable to financial risk.
Finding a correct tradeoff between the risk and the improved return to
shareholders is a challenging task for a financial manager.
4. With free pricing of issues, the optimum price determination of new issues is
a daunting task as over pricing results in under subscription and loss of investor
confidence. While under pricing leads to unwarranted increase in number of
shares there by reducing the earnings per share.
5. Maintaining share price is crucial. In the liberalized scenario the capital
market is the important avenue of funds for business. The dividend and bonus
polices framed by finance managers has a direct bearing on share prices.
6. Ensuring management control is vital especially in the light of foreign
participation in the equity, which is backed by huge resources making the firm
an easy takeover target. Existing management may lose control in the
eventuality of being unable to take up the share entitlements. Financial
strategies to prevent this are vital to the present management.
Purpose Of Financial Statements: -
Financial statement analysis is the meaningful interpretation of ‘financial
statements’ for parties demanding financial information. It is not necessary for
the proprietors alone. Following are examples of the purposes of financial
statement analysis: -
11
The government may be interested in knowing the comparative energy
consumption of some private sector and public sector companies.
A nationalized bank may be keen to know the possible debt coverage out
of profit at the time of lending.
Prospective investors may be desirous to know the actual and forecasted
yield date. Customers want to know the business viability before entering in to a
long-term contract.
This list is not exhaustive for obvious reasons. In general, the
purpose of financial statement analysis is to aid decision making by the users of
Steps To Be Taken For Financial Statement Analysis Are: -
-Identifying the users purpose
-Identification of the data sources. (Which part of the annual report or other
information is required to be analyzed to suit the purpose.)
-Selecting the technique to be used for such analysis.
Thus financial statement analysis is purposive and not necessarily
comprehensive to cover all possible uses. Since it is purposive, analysis may be
restricted to any particular portion of the available financial statement, taking
care to ensure objectivity and unbiased ness.
Financial statement analysis covers study of relationships with a set of financial statements at a point of time and with trends in these relations over time. This means that it may be a study of some comparable firms at a particular time, say a financial year 2005-2005, or it may be a study of particular firm over a period of time says 1994-2005 or it may cover both.
12
NEED FOR THE STUDY
During the post-liberalization are the worlds assail as Economic India’s
scenario has shown a great progress and is growing with increased phase this
has necessitated the complex and efficient ways of management. Thinking
practically the main concern is of the influence of external environment on
business, providing a modern dimension to business management. They find
solution for many problems in the aspect of financial analysis. Financial
analysis establishes inter relationship that exists among. The different items
appeared in the financial statements, which are effectively helpful to describe
the company’s statues, control of sound liquidity and leverage position. The
company should monitor key indication of operating performance and wherever
possible must compare, itself with the competitors in the industry.
A systematic financial analysis of accounting figure helps to analyses the
probable caused relationship among different items after analyzing and
scrutinizing the past results which helps the management to prepare budgets, to
formulate company’s policy and to prepare future plan of action. It focuses on
company’s relative performance in sales growth margins and assets
management. It is a simple tool where by a company can make its internal audit
to evaluate internal strengths and weaknesses of the integral part of the strategic
planning
13
OBJECTIVE OF THE STUDY
This study will help to identify whether the Working capital is efficiently
utilized or not.
To know the overall operational efficiently and performance of the Bharat
Sanchar Nigam Limited.
To find out the extend of the need and adequacy of the Working capital of
the firm.
This study will help to know whether the current assets and current
liabilities are properly managed.
To see the liquidity position of the company.
To see the components of Working capital are properly managed.
To determined the requirement of Working capital.
14
LIMITATION OF THE STUDY
The study has been conducted is a systematic and comprehensive way so
as to make the project work and enviable one. However the topic under my
study may not be free firm limitations due to the factors
The major limitation of the project under study was time. Since it was to
be completed within a short period of time. Which is not sufficient to
undertaking comprehensive study.
Non-availability of completed information. Limitation in information
about cash sales and credit sales out of total sales is not available. One more
limitation is depreciation on assets individually is not available.
In the height of the above, it is not possible for an analysis to calculate the exact
working capital ratios.
The study covers a period of five years form 2005-2009.The information is
mostly depends upon the secondary data As it is not possible to cover all the
supervisors, so the student trainee selected the supervisors of working capital
analysis. Time constraint is another limitation for the study because the project
trainee has to study the whole work within 2 months. A study of risk coverage
could not make as no records are available in organization to the student trainee.
15
METHODOLOGY
The present study covers from its inception to assess and analyze the
elements of working capital analysis in Bharat Sanchar Nigam Limited;
the study is based on the data collected from the primary and secondary sources.
Primary Data:
It was collected on the basis of personal observation and interview
method. I gathered data from Bharat Sanchar Nigam Limited and Finance
Manager & Accountant who explain about the accounting system, internal audit
system and budgetary system in Bharat Sanchar Nigam Limited.
Secondary Data:
The secondary Data was collected from various published reports such as
company manuals, yearbooks various published articles and hand books.
16
PROFILE OF BSNL INDUSTRY Bharat Sanchar Nigam Ltd. formed in 1st October, 2000
It is World's 7th largest Telecommunications Company providing comprehensive range of telecom services in India: Wire line, CDMA mobile, GSM Mobile, Internet, Broadband, Carrier service, MPLS-VPN, VSAT, VoIP services, IN Services etc. Presently it is one of the largest & leading public sector units in India.
BSNL has installed Quality Telecom Network in the country and now
focusing on improving it, expanding the network, introducing new telecom services with ICT applications in villages and wining customer's confidence. Today, it has about 46 million line basic telephone capacity, 8 million WLL capacity, 52 Million GSM Capacity, more than 38302 fixed exchanges, 46565 BTS, 3895 Node B ( 3G BTS), 287 Satellite Stations, 614755 Rkm of OFC Cable, 50430 Rkm of Microwave Network connecting 602 Districts, 7330 cities/towns and 5.6 Lakhs villages.
BSNL is the only service provider, making focused efforts and planned initiatives to bridge the Rural-Urban Digital Divide ICT sector. In fact there is no telecom operator in the country to beat its reach with its wide network giving services in every nook & corner of country and operates across India except Delhi & Mumbai. Whether it is inaccessible areas of Siachen glacier and North-eastern region of the country. BSNL serves its customers with its wide bouquet of telecom services.
BSNL is numero uno operator of India in all services in its license area. The company offers vide ranging & most transparent tariff schemes designed to suite every customer.
BSNL cellular service, CellOne, has 55,140,282 2G cellular customers and 88,493 3Gcustomers as on 30.10.2008. In basic services, BSNL is miles ahead of its rivals, with 35.1 million Basic Phone subscribers i.e. 85 per cent share of the subscriber base and 92 percent share in revenue terms.
17
BSNL has more than 2.5 million WLL subscribers and 2.5 million Internet Customers who access Internet through various modes viz. Dial-up, Leased Line, DIAS, and Account Less Internet (CLI). BSNL has been adjudged as the NUMBER ONE ISP in the country.
BSNL has set up a world class multi-gigabit, multi-protocol convergent IP infrastructure that provides convergent services like voice, data and video through the same Backbone and Broadband Access Network. At present there are 0.6 million Data One broadband customers.
The company has vast experience in Planning, Installation, network integration and Maintenance of Switching & Transmission Networks and also has a world class ISO 9000 certified Telecom Training Institute.
18
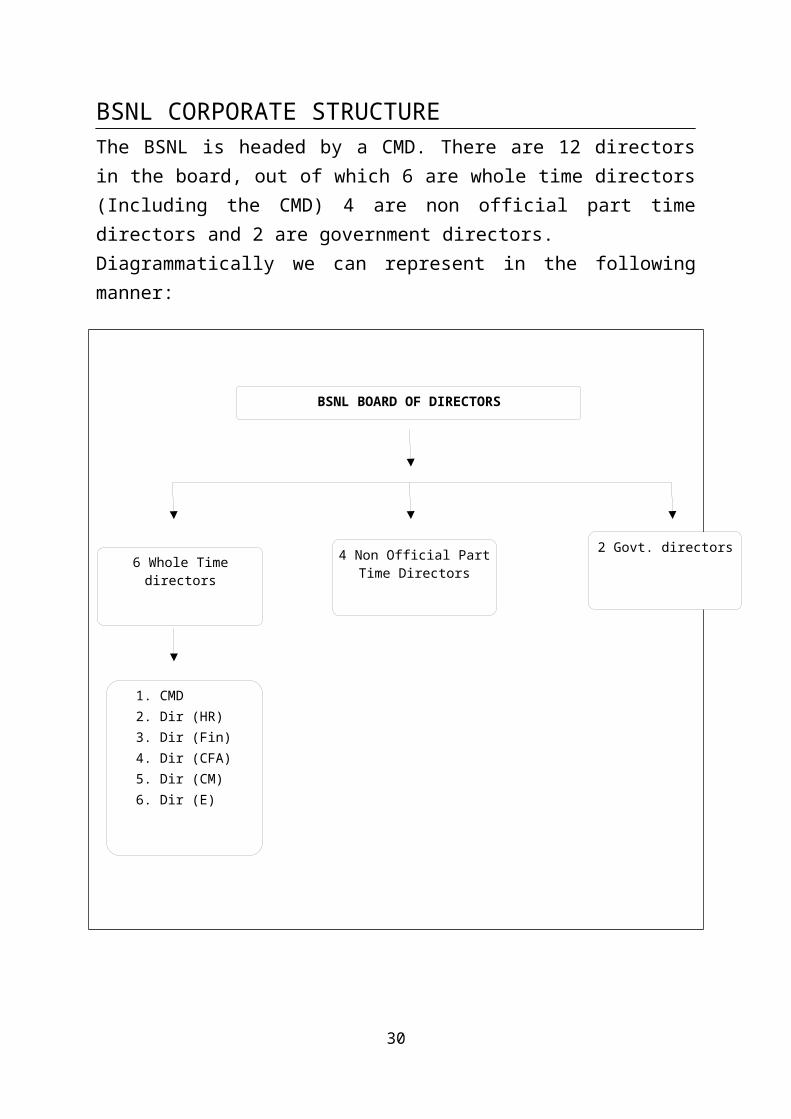
BSNL CORPORATE STRUCTUREThe BSNL is headed by a CMD. There are 12 directors in the board, out of which 6 are whole time directors (Including the CMD) 4 are non official part time directors and 2 are government directors.Diagrammatically we can represent in the following manner:
19
BSNL BOARD OF DIRECTORS
6 Whole Time directors
4 Non Official Part Time Directors
2 Govt. directors
1. CMD2. Dir (HR)3. Dir (Fin)4. Dir (CFA)5. Dir (CM)6. Dir (E)
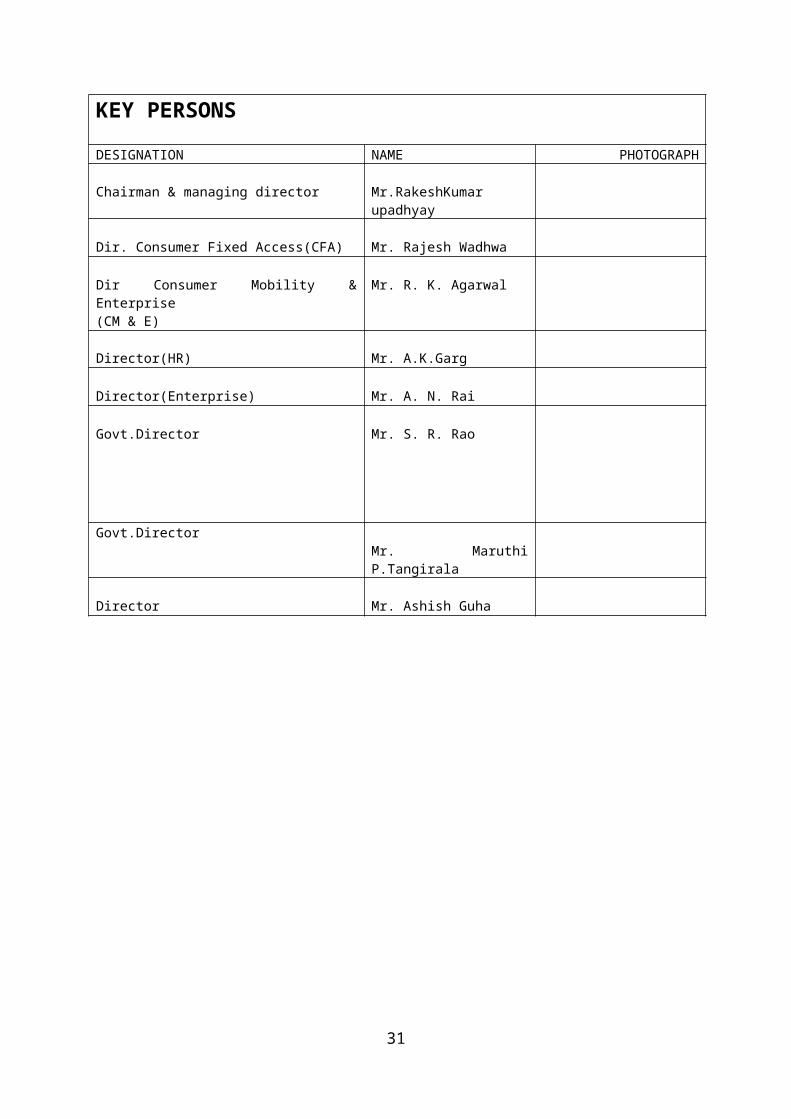
KEY PERSONS
DESIGNATION NAME PHOTOGRAPH
Chairman & managing director Mr.RakeshKumar upadhyay
Dir. Consumer Fixed Access(CFA) Mr. Rajesh Wadhwa
Dir Consumer Mobility & Enterprise(CM & E)
Mr. R. K. Agarwal
Director(HR) Mr. A.K.Garg
Director(Enterprise) Mr. A. N. Rai
Govt.Director Mr. S. R. Rao
Govt.DirectorMr. Maruthi P.Tangirala
Director Mr. Ashish Guha
20
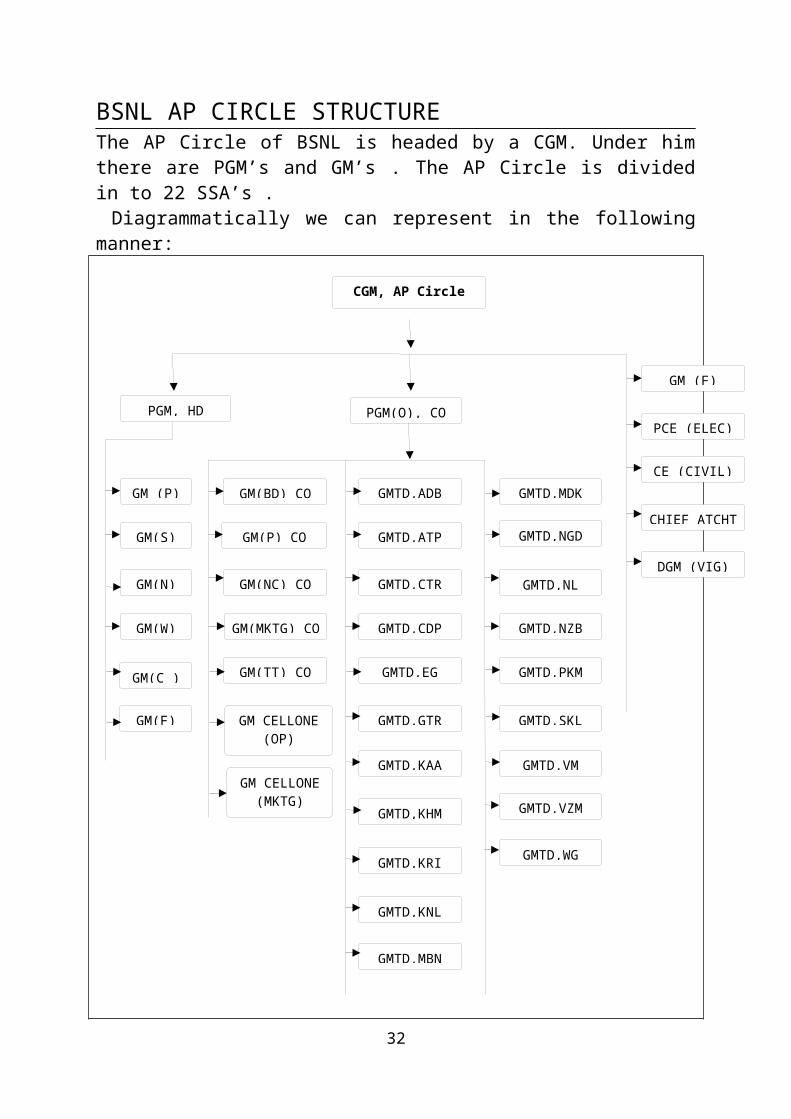
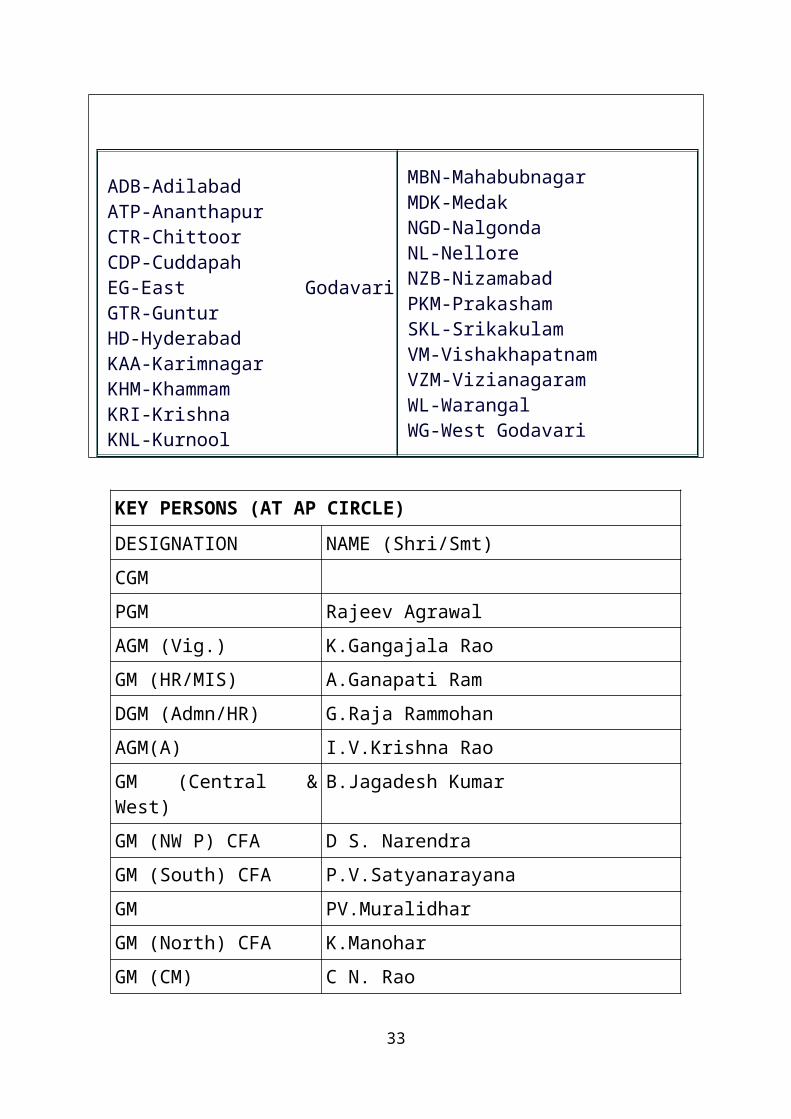
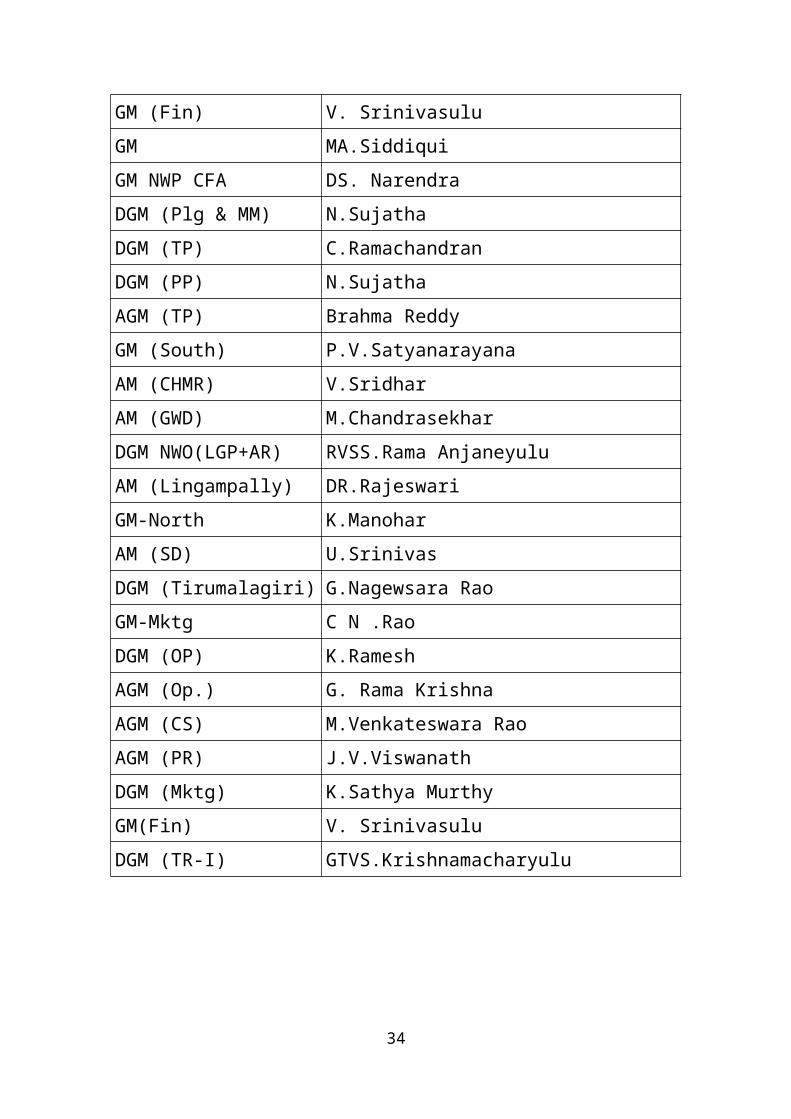
BSNL AP CIRCLE STRUCTUREThe AP Circle of BSNL is headed by a CGM. Under him there are PGM’s and GM’s . The AP Circle is divided in to 22 SSA’s . Diagrammatically we can represent in the following manner:
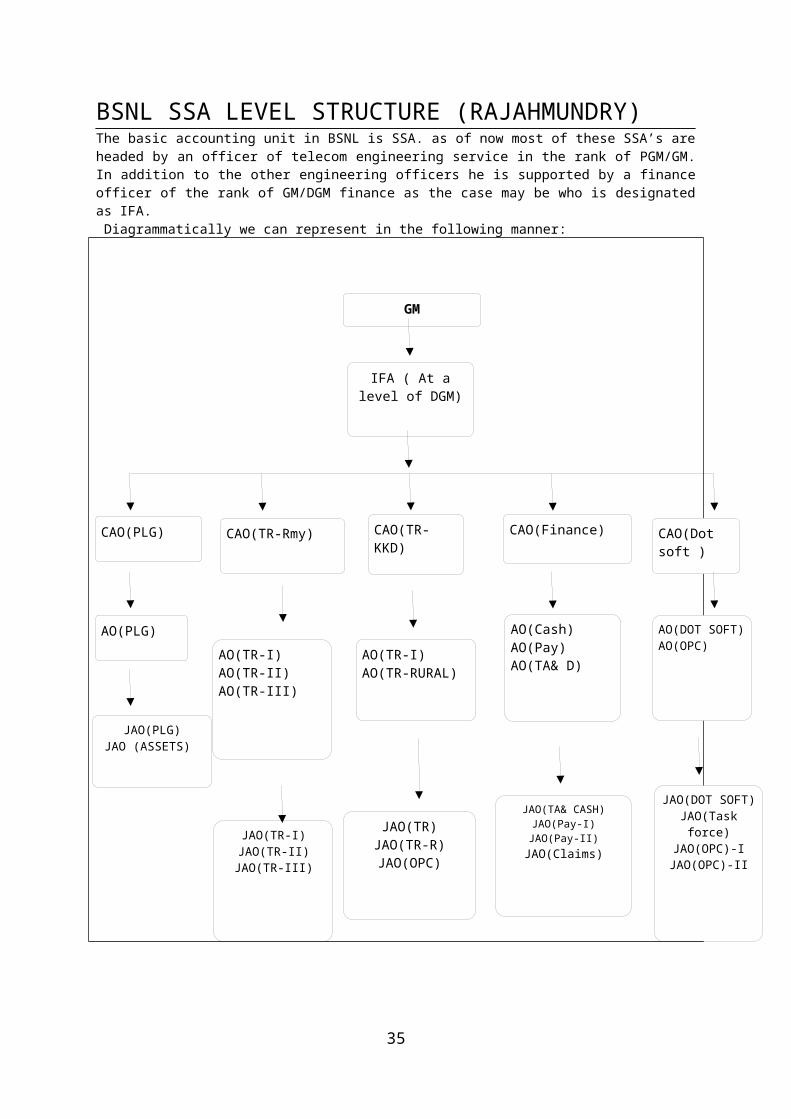
BSNL SSA LEVEL STRUCTURE (RAJAHMUNDRY)The basic accounting unit in BSNL is SSA. as of now most of these SSA’s are headed by an officer of telecom engineering service in the rank of PGM/GM. In addition to the other engineering officers he is supported by a finance officer of the rank of GM/DGM finance as the case may be who is designated as IFA. Diagrammatically we can represent in the following manner:
24
GM
CAO(PLG) CAO(TR-KKD)
CAO(Dot soft )
IFA ( At a level of DGM)
CAO(TR-Rmy) CAO(Finance)
AO(PLG)AO(TR-I)AO(TR-RURAL)
AO(DOT SOFT)AO(OPC)AO(TR-I)
AO(TR-II)AO(TR-III)
AO(Cash)AO(Pay)AO(TA& D)
JAO(PLG)JAO (ASSETS)
JAO(TR)JAO(TR-R)JAO(OPC)
JAO(DOT SOFT)JAO(Task force)
JAO(OPC)-IJAO(OPC)-IIJAO(TR-I)
JAO(TR-II)JAO(TR-III)
JAO(TA& CASH)JAO(Pay-I)JAO(Pay-II)
JAO(Claims)
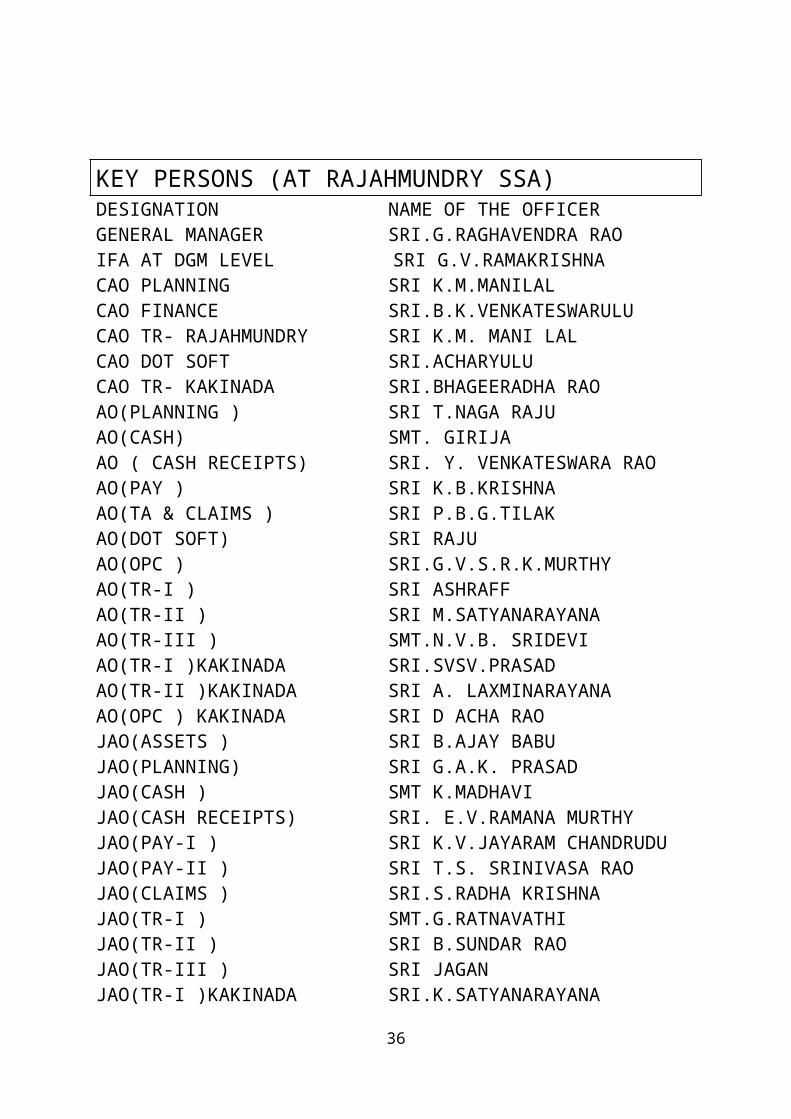
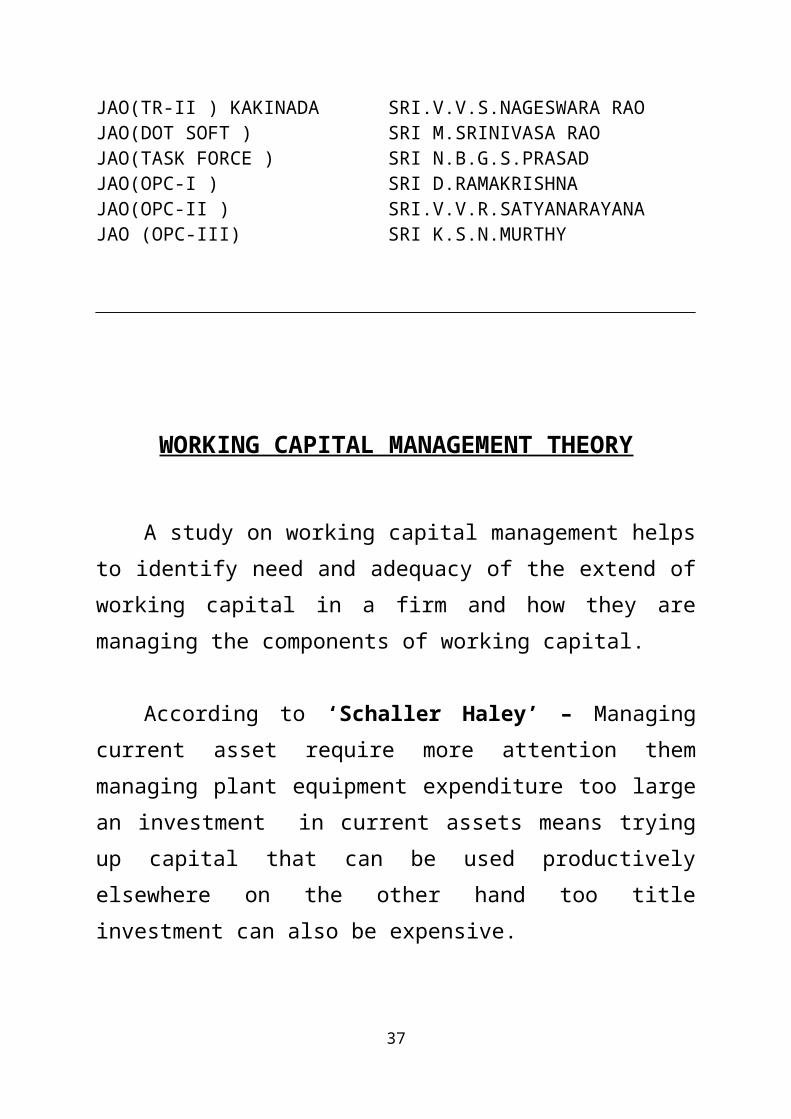
KEY PERSONS (AT RAJAHMUNDRY SSA)DESIGNATION NAME OF THE OFFICERGENERAL MANAGER SRI.G.RAGHAVENDRA RAOIFA AT DGM LEVEL SRI G.V.RAMAKRISHNACAO PLANNING SRI K.M.MANILALCAO FINANCE SRI.B.K.VENKATESWARULUCAO TR- RAJAHMUNDRY SRI K.M. MANI LALCAO DOT SOFT SRI.ACHARYULUCAO TR- KAKINADA SRI.BHAGEERADHA RAOAO(PLANNING ) SRI T.NAGA RAJUAO(CASH) SMT. GIRIJAAO ( CASH RECEIPTS) SRI. Y. VENKATESWARA RAOAO(PAY ) SRI K.B.KRISHNAAO(TA & CLAIMS ) SRI P.B.G.TILAKAO(DOT SOFT) SRI RAJUAO(OPC ) SRI.G.V.S.R.K.MURTHYAO(TR-I ) SRI ASHRAFFAO(TR-II ) SRI M.SATYANARAYANAAO(TR-III ) SMT.N.V.B. SRIDEVIAO(TR-I )KAKINADA SRI.SVSV.PRASADAO(TR-II )KAKINADA SRI A. LAXMINARAYANAAO(OPC ) KAKINADA SRI D ACHA RAOJAO(ASSETS ) SRI B.AJAY BABUJAO(PLANNING) SRI G.A.K. PRASADJAO(CASH ) SMT K.MADHAVIJAO(CASH RECEIPTS) SRI. E.V.RAMANA MURTHYJAO(PAY-I ) SRI K.V.JAYARAM CHANDRUDUJAO(PAY-II ) SRI T.S. SRINIVASA RAOJAO(CLAIMS ) SRI.S.RADHA KRISHNAJAO(TR-I ) SMT.G.RATNAVATHIJAO(TR-II ) SRI B.SUNDAR RAOJAO(TR-III ) SRI JAGANJAO(TR-I )KAKINADA SRI.K.SATYANARAYANAJAO(TR-II ) KAKINADA SRI.V.V.S.NAGESWARA RAOJAO(DOT SOFT ) SRI M.SRINIVASA RAOJAO(TASK FORCE ) SRI N.B.G.S.PRASADJAO(OPC-I ) SRI D.RAMAKRISHNAJAO(OPC-II ) SRI.V.V.R.SATYANARAYANAJAO (OPC-III) SRI K.S.N.MURTHY
25
WORKING CAPITAL MANAGEMENT THEORY
A study on working capital management helps to identify need and adequacy of the extend of working capital in a firm and how they are managing the components of working capital.
According to ‘Schaller Haley’ – Managing current asset require more attention them managing plant equipment expenditure too large an investment in current assets means trying up capital that can be used productively elsewhere on the other hand too title investment can also be expensive.
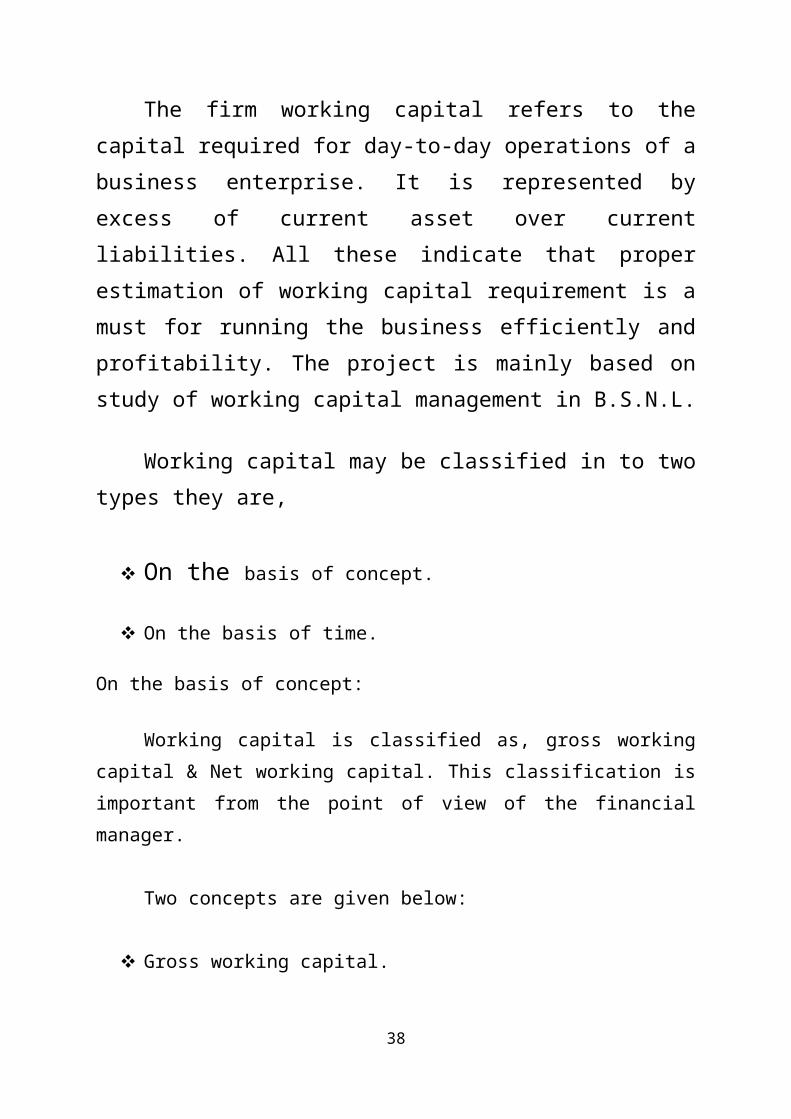
The firm working capital refers to the capital required for day-to-day operations of a business enterprise. It is represented by excess of current asset over current liabilities. All these indicate that proper estimation of working capital requirement is a must for running the business efficiently and profitability. The project is mainly based on study of working capital management in B.S.N.L.
Working capital may be classified in to two types they are,
On the basis of concept.
On the basis of time.
On the basis of concept:
26
Working capital is classified as, gross working capital & Net working capital. This classification is important from the point of view of the financial manager.
Two concepts are given below:
Gross working capital.
Net working capital.
GROSS WORKING CAPITAL:
It refers to the firm’s investment in current assets. Current assent are the
assets, which can be converted in to cash with in an accounting year and include
cash, short-term securities, debtors, bills receivables and stock.
NET WORKING CAPITAL:
It refers to the difference between current assets and current liabilities.
Current liabilities are those claims of out – siders, which are expected to mature
for payment with in an accounting year and include creditors, bills payable,
outstanding expenses. Net working capital can be positive/negative. A positive
working capital will arise when current assets exceed current liabilities. A
negative working capital occurs when current liabilities are in excess of current
assets.
The two concepts of working capital gross and net are not exclusive
rather they have equal significance form the management view point.
On the basis of time working capital may be classified as,
1. Permanent/Fixed working capital
2. Temporary/Variable working capital.
27
1. PERMANENT/FIXED WORKING CAPITAL:
This capital is the minimum amount, which required to ensure effective
utilization of fixed facilities and for maintaining the circulation of current
assets. There is always a minimum level of current assets, which is continuously
required by the enterprise to carry out is normal business operations. Shares,
debentures, public deposits, loans from financial institutions are some examples
of Fixed assets.
2. TEMPORARY (OR) VARIABLE WORKING CAPITAL:
This capital is the amount of working capital, which is required to meet
the seasonal demands and some special exigencies. Variable working capital
can be further classified as seasonal and special working capital. Most of the
companies have to provide additional working capital to meet the seasonal and
commercial paper are the examples of temporary (or) variable working capital.
SCOPE AND LIMITATIONS OF WORKING CAPITAL
MANAGEMENT
Working capital management policies have a great effect on firm’s
profitability liquidity and its structural health. A financial manager therefore
chalk out appropriate working capital management policies in respect of each
the component of working capital management so as to ensure higher
28
profitability, proper liquidity and sound structural health of the organization. In
order to achieve this objective the financial manager has to perform basically
following 2 functions. Estimating the amount of working capital and source
form, which these funds have to be raised.
This project is based on a study working capital management and
includes estimation of the amount of working capital requirements and also
analyzing the source from which these have to be raised. This study is based on
the working capital management help to identify whether the current assets and
liabilities are properly managed and a satisfactory level of working capital is
maintained.
IMPORTANCE/ADVANTGES OF ADEQUATE WORKING CAPITAL
Working capital is the life blood and center of a business. Working
capital is very essential to maintain the smooth running of a business. No
business can run successfully without an adequate amount of working capital.
Some of the advantages of working capital management is given below.
1. Solvency of the business: Adequate working capital enables helps in
maintaining solvency of the business by providing the uninterrupted flow of
production.
2. Goodwill: Sufficient working capital enables a business concern to
make prompt payments and hence help in creating maintaining goodwill.
3. Easy loans : A concern having adequate working capital high solvency
and good credit standing can arrange loans from banks and others on easy and
favorable terms.
4. Cash discounts: Adequate working capital also enables a concern to
avail cash discounts on the purchases and hence it reduces costs.
29
5. Regular supply of raw materials: Sufficient working capital ensures
regular supply of raw materials and continuous production.
6. Regular payment of salaries, wages and other day-to-day
commitments: A company which has sample working can make regular
payment of salaries, wages and other day –to-day commitments which raises the
moral of its employees, increases their efficiently reduces wastages, costs,
enhances production and profits.
7. Exploitation of favorable market conditions: Its only concerns with
adequate working capital can exploit favorable market conditions such as
purchasing its requirements in bulk when the prices are lower and by holding its
inventories for higher prices.
8. Ability to face crisis: Adequate Working capital enables a concern to face business crisis to emergencies such as depression because during such periods, generally they’re in such pressure on working capital.
9. Quick and regular return on investments: Every investor wants a quick and regular return on his investments sufficiency of working capital enables a concern to plough back profits. These gain the confidence of its investors and create a favorable market to raise additional funds in the future.
09. High moral: Adequacy of working capital creates an environment of security confidence high moral and creates overall efficiency in a business.
NEED FOR WORKING CAPITAL
The need for working capital to run the day-to-day business activities cannot be over emphasized. A firm should aim at maximizing the wealth of its shareholders. A firm should earn sufficient return from its operations. Earning a steady amount of profit requires successful sales activity. The firm has to invest enough funds in current assets for generating sales current assets are needed
30
because sales do not convert cash instant raucously. There is always an operating cycle involved in the conversion of sales into cash
DEFINITION OF OPERATING CYCLE:
The time lag between the purchase of raw materials and the collection of cash for sales is referred to as the operating cycle for the company. The time lag between the payment for raw materials purchases and the collection of cash form sales is referred to as cash cycle.
OPERATING CYCLE:
It refers to the time duration required to convert sales after the conversion of resources into inventories, into cash. This cycle involved 3 phases.
ACQUISITION OF RESOURCES:
It refers form such as raw material, labour, power and fuel etc.
MANUFACTURING THE PODUCT:
It includes conversion of raw material into work in progress into finished goods.
SALE OF THE PRODUCT:
It refers from either for cash or on credit for credit sales create accounts receivable for collection.
31
OPERATING CYCLE APPROCH TO WORKING CAPITAL MANAGEMENT:
This is more expressive that the normal business operations of a manufacturing and trading company start with cash go through the successive segments of the operating cycle, viz., raw material storage period, conversion period, finished goods storage period and average collection period before getting back cash along with profit. The total duration of all the segments mentioned above is known as gross operating cycle period.
WORKING CAPITAL OPERATING CYCLE:-
Investment in working capital is influenced by four key events in the production and sales cycle. These events are: purchase of raw materials, payment for their purchase, the sale of finished goods, and collection of cash for the sales made.
OPERATING CYCLE OF THE COMPANY:
The entire sequence of operations in a company can be summarized as follows:
The operating cycle for a company primarily begins with the purchase of raw materials, which are paid after a delay representing the creditor’s payable periods.
These purchased raw materials are then converted by the production unit into finished goods and then sold. The time lag between the purchase of raw materials and the sale of finished goods is known as the inventory period.
Upon sale of finished goods on credit terms, there exists a time lag between the sale of finished goods and the collection of cash on sale. This period is known as the accounts receivables period.
32
THE OPERATING CYCLE CAN BE DEPICTED AS:
The stage between purchase of raw materials and their payment is known as the creditor’s payables period.
The period between purchase of raw materials and production of finished goods is known as the inventory period.
The period between sale of finished goods and the collection of receivables is known at the accounts receivable period.
DETERMINANTS OF WORKING CAPITAL
There are no sets of rules or formulae to determine the working capital requirements of firms. A large number of factors, each having a different importance, influence working capital needs so firms. An analysis of relevant factors should be made in order to determine e total investment in working capital. The description of factors, which generally influence the working capital requirements of firms.
Nature of Business
Sales and Demand Conditions
Credit Policy
33
Technology and Manufacturing policy
Availability of Credit
Operating Efficiency
ESTIMIATING WORKING CAPITAL NEEDS
The most appropriate methods of calculating the working capital needs of
a firm is the concept of operating cycle i.e., a number of other methods may be
used to determine working capital needs in practice. There are 3 types of
approaches applied.
CURRENT ASSETS HOLDING PERIOD
It’s estimate working capital requirements on the basis of average holding
period of current assets and relating them to costs and relating them to costs
based on the company’s experience in the previous years. This method is
essentially based on the operating cycle concept.
RATIO OF SALES:
To estimate working capital requirement as a ratio of sales on the
assumption that current assets change with sales.
RATIO OF FIXED INVESTMENT:
Its estimate working capital requirement as a percentage of fixed
investment.
34
MANAGEMENT OF CASH:
Cash is the important current asset for the operations of the business
possession of cash is necessary because payment of bill has to be made in cash.
If cash is not available in sufficient quantity at proper time obligations
cannot be made in time and the company will become insolvent only cash
management is required to maintain the liquidity position cash management
determines the important factor.
Determination of the necessary minimum cash balance arranging the
method of collection and payment of cash in such a way that only minimum
balance is maintained to invest the surplus cash in temporary investments and
that investments differ from one to another.
FACTORS INFLUENCING WORKING CAPITAL:
The business undertaking should plan its operations in such a way it
should have neither too much nor too little working capital. The total working
capital requirements are determined by a variety of factors. The factors which
determine the quantum of working capital in a business undertaking are as
follows.
General nature of the business-companies which sell a service and the too
for immediate cash, require little working capital. But for a
manufacturing firm which produces a product and sells it on credit basis,
working capital requires is high
Production cycle if the production process is lengthy working capital
required is more and vice-versa.
35
Speed of operating cycle if the speed of operating cycle is slow working
capital needed is high.
Credit terms if the company purchase raw materials on credits basis and
sells finished goods o cash basis, working capital requirements will be
low.
Growth and expansion – Firms with larger growth prospects demand
greater working capital.
Dividend policy – firms pursuing a liberal dividend policy require more
working capital.
Other factors
(a) Production policies
(b) Unpredictability in the availability of raw materials.
(c) Depreciation Policies
(d) Impact of business cycles
(e) Operating efficiency and
(f) Absence of Coordination between production and distribution policies.
WORKING CAPITAL ESTIMATION/FORECAST:
The estimation of working capital requirements is not easy job. A number
of factors have to be considered while estimating working capital. The main
objective of estimating of working capital requirements is either to measure the
cash position of the enterprise or to exercise control over the liquidity position
of concern.
A forecast of working capital requirements can also called a working
capital budget. The main object of preparing a working capital budget is to
secure an effective utilization of the investment in current assets. It shows the
behavior of working with the volume of output or estimated assets.
36
The following factors are to be considered while determining the working
capital.
Total costs incurred on material, wages and overheads.
Length of time the raw materials are to be stored before they are issued
for production.
Length of time required for conversion of raw materials into finished
goods.
Cash required meeting day to day expenses of the business.
Average period of credit allowed to customers.
Average credit period allowed by the suppliers for payments and their
terms & conditions.
Length of sales cycle denoting the period of time finished products have
to stay in the warehouses before sale.
Time lag involved in the payment of wages and overhead expenses.
MOTIVES OF HOLIDING CASH:
A distinguish feature of cash as an asset irrespective of the firm in which
it is held is that it does not earn any substantial return for the business. In spite
of this fact firm holds cash.
TRANSACTIONS MOTIVE:
A form enters into variety of business transaction resulting in both inflow
and outflow of cash in order to meet the business obligations. It is necessary to
maintain adequate cash balance for meeting routine payment.
PRECAUTIONARY MOTIVE:
A firm keeps cash balance to meet unexpected cash need arising out of
unexpected contingencies. The more is the possibility of such contingencies
more is the amount of cash kept by the firm for them.
37
SPECULATIVE MOTIVE:
A firm also keeps cash balance to take advantage of unexpected
opportunities typically outside the normal course of business, which is
speculative.
ACCOUNTS RECEIVABLE MANAGEMENT
Trade credit creates book debts or accounts receivable. It is used as a
marketing tool to maintain or expand the firm’s sales. A firms investment in
accounts receivable depends on volume of credit sales and collection period.
Credit policy includes credit standards, credit and collection efforts.
If the firm has soft standards and sells to almost all customers its sales
may increase but its costs in the form of bad debts losses and credit
administration will also increase. The incremental return, which a firm may gain
by changing its credit policy, should be compared with the cost of funds
invested in receivables.
The cost of funds is related to risk, and then it will increases. The goal of
credit policy is to maximize the shareholders wealth it is neither maximization
of sales nor minimization of bad debt losses cash discounts are given for
receiving payments before than the normal credit period. A firm has to make
efforts to collect payments from customers.
INVENTORY MANAGEMENT
Inventories are stock of the product a company is manufacturing for sale
and components that make up the product. The various forms in which
1inventories exist in a manufacturing company are raw materials; work in
process and finished goods. The objective of inventor’s management is given
below. To maintain a large size of inventory for efficient and smooth production
38
and sales operations. To maintain a minimum investment in inventories to
maximize profitability.
INVENTORY MANAGEMENT TECHNIQUES
Managing inventories the firms objective should be in constantans with
the shareholders wealth maximization principle. Efficiently controlled
inventories make the firm flexible. Inventory control results in unbalanced
inventory and inflexibility. This increases the level of investment and makes the
firm unprofitable.
CASH MANAGEMENT
Cash is required to meet a firms transactions and precautionary needs.
The term cash includes coin, currency, cheques held by the firm and balances in
its bank accounts. Cash is the most liquid form of asset. It is the ready money
available in the bank or with the business, essential for its operations.
The following short-term investment opportunities are available to companies in India to invest their temporary cash surplus. Treasury bills are short-term government securities. The difference between the issue price and redemption price adjusted for the time value of money is return on treasury bills. Commercial papers are short-term unsecured securities issued by highly credit worthy large companies. They are issued with a maturity of 3 months to 1 year. Earning per share are marketable securities and therefore liquidity is not a problem.
Certificates of deposits are papers issued by banks acknowledging fixed deposits for a specific period of time. Certificates of deposits are negotiable instruments that make them marketable securities. A firm can deposit its
39
temporary cash in a bank for a fixed period of time. The interest rate depends on the maturity period.
Money market mutual funds focus on short-term marketable securities such as TBs, CPs, or call money, MMMFs, have been recently offered by Kothari pioneer, UTI IDBI. A minimum lock an investor can withdraw the money any time at a short notice or even across the counter in some cases.A company needs cash for the following three purposes:
CASH FLOWS:
The flow of cash into and out of the business over a period of time refers to cash flow. Cash inflow can be in the form of cash received from customers, lenders and investors. Cash outflow can arise as a result of payments made to employees (salaries), suppliers and creditors.
Positive cash flow: When cash inflow exceeds outflow it results in
positive cash flows. Positive cash flow is beneficial to the business, the
only thing to be cautious about is the opportunity cost, incurred as a
result of idle money.
Negative cash flow: Negative cash flows arise when cash out flow
exceeds inflows. This can be due to various reasons. For example, if
inventory management is not optimal; or the collection of money from
accounts receivable is very poor.
40
COMPONENTS OF CASH FLOWS
Cash flow can be earned from both external and internal sources. These
include:
Operating cash flows: Operating cash flow, often referred to as working
capital, is generated form internal operations. It is the cash generated
from the sale of a product or service of a particular business. As it is the
lifeblood of a business firm, it is monitored carefully.
Investing cash flow: Investing cash flow is generated internally form non-
operating activities. This component would include investments in plant
and equipment or other fixed assets, non-recurring gains or losses, or
other sources and uses of cash outside of normal operations.
Financing cash flow: financing cash flow is the cash to and from external
sources, such as lenders, investors and share holders. A new loan, the
repayment of a loan, the issuance of stock and the payment of dividend
are some of the activities that would be included in this section of the
cash flow statement.
CASH MANAGEMENT:
It involves the following:
Identify sources of cash flows.
Identifying various avenues to invest surplus.
Being prepared to meet any cash contingencies.
A cash crisis can be pre-empted by preparing cash budget. This involves
short-term cash forecasting (weekly, monthly and annually) to help manager
41
daily a cash, and long term (annual, 3-5 year) cash flow projections to
develop the necessary capital strategy to meet business needs
CASH BUDETING:
Cash budgeting includes short-term forecasting, which can be effectively
managed by the receipt and payment method. This method indicates the
timing and magnitude of expected cash flows over the forecast period. To
prepare a short-term cash flow projection under this method, the account
balance is added to the cash that is expected to be received within the period,
then cash outflows during the same time period are subtracted.
ABC ANALYSIS:
Where there are a large number of item in the inventory it becomes
essential to have an efficient control over all items of stores. However
comparatively greater are should be given to the higher values. The
movement of certain service concern may consist of a small number of
minor portion of inventory value. The modern technique for collecting the
inventory is a value item analysis popularly known as ‘ABC’ analysis that
attempts to relate how the inventory value concentrated among the individual
items.
CATEGORY A:
Which includes the most important item which represents about 60% to
70% of value of stores but constitute only 09% to 15% of items.
CATEGORY B:
Which includes less important items representing an investment value of
20% to 25% and constitutes a similar percentage of items.
42
CATEGORY C:
Which constitutes of the least important items of stores and constitutes
60% to 70% of stores item representing only a capital investment between 09%
to 15%
EOQ ANALYSIS:
A strategic factor in the inventory management is the consumption of the
optimum size of normal purchase order.
Decision about how much to order has great significance in inventory
management the quantity to be purchased should neither be small nor big
because costs of buying and carrying material are very high. EOQ is the
quantity of the material, which can be purchased with minimum costs.
RATIO ANALYSIS
Despite the usual limitations associated with ratios, ratio analysis is still
popular among financial analysts. This is mainly attributable to the simplicity in
calculation and indication of the direction in which further probing is necessary.
We shall briefly outline below some of important ratios that can be used for the
efficiency of working capital management.
They are:
43
Liquidity Ratio
Proprietary Ratio
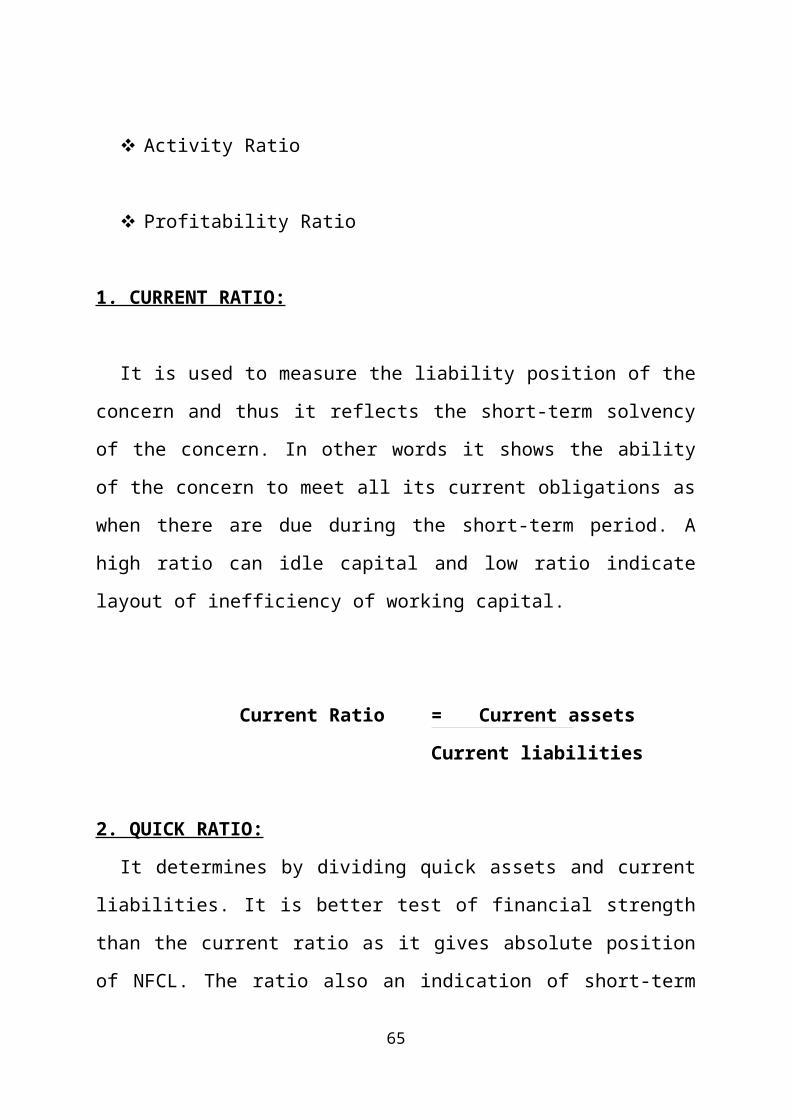
Activity Ratio
Profitability Ratio
1. CURRENT RATIO:
It is used to measure the liability position of the concern and thus it reflects
the short-term solvency of the concern. In other words it shows the ability of the
concern to meet all its current obligations as when there are due during the
short-term period. A high ratio can idle capital and low ratio indicate layout of
inefficiency of working capital.
Current Ratio = Current assets
Current liabilities
2. QUICK RATIO:
It determines by dividing quick assets and current liabilities. It is better test
of financial strength than the current ratio as it gives absolute position of NFCL.
The ratio also an indication of short-term solvency of the company. The idle
ratio 1:1 then the working capital is in good condition. If working capitals
increase the cost of production also increases.
Quick Ration = Current Assets – Inventories
Quick liabilities
44
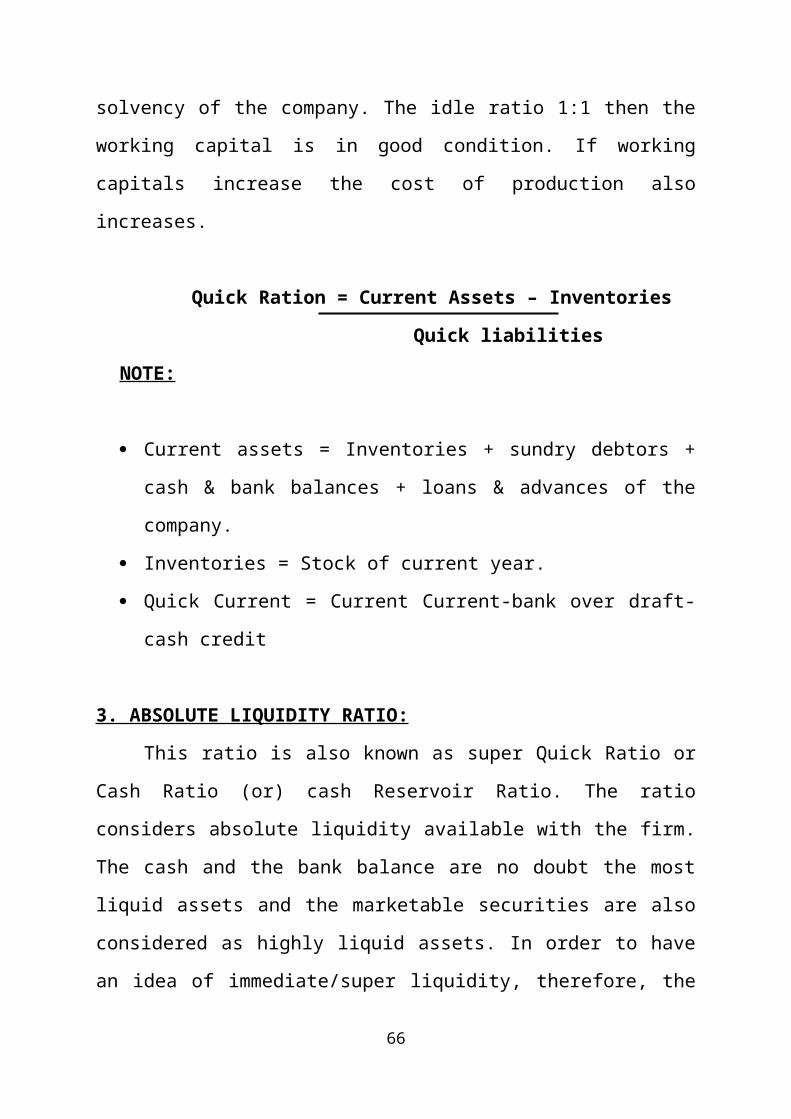
NOTE:
Current assets = Inventories + sundry debtors + cash & bank balances +
loans & advances of the company.
Inventories = Stock of current year.
Quick Current = Current Current-bank over draft-cash credit
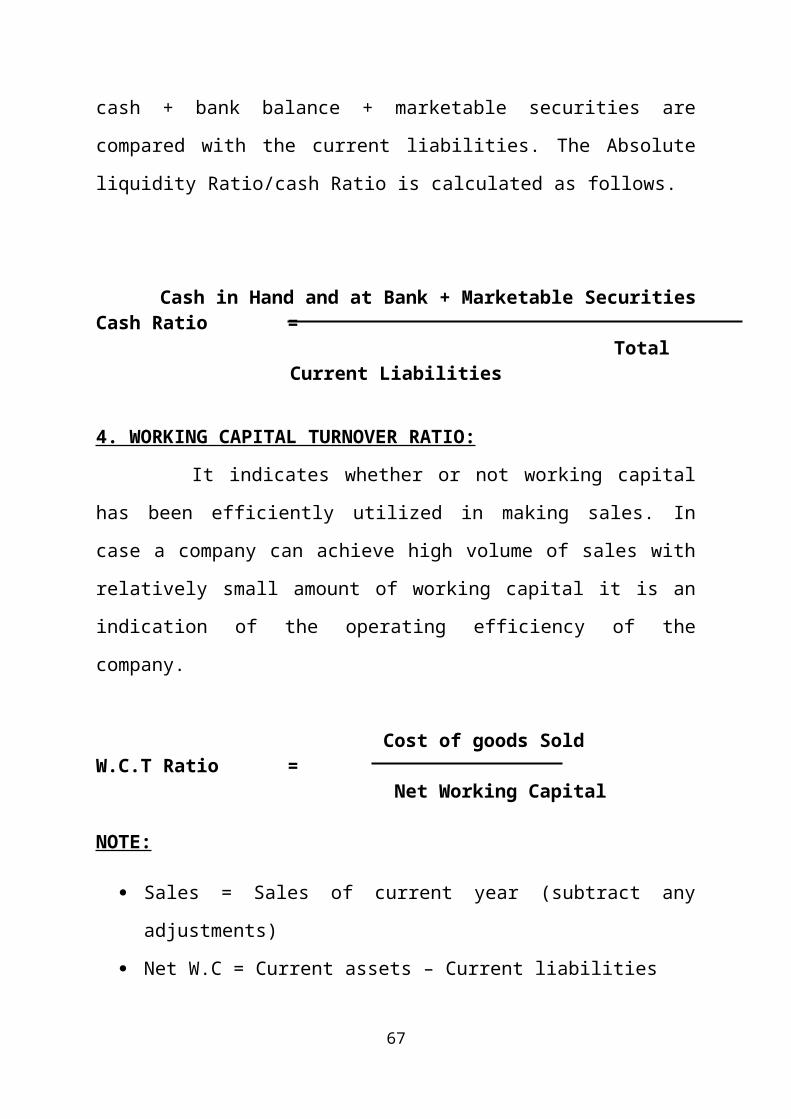
3. ABSOLUTE LIQUIDITY RATIO:
This ratio is also known as super Quick Ratio or Cash Ratio (or) cash
Reservoir Ratio. The ratio considers absolute liquidity available with the firm.
The cash and the bank balance are no doubt the most liquid assets and the
marketable securities are also considered as highly liquid assets. In order to
have an idea of immediate/super liquidity, therefore, the cash + bank balance +
marketable securities are compared with the current liabilities. The Absolute
liquidity Ratio/cash Ratio is calculated as follows.
Cash in Hand and at Bank + Marketable SecuritiesCash Ratio =
Total Current Liabilities
4. WORKING CAPITAL TURNOVER RATIO:
It indicates whether or not working capital has been efficiently
utilized in making sales. In case a company can achieve high volume of sales
with relatively small amount of working capital it is an indication of the
operating efficiency of the company.
Cost of goods SoldW.C.T Ratio =
Net Working Capital
45
NOTE:
Sales = Sales of current year (subtract any adjustments)
Net W.C = Current assets – Current liabilities
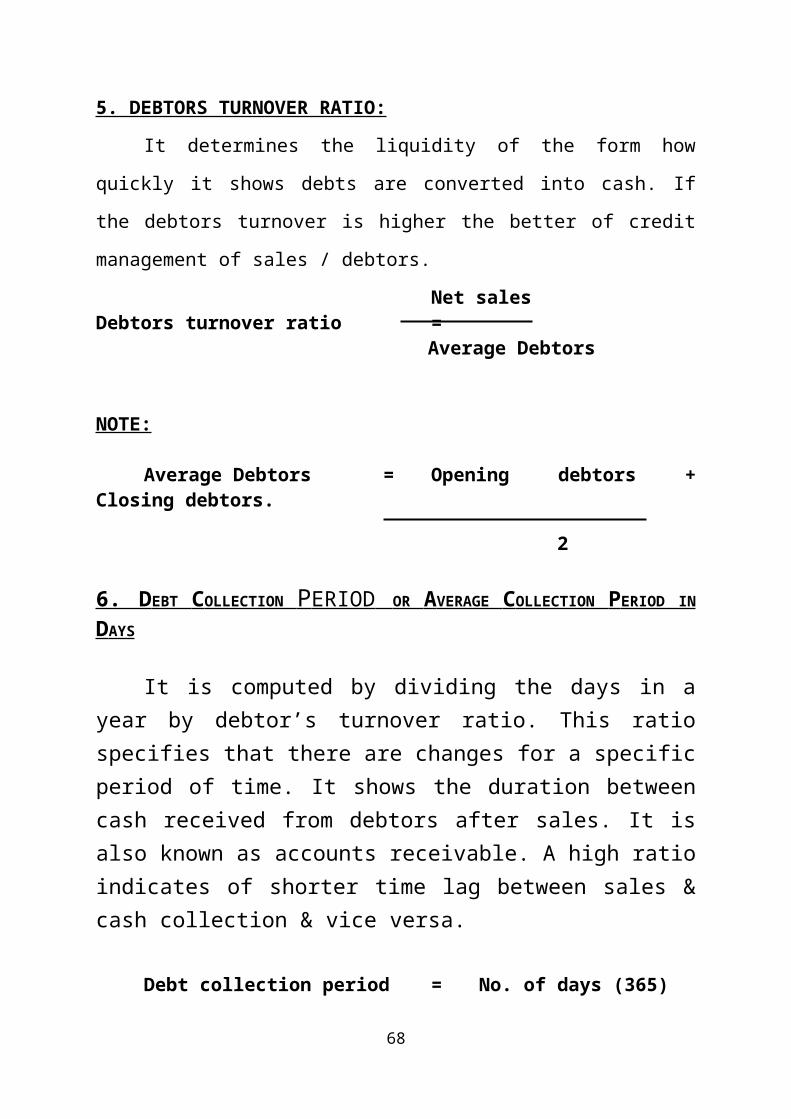
5. DEBTORS TURNOVER RATIO:
It determines the liquidity of the form how quickly it shows debts are
converted into cash. If the debtors turnover is higher the better of credit
management of sales / debtors.
Net salesDebtors turnover ratio =
Average Debtors
NOTE:
Average Debtors = Opening debtors + Closing debtors. 2
6. D EBT C OLLECTION P ERIOD OR A VERAGE C OLLECTION P ERIOD IN D AYS
It is computed by dividing the days in a year by debtor’s turnover ratio. This ratio specifies that there are changes for a specific period of time. It shows the duration between cash received from debtors after sales. It is also known as accounts receivable. A high ratio indicates of shorter time lag between sales & cash collection & vice versa.
Debt collection period = No. of days (365) Debtor’s turnover ratio
46
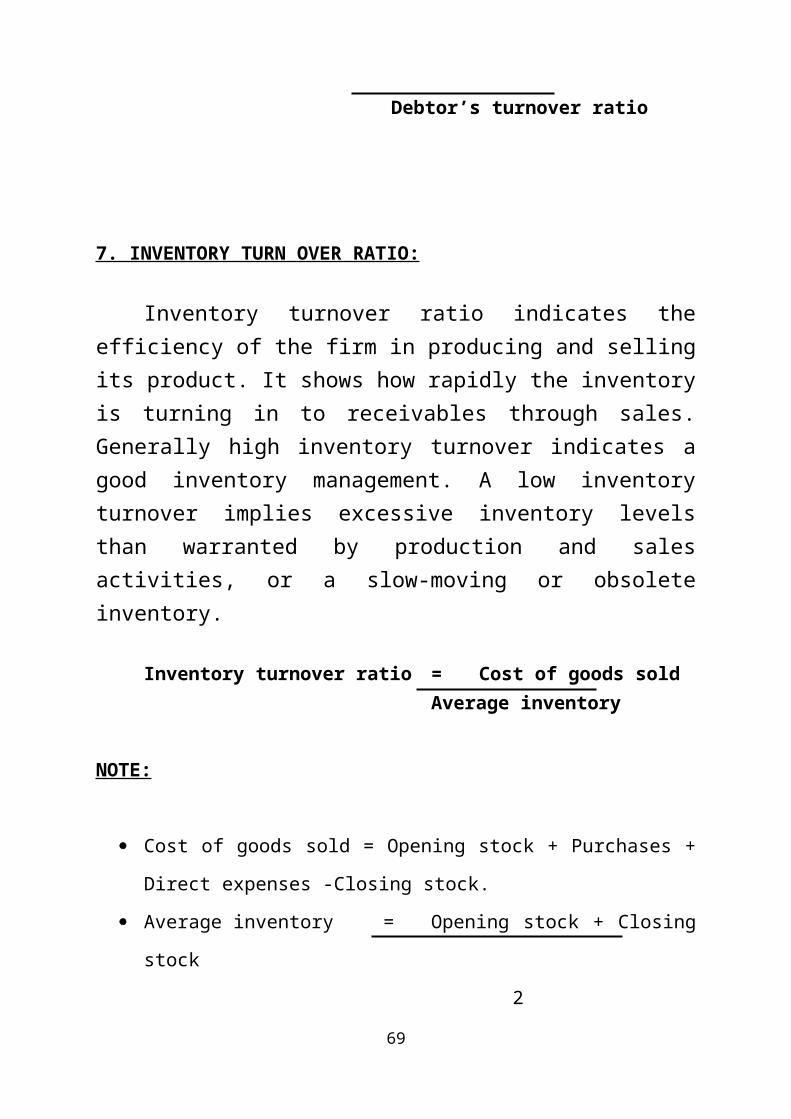
7. INVENTORY TURN OVER RATIO:
Inventory turnover ratio indicates the efficiency of the firm in producing and selling its product. It shows how rapidly the inventory is turning in to receivables through sales. Generally high inventory turnover indicates a good inventory management. A low inventory turnover implies excessive inventory levels than warranted by production and sales activities, or a slow-moving or obsolete inventory.
Inventory turnover ratio = Cost of goods sold Average inventory
NOTE:
Cost of goods sold = Opening stock + Purchases + Direct expenses -
Closing stock.
Average inventory = Opening stock + Closing stock
2
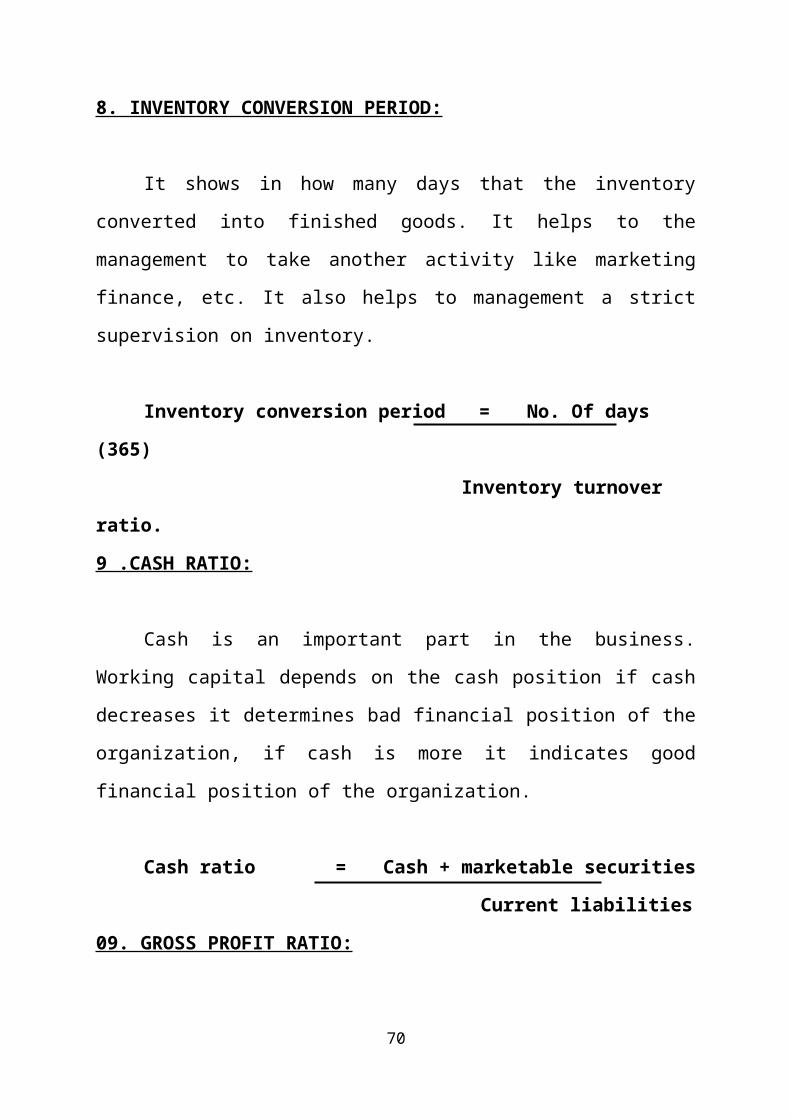
8. INVENTORY CONVERSION PERIOD:
It shows in how many days that the inventory converted into finished
goods. It helps to the management to take another activity like marketing
finance, etc. It also helps to management a strict supervision on inventory.
Inventory conversion period = No. Of days (365)
Inventory turnover ratio.
9 .CASH RATIO:
Cash is an important part in the business. Working capital depends on the
cash position if cash decreases it determines bad financial position of the
47
organization, if cash is more it indicates good financial position of the
organization.
Cash ratio = Cash + marketable securities
Current liabilities
09. GROSS PROFIT RATIO:
This is the ratio of gross profit to net sales and expressed as a percentage
gross profit ratio is real test of profitability and solvency of the organization. It
Sales = sales of current year (subtract any adjustments)
10. NET PROFIT RATIO:
This is the ratio of net profit to sales and is also expressed as a
percentage. It indicates the amount of sales left for share holders after all cost
and expenses have been met.
Net profit ratio = Net profit
Sales *090
NOTE:
Net profit = Profit after tax.
Sales =Sales of current year (subtract any adjustments)
48
12. EARNING PER SHARE:
Shareholders investment can also be measured in, many other ways. One
such measure is to calculate the earnings per share. Profit after tax divided by
number of common shares outstanding.
Earning per share = Net profit
No. Of equity shares
13. CREDITORS TURN OVER RATIO:
It is very important on the organization point of view because it helps to find the payment period to creditors after purchases. It shows the financial position of the company to clear its debts. It is opposite to debtors. Creditors is the first stage of the company i.e., purchases of raw materials.
Creditors turnover ratio = purchases. Average creditors
NOTE:
Purchases = Purchases of the company (Subtract any returns)
Average creditors = Opening creditors + closing creditors2
49
14. MANAGEMENT OF ACCOUNTS PAYABLES:
This is as much important of accounts receivable. The objective of accounts payable is to slow down the payment process as much as possible. The finance manager to ensure that payment to the creditors are made as the stipulated time periods after obtaining the best credit terms possible.
Creditors collection period = No. of days (365) Creditor’s turnover ratio
15. RETURN ON INVESTMENT RATIO:
Return on shareholder’s equity is calculated to see the profitability of the owners’ investment. It indicates how the firm has used the resources of owners. The earning satisfactory return is the most desirable object of the business.
Return on Investment = Return Capital Employed *090
16. TOTAL DEBT RATIO:
It expresses the relationship between total Debt and capital employed. This shows the extent in which debt financing has been used in the business. The utilization of debt is satisfying.
Total Debt Ratio = Total Debt Capital Employed
50
17. TOTAL DEBT EQUITY RATIO:
It reflects the relative claims of creditors and share holders against the assets of the business. Debt, usually, refers to long-term liabilities. Equity includes preference share capital and reserves.
Debt equity ratio = EBIT Interest
18. INTEREST COVERAGE RATIO:This interest coverage ratio is computed by dividing earnings before
interest and taxed by interest charge. The interest coverage ratio shows the number of times the interest charges are covered by funds that are or demurely available for their payment. A high ratio is desirable but too high ratio indicates that the firm very conservative in using debt and that is not using credit to the debt advantage of shareholder.
Interest coverage ratio= EBIT Interest
NOTE:
EBIT = Interest on financing + provision for tax (Current year)ADVANTAGES OF RATIOS:
The ratio analysis is one of the most powerful tools of financial analysis. It is used as a device to analyze and interpret the financial health of the business enterprise. The following are the important managerial uses of ratio analysis.
It is helpful in assessing the financial position and profitability of a concern
It simplifies the complex financial data. It reveals the changes in the Financial condition of the business.
51
It helps the management in decision making. It throws light on the degree of efficiency of management and utilization of assets
It helps in forecasting and planning over a period of time. A firm develops certain norms that may indicate future success or failure
It facilitates the functions of communication and enhances the value of financial data, inter firm comparison is made possible.
It may be used as a measure of efficiency. Since ratios bring uniformity in the financial data, inter firm comparison is made possible
It helps the investors in taking investments decisions to make profitable investment
It helps to know the relationship between different related items of financial statements
It helps in analyzing and interpreting the financial health of the enterprise
It is calculated basing upon past results so it helps the management to frame sound business policies for business in future
LIMITATIONS OF RATIOS:
Ratios analysis is one of the most powerful tools of financial analysis. Though ratios offer various advantages they suffer with the following limitations.
Limited use of single ratio
Lack of well accepted standards
52
Lack of reliability of data
Change in accounting procedure adopted by a firm makes ratio analysis more misleading
Since the size, nature, accounting procedures differ from business to business ration analysis makes comparison more difficult.
Due to changes in the price level of various years, comparison of ratios of such years cannot give current conclusions. Any changes in price level can seriously affect the validity of comparison of ratios computed for different periods. It ignores the qualitative factors which generally influence the conclusions derive.
53
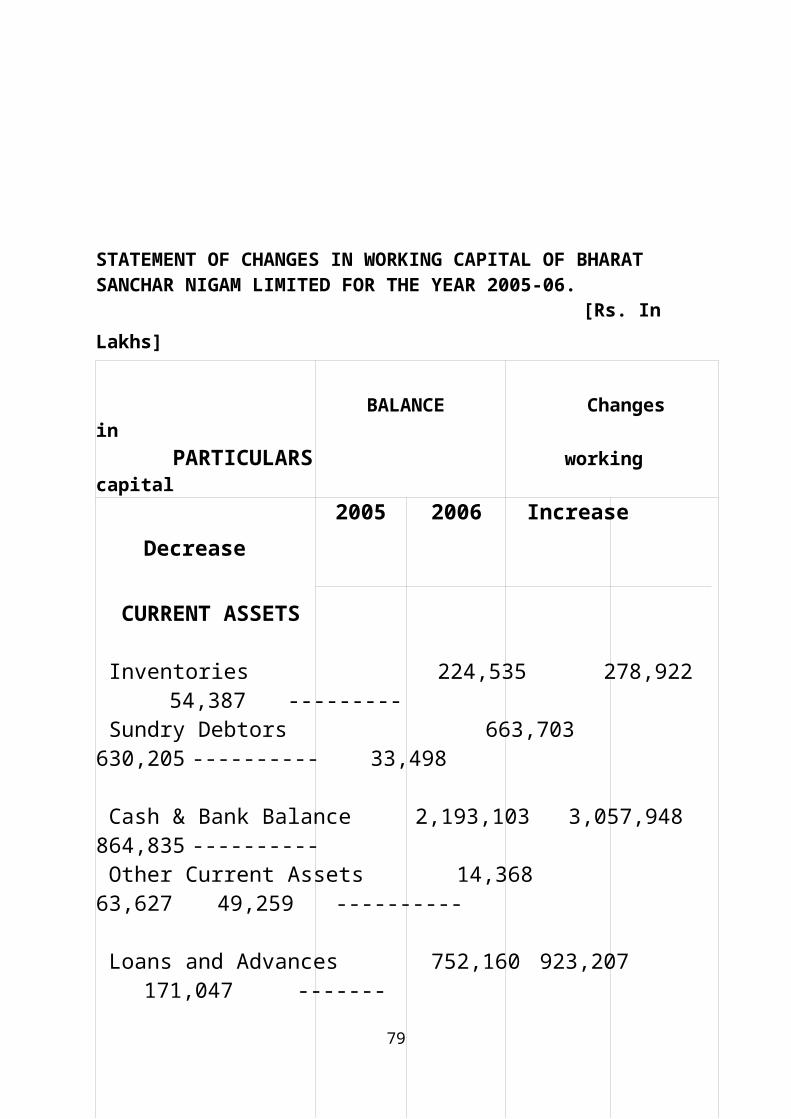
STATEMENT OF CHANGES IN WORKING CAPITAL OF BHARAT SANCHAR NIGAM LIMITED FOR THE YEAR 2005-06.
Cash & Bank Balance 2,193,103 3,057,948 864,835 ---------- Other Current Assets 14,368 63,627 49,259 ----------
Loans and Advances 752,160 923,207 171,047 -------
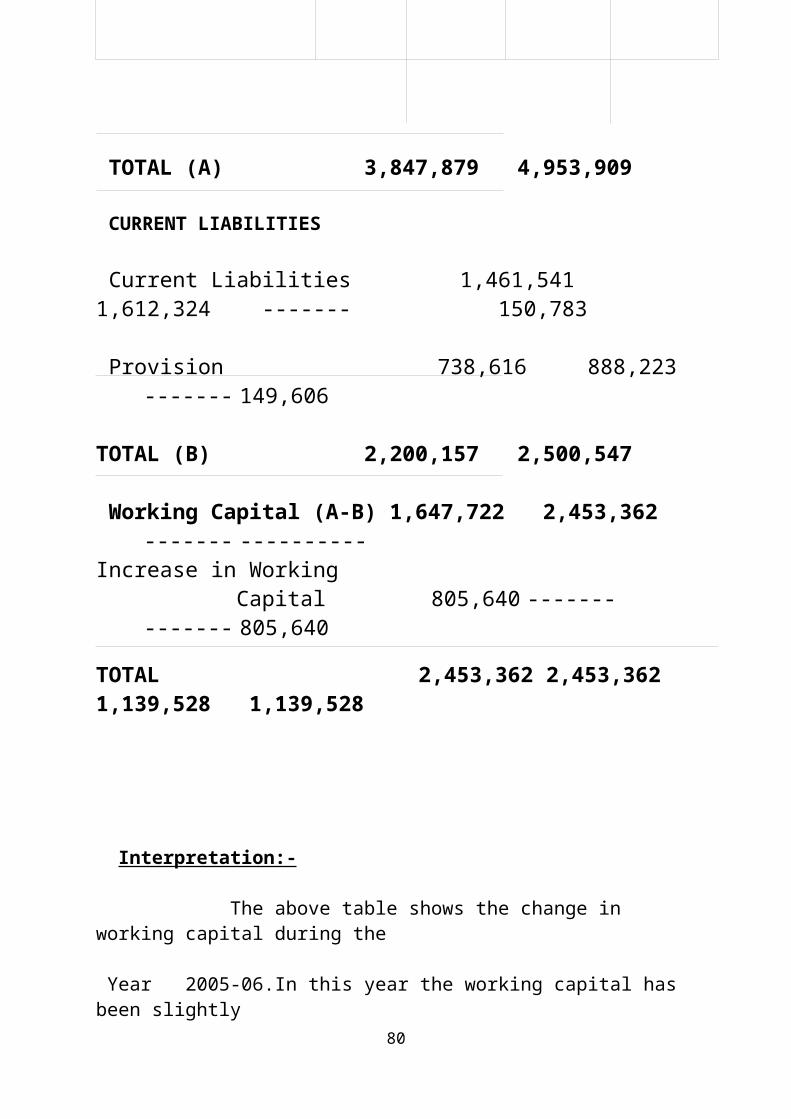
TOTAL (A) 3,847,879 4,953,909
CURRENT LIABILITIES
Current Liabilities 1,461,541 1,612,324 ------- 150,783
Provision 738,616 888,223 ------- 149,606
TOTAL (B) 2,200,157 2,500,547
Working Capital (A-B) 1,647,722 2,453,362 ------- ----------Increase in Working Capital 805,640 ------- ------- 805,640
TOTAL 2,453,362 2,453,362 1,139,528 1,139,528
54
Interpretation:-
The above table shows the change in working capital during the
Year 2005-06.In this year the working capital has been slightly
Increased to 805,640.it is mainly decreased the creditors of the current
Liabilities and current assets also. So it has to increase the current assets.
STATEMENT OF CHANGES IN WORKING CAPITAL OF BHARAT SANCHAR NIGAM LIMITED FOR THE YEAR 2006-07
55
[Rs. In Lakhs]
BALANCE Changes in PARTICULARS working capital
2006 2007 Increase Decrease
CURRENT ASSETS
Inventories 278,922 242,847 --------- 36,065
Sundry Debtors 630,205 558,066 --------- 72,139
Cash & Bank Balance 3,057,948 3,745,296 687,348 ---------- Other Current Assets 63,627 104,148 50,521 ----------
Loans and Advances 923,207 714,431 ------- 207,776
TOTAL (A) 4,953,909 5,374,788
CURRENT LIABILITIES
Current Liabilities 1,612,324 1,667,919 ------- 55,595
Provision 888,223 514,858 373,365 --------
TOTAL (B) 2,500,547 2,182,777 ------- ----------
Working Capital (A-B) 2,453,362 3,192,010 ------- ----------
Increase in Working Capital 738,649 ------- ------- 738,649
TOTAL 3,192,010 3,192,010 1,101,234 1,101,234
Interpretation:-
The above table shows the change in working capital during the
56
year 2006-07.In this year the working capital has been slightly
increased to 738,649.It is mainly decreased the creditors of the current
liabilities and current assets also. So it has to increase the current assets.
STATEMENT OF CHANGES IN WORKING CAPITAL OF BHARAT SANCHAR NIGAM LIMITED FOR THE YEAR 2007-08.
[Rs. In Lakhs]
BALANCE Changes in 57
PARTICULARS working capital2007 2008 Increase Decrease
CURRENT ASSETS
Inventories 242,847 322,006 79,159 ---------
Sundry Debtors 558,066 546,551 --------- 10,515
Cash & Bank Balance 3,745,296 4,055,158 308,862 --------
Other Current Assets 104,148 137,687 23,539 --------
Loans and Advances 714,431 744,441 30,009 ---------
TOTAL (A) 5,374,788 5,805,843
CURRENT LIABILITIES
Current Liabilities 1,667,919 1,739,788 --------- 71,869
Provision 514,858 606,321 --------- 91,463
TOTAL (B) 2,182,777 2,346,098
Working Capital (A-B) 3,192,010 3,459,734 ------- ----------
Increase in Working Capital 267,723 ------- ------ 267,723
TOTAL 3,459,734 3,459,734 442,570 442,570
Interpretation:-
The above table shows the change in working capital during the
year 2007-08.in this year the working capital has been slightly
58
increased to 267,723.It is mainly decreased the creditors of the current
liabilities and current assets also. So it has to increase the current assets.
STATEMENT OF CHANGES IN WORKING CAPITAL OF BHARAT SANCHAR NIGAM LIMITED FOR THE YEAR 2008-09.
[Rs. In Lakhs]
BALANCE Changes in PARTICULARS working capital
59
2008 2009 Increase Decrease
CURRENT ASSETS
Inventories 322,006 457,258 135,252 --------
Sundry Debtors 546,551 472,054 -------- 74,497
Cash & Bank Balance 4,055,158 3,813,430 -------- 241,728
Other Current Assets 137,687 87,239 -------- 50,448
Loans and Advances 744,441 944,880 200,439 ---------
TOTAL (A) 5,805,843 5,774,861
CURRENT LIABILITIES
Current Liabilities 1,739,788 2,062,702 ------ 332,914
Provision 606,321 493,878 102,443 -------
TOTAL (B) 2,346,098 2,566,580
Working Capital (A-B) 3,459,734 3,207,281 ------- --------
Decrease in Working Capital -------- 251,453 251,453 ------
TOTAL 3,459,734 3,459,734 699,587 699,587
Interpretation:-
The above table shows the change in working capital during the year 2008-2009.in this year the working capital has been slightly decreased to 251,453. The main cause of decrease in working capital is decrease in cash & bank balance.
60
STATEMENT OF CHANGES IN WORKING CAPITAL OF BHARAT SANCHAR NIGAM LIMITED FOR THE YEAR 2009-10.
[Rs. In Lakhs]
BALANCE Changes in PARTICULARS working capital
2009 2010 Increase Decrease
61
CURRENT ASSETS
Inventories 457,258 505,833 48,575 ---------
Sundry Debtors 472,054 474,457 2,403 ---------
Cash & Bank Balance 3,813,430 3,034,340 -------- 779,080
Other Current Assets 87,239 85,521 -------- 1,718
Loans and Advances 944,880 1,397,028 452,148 ---------
TOTAL (A) 5,774,861 5,497,179
CURRENT LIABILITIES
Current Liabilities 2,062,702 4,277,642 ------ 2,204,940
Provision 493,878 557,602 ----- 63,724
TOTAL (B) 2,566,580 4,835,244 --------- --------
Working Capital (A-B) 3,207,281 661,935 ------- --------
decrease in Working Capital -------- 2,546,346 2,546,346 ------
TOTAL 3,207,281 3,207,281 3,049,472 3,049,472
Interpretation:-
The above table shows the change in working capital during theYear 2009-2010.in this year the working capital has been slightly decreased to 2,546,346 .it will be happened due to increase in the current liabilities and decrease in cash & bank balance.
( Rs in Lakhs)2005-06 2,453,362 2006-07 3,192,010 2007-08 3,459,734
64
2008-09 3,207,2812009-10 661,935
2005-06 2006-07 2007-08 2008-09 2009-100
500000
1000000
1500000
2000000
2500000
3000000
3500000
4000000
Net working capital
Net working capital
LIQUIDITY RATIOS
a) Current Ratio
65
Current Ratio = Current Assets Current Liabilities
Year Currents Assets Current Liabilities Ratio
2005-06 `4,953,908 2,500,547 1.98
2006-07 5,374,788 2,182,777 2.46
2007-08 5,805,843 2,346,098 2.47
2008-09 5,744,861 2,566,580 2.24
2009-10 5,497,179 4,835,244 1.13
INTERPRETATION:
The current ratio is calculated by dividing current assets with current
liabilities. It is a measure of firm’s short-term solvency. As conventional rules a
current ratio of 2:1 is satisfactory
Bharat Sanchar Nigam ltd has a current ratio in the year 2005-06 it was
1.98 after 2005-06 it was in increasing trend but during in the year 2009-10 the
ratio is 1.13 which is below the standard ratio.
CURRENT RATIO
66
2005-06 2006-07 2007-08 2008-09 2009-100
0.5
1
1.5
2
2.5
3
Series 1
67
b) Quick Ratio
Quick Ratio = Quick Assets Quick Liabilities
Year Quick Assets Quick Liabilities Ratio
2005-06 4,674,987 2,500,547 1.87
2006-07 5,131,941 2,182,777 2.35
2007-08 5,483,837 2,346,098 2.34
2008-09 5,317,603 2,566,580 2.06
2009-10 4,991,346 4,835,244 1.03
INTERPRETATION:
This ratio establishes relationship between the quick assets & current
liabilities. As asset is liquid if it can be converted into cash immediately or
reasonably soon without loss of value. The accepted standard is 1:1
The quick ratio of Bharat Sanchar Nigam ltd was favorable in the years of
2005-06 as 1.87 after 2005-06 it was in increasing trend but during in the year
2009-10 the ratio is 1.03 which is approximate to standard ratio.
b) Quick Ratio
68
2005-06 2006-07 2007-08 2008-09 2009-100
0.5
1
1.5
2
2.5
C) Absolute Liquidity Ratio
69
Absolute Liquidity Ratio = CashCurrent Liabilities
Year Cash Current Liabilities Ratio
2005-06 3,057,948 2,500,547 1.22
2006-07 3,745,296 2,182,777 1.71
2007-08 4,055,158 2,346,098 1.73
2008-09 3,813,430 2,566,580 1.48
2009-10 3,034,340 4,835,244 0.63
INTERPRETATION:
The ratio establishes the relationship between cash and current liabilities. Cash is the most or absolute liquid asset for any firm. The accepted standard ratio is 1:2.
The absolute liquidity ratio of Bharat Sanchar Nigam ltd was above mark during all the years. From the year 2005-06, it shows an increasing trend up to next two year but in the year of 2008-09 it started decreasing in the year 2009-10 it comes to 0.63 due to increase in current liabilities.
ABSOLUTE LIQUID RATIO
70
2005-06 2006-07 2007-08 2008-09 2009-100
0.2
0.4
0.6
0.8
1
1.2
1.4
1.6
1.8
2
II.INVENTORY TURNOVER RATIOS
71
a) Inventory Turnover Ratio
Inventory Turnover Ratio = Cost of services Average Inventory
Year Cost of services Average Inventory Ratio
2005-06 3,613,894 251,728.5 14.35
2006-07 3,461,621 260,884.5 13.26
2007-08 3,235,953 282,426.5 10.45
2008-09 3,026,857 389,632 7.77
2009-10 2,791,344 481545.5 5.80
INTERPRETATION:
The ratio indicates the efficiency of the in selling its product. It is calculated by dividing the cost of goods sold with average inventory.
For Bharat Sanchar Nigam limited, the efficiency is decreasing. In the year of 2005-06 it is 14.35, which is highest recorded. After that it went on decreasing to lowest of 5.80 in 2009-10. It shows that there is no proper control over the inventory by the management.
INVENTORY TURNOVER RATIO
72
2005-06 2006-07 2007-08 2008-09 2009-100
2
4
6
8
10
12
14
16
b) Holding period Return:
73
Holding Period = 365ITR
Year Number of Days in Year
Inventory Turnover Ratio(Services)
Holding Period Return
2005-06 365 14.35 25.43
2006-07 365 13.26 27.53
2007-08 365 10.45 31.88
2008-09 365 7.77 46.97
2009-10 365 5.80 62.93
INTERPRETATION:
The ratio indicated the speed with which the stock or inventory gets
converted into cash i.e., sales the lower the period, the better liquidity of the
inventory.
Bharat Sanchar Nigam limited showed a holding period return of nearly
25.43 days in the year of 2005– 06, which is very better then compare to other
years. Then it is gradually increased to 62.93 days in 2009-10, which means the
conversion speed of stock or inventory in to cash is decreased.
HOLDING PERIOD RETURN
74
2005-06 2006-07 2007-08 2008-09 2009-100
10
20
30
40
50
60
70
Series 1
Series 1
c) Statement showing changes in stock at the end of the year:
75
Year Opening Stock Closing Stock Increase/Decrease
2005-06 224,535 278,922 54,387
2006-07 278,922 242,847 36,065
2007-08 242,847 322,006 79,159
2008-09 322,006 457,258 135,252
2009-10 457,258 505,833 48,575
INTERPRETATION:
The above statement showing the relation between opening stock and
closing stock in the year.
STOCK AT THE END OF THE YEAR
76
2005-06 2006-07 2007-08 2008-09 2009-100
20000
40000
60000
80000
100000
120000
140000
160000
FINDINGS
77
With reference to the working capital study of Bharat Sanchar Nigam limited
1) Quantity of working capital is contributed by short term sources of
finance.
2) In this gross working capital of the company, a major part is occupied by
inventory and sundry debtors.
3) The current ratio position of the company is satisfactory to meet its
current obligations.
4) The company has to pay higher partial interest to the outsiders due to lack
of debt in the company. So it has to maintain reasonable debt.
5) In order to achieve the goals of the organization has whole and
achievement of performance appraisal technique is very useful.
6) The company has been maintaining sufficient amount of working capital
in all the years.
SUGGESTIONS
78
1) It is observed that one working capital is always higher to Sunday
debtors the working capital is increasing because of rising current
liabilities in provisions but not buy other elements.
2) The company spends reasonable amounts on inventory.
3) The debt collection period was liberalized in the year, which helped in
enhancing the sales turnover.
4) The company is presents in sound position current assets are higher than
current liability.
CONCLUSION
79
Working capital management analysis is as in-depth analysis, overages
the entire financial management with reference to integrated approach. The
Bharat Sanchar Nigam limited is a company which gives preference to the
common man’s privilege. Hence, it is on integrated approach and a constant
measure may be adopted for better managerial performance. Working capital
analysis and its criteria is distinctive work while and commendable technique in
postulating the financial behavior of a business enterprise.
Thus, working capital management which is integrated, internal,
intermediate and organization based financial & analytical measurement the
study is always a strategic measurement with reference in the performance,
growth, expansion and modernization of the business.