Page 1
MINERAL RESOURCES
Burrup Peninsula Aboriginal
Petroglyphs: Colour Change & Spectral
Mineralogy 2004–2016
Noel Duffy1, Erick Ramanaidou2 , David Alexander 3 & Deborah Lau 4
1 CSIRO Energy, Clayton, Victoria
2 CSIRO Mineral Resources, Kensington, Western Australia
3 CSIRO Data61, Clayton, Victoria
4 CSIRO Manufacturing, Clayton, Victoria
EP161761
June 2017
Commercial-in-confidence
Page 3
CSIRO Mineral Resources
Citation
Noel Duffy, Erick Ramanaidou, David Alexander & Deborah Lau (2017) Burrup Peninsula Aboriginal
Petroglyphs: Colour Change & Spectral Mineralogy 2004–2016. CSIRO, Australia. Confidential Report
EP161761
Copyright and disclaimer
© 2017 CSIRO To the extent permitted by law, all rights are reserved and no part of this publication
covered by copyright may be reproduced or copied in any form or by any means except with the written
permission of CSIRO.
Important disclaimer
CSIRO advises that the information contained in this publication comprises general statements based on
scientific research. The reader is advised and needs to be aware that such information may be incomplete
or unable to be used in any specific situation. No reliance or actions must therefore be made on that
information without seeking prior expert professional, scientific and technical advice. To the extent
permitted by law, CSIRO (including its employees and consultants) excludes all liability to any person for
any consequences, including but not limited to all losses, damages, costs, expenses and any other
compensation, arising directly or indirectly from using this publication (in part or in whole) and any
information or material contained in it.
Page 5
Burrup Peninsula Aboriginal Petroglyphs: Colour Change & Spectral Mineralogy 2004–2016
Contents
Acknowledgments ......................................................................................................................................... x
Executive summary....................................................................................................................................... xi
1. Introduction .................................................................................................................................... 1
2. Location and sampling of the petroglyphs ...................................................................................... 2
3. Petroglyphs (This section is from Ramanaidou and Fonteneau, 2015 and 2017) .......................... 6
4. Colour Measurement ...................................................................................................................... 8
4.1 Introduction .......................................................................................................................... 8
4.2 Experimental Methodology .................................................................................................. 8
4.3 Results and Discussion ........................................................................................................ 10
5. Spectral Mineralogy ...................................................................................................................... 41
5.1 Reflectance spectroscopy ................................................................................................... 41
5.2 Spectral Results for 2004-2016 ........................................................................................... 42
5.3 Spectral parameters ............................................................................................................ 53
6. Statistical Analysis of BYK, KM and ASD colour measurements .................................................... 75
6.1 Introduction ........................................................................................................................ 75
6.2 Comparing BYK and KM photospectrometers .................................................................... 76
6.3 Analysis of colour measurements from KM and ASD spectrometers ............................... 121
7. Conclusion of 2004-2016 study ................................................................................................... 128
8. Recommendations ...................................................................................................................... 129
9. References ................................................................................................................................... 130
Page 6
vi | Burrup Peninsula Aboriginal Petroglyphs: Colour Change & Spectral Mineralogy 2004–2016
FIGURES
Figure 1: Google Earth® maps of the Burrup Peninsula with the location of the petroglyphs. ................... 4
Figure 2: New sites (Yellow numbers) with dominant wind directions and speed. ..................................... 5
Figure 3. Weathered granophyre with Munsell colour including (1) surface coating (2.5YR 4/4), (2)
leached zone (7.5YR 4/2) and (3) fresh rock (7.5B 5/2). .............................................................................. 6
Figure 4. Bird droppings on Murujuga rocks ................................................................................................ 7
Figure 5: Konica Minolta CM-700d spectrophotometer. ............................................................................. 9
Figure 6: Site 1- Dolphin Island (White scale bar is 50 cm). ....................................................................... 11
Figure 7: Site 2 – Gidley Island (white scale bar is 10 cm). ......................................................................... 14
Figure 8: Site 4 – Woodside (White scale bar is 10 cm). ............................................................................ 17
Figure 9: Site 5 – Burrup Road (White scalar is 10 cm). ............................................................................. 20
Figure 10: Site 6 – Water Tanks (White scale bar is 10 cm). ...................................................................... 23
Figure 11: Site 7 – Deep Gorge (White scale bar is 25 cm). ....................................................................... 26
Figure 12: Site 8 – King Bay South (Colour chart on rock is 10 cm). ........................................................... 29
Figure 13: Site 21 – Yara West (Colour chart on rock is 10 cm). ................................................................ 32
Figure 14: Site 22 – Yara North East (Colour chart on rock is 10 cm)......................................................... 34
Figure 15: Site 23 – Yara East (Colour chart on rock is 10 cm). .................................................................. 36
Figure 16: ASD FieldSpecPro and Konica Minolta CM-700dspectrophotometer operating on petroglyphs
in the Burrup Peninsula (2013) ................................................................................................................... 42
Figure 17: Digital image of the engraving with the location of the measurements (spot 1, 2, 3 and 4 for
both engraving and background. Spot 4 measured from 2013). Comparison of the average spectra for
the engravings and background for each of the three spots between 2004 and 2016. ............................ 52
Figure 18. Spectral parameters for all sites. Each parameter has been expressed with the same scale for
all sites. ....................................................................................................................................................... 73
Figure 19. The three plots show L*, a* and b* measurements respectively from BYK, KM and ASD
spectrometers for background and engraving on site 1 spot 1. Rectangles above each graph show the
average recorded colour for each measurement in each year (identical in each graph). Change in these
recorded colours over time is hard to detect visually, except in the BYK data. ......................................... 79
Figure 20. Site 1 spot 2 colour measurements, plotted as in Figure 19 ..................................................... 80
Figure 21. Site 1 spot 3 colour measurements, plotted as in Figure 19. .................................................... 81
Figure 22. Site 1 spot 4 colour measurements, plotted as in Figure 19. .................................................... 82
Figure 23. Site 2 spot 1 colour measurements, plotted as inFigure 19. ..................................................... 83
Page 7
Burrup Peninsula Aboriginal Petroglyphs: Colour Change & Spectral Mineralogy 2004–2016
Figure 24. Site 2 spot 2 colour measurements, plotted as in Figure 19. .................................................... 84
Figure 25. Site 2 spot 3 colour measurements, plotted as in Figure 19. .................................................... 85
Figure 26. Site 2 spot 4 colour measurements, plotted as in Figure 19. .................................................... 86
Figure 27. Site 4 spot 1 colour measurements, plotted as in Figure 19. .................................................... 87
Figure 28. Site 4 spot 2 colour measurements, plotted as in Figure 19. .................................................... 88
Figure 29. Site 4 spot 3 colour measurements, plotted as in Figure 19. .................................................... 89
Figure 30. Site 4 spot 4 colour measurements, plotted as in Figure 19. .................................................... 90
Figure 31. Site 5 spot 1 colour measurements, plotted as in Figure 19. .................................................... 91
Figure 32. Site 5 spot 2 colour measurements, plotted as in Figure 19. .................................................... 92
Figure 33. Site 5 spot 3 colour measurements, plotted as in Figure 19. .................................................... 93
Figure 34. Site 5 spot 4 colour measurements, plotted as in Figure 19. .................................................... 94
Figure 35. Site 6 spot 1 colour measurements, plotted as in Figure 19. .................................................... 95
Figure 36. Site 6 spot 2 colour measurements, plotted as in Figure 19. .................................................... 96
Figure 37. Site 6 spot 3 colour measurements, plotted as in Figure 19. .................................................... 97
Figure 38. Site 6 spot 4 colour measurements, plotted as in Figure 19. .................................................... 98
Figure 39. Site 7 spot 1 colour measurements, plotted as in Figure 19. .................................................... 99
Figure 40. Site 7 spot 2 colour measurements, plotted as in Figure 19 ................................................... 100
Figure 41. Site 7 spot 3 colour measurements, plotted as in Figure 19. .................................................. 101
Figure 42. Site 7 spot 4 colour measurements, plotted as in Figure 19. .................................................. 102
Figure 43. Site 8 spot 1 colour measurements, plotted as in Figure 19. .................................................. 103
Figure 44. Site 8 spot 2 colour measurements, plotted as in Figure 19. .................................................. 104
Figure 45. Site 8 spot 3 colour measurements, plotted as in Figure 19. .................................................. 105
Figure 46. Site 8 spot 4 colour measurements, plotted as in Figure 19. .................................................. 106
Figure 47. Site 21 spot 1 colour measurements, plotted as in Figure 19. ................................................ 107
Figure 48. Site 21 spot 2 colour measurements, plotted as in Figure 19. ................................................ 108
Figure 49. Site 21 spot 3 colour measurements, plotted as in Figure 19. ................................................ 109
Figure 50. Site 21 spot 4 colour measurements, plotted as in Figure 19. ................................................ 110
Figure 51. Site 22 spot 1 colour measurements, plotted as in Figure 19. ................................................ 111
Figure 52. Site22 spot 2 colour measurements, plotted as in Figure 19. ................................................. 112
Figure 53. Site 22 spot 3 colour measurements, plotted as in Figure 19. ................................................ 113
Figure 54. Site22 spot 4 colour measurements, plotted as in Figure 19. ................................................. 114
Figure 55. Site 23 spot 1 colour measurements, plotted as in Figure 19. ................................................ 115
Figure 56. Site 23 spot 2 colour measurements, plotted as in Figure 19. ................................................ 116
Page 8
viii | Burrup Peninsula Aboriginal Petroglyphs: Colour Change & Spectral Mineralogy 2004–2016
Figure 57. Site 23 spot 3 colour measurements, plotted as in Figure 19. ................................................ 117
Figure 58. Site 23 spot 4 colour measurements, plotted as in Figure 19. ................................................ 118
Figure 59. Average L* values from BYK and KM photospectrometers, compared with average L* values
calculated from ASD spectra for background and engraving across all years, sites and spots. The
horizontal axis in each case is the L* measurement calculated from ASD spectra, and the vertical axis is
the L* measured value on the BYK instrument (left plot) or the KM instrument (right plot). The solid line
shows where measurements would lie if they corresponded perfectly. Dashed regression lines indicate
the average difference between the instruments, and the labelled value of R2 for the regression
indicates the level of agreement. The site colour coding shows that some sites have higher lightness
than others do, but also that some sites show greater variation in BYK measurement. Triangles indicate
measurements of the background, and circles of the engraving; note that the larger outliers on the BYK
photospectrometer were made on the engraving. .................................................................................. 119
Figure 60. Average a* values from BYK and KM photospectrometers, compared with average a* values
calculated from ASD spectra for background and engraving across all years, sites and spots. The plots are
generated as in Figure 59. ........................................................................................................................ 120
Figure 61. Average b* values from BYK and KM photospectrometers, compared with average b* values
calculated from ASD spectra for background and engraving across all years, sites and spots. The plots are
generated as in Figure 59. ........................................................................................................................ 120
Figure 62. Variation over time in average L* measurements on the KM spectrophotometer for
background and engraving of all spots on all sites. .................................................................................. 122
Figure 63 Variation over time in average L* measurements calculated from spectra recorded on the ASD
spectrometer for background and engraving of all spots on all sites. Data from sites 1-2 is drawn in
black; all other data in red ........................................................................................................................ 126
Figure 64. Variation over time in average a* measurements calculated from spectra recorded on the
ASD spectrometer for background and engraving of all spots on all sites. Data from sites 1-2 is drawn in
black; all other data in red. ....................................................................................................................... 127
Figure 65. Residuals and fitted values of the model for L* data calculated from spectra recorded on the
KM spectrophotometer for background and engraving of all spots at all sites. The level of variation in the
residuals is fairly constant across all fitted values. .................................................................................. 127
Page 9
Burrup Peninsula Aboriginal Petroglyphs: Colour Change & Spectral Mineralogy 2004–2016
Tables
Table 1: Details of the sites for colour and spectral mineralogy measurements (site 3 is not included in
this study) ..................................................................................................................................................... 3
Table 2: Coordinates (GDA 94, Zone 50) of the 6 sites measured for the TAN Monitoring project ............ 5
Table 3: Instrument Specifications for the Konica Minolta CM-700d spectrophotometer. ...................... 10
Table 4: Average Colour Measurements for Site 1 – Dolphin Island (2004 – 2016). ................................. 12
Table 5: Average Colour Measurements for Site 2 – Gidley Island (2004 – 2016). .................................... 15
Table 6: Average Colour Measurements for Site 4 – Woodside (2004 – 2016). ....................................... 18
Table 7: Average Colour Measurements for Site 5 – Burrup Road (2004 – 2016). .................................... 21
Table 8: Average Colour Measurements for Site 6 – Water Tanks (2004 – 2016). .................................... 24
Table 9: Average Colour Measurements for Site 7 – Deep Gorge (2004 – 2016). ..................................... 27
Table 10: Average Colour Measurements for Site 8 – King Bay South (2004 – 2016). .............................. 30
Table 11: Average Colour Measurements for Site 21- Yara West (2014 Feb - 2016). ................................ 33
Table 12: Average Colour Measurements for Site 22 – Yara North East (2014 Feb - 2016). ..................... 35
Table 13: Average Colour Measurements for Site 23 - Yara East (2014 Feb - 2016). ................................ 37
Table 14: Averaged colour change for each site. ....................................................................................... 38
Table 15: Colour difference between background and petroglyph ........................................................... 40
Table 16 Minimum and maximum of spectral parameters for all sites. .................................................... 53
Table 17. Averages of the increases per year of L*, a* and b* measurements across each combination of
site, spot and type (background or engraving) for each instrument. (Negative numbers indicate an
average decrease over time). ................................................................................................................... 124
Table 18 p values for successively adding to models for L*, a* and b* measured with KM and ASD
spectrometers: a trend over time (first row); different trends on northern and southern sites (second
row); and different trends also on background and engraving (third row). ............................................ 125
Page 10
x | Burrup Peninsula Aboriginal Petroglyphs: Colour Change & Spectral Mineralogy 2004–2016
Acknowledgments
This work is performed in collaboration with Bill Carr as part of the Burrup Rock Art Monitoring Program,
supported by the Western Australian Government Department of Environment Regulation and the
Australian Government Department of the Environment.
Thanks are extended to the Murujuga Aboriginal Corporation for providing the authorisation to undertake
the study and for their assistance during data collection.
Page 11
Burrup Peninsula Aboriginal Petroglyphs: Colour Change & Spectral Mineralogy 2004–2016
Executive summary
The Burrup Peninsula is around 30 km long and 6 km wide and is located 1300 km from Perth (Western
Australia). It was named after Mount Burrup, the highest topographic point. The Burrup Peninsula was
created when an island was connected to the mainland through the construction of a causeway. The
peninsula is of unique cultural and archaeological significance as it contains Australia’s largest and most
important collection of indigenous petroglyphs. The term petroglyph is derived from the Greek words
‘petros’ meaning rock or stone and ‘glyphein’ meaning to carve. Petroglyphs are human artefacts produced
by partly removing a rock surface by pecking or pounding using a chisel.The petroglyphs have been carved
in two rock types, namely granophyre and gabbro. These rocks have been subjected to weathering and
display a core of fresh rock surrounded by a cm-thick “leached” zone in turn covered by a thin iron oxide
rich skin. The petroglyphs were engraved in the rocks by removing the outermost skin to expose the
leached zone providing a strong contrast between the “engraving” and the “background”. The leached zone
is characterised by an augmentation of the porosity as a result of the dissolution of primary minerals as well
as an increase of both kaolinite and goethite. As the amount of primary minerals decreases, the amount of
secondary minerals increases, but some of the most weathering resistant primary minerals such as quartz
and chlorite are still partially present. An increase in phosphorus (mainly as apatite microcrystals) has been
characterised in both the leached and surface zones for all samples. The addition of apatite can only be
explained by an external source namely bird droppings (or guano) a natural fertilizer. Guano typically
contains 8 to 16% percent nitrogen, 8 to 12% equivalent phosphoric acid, and 2 to 3% equivalent potash.
Hence, the bird dropping will not only add phosphorus to the rocks but also nitrogen.
Alongside the petroglyphs, the Burrup Peninsula hosts several large industrial complexes including iron ore,
liquefied natural gas production, salt production and fertilisers with one of Australia’s largest ports. Since
some of the petroglyphs adjoin industrial areas there has been very public concern expressed that the
petroglyphs could be damaged by airborne emissions from the industry. In 2002, the Western Australian
government established the former independent Burrup Rock Art Monitoring Management Committee
(BRAMMC) to review the available expertise and oversee the studies that were conducted to establish
whether industrial emissions are likely to affect the petroglyphs.
In 2003 the former Burrup Rock Art Technical Working Group (BRATWG) commissioned a number of studies
to monitor the petroglyphs. They included air dispersion modelling studies, air quality and microclimate
colour change, dust deposition and accelerated weathering study and mineral spectroscopy. The studies
were based on the monitoring of seven sites with two control sites located on the northern Burrup area
and the other five located further south on the lower Burrup Peninsula, closer to the industrial areas. The
site selection for sites close to industry and for distant “control” sites was based predominantly on
predicted gas concentrations derived from modelling by SKM. In addition geology was important to ensure
that both of the major rock types that supported the petroglyphs, granophyre and gabbro, were included.
For 10 years (2004 to 2013), petroglyphs at seven specially selected sites (chosen under the guidance of
indigenous elders) in the Burrup Peninsula were measured using colour and reflectance spectroscopy
measurements. Three spots on each engraving and three spots on each background rock were measured in
situ using a portable photospectrometer for colour measurement and a reflectance spectrometer for visible
and near infrared analysis. In 2014, the rock art monitoring project expanded at the request of Yara Pilbara
Page 12
xii | Burrup Peninsula Aboriginal Petroglyphs: Colour Change & Spectral Mineralogy 2004–2016
Nitrates Pty Ltd (YPNPL). The company was building a Technical Ammonium Nitrate Production Facility
Project (or TAN) on the Burrup Peninsula, and to adhere to the requirements of the Environment
Protection and Biodiversity Conservation Act 1999, YPNPL needed to engage a heritage monitor to survey
the rock art sites within a two kilometre radius of the project site. CSIRO has been a heritage monitor for
the West Australian Government "the Department of Environment Regulation (DER)" for the monitoring of
the Burrup petroglyphs for the last decade and was considered appropriate to be the heritage monitor for
YPNPL. The rock art study dedicated for the TAN Project required the heritage monitoring of petroglyphs
sites within 2km of the plant site. Selected sites were determined in consultation with members of
Murujuga Aboriginal Corporation to respect the cultural laws of the traditional owners for the entitlement
of access. The selected petroglyphs were firstly evaluated for their appropriateness for scientific study,
including petroglyph size and quality, direction of exposure, elevation, dominant winds direction within 2
km of the TAN project location. From the six selected monitoring sites; three were already part of the
decade-old and ongoing BRATWG monitoring program and an additional three sites were also selected.
After initial monitoring in February 2014, the three new sites have become part of the BRATWG monitoring
program. As well as the three new sites, an extra spot (both engraving and background) was added on each
monitored petroglyph panel, bringing the total to eight sampling spots (four areas classified as ‘engraving’
and four areas classified as ‘background’) to increase the accuracy of future statistical analysis of
measurements.
As the project was entering its 10th year, it was appropriate to review the approach to data analysis that
was implemented at the outset and has remained in place without significant modification since 2004.
Previously, the following analyses for the photospectrometer colour measurements were as follows:
21 independent measurements of each spot
Replicate sample data was collected in L*a*b* numerical format. (L* is a measure of lightness, from
0 (black) to 100 (white); a* and b* can take positive or negative values. Higher a* values
correspond to increasing red colour and lower values to increasing green colour; b* similarly
records the contrast between yellow (high values) and blue (low values). Data has been calculated
relative to the D65 standard illuminant, intended to represent average daylight.)
Measurements at a single spot were averaged and reported.
Colour difference between background and engraving was calculated and reported year to year and
from the current year to the beginning of the study.
Annual measurements of the colour difference between background and engraving were plotted
and a trend line reported.
The analyses for the Analytical Spectral Device (ASD) Reflectance spectrometer were as follows:
10 measurements of each spot. In 2015, the number of measurements was increased to 21 to
match the photospectrometer and also the head of the spectrometer was removed and replaced
after each measurement.
Measurements at a single spot were averaged and reported.
Spectral parameters were extracted and plotted.
Page 13
Burrup Peninsula Aboriginal Petroglyphs: Colour Change & Spectral Mineralogy 2004–2016
It should be added that the 21 measurements for each instrument reduce sample variance introduced by
surface heterogeneity or roughness. It should be also noted that this might improve the statistical analysis
of the data but can also potentially damage the spot at this is repeated 21 times for the photospectrometer
and 21 times for the ASD reflectance spectrometer. In 2015 and 2016, it was observed that the heads of
both the Konica Minolta (KM) and ASD spectrometers were showing colouring, signs that instruments
measurements might be affecting the measured spots.
The initial measurements (2004 to 2008) were acquired using only the ASD spectrometer and a Gardner
(BYK) photospectrometer. These instruments are described in the experimental section of this report. In
2009, some of the automated memory retention functions of the BYK spectrophotometer started failing,
requiring laborious manual data saving. Calibration and instrument performance were unaffected. It was
decided to pair the BYK instrument with a more modern KM spectrophotometer (also described in this
report) and perform measurements using both instruments to explore the possibility of substituting
instruments. Since 2009, each site has been measured in duplicate using the two instruments.
The spectral parameters were extracted from the ASD reflectance spectrometer and include (1) the depth
(D900) and minimum wavelength (W900) of the large 900nm centred absorption providing information on
the iron oxides; (2) the depth of the chlorite absorption at 2250 nm after local Hull removal - DChlorite
(residual mineral from the fresh rocks) and (3) the depth of the kaolinite at 2206 nm after local Hull
removal (DKaolinite) and, when present, gibbsite (DGibbsite) absorptions (secondary minerals resulting
from the weathering of the primary minerals). The plot of these spectral parameters shows variations from
year to year.
For this report, combining the last two years of measurements (2015 and 2016), a complete statistical
analyses of all the data (each individual measurement for the three instruments, a total of 24,000 colour
measurements from 2004 to 2016) has been undertaken.
Measurement of the annual colour changes used two spectrophotometer techniques, the ASD and the BYK
and KM. An examination of the colour measurements as a function of time, as well as a comparison of the
two measurement techniques, has been conducted.
For both the KM and the ASD instruments, three-dimensional L*a*b* colour space (L* - degree of lightness,
a* - degree of red/green, b* - degree of yellow/blue), identifying a tristimulus value (L*a*b*) for each
sample point have been calculated.
Data from the KM spectrophotometer shows a trend over time in the L* measurements. The lightness (L)
decreasing at a modelled average rate of 0.31 units per year (a total decrease of about 2 units on this scale
is just noticeable to the human eye). However no trend is indicated in either a* (degree of red/green) or b*
(degree of yellow/blue).
Data from the ASD spectrometer shows trends indicated in L* (degree of lightness) and a* (degree of
red/green) but not on b* (degree of yellow/blue ), though the evidence is not as strong as with the KM
instrument.
The conclusion of colour change would be clearer if it was detected across all dimensions of colour (it
would be natural for colour change to be evident in all dimensions, L*, a* and b*, not only in one or two of
them). The results are not fully conclusive and if the measurements do reflect real colour change, as the
data suggest, then continued observations would continue to mark out the trend more clearly; and if not,
observations will likely continue to fluctuate over time, making the randomness of the recorded variation
more apparent. Sites 21-23 have currently only three years of observations; additional observations will be
Page 14
xiv | Burrup Peninsula Aboriginal Petroglyphs: Colour Change & Spectral Mineralogy 2004–2016
particularly helpful at these sites. Nonetheless, the indication of significant colour change is important, and
warrants closer attention. None of the instruments demonstrates a difference in the rate of change
between the northern control sites and the southern sites closer to industry.
It should be noted that data from the BYK spectrophotometer appears unreliable for drawing conclusions
on colour change in the rock art and, as such the cross calibration issues with the BYK portable
photospectrometer and the KM photospectrometer will no longer be undertaken.
All the photospectrometer data (KM, BYK and ASD) have been provided in an easily readable format to WA
DER for safekeeping.
It should be noted that the results of this report supersede all results previously published.
For future work, it is recommended that:
A complete statistical analyses is done on the full spectrum of each individual ASD spectrum (not
just the visible part i.e. L*, a* and b*).
A study be conducted to assess how many new sites and how many new engravings and
backgrounds should be added to the current locations to increase the quality of the monitoring in
the Burrup Peninsula. In particular, new control sites with similar rock types should be added to the
current ones (for instance Depuch Island). It should also be noted that by increasing the number of
independent measurement on each spot (in doing so improving statistical analysis) could also have
an adverse effect on the petroglyphs. There were signs in 2015 and 2016 that instruments
measurements might be affecting the measured spots. A balance should be found between
statistical endeavour and petroglyph protection.
One (1) rock sample be collected at each site (old and new), a total of 10 rocks based on current
monitoring, and brought to CSIRO in Perth to be stored in a container where humidity is 0% (no
water) and in an argon atmosphere (no oxygen and no oxidation) and placed in a dark area. This
will allow a comparison between the control sites, where natural weathering occurs and these
reference samples.
It is also recommended that the colour and mineralogical monitoring be complemented in the future with
atmospheric and microbiological monitoring similar to those conducted in the past.
Page 15
Burrup Peninsula Aboriginal Petroglyphs: Colour Change & Spectral Mineralogy 2004–2016
1. Introduction
In response to tender number 34DIR0603 issued by the former WA Department of Industry and Resources
and more recently under contract with the Department of Environmental Regulation (DER), CSIRO has
measured the colour of selected petroglyphs on the Burrup Peninsula over a period of thirteen years. The
requirements stipulated by the project were the measurement of re-identifiable sample points on
petroglyphs annually for the measurement period.
For the last 13 years, the petroglyphs at 7 specially selected sites in the Burrup Peninsula (Western
Australia) were measured using reflectance spectroscopy and colour spectrophotometry (2004 to 2016 -
Ramanaidou and Caccetta, 2005; Ramanaidou and Wells 2006; Ramanaidou et al., 2007; Ramanaidou, et
al., 2009a; Ramanaidou et al., 2009b; Lau et al., 2010; Lau et al., 2011; Lau et al., 2012; Markley et al., 2014;
Markley et al., 2015). In 2014, three additional sites located within a 2 km radius of the Yara Pilbara Nitrates
Pty Ltd (YPNPL) Technical Ammonium Nitrate Production Facility Project (or TAN) were added to the
monitoring program. From 2004 to 2012, three spots on each engraving and 3 spots on each background
rock were measured in situ using an ASD spectrometer and a spectrophotometer, with a 4th engraving and
background spot added in 2013. The spectral measurements were co-located with the colour
measurements. Initially, at each engraving and background spot seven spectra were acquired and
averaged, with this increasing to 21 repeat measurements at each spot in 2005 to improve the statistical
robustness of the data. The spectral variation for each spot (both engraving and background) was also
assessed. The colour values were crosschecked to the colour value calculated by the ASD spectrometer.
The 2004 spectral study (Ramanaidou and Caccetta, 2005) is the baseline dataset that has been used to
monitor potential variation that occurred in the last 13 years. The thirteen-year study (2004-2016) has
assessed the ability of the mineralogy to monitor and explain the mineralogical changes (if any) of seven
rock art sites in the Burrup Peninsula, and an additional three sites in 2014, along with analysing any colour
differences or changes.
Page 16
2 | Burrup Peninsula Aboriginal Petroglyphs: Colour Change & Spectral Mineralogy 2004–2016
2. Location and sampling of the petroglyphs
The sites for monitoring (Table 1 and Figure 1) were determined by the Burrup Rock Art Management
Committee, and the final decision for a representative petroglyph at each site (each site contains one or
more petroglyphs) was determined in consultation with the Committee’s Technical Advisor and nominated
representatives of the local indigenous communities including members of Murujuga Aboriginal
Corporation. Respecting the cultural laws of the traditional owners for the entitlement of access, the
selected petroglyphs were firstly evaluated for their suitability for scientific study, including aspects such as
distance from the sea, elevation, direction of exposure and importantly cultural acceptability.
For the record, the site selection for sites close to industry and for distant “control” sites were based
predominantly on predicted gas concentrations derived from modelling by SKM (modelling is available on
the WA DER website). In addition geology was important to ensure that both of the major rock types that
supported the petroglyphs, granophyre and gabbro, were included.
Initially, three sampling ‘spots’ on each selected petroglyph were identified, and in each spot two areas
were monitored (i.e. six sampling points per petroglyph):
An area classified as ‘engraving’ – defined by the graffito lines or pecking marks that constitute the image.
An area classified as ‘background’ – a section of the adjacent rock surface unmarked by the petroglyph.
Initially, for spectral mineralogy, measurements based on the average of a minimum of seven readings
were recorded at each sampling point and 10 replicate measurements were made for colour analysis. In
order to reduce to a minimum the impact of the measurements, a paramount parameter for such a cultural
sensitive study, the head of the ASD spectrometer (albeit in rubber) was not moved, that is the
measurements were all collected with the head/detector not removed and then replaced on the spot after
each measurement.
In 2013, it was decided to increase the accuracy of the statistical analysis of measurements by adding (1) a
fourth engraving and background spot on each petroglyph, (2) more spectral measurements from ten (10)
to twenty one (21) readings recorded at each sampling point and (3) that the instruments (both
spectrometers) head/detector in contact with the spot was removed and then replaced on the spot after
each measurement so that 21 independent measurements were taken at each sample point to reduce
sample variance introduced by surface heterogeneity or roughness, and by systematic error. It should be
noted that this might improve the statistical analysis of the data but can also potentially damage the spot at
this is repeated 21 times for the photospectrometer and 21 times for the ASD reflectance spectrometer. In
2015 and 2016, it was observed that the heads of both the KM and ASD spectrometers were showing
colouring, signs that instruments measurements might be affecting the measured spots.
A sampling area was chosen on the criteria that it had relatively uniform colour over a minimum area of
20mm, so that comparative measurements could be made between the photo spectrometer and the
reflectance spectroscopy.
Page 17
Burrup Peninsula Aboriginal Petroglyphs: Colour Change & Spectral Mineralogy 2004–2016
Table 1: Details of the sites for colour and spectral mineralogy measurements
(site 3 is not included in this study)
Site Site name Coordinates (GDA 94, Zone 50)
1 Dolphin
Island
484,975 7,738,503
2 Gidley Island 482,166 7,740,857
4 Woodside 477,398 7,721,980
5 Burrup Rd 475,959 7,719,771
6 Water Tanks 477,698 7,720,137
7 Deep Gorge 477,956 7,717,987
8 King Bay
South
474,082 7,717,229
Page 18
4 | Burrup Peninsula Aboriginal Petroglyphs: Colour Change & Spectral Mineralogy 2004–2016
Figure 1: Google Earth® maps of the Burrup Peninsula with the location of the petroglyphs.
For the three additional sites included as part of this study for the Yara Pilbara Nitrates Pty Ltd (YPNPL)
Technical Ammonium Nitrate Production Facility Project, a similar approach was adopted where
consideration was given to the location of the plant site and its 2 km radius relative to the wind main
directions through the year (Figure 2). The Elders of the Murujuga Aboriginal Corporation made the
ultimate decision. The monitoring consists of six monitoring sites within 2km of the plant site. Three
existing sites labelled 5 or Burrup Road, 6 or Water Tanks and 7 or Deep Gorge (Figure 2) from the
(BRATWG) monitoring program and three additional monitoring sites within 2 km of plant site labelled 21
Page 19
Burrup Peninsula Aboriginal Petroglyphs: Colour Change & Spectral Mineralogy 2004–2016
or Yara West, 22 or Yara North East and 23 or Yara East (Figure 2). In July 2014, the three additional sites
(21, 22 and 23) became part of the BRATWG monitoring program with a new 10 monitoring sites.
Figure 2: New sites (Yellow numbers) with dominant wind directions and speed.
Table 2: Coordinates (GDA 94, Zone 50) of the 6 sites measured for the TAN Monitoring project
Site Site name Coordinates (GDA 94, Zone 50)
5 Burrup Rd 475,959 7,719,771
6 Water Tanks 477,698 7,720,137
7 Deep Gorge 477,956 7,717,987
21 Yara West 476,558 7,719,223
22 Yara North
East
479,112 7,720,155
23 Yara East 478,849 7,719,565
Page 20
6 | Burrup Peninsula Aboriginal Petroglyphs: Colour Change & Spectral Mineralogy 2004–2016
3. Petroglyphs (This section is from Ramanaidou and Fonteneau, 2015 and 2017)
The term petroglyph is derived from the Greek words ‘petros’ meaning rock or stone and ‘glyphein’
meaning to carve. Petroglyphs are human artefacts produced by partly removing a rock surface by
engraving, pecking, pounding or carving using a chisel. In Australia and, in particular in the Burrup
Peninsula, it has been demonstrated that the petroglyphs were created mainly by pounding and pecking
(Maynard, 1977; Bednarik, 1998, 2007). The Burrup Peninsula is home to the world’s largest collection of
Aboriginal petroglyphs.
The primary lithology of the Burrup Peninsula is dominated by granophyre and gabbro dated at around 2.7
billion years old. These rocks have been subjected to weathering and display a core of fresh rock
surrounded by a cm-thick “leached” zone (a black line outlines the leached zone in Figure 3) in turn covered
by a thin iron oxide rich skin (Figure 3). The petroglyphs were carved by removing the few top millimetres
of the iron oxide-rich layer to expose the lighter leached zone. The contrast between the original reddish
background and the lighter coloured etching makes it obvious to the naked eye. The leached zone is
characterised by an augmentation of the porosity because of the dissolution of primary minerals as well as
an increase of both kaolinite and goethite. Partial goethitisation of the Fe-bearing minerals such as chlorite,
magnetite, hematite and actinolite in granophyre and chlorite, actinolite, augite in gabbro has occurred.
The Al-rich minerals such as feldspar, chlorite, epidote and muscovite are partially replaced by kaolinite. As
the amount of primary minerals decreases, the amount of secondary minerals (resulting from weathering)
increases. The red-orange mm-thick outer surface coating (Figure 3) is characterised by a further increase in
kaolinite, hematite and goethite. Some of the most weathering resistant primary minerals such as quartz
and chlorite are still present.
Figure 3. Weathered granophyre with Munsell colour including (1) fresh rock (7.5B 5/2), (2) leached zone (7.5YR
4/2) and (3) surface coating (2.5YR 4/4).
An increase in phosphorus (P) in both the leached and surface zones has been observed for all samples with
a maximum measured in the leached zone (2 in Figure 3). This increase in P2O5 in the leached and surface
zones is respectively 12 times and 6 times more compared to the fresh rock. This addition of phosphorus
can only be explained by an external source of P namely guano (bird droppings) a natural fertilizer. The
composition of seabird guano mainly includes ammonium oxalate (C2H8N2O4) and urate (C5H7N5O3),
phosphates (NH4)3PO4. Guano typically contains 8 to 16% percent nitrogen (mainly uric acid), 8 to 12%
equivalent phosphoric acid, and 2 to 3% equivalent potash. Hence, the bird dropping will not only add
phosphorus to the rocks but also nitrogen (N). Bird droppings from seagulls are frequently found on the
surfaces of the gabbros and granophyres including the petroglyphs (Figure 4).
Page 21
Burrup Peninsula Aboriginal Petroglyphs: Colour Change & Spectral Mineralogy 2004–2016
.
Figure 4. Bird droppings on Murujuga rocks
Page 22
8 | Burrup Peninsula Aboriginal Petroglyphs: Colour Change & Spectral Mineralogy 2004–2016
4. Colour Measurement
4.1 Introduction
Portable, hand-held spectrophotometry was identified as a suitable technique. It has been recognised as a
repeatable way of recording colour in units of standard CIE chromaticity coordinates in many contexts,
including archaeological situations (Mirti, 2004). CIE chromaticity coordinates are an internationally
recognised numerical system of permanently and objectively describing the colour of a surface or material
as a point in three-dimensional L*a*b* colour space (L* - degree of lightness, a* - degree of red/green, b* -
degree of yellow/blue), identifying a tristimulus value (L*a*b*) for each sample point.
In situ monitoring of degradative change through colour measurement has been reported by Mirmehdi et
al. (2001), who undertook a pilot study designed for monitoring and modelling the deterioration of paint
residues in a cave environment through digital image comparisons with a reference image. The template-
matching technique was considered unsuitable and impractical for the Burrup study for two reasons:
a) Template matching, as described by Mirmehdi et al. (2001), would require the collection of digital images with repeatable and controlled spectral illumination, angle of incidence and collection. Burrup petroglyphs are located in remote, exposed locations, and it would not be possible to control the colour, temperature and angle of the ambient lighting easily without blocking all the ambient daylight, or collecting images at night with the ambient moon and starlight removed.
b) The effect of metamerism in relation to the reference template and rock surface has not been accounted for. It is well known that surfaces appearing similar in colour under one set of illumination conditions can appear dramatically different with another spectral illuminant or angle of incidence. The reference template is a glossy (laminated) smooth surface, while the rocks in this study are significantly rougher.
4.2 Experimental Methodology
The difference between two colours measured instrumentally is ΔE. It derives from the German word –
Empfindung – that means a difference in sensation. A ΔE value of zero represents an exact match. It is the
standard CIE colour difference method, and measures the distance between the two colours, calculated in
3D L*a*b* colour space. In this way, colour difference can be evaluated through measuring the tristimulus
values of points over time, and calculating ΔE to evaluate the colour difference with time. This enabled the
colour contrast between an engraving and a rock surface to be monitored to evaluate whether it is
decreasing.
The difference between two colours, ΔE, can be evaluated using the 1976 CIE colour difference formula
(Hunter, 1987). In CIE L*a*b* space, the difference is:
ΔE*Lab = [(ΔL*)2 + (Δa*)2 + (Δb*)2]0.5
Page 23
Burrup Peninsula Aboriginal Petroglyphs: Colour Change & Spectral Mineralogy 2004–2016
This was used to evaluate the colour change of single points between consecutive years over which the
monitoring occurred, viz.:
In 2009, a Konica Minolta CM-700d spectrophotometer was used during the field data collection trips to
evaluate its suitability and practical handling features, and was found to be reliable and well suited to the
purpose. The spectrophotometer has a flat conical head configuration that provided an improved
repeatability on the rougher rock surfaces (Figure 5). The measurement head has a diameter of 10 mm,
which is half of the instrument used in parallel for spectral mineralogy measurements (ASD FieldSpec Pro
head diameter is 20 mm). The increased measurement field diameter reduces the effect of surface
heterogeneity on the overall averaged colour measurement. The instrument specifications are given in
Table 3.
In SCE mode, the specular reflectance is excluded from the measurement and only the diffuse reflectance is
measured. This produces a colour evaluation that correlates to the way the observer sees the colour of an
object. When using the SCI mode, the specular reflectance is included with the diffuse reflectance during
the measurement process. This type of colour evaluation measures total appearance independent of
surface conditions.
Figure 5: Konica Minolta CM-700d spectrophotometer.
Average Measurement Year 1
Average Measurement Year 2
Spot 4 Average Measurement Year 3
Average Measurement Year 4
Year x…
Overall ΔE for
each point
ΔE
ΔE
ΔE
Page 24
10 | Burrup Peninsula Aboriginal Petroglyphs: Colour Change & Spectral Mineralogy 2004–2016
Table 3: Instrument Specifications for the Konica Minolta CM-700d spectrophotometer.
Colour Space
L*a*b*
Observer
10O
Illuminant
D65 –simulated daylight
Measurement/
illumination area
SAV: Φ3 mm/Φ6 mm
Light source
Pulsed xenon
lamp
(with UV cut
filter)
Measurement
time
Approx. 1 second
Repeatability
Spectral reflectance: Standard
deviation within 0.1%
All measurements from 2013 were collected using the Konica Minolta (KM) spectrophotometer. For the
results presented in this report, years 2009 - 2016 were collected using the KM spectrophotometer, while
2004 -2008 were BYK spectrophotometer data (see the 2014 report for further details on their comparison
of the two spectrophotometers).
4.3 Results and Discussion
YEAR TO YEAR COLOUR DIFFERENCES
The following pages present photographs of the monitored petroglyphs at each site, showing the sampling
points of engravings and background rock, and the average colour measurements that were recorded at
these points each year. The fourth engraving and background analysis spots, new in 2013, are indicated in
these photos.
The original data collection in 2004 consisted of an average of seven colour measurements (L*a*b*) at each
sample point. However, when in the field, it became apparent that additional measurements would be
useful to evaluate statistically the variability of measurements. In the second year of colour measurements,
21 independent measurements were taken at each sample point (3 times the originally intended 7
measurements) to reduce sample variance introduced by surface heterogeneity or roughness, and by
systematic error. For clarity, the raw data have not been included here, but averages of the data are
presented with the colour difference measurements calculated with the standard CIE methods.
Page 25
Burrup Peninsula Aboriginal Petroglyphs: Colour Change & Spectral Mineralogy 2004–2016
Figure 6: Site 1- Dolphin Island (White scale bar is 50 cm).
Page 26
12 | Burrup Peninsula Aboriginal Petroglyphs: Colour Change & Spectral Mineralogy 2004–2016
Table 4: Average Colour Measurements for Site 1 – Dolphin Island (2004 – 2016).
Note: KM measurements are in red. No comparison calculated for 2008-09 due to change of instrument.
Sample
Colour scale Colour difference* ΔE (change
from previous year) L* a* b*
Site 1 Spot 1 Engraving
Average 2016 40.72 9.59 16.86 2.67
Average 2015 43.35 9.16 16.74 1.77
Average 2014 41.80 8.78 15.97 1.34
Average 2013 42.93 9.35 16.41 0.88
Average 2012 42.76 9.79 17.15 0.38
Average 2011 42.42 9.83 17.32 0.48
Average 2010 42.85 9.74 17.13 1.48
Average 2009 41.76 9.22 16.28
Average 2008 19.10 4.54 12.45 2.34
Average 2007 17.16 5.71 13.03 2.39
Average 2006 16.79 3.83 11.59 3.04
Average 2005 14.97 6.08 12.53 2.16
Average 2004 14.32 8.08 13.00 0.00
Site 1 Spot 1 Background
Average 2016 33.19 11.11 9.69 0.82
Average 2015 32.66 10.48 9.72 0.88
Average 2014 33.42 10.66 9.32 1.15
Average 2013 32.55 11.17 9.87 0.45
Average 2012 33.00 11.21 9.81 0.89
Average 2011 32.82 10.34 9.75 1.47
Average 2010 33.78 11.18 10.48 0.60
Average 2009 33.44 10.87 10.08
Average 2008 29.91 11.10 11.22 1.72
Average 2007 28.24 10.69 11.14 1.16
Average 2006 28.97 10.29 10.33 1.84
Average 2005 27.66 11.26 11.20 2.24
Average 2004 29.87 11.20 10.79 0.00
Site 1 Spot 2 Engraving
Average 2016 32.58 16.92 18.44 1.36
Average 2015 32.10 16.46 17.25 1.61
Average 2014 33.26 16.88 18.28 2.55
Average 2013 32.26 15.71 16.24 1.37
Average 2012 33.14 16.23 17.16 1.20
Average 2010 33.81 16.77 17.99 2.39
Average 2010 32.28 15.91 16.37 1.58
Average 2009 33.24 16.54 17.46
Average 2008 14.96 11.17 13.53 3.52
Average 2007 12.13 9.76 11.98 4.89
Average 2006 8.37 8.22 9.26 1.84
Average 2005 7.91 9.84 9.99 0.69
Average 2004 8.43 9.62 9.59 0.00
Site 1 Spot 2 Background
Average 2016 31.01 11.51 11.62 2.87
Average 2015 31.37 9.57 9.54 0.62
Average 2014 31.65 9.11 9.24 1.58
Average 2013 30.34 8.39 8.72 4.85
Average 2012 32.41 11.62 11.68 3.84
Page 27
Burrup Peninsula Aboriginal Petroglyphs: Colour Change & Spectral Mineralogy 2004–2016
Average 2011 30.37 8.97 9.79 2.59
Average 2010 32.05 10.65 10.83 1.72
Average 2009 31.76 9.64 9.47
Average 2008 26.35 9.51 11.43 6.11
Average 2007 20.96 7.06 9.92 8.54
Average 2006 28.82 10.21 11.06 7.88
Average 2005 20.98 9.46 11.46 6.74
Average 2004 27.66 10.35 11.87 0.00
Site 1 Spot 3 Engraving
Average 2016 39.63 14.31 18.82 0.70
Average 2015 39.06 14.70 18.96 0.51
Average 2014 38.66 14.47 19.18 1.21
Average 2013 38.87 13.83 18.18 1.15
Average 2012 37.79 13.99 17.81 1.51
Average 2011 39.11 14.08 18.54 0.79
Average 2010 38.53 14.36 19.00 1.29
Average 2009 39.81 14.52 19.06
Average 2008 32.98 11.15 17.56 6.37
Average 2007 26.72 10.16 16.94 3.60
Average 2006 23.22 10.68 16.27 3.16
Average 2005 25.67 12.25 17.51 3.02
Average 2004 28.67 12.12 17.18 0.00
Site 1 Spot 3 Background
Average 2016 29.27 12.16 12.2 3.27
Average 2015 29.69 9.89 9.88 4.02
Average 2014 29.49 12.47 12.96 0.72
Average 2013 29.17 12.25 12.36 4.22
Average 2012 30.21 9.47 9.36 1.77
Average 2011 30.14 10.67 10.67 0.52
Average 2010 29.75 10.44 10.40 0.26
Average 2009 29.97 10.57 10.42
Average 2008 15.14 7.48 10.02 4.29
Average 2007 19.09 8.97 10.76 6.43
Average 2006 13.07 7.30 9.25 2.43
Average 2005 11.45 8.75 10.33 2.44
Average 2004 13.42 7.98 9.11 0.00
Site 1 Spot 4 Engraving
Average 2016 38.02 13.46 18.19 3.36
Average 2015 41.25 13.79 19.07 6.87
Average 2014 35.08 12.09 16.57 4.28
Average 2013 38.39 13.95 18.56
Site 1 Spot 4 Background
Average 2016 29.27 12.16 12.20 0.79
Average 2015 28.65 12.54 12.51 0.18
Average 2014 28.73 12.41 12.42 2.10
Average 2013 29.49 11.17 10.91
Page 28
14 | Burrup Peninsula Aboriginal Petroglyphs: Colour Change & Spectral Mineralogy 2004–2016
Figure 7: Site 2 – Gidley Island (white scale bar is 10 cm).
Page 29
Burrup Peninsula Aboriginal Petroglyphs: Colour Change & Spectral Mineralogy 2004–2016
Table 5: Average Colour Measurements for Site 2 – Gidley Island (2004 – 2016).
Note: KM measurements are in red. No comparison calculated for 2008-09 due to change of instrument.
Sample
Colour scale Colour difference* ΔE (change from previous year) L* a* b*
Site 2 Spot 1 Engraving
Average 2016 44.42 9.40 18.60 3.36
Average 2015 43.45 9.36 18.52 5.59
Average 2014 38.34 8.70 16.34 1.97
Average 2013 40.17 9.06 16.98 0.40
Average 2012 39.83 9.22 16.83 3.25
Average 2011 42.78 9.31 18.20 0.35
Average 2010 43.06 9.44 18.37 4.54
Average 2009 38.80 9.33 16.81
Average 2008 32.99 7.11 16.02 2.23
Average 2007 31.06 7.44 14.96 3.72
Average 2006 34.10 7.79 17.07 1.62
Average 2005 33.58 9.26 17.50 2.29
Average 2004 31.90 8.96 15.98 0.00
Site 2 Spot 1 Background
Average 2016 29.85 9.31 10.23 3.38
Average 2015 32.12 9.76 12.69 1.46
Average 2014 32.63 10.43 13.88 2.36
Average 2013 31.68 10.04 11.76 1.30
Average 2012 30.53 9.96 11.16 1.23
Average 2011 31.65 10.36 11.47 1.68
Average 2010 32.33 10.41 13.01 1.76
Average 2009 31.44 9.88 11.58
Average 2008 28.91 9.53 13.25 4.47
Average 2007 25.42 7.93 10.97 1.86
Average 2006 26.54 9.16 11.82 2.14
Average 2005 27.01 9.88 13.77 4.63
Average 2004 22.51 9.00 13.20 0.00
Site 2 Spot 2 Engraving
Average 2016 44.43 10.46 20.25 0.22
Average 2015 44.44 10.66 20.34 0.82
Average 2014 45.08 11.00 20.72 1.53
Average 2013 43.89 11.96 20.80 0.85
Average 2012 44.14 11.19 20.52 0.43
Average 2011 44.44 10.99 20.76 0.79
Average 2010 44.68 11.58 21.24 1.27
Average 2009 45.12 12.68 21.68
Average 2008 34.87 9.18 19.76 1.18
Average 2007 33.90 9.84 19.67 0.81
Average 2006 34.10 9.11 19.37 1.72
Average 2005 34.02 10.67 20.11 3.30
Average 2004 31.01 10.15 18.84 0.00
Site 2 Spot 2 Background
Average 2016 27.77 9.80 9.36 1.86
Average 2015 28.63 10.81 10.66 0.28
Average 2014 28.80 11.02 10.57 1.07
Average 2013 28.72 10.14 9.96 1.34
Average 2012 29.60 10.55 10.89 1.03
Page 30
16 | Burrup Peninsula Aboriginal Petroglyphs: Colour Change & Spectral Mineralogy 2004–2016
Average 2011 28.86 11.27 10.88 0.53
Average 2010 29.37 11.26 11.01 1.40
Average 2009 29.80 12.46 11.60
Average 2008 26.94 11.35 12.23 1.85
Average 2007 26.14 10.73 10.68 1.40
Average 2006 26.99 11.49 11.49 2.09
Average 2005 26.42 12.71 13.09 2.89
Average 2004 25.80 10.77 11.04 0.00
Site 2 Spot 3 Engraving
Average 2016 42.50 10.53 19.69 0.11
Average 2015 42.42 10.50 19.62 4.21
Average 2014 39.24 13.20 20.18 1.81
Average 2013 39.50 11.63 19.31 1.69
Average 2012 41.07 12.02 19.81 2.19
Average 2011 42.79 10.67 19.83 3.25
Average 2010 40.16 12.56 20.13 3.62
Average 2009 43.29 10.74 19.94
Average 2008 28.87 9.67 18.98 7.70
Average 2007 36.55 9.48 19.57 3.78
Average 2006 33.04 10.82 20.02 0.82
Average 2005 33.22 10.56 19.26 5.57
Average 2004 27.68 10.56 18.70 0.00
Site 2 Spot 3 Background
Average 2016 31.83 13.18 17.07 0.83
Average 2015 31.12 12.81 16.85 0.80
Average 2014 30.96 13.58 16.97 1.43
Average 2013 30.21 12.54 16.33 0.58
Average 2012 29.67 12.63 16.16 1.38
Average 2011 30.88 12.85 16.79 1.26
Average 2010 31.72 13.52 17.46 1.19
Average 2009 30.85 13.06 16.78
Average 2008 21.35 11.54 15.50 6.66
Average 2007 16.10 8.75 12.49 2.70
Average 2006 15.82 10.24 14.72 6.40
Average 2005 21.40 12.57 16.82 2.68
Average 2004 18.82 12.25 16.15 0.00
Site 2 Spot 4 Engraving
Average 2016 42.53 14.74 21.78 0.71
Average 2015 42.06 14.26 21.58 2.08
Average 2014 41.88 16.17 22.38 1.73
Average 2013 41.73 14.62 21.63
Site 2 Spot 4 Background
Average 2016 38.42 20.97 22.88 3.26
Average 2015 35.69 19.52 21.86 0.39
Average 2014 36.00 19.32 21.73 2.67
Average 2013 38.12 20.61 22.72
Page 31
Burrup Peninsula Aboriginal Petroglyphs: Colour Change & Spectral Mineralogy 2004–2016
Figure 8: Site 4 – Woodside (White scale bar is 10 cm).
Page 32
18 | Burrup Peninsula Aboriginal Petroglyphs: Colour Change & Spectral Mineralogy 2004–2016
Table 6: Average Colour Measurements for Site 4 – Woodside (2004 – 2016). Note: KM measurements are in red. No comparison calculated for 2008-09 due to change of instrument.
Sample
Colour scale Colour difference* ΔE (change from previous year) L* a* b*
Site 4 Spot 1 Engraving
Average 2016 34.20 15.65 18.38 0.97
Average 2015 34.00 16.41 18.95 0.81
Average 2014 33.85 16.02 18.26 0.90
Average 2013 34.34 16.21 18.99 0.74
Average 2012 34.10 15.89 18.37 0.84
Average 2011 34.20 16.31 19.09 0.28
Average 2010 34.33 16.12 18.93 4.10
Average 2009 38.09 16.75 20.46
Average 2008 25.82 13.03 17.71 0.80
Average 2007 25.59 13.62 18.20 0.64
Average 2006 25.36 13.07 17.96 2.44
Average 2005 23.27 14.26 18.34 1.17
Average 2004 22.72 13.84 17.40 0.00
Site 4 Spot 1 Background
Average 2016 29.51 13.38 13.91 0.55
Average 2015 29.88 13.68 14.19 0.86
Average 2014 29.15 13.48 13.77 0.92
Average 2013 30.01 13.52 14.11 0.65
Average 2012 30.57 13.68 14.39 0.30
Average 2011 30.37 13.89 14.48 0.43
Average 2010 30.77 13.81 14.60 3.03
Average 2009 33.53 14.64 15.53
Average 2008 21.72 10.97 13.27 2.43
Average 2007 19.29 10.98 13.27 1.55
Average 2006 20.71 11.13 13.88 2.03
Average 2005 19.22 12.50 14.02 1.12
Average 2004 20.10 12.06 13.50 0.00
Site 4 Spot 2 Engraving
Average 2016 33.50 15.71 18.55 0.86
Average 2015 32.98 15.75 17.86 0.97
Average 2014 32.09 15.96 18.20 1.47
Average 2013 33.33 15.16 18.23 0.64
Average 2012 32.69 15.25 18.31 1.40
Average 2011 33.94 15.89 18.34 0.57
Average 2010 33.90 15.66 17.83 0.66
Average 2009 34.55 15.74 17.82
Average 2008 20.38 11.12 15.20 4.42
Average 2007 16.11 10.67 14.17 1.79
Average 2006 14.47 10.11 13.72 2.25
Average 2005 14.55 11.92 15.05 1.26
Average 2004 14.56 10.86 14.38 0.00
Site 4 Spot 2 Background
Average 2016 30.60 13.48 14.34 1.81
Average 2015 31.64 14.52 15.39 0.77
Average 2014 31.92 14.07 14.84 0.80
Average 2013 32.69 14.17 15.05 0.65
Average 2012 32.39 14.58 15.47 0.77
Page 33
Burrup Peninsula Aboriginal Petroglyphs: Colour Change & Spectral Mineralogy 2004–2016
Average 2011 31.68 14.39 15.24 1.88
Average 2010 33.19 14.90 16.24 1.65
Average 2009 32.34 14.33 14.95
Average 2008 26.04 12.48 15.51 1.96
Average 2007 24.40 12.56 14.44 3.66
Average 2006 27.78 13.47 15.52 1.65
Average 2005 26.27 13.66 16.13 0.35
Average 2004 26.52 13.90 16.11 0.00
Site 4 Spot 3 Engraving
Average 2016 33.25 15.68 18.56 3.84
Average 2015 36.68 16.66 19.99 0.98
Average 2014 35.86 16.36 19.54 1.86
Average 2013 37.39 16.75 20.51 0.67
Average 2012 36.93 16.42 20.17 0.51
Average 2011 37.11 16.78 20.49 0.56
Average 2010 36.89 16.57 20.02 2.75
Average 2009 34.67 15.84 18.57
Average 2008 24.53 12.51 18.03 5.04
Average 2007 19.69 11.91 16.76 4.84
Average 2006 24.31 12.43 18.13 2.61
Average 2005 23.42 14.49 19.48 1.83
Average 2004 22.41 13.68 18.19 0.00
Site 4 Spot 3 Background
Average 2016 32.18 14.48 15.55 1.84
Average 2015 33.46 15.11 16.71 1.60
Average 2014 32.29 14.60 15.74 0.86
Average 2013 33.14 14.63 15.78 1.40
Average 2012 32.10 13.99 15.10 5.15
Average 2011 31.55 13.41 10.01 7.04
Average 2010 33.53 14.97 16.58 3.98
Average 2009 30.84 13.47 14.06
Average 2008 25.79 12.62 15.06 2.75
Average 2007 27.83 13.88 16.41 2.02
Average 2006 28.76 13.10 14.79 4.00
Average 2005 25.30 13.83 16.65 1.99
Average 2004 26.33 13.30 15.04 0.00
Site 4 Spot 4 Engraving
Average 2016 34.20 15.65 18.38 1.67
Average 2015 35.41 16.49 19.17 1.01
Average 2014 35.80 16.64 20.09 0.77
Average 2013 36.32 16.23 19.70
Site 4 Spot 4 Background
Average 2016 31.72 13.74 14.93 2.51
Average 2015 33.36 14.86 16.46 1.58
Average 2014 32.60 14.41 15.13 0.83
Average 2013 31.86 14.28 15.49
Page 34
20 | Burrup Peninsula Aboriginal Petroglyphs: Colour Change & Spectral Mineralogy 2004–2016
Figure 9: Site 5 – Burrup Road (White scalar is 10 cm).
Page 35
Burrup Peninsula Aboriginal Petroglyphs: Colour Change & Spectral Mineralogy 2004–2016
Table 7: Average Colour Measurements for Site 5 – Burrup Road (2004 – 2016). Note: KM measurements are in red. No comparison calculated for 2008-09 due to change of instrument.
Sample
Colour scale Colour difference* ΔE (change from previous
year) L* a* b*
Site 5 Spot 1 Engraving
Average 2016 37.71 18.95 22.80 1.08
Average 2015 38.77 19.15 22.81 4.73
Average 2014 36.69 16.83 19.25 0.80
Average 2013 35.93 16.78 19.48 2.83
Average 2012 38.07 17.80 21.02 1.66
Average 2011 38.06 18.67 22.44 0.81
Average 2010 38.74 18.47 22.04 2.52
Average 2009 39.87 19.89 23.79
Average 2008 26.73 14.82 19.44 1.84
Average 2007 27.80 15.74 20.62 6.52
Average 2006 21.82 13.58 19.19 2.33
Average 2005 22.23 15.50 20.44 4.38
Average 2004 18.90 14.24 17.88 0.00
Site 5 Spot 1 Background
Average 2016 35.71 16.58 17.79 2.53
Average 2015 35.17 14.96 15.92 0.72
Average 2014 34.88 14.65 15.33 2.65
Average 2013 35.78 15.77 17.56 3.63
Average 2012 35.08 13.69 14.67 0.52
Average 2011 34.58 13.60 14.52 1.10
Average 2010 35.20 14.08 15.30 3.83
Average 2009 31.40 14.32 14.89
Average 2008 27.57 13.69 16.32 2.04
Average 2007 29.04 13.18 15.00 3.64
Average 2006 29.53 10.88 12.22 6.28
Average 2005 27.38 14.45 16.92 5.13
Average 2004 22.94 12.89 14.88 0.00
Site 5 Spot 2 Engraving
Average 2016 39.07 21.10 24.59 2.50
Average 2015 37.88 19.67 22.92 1.09
Average 2014 38.59 20.21 23.54 3.98
Average 2013 35.15 18.61 22.35 1.96
Average 2012 37.07 18.97 22.30 2.17
Average 2011 38.17 20.31 23.60 1.09
Average 2010 38.26 19.53 22.85 0.68
Average 2009 37.99 19.53 22.22
Average 2008 22.31 13.93 18.02 2.87
Average 2007 19.47 13.54 18.22 8.99
Average 2006 27.52 16.20 21.24 4.86
Average 2005 22.76 16.80 22.02 1.68
Average 2004 22.99 16.78 20.35 0.00
Site 5 Spot 2 Background
Average 2016 29.98 14.55 15.20 0.67
Average 2015 30.65 14.57 15.14 0.42
Average 2014 30.28 14.76 15.20 0.94
Average 2013 31.09 14.44 14.87 0.22
Average 2012 31.16 14.58 15.02 0.24
Average 2011 31.20 14.36 15.11 1.14
Page 36
22 | Burrup Peninsula Aboriginal Petroglyphs: Colour Change & Spectral Mineralogy 2004–2016
Average 2010 32.05 14.77 15.75 0.33
Average 2009 32.16 14.78 15.44
Average 2008 29.94 13.70 15.58 1.53
Average 2007 29.02 14.63 16.37 2.32
Average 2006 27.19 13.76 15.23 3.61
Average 2005 29.53 15.28 17.53
Average 2004 No
measurements
Site 5 Spot 3 Engraving
Average 2016 39.59 19.94 23.68 0.59
Average 2015 39.58 19.36 23.79 1.14
Average 2014 39.00 18.68 23.08 0.86
Average 2013 38.21 18.94 22.85 1.46
Average 2012 39.26 19.66 23.57 0.35
Average 2011 39.26 19.46 23.86 0.75
Average 2010 40.00 19.48 23.94 2.77
Average 2009 39.13 18.51 21.50
Average 2008 34.14 18.58 23.81 3.57
Average 2007 37.22 18.98 25.58 2.97
Average 2006 35.58 17.40 23.67 7.25
Average 2005 28.45 17.51 22.35 9.24
Average 2004 36.88 20.01 25.21 0.00
Site 5 Spot 3 Background
Average 2016 34.70 15.86 17.40 2.55
Average 2015 35.50 14.52 15.38 5.17
Average 2014 32.62 11.61 12.22 1.01
Average 2013 32.53 12.21 13.02 2.61
Average 2012 34.07 13.66 14.55 2.41
Average 2011 34.46 12.52 12.47 5.16
Average 2010 36.45 15.67 16.04 1.50
Average 2009 35.74 14.52 15.39
Average 2008 21.32 11.77 14.06 7.48
Average 2007 16.96 7.26 9.99 17.28
Average 2006 32.64 13.27 14.07 6.72
Average 2005 26.14 14.02 15.60 1.00
Average 2004 25.31 13.75 15.11 0.00
Site 5 Spot 4 Engraving
Average 2016 37.75 19.71 22.83 1.16
Average 2015 37.30 19.09 21.96 0.22
Average 2014 37.27 19.30 22.02 0.49
Average 2013 37.69 19.24 22.26
Site 5 Spot 4 Background
Average 2016 33.27 16.71 17.88 1.85
Average 2015 32.51 15.50 16.71 0.53
Average 2014 32.93 15.58 16.40 1.13
Average 2013 32.44 14.87 15.68
Page 37
Burrup Peninsula Aboriginal Petroglyphs: Colour Change & Spectral Mineralogy 2004–2016
Figure 10: Site 6 – Water Tanks (White scale bar is 10 cm).
Page 38
24 | Burrup Peninsula Aboriginal Petroglyphs: Colour Change & Spectral Mineralogy 2004–2016
Table 8: Average Colour Measurements for Site 6 – Water Tanks (2004 – 2016). Note: KM measurements are in red. No comparison calculated for 2008-09 due to change of instrument.
Sample
Colour scale Colour difference* ΔE (change from previous
year) L* a* b*
Site 6 Spot 1 Engraving
Average 2016 40.31 12.23 17.96 1.87
Average 2015 40.76 10.87 16.76 0.48
Average 2014 40.29 10.89 16.68 1.47
Average 2013 40.92 11.80 17.65 0.97
Average 2012 40.64 11.19 16.96 0.28
Average 2011 40.74 11.34 17.17 0.49
Average 2010 40.31 11.51 17.34 0.72
Average 2009 41.00 11.56 17.13
Average 2008 34.15 9.73 16.80 0.39
Average 2007 34.37 9.96 17.03 2.87
Average 2006 36.83 11.28 17.69 1.28
Average 2005 35.71 11.56 18.24 5.56
Average 2004 30.20 12.27 18.25 0.00
Site 6 Spot 1 Background
Average 2016 39.07 13.16 17.50 0.83
Average 2015 39.50 13.66 18.00 1.29
Average 2014 39.47 12.75 17.08 0.25
Average 2013 39.24 12.65 17.11 0.81
Average 2012 39.45 13.27 17.60 0.60
Average 2011 38.87 13.17 17.45 0.73
Average 2010 39.46 13.51 17.72 0.28
Average 2009 39.61 13.34 17.57
Average 2008 35.94 11.71 17.55 2.16
Average 2007 36.95 13.32 18.57 0.45
Average 2006 36.89 13.76 18.51 3.02
Average 2005 34.04 12.80 18.20 2.85
Average 2004 36.87 13.22 18.25 0.00
Site 6 Spot 2 Engraving
Average 2016 39.25 11.57 16.85 0.91
Average 2015 39.87 10.99 16.53 1.29
Average 2014 39.24 11.96 17.10 0.90
Average 2013 39.86 11.36 16.85 1.09
Average 2012 38.83 11.70 16.91 1.19
Average 2011 39.97 11.39 16.79 0.40
Average 2010 39.64 11.48 16.99 0.64
Average 2009 40.09 11.47 16.54
Average 2008 34.14 9.62 16.25 1.14
Average 2007 33.69 10.43 16.91 0.72
Average 2006 33.47 11.10 16.81 2.28
Average 2005 31.25 11.24 17.31 2.53
Average 2004 33.73 11.01 16.87 0.00
Site 6 Spot 2 Background
Average 2016 37.83 13.38 16.88 1.14
Average 2015 37.79 12.57 16.08 1.73
Average 2014 37.08 12.16 15.21 2.14
Average 2013 38.52 12.80 16.66 1.39
Average 2012 37.91 12.14 15.61 1.93
Average 2011 38.33 13.45 16.96 0.55
Page 39
Burrup Peninsula Aboriginal Petroglyphs: Colour Change & Spectral Mineralogy 2004–2016
Average 2010 38.01 13.23 16.57 1.37
Average 2009 38.49 12.33 15.64
Average 2008 36.20 12.05 16.95 1.27
Average 2007 35.20 11.95 16.18 0.78
Average 2006 35.90 11.98 15.83 1.09
Average 2005 34.86 11.90 16.12 1.72
Average 2004 35.27 13.08 17.31 0.00
Site 6 Spot 3 Engraving
Average 2016 39.08 11.95 16.95 2.05
Average 2015 39.48 10.53 15.52 1.60
Average 2014 38.18 11.36 15.93 0.86
Average 2013 38.92 11.68 16.22 0.76
Average 2012 39.31 11.02 16.17 0.74
Average 2011 38.72 11.45 16.03 0.36
Average 2010 38.53 11.62 16.29 11.46 Average 2009 (bird droppings on
spot)* 48.77 7.27 13.53
Average 2008 35.59 9.61 15.75 1.51
Average 2007 34.18 10.03 16.08 0.86
Average 2006 33.49 10.26 15.62 2.56
Average 2005 34.97 11.45 17.34 1.54
Average 2004 36.39 11.09 16.88 0.00
Site 6 Spot 3 Background
Average 2016 38.26 13.06 16.63 2.34
Average 2015 37.32 14.62 18.10 3.89
Average 2014 38.72 11.79 15.83 1.62
Average 2013 38.48 13.00 16.88 0.33
Average 2012 38.55 13.33 16.93 1.48
Average 2011 38.91 12.00 16.39 0.63
Average 2010 38.65 12.30 15.90 1.20
Average 2009 38.57 13.30 16.55
Average 2008 36.53 12.29 17.21 2.03
Average 2007 35.56 13.65 18.37 3.81
Average 2006 36.03 11.19 15.51 3.31
Average 2005 35.59 13.40 17.93 1.45
Average 2004 36.88 12.77 17.69 0.00
Site 6 Spot 4 Engraving
Average 2016 40.48 11.45 16.89 1.29
Average 2015 40.26 10.58 15.97 1.13
Average 2014 39.47 11.26 16.42 1.68
Average 2013 41.12 10.97 16.58
Site 6 Spot 4 Background
Average 2016 39.41 13.24 16.77 2.11
Average 2015 39.95 14.24 18.55 2.41
Average 2014 38.94 13.10 16.68 0.68
Average 2013 39.43 13.37 17.05
Page 40
26 | Burrup Peninsula Aboriginal Petroglyphs: Colour Change & Spectral Mineralogy 2004–2016
Figure 11: Site 7 – Deep Gorge (White scale bar is 25 cm).
Page 41
Burrup Peninsula Aboriginal Petroglyphs: Colour Change & Spectral Mineralogy 2004–2016
Table 9: Average Colour Measurements for Site 7 – Deep Gorge (2004 – 2016). Note: KM measurements are in red. No comparison calculated for 2008-09 due to change of instrument.
Sample
Colour scale Colour difference* ΔE (change from previous
year) L* a* b*
Site 7 Spot 1 Engraving
Average 2016 38.23 14.54 19.07 1.29
Average 2015 37.24 14.11 18.36 0.29
Average 2014 37.24 14.40 18.37 3.10
Average 2013 34.24 13.87 17.79 0.95
Average 2012 35.06 14.19 18.15 2.77
Average 2011 37.71 14.56 18.85 1.40
Average 2010 39.05 14.76 19.20 2.54
Average 2009 36.54 14.77 18.82
Average 2008 26.36 12.19 18.55 12.38
Average 2007 16.41 8.35 12.26 3.56
Average 2006 12.89 8.47 11.74 17.84
Average 2005 28.13 14.49 18.79 23.71
Average 2004 7.10 8.55 9.60 0.00
Site 7 Spot 1 Background
Average 2016 28.18 13.19 13.99 3.54
Average 2015 25.67 11.61 12.06 7.88
Average 2014 31.05 15.58 16.21 3.14
Average 2013 29.54 13.15 14.93 0.75
Average 2012 29.18 13.81 14.96 1.42
Average 2011 27.90 13.79 14.34 1.04
Average 2010 28.73 14.07 14.89 1.14
Average 2009 29.81 13.97 15.25
Average 2008 16.18 9.78 13.47 1.42
Average 2007 16.65 11.04 13.94 3.35
Average 2006 19.85 12.01 14.06 3.00
Average 2005 17.04 12.99 13.74 1.41
Average 2004 17.08 13.26 15.13 0.00
Site 7 Spot 2 Engraving
Average 2016 34.34 14.28 17.14 0.99
Average 2015 33.98 13.78 16.37 3.12
Average 2014 31.22 15.24 16.45 1.95
Average 2013 32.87 14.21 16.49 1.73
Average 2012 33.76 12.98 15.66 2.57
Average 2011 33.90 15.17 17.00 0.29
Average 2010 33.84 14.90 17.10 0.94
Average 2009 34.65 15.29 17.38
Average 2008 11.93 10.08 11.82 1.14
Average 2007 12.71 10.43 12.58 10.65
Average 2006 5.50 5.66 6.36 6.80
Average 2005 11.02 8.56 9.07 8.75
Average 2004 3.51 6.44 5.12 0.00
Site 7 Spot 2 Background
Average 2016 26.31 12.23 12.36 2.33
Average 2015 28.62 12.48 12.53 1.29
Average 2014 27.38 12.73 12.27 0.91
Average 2013 27.39 12.91 13.16 4.30
Average 2012 31.50 13.70 14.17 2.90
Average 2011 28.99 14.85 15.06 1.80
Page 42
28 | Burrup Peninsula Aboriginal Petroglyphs: Colour Change & Spectral Mineralogy 2004–2016
Average 2010 30.76 14.52 14.98 1.96
Average 2009 30.27 16.07 16.09
Average 2008 19.81 10.19 12.97 3.72
Average 2007 16.62 12.07 13.37 1.25
Average 2006 17.85 11.89 13.48 3.49
Average 2005 14.56 12.93 12.97 10.14
Average 2004 24.65 12.01 13.36 0.00
Site 7 Spot 3 Engraving
Average 2016 31.90 14.18
16.29 2.38
Average 2015 33.77 12.88 15.59 1.76
Average 2014 32.53 14.04 16.07 1.60
Average 2013 34.09 14.02 16.40 1.02
Average 2012 34.29 13.18 15.84 1.72
Average 2011 35.02 14.46 16.72 0.84
Average 2010 35.67 13.94 16.56 2.13
Average 2009 33.55 13.80 16.35
Average 2008 3.00 1.90 3.26 0.51
Average 2007 2.62 2.16 3.03 15.06
Average 2006 12.77 9.35 11.52 15.86
Average 2005 2.00 2.42 2.17
Average 2004 No
measurements
Site 7 Spot 3 Background
Average 2016 30.69 14.81 15.91 6.20
Average 2015 26.65 11.74 12.34 5.46
Average 2014 30.38 14.52 15.19 0.95
Average 2013 30.87 14.55 16.01 2.03
Average 2012 29.65 13.66 14.65 3.37
Average 2011 26.88 12.44 13.19 0.89
Average 2010 27.76 12.45 13.09 1.88
Average 2009 26.11 11.90 12.37
Average 2008 12.77 7.70 10.24 3.50
Average 2007 9.63 7.07 8.84 11.62
Average 2006 19.22 11.73 13.46 8.59
Average 2005 11.27 10.21 10.58 8.87
Average 2004 18.44 13.30 14.79 0.00
Site 7 Spot 4 Engraving
Average 2016 36.03 14.82 18.44 0.91
Average 2015 35.68 14.05 18.11 0.79
Average 2014 35.81 14.81 18.28 2.47
Average 2013 38.03 15.29 19.25
Site 7 Spot 4 Background
Average 2016 28.48 11.53 12.47 2.93
Average 2015 29.52 13.65 14.20 3.07
Average 2014 27.38 12.07 12.65 3.27
Average 2013 30.26 12.88 13.97
Page 43
Burrup Peninsula Aboriginal Petroglyphs: Colour Change & Spectral Mineralogy 2004–2016
Figure 12: Site 8 – King Bay South (Colour chart on rock is 10 cm).
Page 44
30 | Burrup Peninsula Aboriginal Petroglyphs: Colour Change & Spectral Mineralogy 2004–2016
Table 10: Average Colour Measurements for Site 8 – King Bay South (2004 – 2016). Note: KM measurements are in red. No comparison calculated for 2008-09 due to change of instrument.
Sample
Colour scale Colour difference* ΔE (change from previous year) L* a* b*
Site 8 Spot 1 Engraving
Average 2016 38.28 16.20 18.10 6.20
Average 2015 33.97 13.41 14.62 1.39
Average 2014 35.05 14.20 14.99 1.01
Average 2013 35.76 14.25 15.70 1.41
Average 2012 34.52 14.22 16.37 1.92
Average 2011 34.93 13.37 14.69 3.22
Average 2010 36.47 15.05 16.96 4.45
Average 2009 36.47 16.58 21.14
Average 2008 26.57 11.35 14.83 2.79
Average 2007 29.05 12.58 14.52 2.18
Average 2006 28.28 13.43 16.38 2.53
Average 2005 25.77 13.71 16.33 5.59
Average 2004 31.26 14.75 16.12 0.00
Site 8 Spot 1 Background
Average 2016 34.20 12.78 13.41 1.55
Average 2015 33.31 12.23 12.26 0.64
Average 2014 32.91 12.17 11.76 0.62
Average 2013 32.75 11.93 12.31 0.73
Average 2012 32.26 11.79 12.84 0.95
Average 2011 32.82 11.97 12.09 0.20
Average 2010 32.78 11.99 12.29 5.66
Average 2009 32.57 15.21 16.94
Average 2008 29.92 11.55 12.36 0.88
Average 2007 29.10 11.46 12.04 2.78
Average 2006 26.48 10.55 12.13 2.54
Average 2005 27.10 12.56 13.54 1.31
Average 2004 27.41 11.91 12.46 0.00
Site 8 Spot 2 Engraved
Average 2016 36.46 14.41 16.07 1.80
Average 2015 35.70 13.93 14.51 0.73
Average 2014 35.99 14.51 14.84 1.26
Average 2013 36.38 14.88 15.98 1.04
Average 2012 35.57 14.32 15.64 0.62
Average 2011 35.87 14.32 15.10 1.20
Average 2010 34.79 13.88 14.82 0.71
Average 2009 35.43 13.82 14.52
Average 2008 21.89 10.90 13.95 3.44
Average 2007 24.74 12.68 14.67 7.81
Average 2006 17.80 9.77 12.59 10.32
Average 2005 27.28 13.24 14.74 6.39
Average 2004 20.94 12.58 14.34 0.00
Site 8 Spot 2 Background
Average 2016 33.74 12.30 12.75 2.78
Average 2015 31.52 11.33 11.39 0.27
Average 2014 31.63 11.39 11.14 1.25
Average 2013 32.42 11.72 12.05 0.57
Average 2012 32.54 11.19 11.87 0.87
Average 2011 32.17 11.93 12.17 0.31
Page 45
Burrup Peninsula Aboriginal Petroglyphs: Colour Change & Spectral Mineralogy 2004–2016
Average 2010 32.33 12.02 12.42 0.80
Average 2009 33.08 11.91 12.16
Average 2008 27.22 10.60 12.42 1.03
Average 2007 26.40 11.17 12.17 1.13
Average 2006 25.81 10.27 11.83 2.57
Average 2005 23.69 11.53 12.56 2.21
Average 2004 25.87 11.69 12.18 0.00
Site 8 Spot 3 Engraved
Average 2016 34.16 15.81 19.79 1.30
Average 2015 35.23 16.24 20.38 1.61
Average 2014 34.09 15.74 19.36 0.79
Average 2013 33.35 15.46 19.45 0.55
Average 2012 32.85 15.23 19.44 2.13
Average 2011 34.80 16.06 19.64 2.23
Average 2010 32.95 15.46 18.54 4.19
Average 2009 34.73 13.81 15.14
Average 2008 21.31 11.85 17.11 0.66
Average 2007 20.69 11.97 16.92 2.31
Average 2006 22.85 12.46 17.59 6.21
Average 2005 16.79 12.23 16.24 5.26
Average 2004 21.72 13.40 17.68 0.00
Site 8 Spot 3 Background
Average 2016 30.93 13.52 15.05 0.66
Average 2015 30.32 13.63 14.85 0.31
Average 2014 30.14 13.48 14.64 0.60
Average 2013 30.73 13.52 14.69 0.98
Average 2012 31.32 13.62 15.47 2.75
Average 2011 32.51 15.12 17.45 0.62
Average 2010 32.11 14.65 17.36 5.78
Average 2009 33.28 12.07 12.32
Average 2008 26.73 13.08 16.21 5.03
Average 2007 22.36 11.92 14.01 1.47
Average 2006 22.57 12.53 15.33 1.62
Average 2005 24.03 13.19 15.50 3.19
Average 2004 26.98 13.09 14.27 0.00
Site 8 Spot 4 Engraved
Average 2016 34.50 15.60 18.49 0.84
Average 2015 33.70 15.66 18.73 0.20
Average 2014 33.65 15.66 18.53 1.08
Average 2013 34.11 15.20 17.67
Site 8 Spot 4 Background
Average 2016 30.50 12.83 14.16 0.32
Average 2015 30.48 12.64 13.90 0.80
Average 2014 30.89 13.15 14.35 0.29
Average 2013 30.68 12.94 14.32
Page 46
32 | Burrup Peninsula Aboriginal Petroglyphs: Colour Change & Spectral Mineralogy 2004–2016
Figure 13: Site 21 – Yara West (Colour chart on rock is 10 cm).
Page 47
Burrup Peninsula Aboriginal Petroglyphs: Colour Change & Spectral Mineralogy 2004–2016
Table 11: Average Colour Measurements for Site 21- Yara West (2014 Feb - 2016).
Sample
Colour scale Colour difference* ΔE
(change from previous year) L* a* b*
Site 21 Spot 1 Engraving
Average 2016 38.99 17.45 22.80 1.10
Average 2015 39.99 17.03 22.59 1.05
Average 2014 (July) 39.07 17.29 22.14 1.59
Average 2014 (February) 38.04 16.35 21.38 0.00
Site 21 Spot 1 Background
Average 2016 32.08 14.59 15.12 2.78
Average 2015 31.68 13.62 12.55 1.73
Average 2014 (July) 32.85 14.03 13.75 1.37
Average 2014 (February) 31.59 13.76 13.26 0.00
Site 21 Spot 2 Engraving
Average 2016 36.93 15.31 20.73 2.09
Average 2015 38.94 15.70 21.17 1.61
Average 2014 (July) 37.55 15.55 20.36 1.52
Average 2014 (February) 36.08 15.33 20.04 0.00
Site 21 Spot 2 Background
Average 2016 33.59 14.47 16.81 1.22
Average 2015 34.50 13.97 16.17 0.62
Average 2014 (July) 34.94 14.40 16.13 1.19
Average 2014 (February) 33.77 14.19 16.23 0.00
Site 21 Spot 3 Engraving
Average 2016 38.01 17.71 22.49 0.74
Average 2015 38.67 17.47 22.71 0.52
Average 2014 (July) 38.54 17.96 22.82 2.56
Average 2014 (February) 38.57 16.01 21.17 0.00
Site 21 Spot 3 Background
Average 2016 31.16 13.97 15.99 1.20
Average 2015 31.09 13.48 14.90 1.19
Average 2014 (July) 31.95 14.23 15.22 0.63
Average 2014 (February) 31.56 13.99 15.64 0.00
Site 21 Spot 4 Engraving
Average 2016 37.42 15.69 20.44 1.41
Average 2015 38.83 15.60 20.47 0.29
Average 2014 (July) 38.71 15.71 20.23 2.80
Average 2014 (February) 37.41 17.28 22.16 0.00
Site 21 Spot 4 Background
Average 2016 32.50 13.51 15.78 1.73
Average 2015 32.60 12.92 14.16 1.07
Average 2014 (July) 32.89 13.69 14.83 2.16
Average 2014 (February) 31.53 12.39 13.77 0.00
Page 48
34 | Burrup Peninsula Aboriginal Petroglyphs: Colour Change & Spectral Mineralogy 2004–2016
Figure 14: Site 22 – Yara North East (Colour chart on rock is 10 cm).
Page 49
Burrup Peninsula Aboriginal Petroglyphs: Colour Change & Spectral Mineralogy 2004–2016
Table 12: Average Colour Measurements for Site 22 – Yara North East (2014 Feb - 2016).
Sample
Colour scale Colour difference* ΔE
(change from previous year) L* a* b*
Site 22 Spot 1 Engraving
Average 2016 36.15 13.38 17.38 1.18
Average 2015 37.30 13.46 17.62 2.30
Average 2014 (July) 39.12 13.54 19.02 2.91
Average 2014 (February) 36.82 13.54 17.23 0.00
Site 22 Spot 1 Background
Average 2016 33.15 12.05 12.53 0.48
Average 2015 32.76 12.10 12.26 1.38
Average 2014 (July) 34.08 12.21 12.63 0.39
Average 2014 (February) 33.80 12.11 12.37 0.00
Site 22 Spot 2 Engraving
Average 2016 33.72 13.75 16.62 3.74
Average 2015 36.57 14.31 18.97 0.60
Average 2014 (July) 37.08 14.33 18.65 2.60
Average 2014 (February) 35.15 13.64 17.04 0.00
Site 22 Spot 2 Background
Average 2016 29.70 12.18 13.41 3.51
Average 2015 33.12 12.54 14.10 0.78
Average 2014 (July) 33.85 12.72 13.90 1.54
Average 2014 (February) 32.32 12.52 14.00 0.00
Site 22 Spot 3 Engraving
Average 2016 35.99 14.19 18.02 2.94
Average 2015 38.43 14.61 19.60 0.17
Average 2014 (July) 38.34 14.49 19.51 1.71
Average 2014 (February) 37.11 14.41 18.33 0.00
Site 22 Spot 3 Background
Average 2016 32.77 12.93 14.71 2.09
Average 2015 34.66 13.37 15.48 2.08
Average 2014 (July) 33.71 12.53 13.82 0.53
Average 2014 (February) 34.06 12.75 14.15 0.00
Site 22 Spot 4 Engraving
Average 2016 32.54 13.50 16.98 7.04
Average 2015 39.09 14.05 19.51 3.47
Average 2014 (July) 36.12 13.99 17.71 1.43
Average 2014 (February) 37.32 14.11 18.48 0.00
Site 22 Spot 4 Background
Average 2016 31.22 11.54 12.13 2.61
Average 2015 33.71 12.05 12.71 0.74
Average 2014 (July) 33.96 12.41 13.31 1.07
Average 2014 (February) 33.63 11.92 12.42 0.00
Page 50
36 | Burrup Peninsula Aboriginal Petroglyphs: Colour Change & Spectral Mineralogy 2004–2016
Figure 15: Site 23 – Yara East (Colour chart on rock is 10 cm).
Page 51
Burrup Peninsula Aboriginal Petroglyphs: Colour Change & Spectral Mineralogy 2004–2016
Table 13: Average Colour Measurements for Site 23 - Yara East (2014 Feb - 2016).
Sample
Colour scale Colour difference* ΔE
(change from previous year) L* a* b*
Site 23 Spot 1 Engraving
Average 2016 38.74 10.21 17.49 0.26
Average 2015 38.69 10.26 17.74 2.66
Average 2014 (July) 36.71 9.61 16.09 1.72
Average 2014 (February) 38.39 9.59 16.49 0.00
Site 23 Spot 1 Background
Average 2016 33.90 11.71 15.45 1.80
Average 2015 34.77 10.52 14.41 1.45
Average 2014 (July) 34.54 11.54 15.42 1.00
Average 2014 (February) 35.16 12.08 16.00 0.00
Site 23 Spot 2 Engraving
Average 2016 35.40 13.19 19.56 1.23
Average 2015 34.49 12.78 18.84 2.10
Average 2014 (July) 32.86 11.53 18.35 2.93
Average 2014 (February) 35.36 12.90 19.05 0.00
Site 23 Spot 2 Background
Average 2016 34.59 13.58 17.48 2.04
Average 2015 36.34 13.17 18.45 1.39
Average 2014 (July) 37.26 14.00 19.05 0.43
Average 2014 (February) 36.93 14.28 19.04 0.00
Site 23 Spot 3 Engraving
Average 2016 37.54 10.56 16.75 0.36
Average 2015 37.84 10.76 16.71 0.59
Average 2014 (July) 37.71 10.69 17.28 0.48
Average 2014 (February) 38.17 10.72 17.42 0.00
Site 23 Spot 3 Background
Average 2016 34.03 14.18 18.01 4.09
Average 2015 31.34 13.20 15.09 1.50
Average 2014 (July) 31.86 14.14 16.13 0.70
Average 2014 (February) 31.70 13.65 15.65 0.00
Site 23 Spot 4 Engraving
Average 2016 38.45 9.91 16.94 1.03
Average 2015 37.48 10.24 16.80 0.78
Average 2014 (July) 37.82 10.65 17.36 1.47
Average 2014 (February) 36.39 10.94 17.20 0.00
Site 23 Spot 4 Background
Average 2016 35.57 9.67 13.24 0.66
Average 2015 35.22 9.45 12.72 4.27
Average 2014 (July) 32.12 7.46 10.56 3.24
Average 2014 (February) 31.61 9.92 12.60 0.00
The averaged colour change for each site is presented in Table 14, which is an overall average for each of
the six spots measured on a petroglyph, with data from the additional fourth engraving and background
spot included in 2014, 2015 and 2016 results1. The colour change for both the Southern and Northern sites
for the period are reasonably consistent over the measurement period. At any given time interval, the
1 Spot 4 has not been included prior to 2014 as initial measurements were taken in 2013, therefore no colour change for previous years could be calculated.
Page 52
38 | Burrup Peninsula Aboriginal Petroglyphs: Colour Change & Spectral Mineralogy 2004–2016
average change at the Southern and Northern sites are comparable, indicating that accelerated weathering
at Southern sites within close proximity to industrial complexes was not observed.
Table 14: Averaged colour change for each site. Note: KM measurements are in red. No comparison calculated for 2008-09 due to change of instrument.
*Comparison of 2004 with 2016 used 2004 BYK data converted to be comparable with KM data.
Site Averaged site-specific
colour change
ΔE
15-16 ΔE
14-15 ΔE
13–14 ΔE
12–13 ΔE
11–12 ΔE
10–11 ΔE
09–10 ΔE
08–09 ΔE
07–08 ΔE
06–07 ΔE
05–06 ΔE
04–05 ΔE
04–16*
4 1.75 0.94 0.93 0.79 1.50 1.79 2.70 2.90 2.42 2.34 1.29 11.10
5 1.61 1.80 1.48 2.12 1.23 1.68 1.94 3.22 6.95 4.98 4.29 13.88
6 1.56 1.13 1.20 0.89 1.04 0.53 2.61 1.42 1.58 2.23 2.61 13.78
7 2.57 1.49 2.17 1.80 2.46 1.04 1.76 3.78 7.58 9.00 10.58 9.34
8 1.93 0.98 0.86 0.88 1.54 1.30 3.60 2.30 2.94 4.09 3.99 11.76
21 1.53 0.87 1.73
22 2.92 1.64 1.35
23 1.43 1.53 1.50
Overall southern
sites average
1.91
1.30
1.40 1.30 1.55 1.27 2.51 2.72 4.30 4.53 4.55 11.97
1 1.98 2.69 1.87 2.15 1.60 1.37 1.16 4.06 4.50 3.43 2.88 13.54
2 1.71 3.18 1.82 1.03 1.59 1.31 2.30 4.01 2.38 2.88 3.56 14.06
Overall northern
sites average
1.85 2.93 1.84 1.59 1.59 1.34 1.73 4.05 3.44 3.16 3.22 13.80
The thirteen consecutive years of colour change measurements have allowed an examination of whether
any trends are apparent at the sites, either individually or as a group; it has also allowed whether the
colour change measurements at the southern test sites are consistently or significantly different to those at
the northern control sites.
Considering the year-to-year ΔE values for 2004–16, which indicates the colour change over the thirteen-
year interval from 2004 to 2016, site 7 consistently displayed the greatest year-to-year colour change up to
2009. For sites 4, 6 and 8 (southern), the colour change values for the interval 2004–16 were comparable to
or lower than those of the northern sites 1 and 2. With the northern sites as the control sites, and the
southern sites as test sites, there were no indications that changes at both sites were substantively
different.
Where the colour difference appeared to have larger values overall (sites 5 and 7), this is believed to be
partially due to the surface roughness of the rock, which influenced the placement of the
spectrophotometer. This is supported by the improvement in the consistency of the results at these sites
from 2009 onwards, where the new Konica Minolta spectrophotometer, with an improved head
configuration, was deployed for data collection. At site 5, spot 3 there is a large patch of black patina (see
Figure 9) which means that colour measurement is much more dependent on instrument placement at that
Page 53
Burrup Peninsula Aboriginal Petroglyphs: Colour Change & Spectral Mineralogy 2004–2016
spot. The site with the smoothest rock face (site 6, Figure 10), however, did not consistently record the
lowest colour change values so measurement repeatability is therefore dependent on more than just
surface roughness.
The 2016 data for sites 21, 22 and 23 all show average colour change values that are similar to those of the
northern control sites, and are comparable to Sites 5, 6 and 7, which form part of the monitoring for the
Yara Pilbara Nitrates Pty Ltd (YPNPL) Technical Ammonium Nitrate Production Facility Project.
Page 54
40 | Burrup Peninsula Aboriginal Petroglyphs: Colour Change & Spectral Mineralogy 2004–2016
Table 15: Colour difference between background and petroglyph
Note: KM measurements are in red.
Spot 1 Site 1 Site 2 Site 4 Site 5 Site 6 Site 7 Site 8 Site 21 Site 22 Site 23
Average 2016 10.5 16.8 7.0 5.9 1.6 11.3 7.1 10.7 5.9 5.5
Average 2015 12.8 12.7 6.9 8.8 3.3 13.4 2.7 13.4 7.2 5.1
Average 2014 10.9 6.5 7.0 4.8 2.1 6.7 4.4 10.9 8.2 3.0
Average 2013 12.4 10.0 7.1 2.2 2.0 5.5 5.1 10.7 5.9 4.1
Average 2012 12.3 10.9 5.8 8.1 2.5 6.7 4.8 Average 2011 12.2 13.1 6.5 10.0 2.6 10.8 3.6 Average 2010 11.3 12.0 6.1 8.8 2.2 11.2 6.7 Average 2009 10.5 9.0 7.0 13.5 2.3 7.7 5.9 Average 2008 12.7 5.5 6.4 3.4 2.8 11.6 4.2 Average 2007 12.3 6.9 8.4 6.3 4.5 3.2 2.7 Average 2006 13.8 9.3 6.5 10.7 2.6 8.2 5.4 Average 2005 13.8 7.6 6.2 6.3 2.1 12.3 3.3 Average 2004 16.0 9.8 5.0 5.2 6.7 12.3 6.0
Spot 2
Average 2016 8.9 19.9 5.6 14.6 2.3 9.6 4.8 5.2 5.4 2.3
Average 2015 9.3 18.5 3.1 11.8 2.6 6.7 5.8 6.9 6.2 1.9
Average 2014 12.0 19.2 3.9 13.0 2.9 6.2 6.5 5.1 6.0 5.1
Average 2013 10.7 18.7 3.4 9.5 2.0 6.5 6.4 4.6 4.3 2.1
Average 2012 7.2 17.5 2.9 10.4 1.7 2.8 5.8 Average 2011 11.8 18.5 4.1 12.5 2.6 5.3 5.3 Average 2010 7.6 18.4 1.9 10.6 2.4 3.8 3.9 Average 2009 10.7 18.3 3.9 10.1 2.0 4.6 3.8 Average 2008 11.7 11.1 5.8 8.0 3.3 8.0 5.6 Average 2007 9.5 11.9 8.5 9.8 2.3 4.3 3.4 Average 2006 20.6 10.9 13.8 6.5 2.8 15.6 8.1 Average 2005 13.2 10.5 11.9 8.3 3.9 6.8 4.5 Average 2004 19.4 9.4 12.5 0.0 2.6 23.4 5.5
Spot 3
Average 2016 15.5 11.3 3.4 8.9 1.4 1.4 6.2 10.2 4.8 5.2
Average 2015 13.9 11.8 4.8 10.5 5.2 7.9 7.8 11.7 5.7 7.1
Average 2014 11.3 8.9 5.5 14.4 0.7 2.4 6.6 10.7 7.6 6.9
Average 2013 11.4 9.8 6.7 13.2 1.5 3.3 5.8 9.2 5.4 7.3
Average 2012 12.2 12.0 7.4 12.0 2.5 4.8 4.5 Average 2011 12.4 12.5 12.3 14.2 0.7 9.1 3.3 Average 2010 12.9 8.9 5.1 9.5 0.8 8.8 1.7 Average 2009 13.7 13.0 6.4 8.1 12.2 8.7 3.6 Average 2008 19.7 8.5 3.2 17.5 3.2 13.3 5.6 Average 2007 9.9 21.7 8.4 28.1 4.5 10.3 3.4 Average 2006 12.8 18.0 5.6 10.9 2.7 7.1 2.3 Average 2005 16.3 12.2 3.5 7.9 2.1 14.7 7.3 Average 2004 17.7 9.4 5.0 16.6 1.9 0.0 6.3
Spot 4
Average 2016 10.7 7.5 4.7 7.3 2.1 10.2 6.5 7.1 5.4 4.7
Average 2015 14.3 8.3 3.8 8.0 4.5 7.3 6.5 9.3 8.9 4.7
Average 2014 7.6 6.7 6.3 8.0 1.9 10.5 5.6 8.2 5.2 9.4
Average 2013 12.1 7.1 6.4 9.4 3.0 9.7 5.3 11.4 7.4 6.7
Page 55
Burrup Peninsula Aboriginal Petroglyphs: Colour Change & Spectral Mineralogy 2004–2016
5. Spectral Mineralogy
5.1 Reflectance spectroscopy
Reflectance spectroscopy is now available as a field tool for geologists through the development of
portable instruments like the Analytical Spectral Device (ASD) FieldSpecPro spectrometer. These systems
measure diagnostic mineral spectral features that are particularly suitable for qualitative analysis of many
geological materials. Some of the advantages of the technique include little sample preparation (if any),
and rapid measurement (1 to 5 seconds) though the measurement is restricted to the sample’s surface.
CSIRO has been involved in the development of reflectance spectroscopy research (Ramanaidou et al.,
2008; 2015 and references within) techniques for characterising iron ore, gold, bauxites, mineral sands,
talc, lateritic nickel and asbestos. Using field reflectance spectrometry, the mineralogy of the samples can
be characterised based on key spectral features.
Reflectance spectroscopy, the analysis of reflected light, between 400 and 2500 nm is now a proven
technique for mineral analysis in both the laboratory and in the field. Reflectance spectroscopy has been
used intensely to characterise weathering minerals such as iron oxides and clay minerals. The most
common iron oxides minerals (hematite, maghemite and goethite) have broad absorptions between 400
and 1000 nm (visible and near infrared or VNIR), whereas OH-bearing minerals such as phyllosilicates,
inosilicates as well as carbonates and sulphates show narrow absorption features between 1000 to 2500
nm (short wave infrared or SWIR). The combination of these wavelength ranges provides a step forward
towards quick and accurate mineral characterisation.
The ASD covers the spectral range 350-2500 nm with a spectral resolution of three nm at 700 nm using
three detectors: a 512 element Si photodiode array for the 400-1000 nm range and two separate, thermo-
electrically cooled, graded index InGaAs photodiodes for the 1000-2500 nm range. The input is through a
1.4 m fibre optic. The average scanning time to acquire a spectrum is 1 second. There are two ways of
operating the ASD spectroradiometer, it consists of either using (1) an external source of light (sun or
artificial) or (2) an internal source of light. The absolute measurements are obtained using a white
reference plate that reflects 100% of the light in the 400 to 2500 nm wavelength range. For this study, the
second option for lighting was used as it eliminates any external light interference. The area measured by
the ASD spectrometer is 3.14 cm2.
Page 56
42 | Burrup Peninsula Aboriginal Petroglyphs: Colour Change & Spectral Mineralogy 2004–2016
5.2 Spectral Results for 2004-2016
PICTURES AND SPECTRA
For each site, the description and interpretation include:
A digital image of the engraving with the location of the measurements: spot 1, 2, and 3 and, from
2013 a new spot labelled 4 for both engraving and background. The new 4th engraving and
background analysis spots have been added to the photographs.
A comparison of the average spectra for the engravings and background for each of the three (or
four) spots between 2004 and 2016.
The following pages present photographs of the monitored petroglyphs at each site, showing the
sampling points of engravings and background rock, and the average colour measurements that
were recorded at these points each year.
Figure 16: ASD FieldSpecPro and Konica Minolta CM-700dspectrophotometer operating on petroglyphs in the
Burrup Peninsula (2013)
All the historical data collected for the all the spectrometers have been systematically archived and were
sent to DER with consistent naming conventions, in a data format that is easily read by standard statistical
software.
Page 57
Burrup Peninsula Aboriginal Petroglyphs: Colour Change & Spectral Mineralogy 2004–2016
Site 1
Site 1
Spot 1
Site 1
Spot 2
Site 1
Spot 3
Site 1
Spot 4
Page 58
44 | Burrup Peninsula Aboriginal Petroglyphs: Colour Change & Spectral Mineralogy 2004–2016
Site 2
Site 2
Spot 1
Site 2
Spot 2
Site 2
Spot 3
Site 2
Spot 4
Page 59
Burrup Peninsula Aboriginal Petroglyphs: Colour Change & Spectral Mineralogy 2004–2016
Site 4
Site 4
Spot 1
Site 4
Spot 2
Site 4
Spot 3
Site 4
Spot 4
Page 60
46 | Burrup Peninsula Aboriginal Petroglyphs: Colour Change & Spectral Mineralogy 2004–2016
Site 5
Spot 1
Site 5
Spot 2
Site 5
Spot 3
Site 5
Spot 4
Page 61
Burrup Peninsula Aboriginal Petroglyphs: Colour Change & Spectral Mineralogy 2004–2016
Site 6
Spot 1
Site 6
Spot 2
Site 6
Spot 3
Site 6
Spot 4
Page 62
48 | Burrup Peninsula Aboriginal Petroglyphs: Colour Change & Spectral Mineralogy 2004–2016
Site 7
Spot 1
Site 7
Spot 2
Site 7
Spot 3
Site7
Spot 4
Page 63
Burrup Peninsula Aboriginal Petroglyphs: Colour Change & Spectral Mineralogy 2004–2016
Site 8
Site 8 Spot 1
Site 8 Spot 2
Site 8 Spot 3
Site 8 Spot 4
Page 64
50 | Burrup Peninsula Aboriginal Petroglyphs: Colour Change & Spectral Mineralogy 2004–2016
Site 21
Site 21 Spot
1
Site 21 Spot
2
Site 21 Spot
3
Site 21 Spot
4
Page 65
Burrup Peninsula Aboriginal Petroglyphs: Colour Change & Spectral Mineralogy 2004–2016
Site 22
Site 22 Spot
1
Site 22 Spot
2
Site 22 Spot
3
Site 22 Spot
4
Page 66
52 | Burrup Peninsula Aboriginal Petroglyphs: Colour Change & Spectral Mineralogy 2004–2016
Site 23
Site 23 Spot
1
Site 23 Spot
2
Site 23 Spot
3
Site 23 Spot
4
Figure 17: Digital image of the engraving with the location of the measurements (spot 1, 2, 3 and 4 for both
engraving and background. Spot 4 measured from 2013). Comparison of the average spectra for the engravings and
background for each of the three spots between 2004 and 2016.
Page 67
Burrup Peninsula Aboriginal Petroglyphs: Colour Change & Spectral Mineralogy 2004–2016
5.3 Spectral parameters
Spectral parameters were extracted from the spectra and include:
1. The depth (D900) and minimum wavelength (W900) of the large 900nm centred absorption
providing information on the iron oxides
2. The depth of the chlorite absorption at 2250 nm after local Hull removal - DChlorite (residual
mineral from the fresh rocks)
3. The depth of the kaolinite at 2206 nm after local Hull removal (DKaolinite) and, when present,
gibbsite (DGibbsite) absorptions (secondary minerals resulting from the weathering of the primary
minerals)
Minimum Maximum
D900 0.0093 0.19
W900 881 913
DChlorite 0.00021 0.13
DKaolinite 0.001 0.11
DGibbsite 0 0.025
Table 16 Minimum and maximum of spectral parameters for all sites.
Page 68
54 | Burrup Peninsula Aboriginal Petroglyphs: Colour Change & Spectral Mineralogy 2004–2016
Page 69
Burrup Peninsula Aboriginal Petroglyphs: Colour Change & Spectral Mineralogy 2004–2016
Page 70
56 | Burrup Peninsula Aboriginal Petroglyphs: Colour Change & Spectral Mineralogy 2004–2016
Page 71
Burrup Peninsula Aboriginal Petroglyphs: Colour Change & Spectral Mineralogy 2004–2016
Page 72
58 | Burrup Peninsula Aboriginal Petroglyphs: Colour Change & Spectral Mineralogy 2004–2016
Page 73
Burrup Peninsula Aboriginal Petroglyphs: Colour Change & Spectral Mineralogy 2004–2016
Page 74
60 | Burrup Peninsula Aboriginal Petroglyphs: Colour Change & Spectral Mineralogy 2004–2016
Page 75
Burrup Peninsula Aboriginal Petroglyphs: Colour Change & Spectral Mineralogy 2004–2016
Page 76
62 | Burrup Peninsula Aboriginal Petroglyphs: Colour Change & Spectral Mineralogy 2004–2016
Page 77
Burrup Peninsula Aboriginal Petroglyphs: Colour Change & Spectral Mineralogy 2004–2016
Page 78
64 | Burrup Peninsula Aboriginal Petroglyphs: Colour Change & Spectral Mineralogy 2004–2016
Page 79
Burrup Peninsula Aboriginal Petroglyphs: Colour Change & Spectral Mineralogy 2004–2016
Page 80
66 | Burrup Peninsula Aboriginal Petroglyphs: Colour Change & Spectral Mineralogy 2004–2016
Page 81
Burrup Peninsula Aboriginal Petroglyphs: Colour Change & Spectral Mineralogy 2004–2016
Page 82
68 | Burrup Peninsula Aboriginal Petroglyphs: Colour Change & Spectral Mineralogy 2004–2016
Page 83
Burrup Peninsula Aboriginal Petroglyphs: Colour Change & Spectral Mineralogy 2004–2016
Page 84
70 | Burrup Peninsula Aboriginal Petroglyphs: Colour Change & Spectral Mineralogy 2004–2016
Page 85
Burrup Peninsula Aboriginal Petroglyphs: Colour Change & Spectral Mineralogy 2004–2016
Page 86
72 | Burrup Peninsula Aboriginal Petroglyphs: Colour Change & Spectral Mineralogy 2004–2016
Page 87
Burrup Peninsula Aboriginal Petroglyphs: Colour Change & Spectral Mineralogy 2004–2016
Figure 18. Spectral parameters for all sites. Each parameter has been expressed with the same scale for all sites. [Grab your reader’s attention with a great quote from the document
or use this space to emphasize a key point. To place this text box
anywhere on the page, just drag it.]
Page 88
74 | Burrup Peninsula Aboriginal Petroglyphs: Colour Change & Spectral Mineralogy 2004–2016
RESULTS FROM THE SPECTRAL PARAMETERS
The spectral parameters extracted from the reflectance spectra of all sites and, all backgrounds and
engravings for both the reference sites (1 and 2) and the sites (4, 5, 6, 7, 8, 21, 22 and 23) close to
the industries, show relatively large variations but no systematic changes or trend (Figure 18).
Page 89
Burrup Peninsula Aboriginal Petroglyphs: Colour Change & Spectral Mineralogy 2004–2016
6. Statistical Analysis of BYK, KM and ASD colour measurements
6.1 Introduction
Beginning in 2004, annual measurements of colour were made on Aboriginal rock art at seven sites
around the Burrup peninsula, five southern sites close to industry and two northern control sites
further from industry (with three further southern sites added in 2014). The control sites are labelled
as site 1 and site 2. At each site, three spots were chosen (with another spot per rock added in 2013)
and at each spot, measurements were made on both the engraving and a nearby piece of
background, using an ASD spectrophotometer. The same instrument has been used throughout all
the years of the study.
Measurements of colour values L*, a* and b* were also made with a BYK spectrophotometer from
2004 to 2012. For reasons mentioned earlier, a new KM photospectrometer was introduced in 2009,
and has been used each year from then until now. Both BYK and KM measurements (as well as ASD
measurements) were thus made from 2009 to 2012.
L* is a measure of lightness, from 0 (black) to 100 (white); a* and b* can take positive or negative
values. Higher a* values correspond to increasing red colour and lower values to increasing green
colour; b* similarly records the contrast between yellow (high values) and blue (low values). Data
has been calculated relative to the D65 standard illuminant, intended to represent average daylight.
Following recent reviews, and correction of a small number of coding errors in the data files, an
updated statistical analysis of all the data – totalling over 24,000 colour measurements – was
undertaken. Each data point is plotted in Figure 19 to Figure 58. Further reference is made to these
figures below.
Summarising the results of this section: there is reason to doubt the validity of data from the BYK
spectrophotometer, which contradicts data from the other spectrometers. Data from the KM
spectrophotometer appears to suggest that there is significant change in L* values over time, but
not in a* or b* values. Data from the ASD spectrometer indicates possible change over time in the L*
and a* data, but not the b* data. None of the instruments demonstrates any difference in the rate
of change between northern and southern sites.
Page 90
76 | Burrup Peninsula Aboriginal Petroglyphs: Colour Change & Spectral Mineralogy 2004–2016
6.2 Comparing BYK and KM photospectrometers
Among the reasons for replacing the BYK photospectrometer was the high variation in
measurements taken with it, as illustrated in plots of the data (e.g. Figure 19). Note that the
variation in BYK measurements is generally larger on the engraving. This is likely in part because
engravings are in most cases not very wide and tend to be rougher than the background rock. Thus,
it may be harder to place the spectrophotometer perfectly flat against the rock surface
(measurements are made by holding the spectrophotometer against the targeted part of the rock).
This problem does not affect the KM instrument, which has a smaller head, to the same extent as it
does the BYK spectrophotometer.
The BYK instrument also recorded some very dark colours, even on the engravings, which on most
rocks are lighter than the background rock. The average colour recorded by each instrument on the
background and engraving at each spot on each rock is drawn in Figure 19 to Figure 58. The BYK
instrument, alone, has extremely dark average colour measurements at some sites. This may
indicate the instrument was unable to be placed flat on the rock. Low lightness values can indicate
that some reflected light has escaped through the tiny gap between instrument and rock surface.
There are even several cases such as that shown in Figure 19 where the BYK instrument recorded the
engraving to be lighter than the background, while the other instruments gave the opposite
conclusion.
A regression calibration between the two instruments in 2013 suggested that KM measurements
could be predicted ‘with at least reasonable accuracy’ using the BYK data, despite ‘occasional strong
differences’ between the two data sets. The report noted that KM data can be predicted with
reasonable accuracy simply by knowing the site, spot and type (background or engraving). Indeed,
the variation that can be explained by these factors is greater than that explicable by the BYK
measurements of the same features. However, taking these factors into account, the BYK
measurement of L* significantly improved the estimation of the KM measurement of L*, and tests
show the BYK measurements of a* and b* to contribute less information, offering no significant
improvement alongside the BYK L* measurement. The same applies to corresponding estimation of
a* and b*.
However, this only shows the measurements are correlated – and by a different relationship on each
spot. (As noted, this means the regressions give no general method of predicting KM data from BYK
– but for the purposes of the analysis, no such generalisation is needed.) The dependence on spot
again suggests that the BYK photospectrometer was affected by the varying nature of the surfaces of
the rocks to which it was applied. The given standard errors for predicting KM data were around 1
unit for each of L*, a* and b*, quite large given that the median range of these variables on any spot
(as depicted in Figure 19 to Figure 58) is around 7 units (L*, b*) or 4 units (a*). In addition, a
calibration model independent of measurement location would have substantially greater standard
errors again.
A more important concern is that the largest changes in BYK occurred before any KM measurements
were made (see for example Figure 39). Regardless of the calibration method used, it is questionable
Page 91
Burrup Peninsula Aboriginal Petroglyphs: Colour Change & Spectral Mineralogy 2004–2016
whether correlations calculated from stable BYK data would extrapolate to the earlier data, which is
more variable and lies outside the range on which the correlations were established. The early
trends of BYK data show in some cases dramatic change; but in later years, these trends are much
more stable. (A simple solution would be that the last years of BYK data plotted in Figure 19 to
Figure 58 have in fact already been converted, via the above calibration, in order to compare more
closely with KM data; however, a check of the data that was used for calibration regressions rules
out this explanation.)
An objective assessment of both BYK and KM data becomes available by calculating L*, a* and b*
from the spectra recorded with the ASD spectrophotometer. Conversion from the recorded spectra
to L*, a* and b* data was performed using proprietary CSIRO software. These converted L*, a* and
b* values are the ASD data plotted in Figure 19 to Figure 58. As illustrated for example in Figure 19,
the ASD data is steady across the entire time period, comparable with the KM values and contrasting
with some BYK data.
(Note that L*, a* and b* values have been calculated from each individual spectrum recorded on the
ASD spectrophotometer. The average values used in this document are averages of these individual
transformed values, though the transformation process is nonlinear so this result differs slightly
from the values calculated from an average spectrum. This approach follows independent advice
obtained from Data Analysis Australia.)
Figure 59 to Figure 61 compare the colour measurements of BYK and KM measurements with those
calculated from ASD spectra across the background and engraving of all sites and spots in all years.
The agreement with the KM instrument is fairly close, with fairly high values of R2 around 0.8
(meaning the correlation between the values is around 90 %) and the dashed regression lines close
to the theoretical solid line. However, the correlations with the BYK instrument are fairly poor, with
low R2 values of 0.4 or less, and the regression lines diverge far from the solid line, indicating that
measurements on the two instruments are far from equivalent. The BYK instrument tends to give
lower estimates of L*, as noted, as well as a* and b*.
Figure 59 to Figure 61 show the difference between measurements from the ASD and BYK
instruments varies widely across the sites, and is more pronounced on engravings. This again
suggests that unevenness, which varies across sites but tends to be greater on engravings, may have
caused BYK data to be unreliable.
Since the ASD and KM values agree well, and the BYK instrument agrees with neither, this tends to
discredit the accuracy of data measured using the BYK instrument. As noted previously, the BYK
instrument has higher variation, particularly on engravings; meaning that some colours appear
darker than the backgrounds. This contradicts the other instruments where the backgrounds are
always darker than the associated engravings. The strong trends identified in the BYK data are not
found in either the KM or ASD data, this suggests that the BYK data is of doubtful value in
understanding colour change in the rocks.
This agrees with the recent independent conclusions of Data Analysis Australia.
While it is important to be clear that the recorded BYK data do show significant directional colour
change over time, at differing rates on background and engraving of each spot at each site, the
Page 92
78 | Burrup Peninsula Aboriginal Petroglyphs: Colour Change & Spectral Mineralogy 2004–2016
doubts over this BYK data make it impossible to conclude that it proves colour change actually
occurred.
(Ignoring for a moment these reservations, it is noteworthy that the trends in BYK data from
southern sites near industry do not differ significantly from the trends recorded at northern control
sites further from industry. The BYK data from northern site 1, plotted in Figures 19-21, shows as
much change as the southern sites, and more than several (compare for example the BYK data from
site 6, plotted in Figure 35 to Figure 37). The BYK data thus does not demonstrate any difference in
colour change between southern sites close to industry and northern control sites.)
However, for the reasons given above, conclusions on the changes in the rocks cannot reliably be
based on the BYK data. Rather, analysis should be conducted of data both from the KM
spectrophotometer since its introduction and from the ASD spectrophotometer (the only instrument
used for all years of the study), before overall conclusions are drawn.
It should be noted that, as data from the BYK spectrophotometer appears unreliable for drawing
conclusions on colour change in the rock art, the cross calibration issues with the BYK – Gardner
(BYK) portable photospectrometer and the Konica Minolta (KM) photospectrometer will not be
undertaken.
All the photospectrometer data have been provided to DER for safekeeping.
Page 93
Burrup Peninsula Aboriginal Petroglyphs: Colour Change & Spectral Mineralogy 2004–2016
Figure 19. The three plots show L*, a* and b* measurements respectively from BYK, KM and ASD
spectrometers for background and engraving on site 1 spot 1. Rectangles above each graph show the
average recorded colour for each measurement in each year (identical in each graph). Change in these
recorded colours over time is hard to detect visually, except in the BYK data.
2005 2010 2015
020
40
60
Site 1 spot 1
year
L*
BYK engravingBYK backgroundKM engravingKM backgroundASD engravingASD background
2005 2010 2015
05
10
15
20
25
30
35
Site 1 spot 1
year
a*
BYK engravingBYK backgroundKM engravingKM backgroundASD engravingASD background
2005 2010 2015
010
20
30
40
Site 1 spot 1
year
b*
BYK engravingBYK backgroundKM engravingKM backgroundASD engravingASD background
Page 94
80 | Burrup Peninsula Aboriginal Petroglyphs: Colour Change & Spectral Mineralogy 2004–2016
Figure 20. Site 1 spot 2 colour measurements, plotted as in Figure 19
2005 2010 2015
020
40
60
Site 1 spot 2
year
L*
BYK engravingBYK backgroundKM engravingKM backgroundASD engravingASD background
2005 2010 2015
05
10
15
20
25
30
35
Site 1 spot 2
year
a*
BYK engravingBYK backgroundKM engravingKM backgroundASD engravingASD background
2005 2010 2015
010
20
30
40
Site 1 spot 2
year
b*
BYK engravingBYK backgroundKM engravingKM backgroundASD engravingASD background
Page 95
Burrup Peninsula Aboriginal Petroglyphs: Colour Change & Spectral Mineralogy 2004–2016
Figure 21. Site 1 spot 3 colour measurements, plotted as in Figure 19.
2005 2010 2015
020
40
60
Site 1 spot 3
year
L*
BYK engravingBYK backgroundKM engravingKM backgroundASD engravingASD background
2005 2010 2015
05
10
15
20
25
30
35
Site 1 spot 3
year
a*
BYK engravingBYK backgroundKM engravingKM backgroundASD engravingASD background
2005 2010 2015
010
20
30
40
Site 1 spot 3
year
b*
BYK engravingBYK backgroundKM engravingKM backgroundASD engravingASD background
Page 96
82 | Burrup Peninsula Aboriginal Petroglyphs: Colour Change & Spectral Mineralogy 2004–2016
Figure 22. Site 1 spot 4 colour measurements, plotted as in Figure 19.
2005 2010 2015
020
40
60
Site 1 spot 4
year
L*
BYK engravingBYK backgroundKM engravingKM backgroundASD engravingASD background
2005 2010 2015
05
10
15
20
25
30
35
Site 1 spot 4
year
a*
BYK engravingBYK backgroundKM engravingKM backgroundASD engravingASD background
2005 2010 2015
010
20
30
40
Site 1 spot 4
year
b*
BYK engravingBYK backgroundKM engravingKM backgroundASD engravingASD background
Page 97
Burrup Peninsula Aboriginal Petroglyphs: Colour Change & Spectral Mineralogy 2004–2016
Figure 23. Site 2 spot 1 colour measurements, plotted as inFigure 19.
2005 2010 2015
020
40
60
Site 2 spot 1
year
L*
BYK engravingBYK backgroundKM engravingKM backgroundASD engravingASD background
2005 2010 2015
05
10
15
20
25
30
35
Site 2 spot 1
year
a*
BYK engravingBYK backgroundKM engravingKM backgroundASD engravingASD background
2005 2010 2015
010
20
30
40
Site 2 spot 1
year
b*
BYK engravingBYK backgroundKM engravingKM backgroundASD engravingASD background
Page 98
84 | Burrup Peninsula Aboriginal Petroglyphs: Colour Change & Spectral Mineralogy 2004–2016
Figure 24. Site 2 spot 2 colour measurements, plotted as in Figure 19.
2005 2010 2015
020
40
60
Site 2 spot 2
year
L*
BYK engravingBYK backgroundKM engravingKM backgroundASD engravingASD background
2005 2010 2015
05
10
15
20
25
30
35
Site 2 spot 2
year
a*
BYK engravingBYK backgroundKM engravingKM backgroundASD engravingASD background
2005 2010 2015
010
20
30
40
Site 2 spot 2
year
b*
BYK engravingBYK backgroundKM engravingKM backgroundASD engravingASD background
Page 99
Burrup Peninsula Aboriginal Petroglyphs: Colour Change & Spectral Mineralogy 2004–2016
Figure 25. Site 2 spot 3 colour measurements, plotted as in Figure 19.
2005 2010 2015
020
40
60
Site 2 spot 3
year
L*
BYK engravingBYK backgroundKM engravingKM backgroundASD engravingASD background
2005 2010 2015
05
10
15
20
25
30
35
Site 2 spot 3
year
a*
BYK engravingBYK backgroundKM engravingKM backgroundASD engravingASD background
2005 2010 2015
010
20
30
40
Site 2 spot 3
year
b*
BYK engravingBYK backgroundKM engravingKM backgroundASD engravingASD background
Page 100
86 | Burrup Peninsula Aboriginal Petroglyphs: Colour Change & Spectral Mineralogy 2004–2016
Figure 26. Site 2 spot 4 colour measurements, plotted as in Figure 19.
2005 2010 2015
020
40
60
Site 2 spot 4
year
L*
BYK engravingBYK backgroundKM engravingKM backgroundASD engravingASD background
2005 2010 2015
05
10
15
20
25
30
35
Site 2 spot 4
year
a*
BYK engravingBYK backgroundKM engravingKM backgroundASD engravingASD background
2005 2010 2015
010
20
30
40
Site 2 spot 4
year
b*
BYK engravingBYK backgroundKM engravingKM backgroundASD engravingASD background
Page 101
Burrup Peninsula Aboriginal Petroglyphs: Colour Change & Spectral Mineralogy 2004–2016
Figure 27. Site 4 spot 1 colour measurements, plotted as in Figure 19.
2005 2010 2015
020
40
60
Site 4 spot 1
year
L*
BYK engravingBYK backgroundKM engravingKM backgroundASD engravingASD background
2005 2010 2015
05
10
15
20
25
30
35
Site 4 spot 1
year
a*
BYK engravingBYK backgroundKM engravingKM backgroundASD engravingASD background
2005 2010 2015
010
20
30
40
Site 4 spot 1
year
b*
BYK engravingBYK backgroundKM engravingKM backgroundASD engravingASD background
Page 102
88 | Burrup Peninsula Aboriginal Petroglyphs: Colour Change & Spectral Mineralogy 2004–2016
Figure 28. Site 4 spot 2 colour measurements, plotted as in Figure 19.
2005 2010 2015
020
40
60
Site 4 spot 2
year
L*
BYK engravingBYK backgroundKM engravingKM backgroundASD engravingASD background
2005 2010 2015
05
10
15
20
25
30
35
Site 4 spot 2
year
a*
BYK engravingBYK backgroundKM engravingKM backgroundASD engravingASD background
2005 2010 2015
010
20
30
40
Site 4 spot 2
year
b*
BYK engravingBYK backgroundKM engravingKM backgroundASD engravingASD background
Page 103
Burrup Peninsula Aboriginal Petroglyphs: Colour Change & Spectral Mineralogy 2004–2016
Figure 29. Site 4 spot 3 colour measurements, plotted as in Figure 19.
2005 2010 2015
020
40
60
Site 4 spot 3
year
L*
BYK engravingBYK backgroundKM engravingKM backgroundASD engravingASD background
2005 2010 2015
05
10
15
20
25
30
35
Site 4 spot 3
year
a*
BYK engravingBYK backgroundKM engravingKM backgroundASD engravingASD background
2005 2010 2015
010
20
30
40
Site 4 spot 3
year
b*
BYK engravingBYK backgroundKM engravingKM backgroundASD engravingASD background
Page 104
90 | Burrup Peninsula Aboriginal Petroglyphs: Colour Change & Spectral Mineralogy 2004–2016
Figure 30. Site 4 spot 4 colour measurements, plotted as in Figure 19.
2005 2010 2015
020
40
60
Site 4 spot 4
year
L*
BYK engravingBYK backgroundKM engravingKM backgroundASD engravingASD background
2005 2010 2015
05
10
15
20
25
30
35
Site 4 spot 4
year
a*
BYK engravingBYK backgroundKM engravingKM backgroundASD engravingASD background
2005 2010 2015
010
20
30
40
Site 4 spot 4
year
b*
BYK engravingBYK backgroundKM engravingKM backgroundASD engravingASD background
Page 105
Burrup Peninsula Aboriginal Petroglyphs: Colour Change & Spectral Mineralogy 2004–2016
Figure 31. Site 5 spot 1 colour measurements, plotted as in Figure 19.
2005 2010 2015
020
40
60
Site 5 spot 1
year
L*
BYK engravingBYK backgroundKM engravingKM backgroundASD engravingASD background
2005 2010 2015
05
10
15
20
25
30
35
Site 5 spot 1
year
a*
BYK engravingBYK backgroundKM engravingKM backgroundASD engravingASD background
2005 2010 2015
010
20
30
40
Site 5 spot 1
year
b*
BYK engravingBYK backgroundKM engravingKM backgroundASD engravingASD background
Page 106
92 | Burrup Peninsula Aboriginal Petroglyphs: Colour Change & Spectral Mineralogy 2004–2016
Figure 32. Site 5 spot 2 colour measurements, plotted as in Figure 19.
2005 2010 2015
020
40
60
Site 5 spot 2
year
L*
BYK engravingBYK backgroundKM engravingKM backgroundASD engravingASD background
2005 2010 2015
05
10
15
20
25
30
35
Site 5 spot 2
year
a*
BYK engravingBYK backgroundKM engravingKM backgroundASD engravingASD background
2005 2010 2015
010
20
30
40
Site 5 spot 2
year
b*
BYK engravingBYK backgroundKM engravingKM backgroundASD engravingASD background
Page 107
Burrup Peninsula Aboriginal Petroglyphs: Colour Change & Spectral Mineralogy 2004–2016
Figure 33. Site 5 spot 3 colour measurements, plotted as in Figure 19.
2005 2010 2015
020
40
60
Site 5 spot 3
year
L*
BYK engravingBYK backgroundKM engravingKM backgroundASD engravingASD background
2005 2010 2015
05
10
15
20
25
30
35
Site 5 spot 3
year
a*
BYK engravingBYK backgroundKM engravingKM backgroundASD engravingASD background
2005 2010 2015
010
20
30
40
Site 5 spot 3
year
b*
BYK engravingBYK backgroundKM engravingKM backgroundASD engravingASD background
Page 108
94 | Burrup Peninsula Aboriginal Petroglyphs: Colour Change & Spectral Mineralogy 2004–2016
Figure 34. Site 5 spot 4 colour measurements, plotted as in Figure 19.
2005 2010 2015
020
40
60
Site 5 spot 4
year
L*
BYK engravingBYK backgroundKM engravingKM backgroundASD engravingASD background
2005 2010 2015
05
10
15
20
25
30
35
Site 5 spot 4
year
a*
BYK engravingBYK backgroundKM engravingKM backgroundASD engravingASD background
2005 2010 2015
010
20
30
40
Site 5 spot 4
year
b*
BYK engravingBYK backgroundKM engravingKM backgroundASD engravingASD background
Page 109
Burrup Peninsula Aboriginal Petroglyphs: Colour Change & Spectral Mineralogy 2004–2016
Figure 35. Site 6 spot 1 colour measurements, plotted as in Figure 19.
2005 2010 2015
020
40
60
Site 6 spot 1
year
L*
BYK engravingBYK backgroundKM engravingKM backgroundASD engravingASD background
2005 2010 2015
05
10
15
20
25
30
35
Site 6 spot 1
year
a*
BYK engravingBYK backgroundKM engravingKM backgroundASD engravingASD background
2005 2010 2015
010
20
30
40
Site 6 spot 1
year
b*
BYK engravingBYK backgroundKM engravingKM backgroundASD engravingASD background
Page 110
96 | Burrup Peninsula Aboriginal Petroglyphs: Colour Change & Spectral Mineralogy 2004–2016
Figure 36. Site 6 spot 2 colour measurements, plotted as in Figure 19.
2005 2010 2015
020
40
60
Site 6 spot 2
year
L*
BYK engravingBYK backgroundKM engravingKM backgroundASD engravingASD background
2005 2010 2015
05
10
15
20
25
30
35
Site 6 spot 2
year
a*
BYK engravingBYK backgroundKM engravingKM backgroundASD engravingASD background
2005 2010 2015
010
20
30
40
Site 6 spot 2
year
b*
BYK engravingBYK backgroundKM engravingKM backgroundASD engravingASD background
Page 111
Burrup Peninsula Aboriginal Petroglyphs: Colour Change & Spectral Mineralogy 2004–2016
Figure 37. Site 6 spot 3 colour measurements, plotted as in Figure 19.
2005 2010 2015
020
40
60
Site 6 spot 3
year
L*
BYK engravingBYK backgroundKM engravingKM backgroundASD engravingASD background
2005 2010 2015
05
10
15
20
25
30
35
Site 6 spot 3
year
a*
BYK engravingBYK backgroundKM engravingKM backgroundASD engravingASD background
2005 2010 2015
010
20
30
40
Site 6 spot 3
year
b*
BYK engravingBYK backgroundKM engravingKM backgroundASD engravingASD background
Page 112
98 | Burrup Peninsula Aboriginal Petroglyphs: Colour Change & Spectral Mineralogy 2004–2016
Figure 38. Site 6 spot 4 colour measurements, plotted as in Figure 19.
2005 2010 2015
020
40
60
Site 6 spot 4
year
L*
BYK engravingBYK backgroundKM engravingKM backgroundASD engravingASD background
2005 2010 2015
05
10
15
20
25
30
35
Site 6 spot 4
year
a*
BYK engravingBYK backgroundKM engravingKM backgroundASD engravingASD background
2005 2010 2015
010
20
30
40
Site 6 spot 4
year
b*
BYK engravingBYK backgroundKM engravingKM backgroundASD engravingASD background
Page 113
Burrup Peninsula Aboriginal Petroglyphs: Colour Change & Spectral Mineralogy 2004–2016
Figure 39. Site 7 spot 1 colour measurements, plotted as in Figure 19.
2005 2010 2015
020
40
60
Site 7 spot 1
year
L*
BYK engravingBYK backgroundKM engravingKM backgroundASD engravingASD background
2005 2010 2015
05
10
15
20
25
30
35
Site 7 spot 1
year
a*
BYK engravingBYK backgroundKM engravingKM backgroundASD engravingASD background
2005 2010 2015
010
20
30
40
Site 7 spot 1
year
b*
BYK engravingBYK backgroundKM engravingKM backgroundASD engravingASD background
Page 114
100 | Burrup Peninsula Aboriginal Petroglyphs: Colour Change & Spectral Mineralogy 2004–2016
Figure 40. Site 7 spot 2 colour measurements, plotted as in Figure 19
2005 2010 2015
020
40
60
Site 7 spot 2
year
L*
BYK engravingBYK backgroundKM engravingKM backgroundASD engravingASD background
2005 2010 2015
05
10
15
20
25
30
35
Site 7 spot 2
year
a*
BYK engravingBYK backgroundKM engravingKM backgroundASD engravingASD background
2005 2010 2015
010
20
30
40
Site 7 spot 2
year
b*
BYK engravingBYK backgroundKM engravingKM backgroundASD engravingASD background
Page 115
Burrup Peninsula Aboriginal Petroglyphs: Colour Change & Spectral Mineralogy 2004–2016
Figure 41. Site 7 spot 3 colour measurements, plotted as in Figure 19.
2005 2010 2015
020
40
60
Site 7 spot 3
year
L*
BYK engravingBYK backgroundKM engravingKM backgroundASD engravingASD background
2005 2010 2015
05
10
15
20
25
30
35
Site 7 spot 3
year
a*
BYK engravingBYK backgroundKM engravingKM backgroundASD engravingASD background
2005 2010 2015
010
20
30
40
Site 7 spot 3
year
b*
BYK engravingBYK backgroundKM engravingKM backgroundASD engravingASD background
Page 116
102 | Burrup Peninsula Aboriginal Petroglyphs: Colour Change & Spectral Mineralogy 2004–2016
Figure 42. Site 7 spot 4 colour measurements, plotted as in Figure 19.
2005 2010 2015
020
40
60
Site 7 spot 4
year
L*
BYK engravingBYK backgroundKM engravingKM backgroundASD engravingASD background
2005 2010 2015
05
10
15
20
25
30
35
Site 7 spot 4
year
a*
BYK engravingBYK backgroundKM engravingKM backgroundASD engravingASD background
2005 2010 2015
010
20
30
40
Site 7 spot 4
year
b*
BYK engravingBYK backgroundKM engravingKM backgroundASD engravingASD background
Page 117
Burrup Peninsula Aboriginal Petroglyphs: Colour Change & Spectral Mineralogy 2004–2016
Figure 43. Site 8 spot 1 colour measurements, plotted as in Figure 19.
2005 2010 2015
020
40
60
Site 8 spot 1
year
L*
BYK engravingBYK backgroundKM engravingKM backgroundASD engravingASD background
2005 2010 2015
05
10
15
20
25
30
35
Site 8 spot 1
year
a*
BYK engravingBYK backgroundKM engravingKM backgroundASD engravingASD background
2005 2010 2015
010
20
30
40
Site 8 spot 1
year
b*
BYK engravingBYK backgroundKM engravingKM backgroundASD engravingASD background
Page 118
104 | Burrup Peninsula Aboriginal Petroglyphs: Colour Change & Spectral Mineralogy 2004–2016
Figure 44. Site 8 spot 2 colour measurements, plotted as in Figure 19.
2005 2010 2015
020
40
60
Site 8 spot 2
year
L*
BYK engravingBYK backgroundKM engravingKM backgroundASD engravingASD background
2005 2010 2015
05
10
15
20
25
30
35
Site 8 spot 2
year
a*
BYK engravingBYK backgroundKM engravingKM backgroundASD engravingASD background
2005 2010 2015
010
20
30
40
Site 8 spot 2
year
b*
BYK engravingBYK backgroundKM engravingKM backgroundASD engravingASD background
Page 119
Burrup Peninsula Aboriginal Petroglyphs: Colour Change & Spectral Mineralogy 2004–2016
Figure 45. Site 8 spot 3 colour measurements, plotted as in Figure 19.
2005 2010 2015
020
40
60
Site 8 spot 3
year
L*
BYK engravingBYK backgroundKM engravingKM backgroundASD engravingASD background
2005 2010 2015
05
10
15
20
25
30
35
Site 8 spot 3
year
a*
BYK engravingBYK backgroundKM engravingKM backgroundASD engravingASD background
2005 2010 2015
010
20
30
40
Site 8 spot 3
year
b*
BYK engravingBYK backgroundKM engravingKM backgroundASD engravingASD background
Page 120
106 | Burrup Peninsula Aboriginal Petroglyphs: Colour Change & Spectral Mineralogy 2004–2016
Figure 46. Site 8 spot 4 colour measurements, plotted as in Figure 19.
2005 2010 2015
020
40
60
Site 8 spot 4
year
L*
BYK engravingBYK backgroundKM engravingKM backgroundASD engravingASD background
2005 2010 2015
05
10
15
20
25
30
35
Site 8 spot 4
year
a*
BYK engravingBYK backgroundKM engravingKM backgroundASD engravingASD background
2005 2010 2015
010
20
30
40
Site 8 spot 4
year
b*
BYK engravingBYK backgroundKM engravingKM backgroundASD engravingASD background
Page 121
Burrup Peninsula Aboriginal Petroglyphs: Colour Change & Spectral Mineralogy 2004–2016
Figure 47. Site 21 spot 1 colour measurements, plotted as in Figure 19.
2005 2010 2015
020
40
60
Site 21 spot 1
year
L*
BYK engravingBYK backgroundKM engravingKM backgroundASD engravingASD background
2005 2010 2015
05
10
15
20
25
30
35
Site 21 spot 1
year
a*
BYK engravingBYK backgroundKM engravingKM backgroundASD engravingASD background
2005 2010 2015
010
20
30
40
Site 21 spot 1
year
b*
BYK engravingBYK backgroundKM engravingKM backgroundASD engravingASD background
Page 122
108 | Burrup Peninsula Aboriginal Petroglyphs: Colour Change & Spectral Mineralogy 2004–2016
Figure 48. Site 21 spot 2 colour measurements, plotted as in Figure 19.
2005 2010 2015
020
40
60
Site 21 spot 2
year
L*
BYK engravingBYK backgroundKM engravingKM backgroundASD engravingASD background
2005 2010 2015
05
10
15
20
25
30
35
Site 21 spot 2
year
a*
BYK engravingBYK backgroundKM engravingKM backgroundASD engravingASD background
2005 2010 2015
010
20
30
40
Site 21 spot 2
year
b*
BYK engravingBYK backgroundKM engravingKM backgroundASD engravingASD background
Page 123
Burrup Peninsula Aboriginal Petroglyphs: Colour Change & Spectral Mineralogy 2004–2016
Figure 49. Site 21 spot 3 colour measurements, plotted as in Figure 19.
2005 2010 2015
020
40
60
Site 21 spot 3
year
L*
BYK engravingBYK backgroundKM engravingKM backgroundASD engravingASD background
2005 2010 2015
05
10
15
20
25
30
35
Site 21 spot 3
year
a*
BYK engravingBYK backgroundKM engravingKM backgroundASD engravingASD background
2005 2010 2015
010
20
30
40
Site 21 spot 3
year
b*
BYK engravingBYK backgroundKM engravingKM backgroundASD engravingASD background
Page 124
110 | Burrup Peninsula Aboriginal Petroglyphs: Colour Change & Spectral Mineralogy 2004–2016
Figure 50. Site 21 spot 4 colour measurements, plotted as in Figure 19.
2005 2010 2015
020
40
60
Site 21 spot 4
year
L*
BYK engravingBYK backgroundKM engravingKM backgroundASD engravingASD background
2005 2010 2015
05
10
15
20
25
30
35
Site 21 spot 4
year
a*
BYK engravingBYK backgroundKM engravingKM backgroundASD engravingASD background
2005 2010 2015
010
20
30
40
Site 21 spot 4
year
b*
BYK engravingBYK backgroundKM engravingKM backgroundASD engravingASD background
Page 125
Burrup Peninsula Aboriginal Petroglyphs: Colour Change & Spectral Mineralogy 2004–2016
Figure 51. Site 22 spot 1 colour measurements, plotted as in Figure 19.
2005 2010 2015
020
40
60
Site 22 spot 1
year
L*
BYK engravingBYK backgroundKM engravingKM backgroundASD engravingASD background
2005 2010 2015
05
10
15
20
25
30
35
Site 22 spot 1
year
a*
BYK engravingBYK backgroundKM engravingKM backgroundASD engravingASD background
2005 2010 2015
010
20
30
40
Site 22 spot 1
year
b*
BYK engravingBYK backgroundKM engravingKM backgroundASD engravingASD background
Page 126
112 | Burrup Peninsula Aboriginal Petroglyphs: Colour Change & Spectral Mineralogy 2004–2016
Figure 52. Site22 spot 2 colour measurements, plotted as in Figure 19.
2005 2010 2015
020
40
60
Site 22 spot 2
year
L*
BYK engravingBYK backgroundKM engravingKM backgroundASD engravingASD background
2005 2010 2015
05
10
15
20
25
30
35
Site 22 spot 2
year
a*
BYK engravingBYK backgroundKM engravingKM backgroundASD engravingASD background
2005 2010 2015
010
20
30
40
Site 22 spot 2
year
b*
BYK engravingBYK backgroundKM engravingKM backgroundASD engravingASD background
Page 127
Burrup Peninsula Aboriginal Petroglyphs: Colour Change & Spectral Mineralogy 2004–2016
Figure 53. Site 22 spot 3 colour measurements, plotted as in Figure 19.
2005 2010 2015
020
40
60
Site 22 spot 3
year
L*
BYK engravingBYK backgroundKM engravingKM backgroundASD engravingASD background
2005 2010 2015
05
10
15
20
25
30
35
Site 22 spot 3
year
a*
BYK engravingBYK backgroundKM engravingKM backgroundASD engravingASD background
2005 2010 2015
010
20
30
40
Site 22 spot 3
year
b*
BYK engravingBYK backgroundKM engravingKM backgroundASD engravingASD background
Page 128
114 | Burrup Peninsula Aboriginal Petroglyphs: Colour Change & Spectral Mineralogy 2004–2016
Figure 54. Site22 spot 4 colour measurements, plotted as in Figure 19.
2005 2010 2015
020
40
60
Site 22 spot 4
year
L*
BYK engravingBYK backgroundKM engravingKM backgroundASD engravingASD background
2005 2010 2015
05
10
15
20
25
30
35
Site 22 spot 4
year
a*
BYK engravingBYK backgroundKM engravingKM backgroundASD engravingASD background
2005 2010 2015
010
20
30
40
Site 22 spot 4
year
b*
BYK engravingBYK backgroundKM engravingKM backgroundASD engravingASD background
Page 129
Burrup Peninsula Aboriginal Petroglyphs: Colour Change & Spectral Mineralogy 2004–2016
Figure 55. Site 23 spot 1 colour measurements, plotted as in Figure 19.
2005 2010 2015
020
40
60
Site 23 spot 1
year
L*
BYK engravingBYK backgroundKM engravingKM backgroundASD engravingASD background
2005 2010 2015
05
10
15
20
25
30
35
Site 23 spot 1
year
a*
BYK engravingBYK backgroundKM engravingKM backgroundASD engravingASD background
2005 2010 2015
010
20
30
40
Site 23 spot 1
year
b*
BYK engravingBYK backgroundKM engravingKM backgroundASD engravingASD background
Page 130
116 | Burrup Peninsula Aboriginal Petroglyphs: Colour Change & Spectral Mineralogy 2004–2016
Figure 56. Site 23 spot 2 colour measurements, plotted as in Figure 19.
2005 2010 2015
020
40
60
Site 23 spot 2
year
L*
BYK engravingBYK backgroundKM engravingKM backgroundASD engravingASD background
2005 2010 2015
05
10
15
20
25
30
35
Site 23 spot 2
year
a*
BYK engravingBYK backgroundKM engravingKM backgroundASD engravingASD background
2005 2010 2015
010
20
30
40
Site 23 spot 2
year
b*
BYK engravingBYK backgroundKM engravingKM backgroundASD engravingASD background
Page 131
Burrup Peninsula Aboriginal Petroglyphs: Colour Change & Spectral Mineralogy 2004–2016
Figure 57. Site 23 spot 3 colour measurements, plotted as in Figure 19.
2005 2010 2015
020
40
60
Site 23 spot 3
year
L*
BYK engravingBYK backgroundKM engravingKM backgroundASD engravingASD background
2005 2010 2015
05
10
15
20
25
30
35
Site 23 spot 3
year
a*
BYK engravingBYK backgroundKM engravingKM backgroundASD engravingASD background
2005 2010 2015
010
20
30
40
Site 23 spot 3
year
b*
BYK engravingBYK backgroundKM engravingKM backgroundASD engravingASD background
Page 132
118 | Burrup Peninsula Aboriginal Petroglyphs: Colour Change & Spectral Mineralogy 2004–2016
Figure 58. Site 23 spot 4 colour measurements, plotted as in Figure 19.
2005 2010 2015
020
40
60
Site 23 spot 4
year
L*
BYK engravingBYK backgroundKM engravingKM backgroundASD engravingASD background
2005 2010 2015
05
10
15
20
25
30
35
Site 23 spot 4
year
a*
BYK engravingBYK backgroundKM engravingKM backgroundASD engravingASD background
2005 2010 2015
010
20
30
40
Site 23 spot 4
year
b*
BYK engravingBYK backgroundKM engravingKM backgroundASD engravingASD background
Page 133
Burrup Peninsula Aboriginal Petroglyphs: Colour Change & Spectral Mineralogy 2004–2016
Figure 59. Average L* values from BYK and KM photospectrometers, compared with average L* values
calculated from ASD spectra for background and engraving across all years, sites and spots. The horizontal
axis in each case is the L* measurement calculated from ASD spectra, and the vertical axis is the L*
measured value on the BYK instrument (left plot) or the KM instrument (right plot). The solid line shows
where measurements would lie if they corresponded perfectly. Dashed regression lines indicate the average
difference between the instruments, and the labelled value of R2 for the regression indicates the level of
agreement. The site colour coding shows that some sites have higher lightness than others do, but also that
some sites show greater variation in BYK measurement. Triangles indicate measurements of the
background, and circles of the engraving; note that the larger outliers on the BYK photospectrometer were
made on the engraving.
Page 134
120 | Burrup Peninsula Aboriginal Petroglyphs: Colour Change & Spectral Mineralogy 2004–2016
Figure 60. Average a* values from BYK and KM photospectrometers, compared with average a* values
calculated from ASD spectra for background and engraving across all years, sites and spots. The plots are
generated as in Figure 59.
Figure 61. Average b* values from BYK and KM photospectrometers, compared with average b* values
calculated from ASD spectra for background and engraving across all years, sites and spots. The plots are
generated as in Figure 59.
Page 135
Burrup Peninsula Aboriginal Petroglyphs: Colour Change & Spectral Mineralogy 2004–2016
6.3 Analysis of colour measurements from KM and ASD spectrometers
FACTORS AFFECTING COLOUR MEASUREMENTS
Models of the data must account for various fixed and random effects. The physical situation
evidently suggests there should be expected to be random variation between sites (which vary in
their age, location, degree of exposure to weather, etc.), and between the various spots on each
site, and between the measurements taken each year. Variation between years could be caused for
example by:
weather events, which may affect each site differently and may be each spot differently as
the spots on some sites are quite distant from each other;
microbiological activity, which would clearly fluctuate randomly across all sites;
animal activity, the engraving at a spot was once covered by a bird dropping;
slight variation in the targeted alignment of the photospectrometer as the chosen spot is
identified by photos and by the memory of the instrument operator. Some variation here is
inevitable, since the rocks cannot be marked to standardise the position of the instrument
each year.
Before 2015, multiple measurements were taken with the ASD spectrometer without replacing the
instrument on the rock surface, providing also a measure of internal instrument variability.
Fixed effects to be tested for in each model include differences between the background and
engraving; differences between the northern and southern sites; linear trends over time; and
interactions between these effects. These effects apply equally across all measurements, though
they could also vary randomly with the other factors described above; for example, the engravings
at different sites may achieve differing contrast with the background owing to differences in age, or
in the engraver; the effects of weather or other events may differ between rocks of slightly different
composition, or between background and engraving; etc. Figure 19 to Figure 58 make it clear that
the northern and southern sites chosen are different, but the study seeks to test whether the rate of
colour change also differs at the two separate locations. If industry affects rock colour, this would be
expected to influence southern sites more than northern sites; sites 1 and 2 were chosen to be far
from industry in order to serve as controls.
It would be possible to test also for curvilinear colour change in the rocks, rather than linear trends;
but plots of the data in Figure 19 to Figure 58 give no indication of such curvature, and the number
of years of data is still relatively low, making models of more than linear colour change harder to
justify. (Sites 21-23 have only been measured on three occasions; fitting a curved trend to this data
would leave no estimate of error in the fit.) In addition, for the purpose of monitoring, steady
changes of colour in a particular direction are of principle interest.
Note that the effect that must be tested for is not simply whether or not L*, a* and b*
measurements change over time; such changes are expected, due to a variety of random effects
Page 136
122 | Burrup Peninsula Aboriginal Petroglyphs: Colour Change & Spectral Mineralogy 2004–2016
including those described above. Random fluctuation of each colour measurement over time is
amply demonstrated in Figures 29-68. Rather, interest centres on
whether each measurement has an overall trend in one direction over time; and, most
importantly,
whether that trend differs between the northern control sites and the others.
It is also of interest to know whether such trends affect the background and engraving differently,
though this is not the basic aim of the study. (For example, it would still be a concern if the southern
sites were changing rapidly, but at the same rate on both background and engraving – even though
the background/engraving contrast would then be constant at all sites.)
RANDOM VARIATION: OVERVIEW
The strongest evidence for change in the KM data occurs in the L* measurements. Even here,
though, the evidence is not overwhelming; plots of the KM data in Figure 19 to Figure 58 give little
visual impression of a general trend over time in all the L* measurements. Figure 62 overlays all the
L* measurements from the KM spectrophotometer on a larger scale.
Figure 62. Variation over time in average L* measurements on the KM spectrophotometer for background
and engraving of all spots on all sites.
Page 137
Burrup Peninsula Aboriginal Petroglyphs: Colour Change & Spectral Mineralogy 2004–2016
Figure 62 shows that the measured L* values in the KM data vary widely across the entire
experiment, but have no clear trends over time. Most, but not all, of the engravings are lighter than
the backgrounds (see Figure 19 to Figure 58); and the lightest engravings belonged to control sites 1-
2, as Figure 62 depicts. But neither these control sites nor the others show any obvious sign of a
continuing trend over time toward either greater or lower lightness; and the slopes of the black lines
do not obviously differ from those of the red.
There is no spot where either background or engraving lightness was always recorded either to
increase or decrease. Each of the backgrounds or engravings for which measurements have been
made since 2009 ‘changed direction’ (from increasing L* to decreasing, or vice versa) at least twice
over that period. Note also that the ups and downs of each site are asynchronous; there is no time
point where all L* readings changed in the same direction. Rather, the magnitude of different
sources of variation appear to differ for each site, spot and type (background or engraving). A clear
directional trend would have manifested itself in consistent increases or decreases at the same spot
each year, or perhaps in simultaneous increases or decreases across many sites during the same
year; but the data illustrates neither of these scenarios.
A formal profile analysis (Desjardins and Bulut, 2015) confirms that the changes over time at the
background and engraving of spots on each site are not parallel; random variation affects each one
differently. This suggests caution in drawing conclusions from the analysis that follows, as inferences
about these trend models are based on the assumption that each series of measurements is subject
to the same sources of random variation. If the causes of random variation at each spot are different
(for example, if some are more subject to particular environmental events than others, or if it is
harder to correctly place the spectrometer on some than others) then the assumption that each has
the same variation may well be invalid, and a true comparison between the various sites and spots
will not be possible.
Similar analysis applies to other measurements taken with the KM spectrophotometer, and to L*, a*
and b* values calculated from measurements on the ASD spectrometer.
LINEAR MIXED EFFECTS MODEL
Simple averages of the level of annual change in L*, a* and b* measurements are given in Table 17.
(The actual variation at background and engraving of each site and spot are plotted in Figure 19 to
Figure 58, but Table 17 gives a convenient high-level summary.)
Note again that the BYK photospectrometer differs markedly from the others, recording increases in
all variables, whereas the other measurements decreased on average in the case of L* and of a*;
and recording much greater change for each variable. Issues with the reliability of data from the BYK
spectrophotometer have been discussed above.
Page 138
124 | Burrup Peninsula Aboriginal Petroglyphs: Colour Change & Spectral Mineralogy 2004–2016
Table 17. Averages of the increases per year of L*, a* and b* measurements across each combination of site,
spot and type (background or engraving) for each instrument. (Negative numbers indicate an average
decrease over time).
L* a* b*
BYK 1.456 0.253 0.144
KM -0.161 -0.005 0.010
ASD -0.132 -0.048 0.007
Table 17 again reflects good agreement between results from the KM and ASD instruments. The
level of change in L* recorded on these spectrometers, while lower, is still high enough that colour
change would eventually be visually detectable at some sites (the scales of L*, a* and b* are
designed so that a change of about 2 in any of these variables would be just noticeable to the human
eye). The question is whether the recorded changes are actually indicative of real colour change on
the rocks, or whether these measured values could have arisen, through random variation as
described above, on rocks where no colour change has actually occurred.
The lmer function in the lme4 package of R (Bates et al.) was used to fit linear mixed effects models
to each of L*, a* and b*. The BYK data shows very clear trends that are modelled as significant no
matter what particular model of random variation is used. However, the KM and ASD data is much
less clear-cut; different conclusions could be drawn depending on how the random variation is
modelled. The models summarised below include all the sources of variation described in Section
6.3.1 above, including random variation on background and engraving of each site and spot each
year. This factor is modelled to have a high variance in all models investigated (in the case of L*, it is
never less than 1.8 units, which is large considering a change of around 2 units would be visible to
the naked eye). Including with this effect all lower order combinations of these factors is a standard
choice.
The R code thus includes random terms (type | yearF) + (type | site) + (type | spot) + (type |
yearF:site) + (type | yearF:spot), where type is an indicator variable identifying background and
engraving; and site, spot and yearF are factors indicating site, spot (coded to distinguish between
identically numbered spots on each site) and year respectively. ASD models also include a (1 | place)
term to allow for variation within repeat measurements made before replacing the spectrometer on
the rock.
The contrast between background and engraving differs between northern and southern sites, as
Figures 29-68 demonstrate, so this fixed effect is included in all models. A comparison can then be
made between a basic model and others including a trend over time; different trends in northern
and southern sites; and different trends on background and engraving at northern and southern
sites. Results are summarised in Table 1.1.
Page 139
Burrup Peninsula Aboriginal Petroglyphs: Colour Change & Spectral Mineralogy 2004–2016
Table 18 p values for successively adding to models for L*, a* and b* measured with KM and ASD
spectrometers: a trend over time (first row); different trends on northern and southern sites (second row);
and different trends also on background and engraving (third row).
KM ASD
L* a* b* L* a* b*
year 0.004 0.28 0.60 0.029 0.012 0.46
control * year 0.33 0.45 0.89 0.94 1.00 0.93
control * year * type 0.71 0.84 0.84 0.77 0.13 0.94
Most of the p values in Table 18 are fairly high; in most cases, it would not be unlikely for purely
random variation to produce evidence for time trends as strong as the evidence of the observed
data. However, the models for L* measured on the KM instrument, and for L* and a* measured on
the ASD instrument, indicate a continuing trend over time. (Table 1.1 does not indicate that trends in
any of the colour measurements, or in contrast between background and engraving, differ
significantly at northern and southern sites.)
A p value less than 0.05 is usually considered ‘statistically significant’, as the probability of such an
event occurring by chance is less than 1 in 20. In a situation where multiple comparisons are
conducted, however, it is usual to require a lower p value in order to be certain that the result is not
merely one of random chance. In a series of 20 tests on completely random data, one test would be
expected to have a p value of 0.05 or less simply by chance. In the first row of Table 1.1, tests have
been conducted on L*, a* and b* values from two instruments; the probability of at least one of
these tests obtaining a p value as small as that obtained from L* analysis on the KM instrument is
0.024, which is still low, indicating that this effect is more than a statistical anomaly. However, the
probability of at least one of the remaining five tests obtaining a p value as small as that for the a*
analysis on the ASD spectrometer is 0.06, which is less remarkable. The observed evidence for trends
in data from the ASD spectrometer does not appear so convincing if such a correction is applied.
Nonetheless, further investigation is warranted – particularly in the case of the L* data measured on
the KM spectrophotometer. This trend in the lightness of the rocks is supported by the similar
(though less statistically impressive) result from data recorded on the ASD spectrometer.
In summary, the KM data show a trend over time in the L* measurements, but not in a* or b*
measurements. Data from the ASD spectrometer indicates change over time in the L* and a* data,
but not the b* data, though this is less clear. None of the instruments demonstrates a difference in
the rate of change between northern and southern sites.
The modelled change in measured lightness in the KM data is a decrease of 0.31 units per year,
across both background and engraving of all spots on all sites. A 95 % confidence interval for this
decrease in lightness is (0.11, 0.52) units per year.
Page 140
126 | Burrup Peninsula Aboriginal Petroglyphs: Colour Change & Spectral Mineralogy 2004–2016
The section is concluded with plots relevant to some of the models mentioned above. Changes in L*
and a* values calculated from spectra recorded on the ASD spectrometer are plotted in Figures 63
and Figure 64. There is again little visual indication of any trend in this data.
Figure 63 Variation over time in average L* measurements calculated from spectra recorded on the ASD
spectrometer for background and engraving of all spots on all sites. Data from sites 1-2 is drawn in black; all
other data in red
Page 141
Burrup Peninsula Aboriginal Petroglyphs: Colour Change & Spectral Mineralogy 2004–2016
Figure 64. Variation over time in average a* measurements calculated from spectra recorded on the ASD
spectrometer for background and engraving of all spots on all sites. Data from sites 1-2 is drawn in black; all
other data in red.
Figure 65 plots the residuals in the model for L* measured on the KM spectrophotometer, including
a linear trend over time. There are just a few large residuals that could suggest heteroscedasticity
however not enough to reject the model on this account.
Figure 65. Residuals and fitted values of the model for L* data calculated from spectra recorded on the KM
spectrophotometer for background and engraving of all spots at all sites. The level of variation in the
residuals is fairly constant across all fitted values.
Page 142
128 | Burrup Peninsula Aboriginal Petroglyphs: Colour Change & Spectral Mineralogy 2004–2016
7. Conclusion of 2004-2016 study
The petroglyphs at seven sites in the Burrup Peninsula were measured annually from 2004 to 2016.
Three new sites close to the new Yara construction plant were also added from 2013 bringing the
total to 10 sites. The same engravings and background rocks were measured in situ. Measurement of
the annual colour changes utilised three instruments, the ASD and the BYK and KM. An examination
of the colour measurements as a function of time, as well as a comparison of the two measurement
techniques, has been conducted.
For both the KM and the ASD instruments, three-dimensional L*a*b* colour space (L* - degree of
lightness, a* - degree of red/green, b* - degree of yellow/blue), identifying a tristimulus value
(L*a*b*) for each sample point have been calculated.
Data from the KM spectrophotometer shows a trend over time in the L* measurements. The
lightness (L) decreasing at a modelled average rate of 0.31 units per year (a total decrease of about 2
units on this scale is just noticeable to the human eye). However no trend is indicated in either a*
(degree of red/green) or b* (degree of yellow/blue).
Data from the ASD spectrometer shows trends indicated in L* (degree of lightness) and a* (degree of
red/green) but not on b* (degree of yellow/blue ), though the evidence is not as strong as seen with
the KM instrument.
The conclusion of colour change would be clearer if it was detected across all dimensions of colour
(it would be natural for colour change to be evident in all dimensions, L*, a* and b*, not only in one
or two of them). The results are not fully conclusive and if the measurements do reflect real colour
change, as the data suggest, then continued observations would continue to mark out the trend
more clearly; and if not, observations will likely continue to fluctuate over time, making the
randomness of the recorded variation more apparent. Sites 21-23 have currently only three years of
observations; additional observations will be particularly helpful at these sites. Nonetheless, the
indication of significant colour change is important, and warrants closer attention. None of the
instruments demonstrates a difference in the rate of change between the northern control sites and
the southern sites closer to industry.
It should be noted that data from the BYK spectrophotometer appears unreliable for drawing
conclusions on colour change in the rock art and, as such the cross calibration issues with the BYK
portable photospectrometer and the KM photospectrometer will no longer be undertaken.
All the photospectrometer data (KM, BYK and ASD) have been provided in an easily readable format
to WA DER for safekeeping.
It should be noted that the results of this report supersede all results previously published.
Page 143
Burrup Peninsula Aboriginal Petroglyphs: Colour Change & Spectral Mineralogy 2004–2016
8. Recommendations
For future work, it is recommended that:
• A complete statistical analysis is done on the full spectrum of each individual ASD spectrum
(not just the visible part i.e. L*, a* and b*)
• A study be conducted to assess how many new sites and how many new engravings and
backgrounds should be added to the current locations to increase the quality of the monitoring in
the Burrup Peninsula. In particular, new control sites with similar rock types should be added to the
current ones (for instance Depuch Island). It should also be noted that by increasing the number of
independent measurement on each spot (in doing so improving statistical analysis) could also have
an adverse effect on the petroglyphs and it was demonstrated in 2015 and 2016 by coloured
spectrometers heads, signs that instruments measurements might be affecting the measured spots.
A balance should be found between statistical endeavour and petroglyph protection.
• One (1) rock sample be collected at each site (old and new), a total of 10 samples, and
brought to CSIRO in Perth to be stored in a container where humidity is 0% (no water) and in an
argon atmosphere (no oxygen and no oxidation) and placed in a dark area. This will allow a
comparison between the control sites, where natural weathering occurs and these reference
samples.
It is also recommended that the colour and mineralogical monitoring be complemented in the future
with atmospheric and microbiological monitoring studies.
Page 144
130 | Burrup Peninsula Aboriginal Petroglyphs: Colour Change & Spectral Mineralogy 2004–2016
9. References
Bulut, O., and C. D. Desjardins. "profileR: Profile analysis of multivariate data in R. R package version
0.2-1." (2015).
Hunter, R. and Harold, R. The measurement of Appearance, 2nd Edition. John Wiley and Sons, 1987,
173 – 174.
Lau D. E. Ramanaidou, A. Hacket, M. Caccetta and S. Furman. Burrup Peninsula Aboriginal
Petroglyphs: Colour Change & Spectral Mineralogy 2004–2009
Lau D., Ramanaidou E., and Furman S. (2010). Burrup Peninsula Aboriginal Petroglyphs: Colour
Change & Spectral Mineralogy 2004–2010, 42pp.
Lau D., Ramanaidou E., Morin Ka S. and Furman S. (2012) Burrup Peninsula Aboriginal Petroglyphs:
Colour and Spectral Change 2004–2011, 54pp
Mirti, P.; Davit, P., New developments in the study of ancient pottery by colour measurement,
Journal of Archaeological Science, 2004, 31(6), 741–751.
Mirmehdi, M.; Chalmers, A.; Barham, L; Griffiths, L., Automated analysis of environmental
degradation of paint residues, Journal of Archaeological Science, 2001, 28(12), 1329–1338.
Ramanaidou, E. R. & Caccetta, M., Burrup Peninsula aboriginal petroglyphs. Spectral Mineralogy for
2004. CSIRO E&M P2005/.
Ramanaidou, E. R. and Wells, M.A., Burrup Peninsula aboriginal petroglyphs. Spectral Mineralogy for
2005. CSIRO E&M P2006/18pp.
Ramanaidou, E.R., Wells M. A. & Hacket, A. L. (2007). Burrup Peninsula Aboriginal Petroglyphs
Spectral mineralogy for 2006. Exploration and Mining Report, P2007/17pp.
Ramanaidou, E.R., Wells, M., Belton, D., Verral, M., and Ryan C. (2008). Mineralogical and
Microchemical Methods for the Characterization of High-Grade BIF Derived Iron Ore. Reviews in
Economic geology, Volume 15, p. 129-156.
Ramanaidou, E.R., Hacket A.L., Corbel S. (2009a). Burrup Peninsula Aboriginal Petroglyphs Spectral
mineralogy for 2007. Exploration and Mining Report, P2009/301, 17pp.
Ramanaidou, E.R., Hacket, A., Caccetta, M., Wells, M., and McDonald B. (2009b). Burrup Peninsula
Aboriginal Petroglyphs Spectral Mineralogy for 2004-2008. Exploration and Mining Report
P2009/737, 19pp.
Ramanaidou, E.R., Wells, M. A., Lau, I. and Laukamp, C. 2015. Characterisation of Iron Ore by Visible
and Infrared Reflectance and Raman Spectroscopies, Chapter 6 in Iron Ore: Mineralogy, Processing
and Environmental Sustainability. Woodhead Publishing Series in Metals and Surface Engineering:
Number 66, 191-228.
Page 145
Burrup Peninsula Aboriginal Petroglyphs: Colour Change & Spectral Mineralogy 2004–2016
Ramanaidou, E. R. and Fonteneau, L.J., 2015. Petroglyphs of the Murujuga in Western Australia: a
complex interface between rock, human and bird. AAA2015, Fremantle, Western Australia.
Ramanaidou, E. R. and Fonteneau, L.J., 2017. Rocky relationships: the petroglyphs of the Murujuga
(Burrup Peninsula and Dampier Archipelago) in Western Australia Australian Journal of Earcth
Sciences (in prep).
Page 146
132 | Burrup Peninsula Aboriginal Petroglyphs: Colour Change & Spectral Mineralogy 2004–2016
CONTACT US
t 1300 363 400
+61 3 9545 2176
e [email protected]
w www.csiro.au
YOUR CSIRO
Australia is founding its future on
science and innovation. Its national
science agency, CSIRO, is a powerhouse
of ideas, technologies and skills for
building prosperity, growth, health and
sustainability. It serves governments,
industries, business and communities
across the nation.
FOR FURTHER INFORMATION
CSIRO Mineral Resources
Erick Ramanaidou
t +61 8 6436 8810
e [email protected]
w www.csiro.au/Mineral Resources


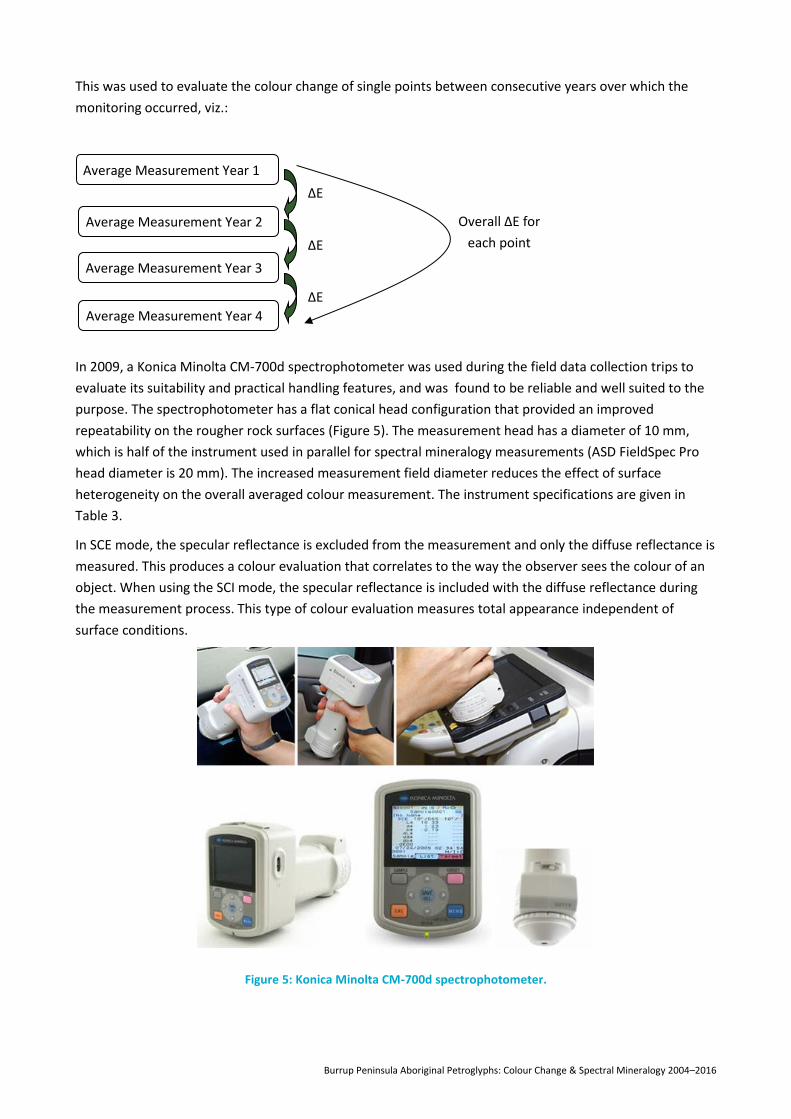


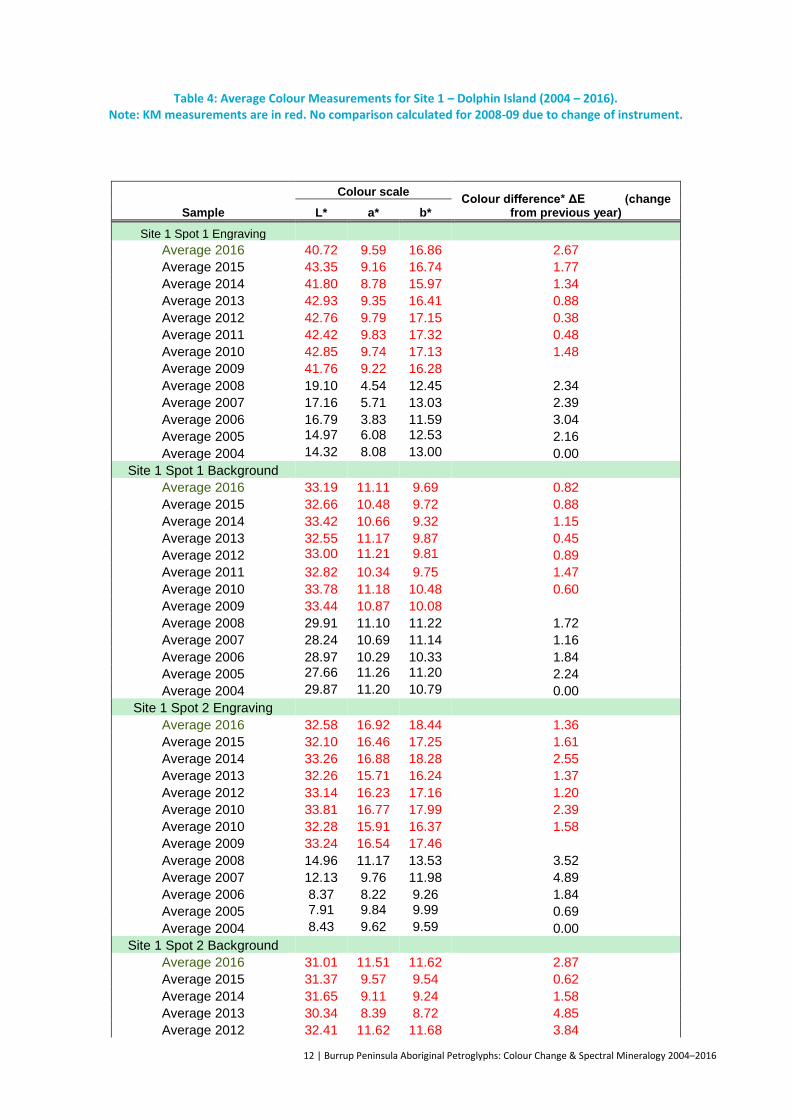


![REJSTRIK BYRON, George Gordon Noel 27, · BERDAJEV, Nikol aj Alexandrovič ... cocol'. Nikolaj Vasiljevič l58 GOLDMANN, Lucien 96 GoLENIŠČEV-KUTUZoV 1 6l GORKIJ, Maxim l83, lt]Ó](https://static.dokumenty.site/doc/80x56/5e2ec1f63121a639ee3b47ec/rejstrik-byron-george-gordon-noel-27-berdajev-nikol-aj-alexandrovi-cocol.jpg)


