Acta Montanistica Slovaca, Volume 26 (2021), 2; DOI: 10.46544/AMS.v26i2.03
Use of 3D technology in underground tourism: example
of Rzeszow (Poland) and Lviv (Ukraine)
Agnieszka BIEDA1*, Monika BALAWEJDER2, Artur WARCHOŁ3, Jarosław BYDŁOSZ4, Pavlo KOLODIY5 and Katarína PUKANSKÁ6
Authors’ affiliations and addresses: 1 AGH University of Science and Technology, 30
Mickiewicza Av., 30-059 Krakow, Poland
e-mail: [email protected]
2 PWSTE Bronisław Markiewicz State University
of Technology and Economics in Jaroslaw,
16 Czarnieckiego St., 37-500 Jaroslaw, Poland
e-mail: [email protected]
3 PWSTE Bronisław Markiewicz State University
of Technology and Economics in Jaroslaw,
16 Czarnieckiego St., 37-500 Jaroslaw, Poland
ProGea 4D sp. z o.o., 31-233 Cracow, Poland
e-mail: [email protected]
4 AGH University of Science and Technology,
30 Mickiewicza Av., 30-059 Krakow, Poland
e-mail: [email protected]
5 Lviv National Agrarian University, Faculty of
Land Management, 3 Velikogo St., Dublany,
Ukraine
e-mail: [email protected]
6 Technical University of Košice, Park
Komenského 19, 040 01, Košice, Slovakia
e-mail: [email protected]
*Correspondence:
Agnieszka Bieda, AGH University of Science and
Technology, 30 Mickiewicza Av., 30-059
Krakow, Poland
tel.: +48 12 617 34 30
e-mail: [email protected]
Funding information:
This study has been prepared within the scope of
the research funds from the AGH University of
Science and Technology in Krakow and the
PWSTE Bronisław Markiewicz State University
of Technology and Economics in Jaroslaw.
How to cite this article:
Bieda, A., Balawejder, M., Warchoł, A., Bydłosz,
J., Kolodiy, P. and Pukanská, K. (2021). Use of
3D technology in underground tourism: example
of Rzeszow (Poland) and Lviv (Ukraine). Acta
Montanistica Slovaca. Volume 26 (2) 205-221
DOI:
https://doi.org/10.46544/AMS.v26i2.03
Abstract
During the COVID-19 pandemic, human mobility has been limited
all over the world. People started to take advantage of computer
technology to compensate for the lack of possibility of leaving their
homes. Virtual travel, which can be conducted in many different
ways, has become one of the ways of using this technology.
Therefore, analyses have been carried out to investigate the
possibility of applying 3D technology to promote underground
tourist attractions. The Underground Tourist Route in Rzeszow
(Poland) and the underground of the Old City Hall in Lviv
(Ukraine) were selected as the research objects. They were
inventoried with the terrestrial laser scanning (TLS) method and
with the application of the Faro Focus 3D laser scanner. Then films
demonstrating virtual tour around the inventoried objects were
created based on the clouds of points obtained during the
measurements. As a part of the research, it was verified whether
these methods could encourage people to visit the researched
objects more than their standard advertisements presented on the
Internet. The evaluation was performed with the use of a semantic
differentiation test. The survey research carried out for this purpose
was implemented using the CAWI technique. The questionnaires
were available for the respondents from the last week of April 2020
to the first week of July 2020. The size of the researched group
accounted for 393 people. The respondents came from 23 countries
on 5 continents. The obtained results confirm that the use of 3D
technology in the promotion of tourist attractions may be a good
decision.
Keywords
tourist attractions, historical city, cultural heritage sites, limited
mobility, underground structures, semantic profile, laser scanning,
pandemic.
© 2021 by the authors. Submitted for possible open access publication under the terms and conditions
of the Creative Commons Attribution (CC BY) license (http://creativecommons.org/licenses/by/4.0/).
Agnieszka BIEDA et al. / Acta Montanistica Slovaca, Volume 26 (2021), Number 2, 205-221
206
Introduction
At the end of the first quarter of 2020, we are currently dealing with the COVID-19 pandemic, which is
taking place in Europe and around the world. Regardless of the country, the expected negative consequences can
be huge, and the crisis level is unpredictable (Renigier-Biłozor et al., 2020). One of the tangible effects of the
pandemic is limiting mobility. This situation is a challenge for tourism. As a social phenomenon, tourism creates
various needs that can be satisfied by the supply of tourist services. Tourist attractions are one of the most
important components of the tourist system. They are regarded as the main component of the whole system,
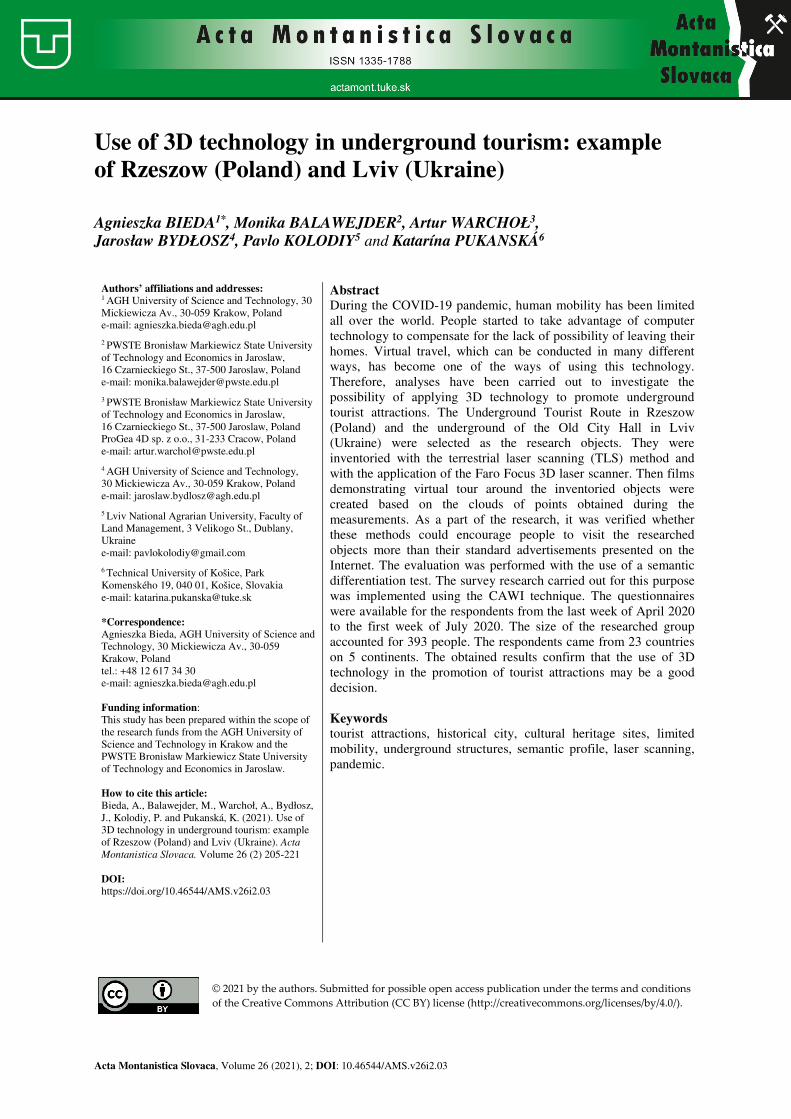
alongside such elements as transport, tourist services, and information. This model of tourism is presented in Fig.
1. Tourists, placed in the central part of this system, constitute its reference point (Kruczek, 2011).
Fig. 1. Model of tourism. Source: own study on the basis of (Kruczek, 2011).
The dynamics of the development of large cities drive the development of tourism (Kowalczyk et al., 2019).
On the other hand, tourism is one of the largest contributors and the fastest-growing economic sectors (Mango et
al., 2020). As noted by the author in (Duda-Gromada, 2009) article, the reasons for traveling constitute a very
significant issue in understanding the behaviour of tourists. The classifications quoted here profile both tourists
themselves and their expectations of attractions. Taking into account the purpose of a trip, Gaworecki (2007)
distinguishes tourism for leisure, cultural, sports and social tourism and tourism connected with economy or
politics, while Kowalczyk (2001) divides tourism into the following: tourism for leisure, sightseeing, health and
urban tourism, ecotourism as well as business, congress and religious tourism.
Buildings attractive for tourists are registered and inventoried with the use of modern geodetic technologies
(Puniach and Kwartnik-Pruc, 2018). Modern technology enables the efficient acquisition of information on
buildings for updating the real estate cadastre and the construction of the 3D cadastre (Bydłosz et al., 2018;
Buśko, 2017). Information on objects is registered above the ground (Przewięźlikowska, 2020;
Przewięźlikowska, 2018) and below the surface (Bieda et al., 2020a). Many research studies on the registration
of underground objects have been conducted. Very often, they concern general issues related to the 3D cadastre
below the Earth's surface, such as registration (Dimopoulou et al., 2018), visualisation (Cemellini et al., 2018) or
dissemination (Thompson et al., 2018).
The issue of the 3D cadastre is directly linked with the subject of gaining data on the objects that have been
input into it. One of the modern and fast methods of obtaining information on the object geometry is laser
scanning conducted with Light Detection and Ranging (LiDAR) technology (Warchoł, 2015, Balawejder et al.,
2016). LiDAR scanning with UAVs and mobile components has developed significantly in recent years thanks
to the development of technology and system components' miniaturisation.
Due to the fact that each of the scanning platforms provides a cloud of points with different characteristics,
it seems natural to integrate at least two or more scanning platforms (Warchoł et al., 2016; Warchoł, 2013;
Warchoł and Hejmanowska, 2011; Inglot and Tysiąc, 2017). Unfortunately, the cost of making two or more
scans in commercial applications is usually too high. This leaves us with the application of the most popular
scanning systems (TLS – terrestrial laser scanning), which, with the appropriate optimisation, can ensure proper
accuracy of measurement and sufficient representation of reality in the digital world (Warchoł, 2019).
There is no other measurement technology that is able to provide so much information about the 3D space
surrounding us in such a short time. As for the time of data acquisition, a comparable technology is short-range
photogrammetry and point cloud generation based on automatic photo-matching (Salach et al., 2016).
Photogrammetry and laser scanning are not competing, but rather complementary technologies and such
examples from different platforms can be found in (Burdziakowski and Tysiąc, 2019; Capolupo et al., 2020;
Salach et al., 2018). Undoubtedly, one of the most interesting purposes that can be achieved with the application
of data obtained with TLS or photogrammetric methods is to create virtual models of cultural heritage (Dore and
Agnieszka BIEDA et al. / Acta Montanistica Slovaca, Volume 26 (2021), Number 2, 205-221
207
Murphy, 2017; Bocheńska et al., 2019; Bura et al., 2017; Gawronek et al., 2017). Such models are usually made
to preserve the historical, architectural and artistic remembrance of these objects as well as to promote the entire
region and the development of tourism there (Caradonna et al., 2018). These issues have already been addressed
on the examples of sites located in Cyprus (Ćwiąkała et al., 2018; Mikrut et al., 2017), Canada (Jia and Lichti,
2019), France (De Luca et al., 2014; Yang et al., 2018), Germany (Owda et al., 2018), Italy (Nazarena and
Roncella, 2019; Castagnetti et al., 2017; Girelli et al., 2017; Crespi et al., 2015), Jordan (Bodzek et al., 2019),
Poland (Warchoł et al., 2019; Hejmanowska et al., 2017; Bieda et al., 2020b), Spain (Angulo Fornos, 2015;
Remondino, 2011), Slovakia (Bartoš et al., 2011; Tometzová et al., 2020) and Ukraine (Chizhova et al., 2018).
However, the greatest challenge is to describe the underground structures that had not been inventoried
before they were buried in the ground. This is particularly important in situations where we would like to have
the geometrical description of these objects as accurately as possible and as much of the reflected reality as
possible. Therefore, the purpose of this paper is to describe the tasks that were carried out in order to investigate
the possibility of using 3D measurement technology in the promotion of underground tourist attractions.
Materials and Methods
As a part of this research, the evaluation of underground tourist attractions was carried out with the use of a
semantic differential test (Kruczek, 2011). In order to check how the use of 3D technology in the presentation of
tourist attractions alters the way we perceive them, the perception of the selected places was determined twice-
first on the basis of official promotional materials and then on the basis of films presenting point clouds obtained
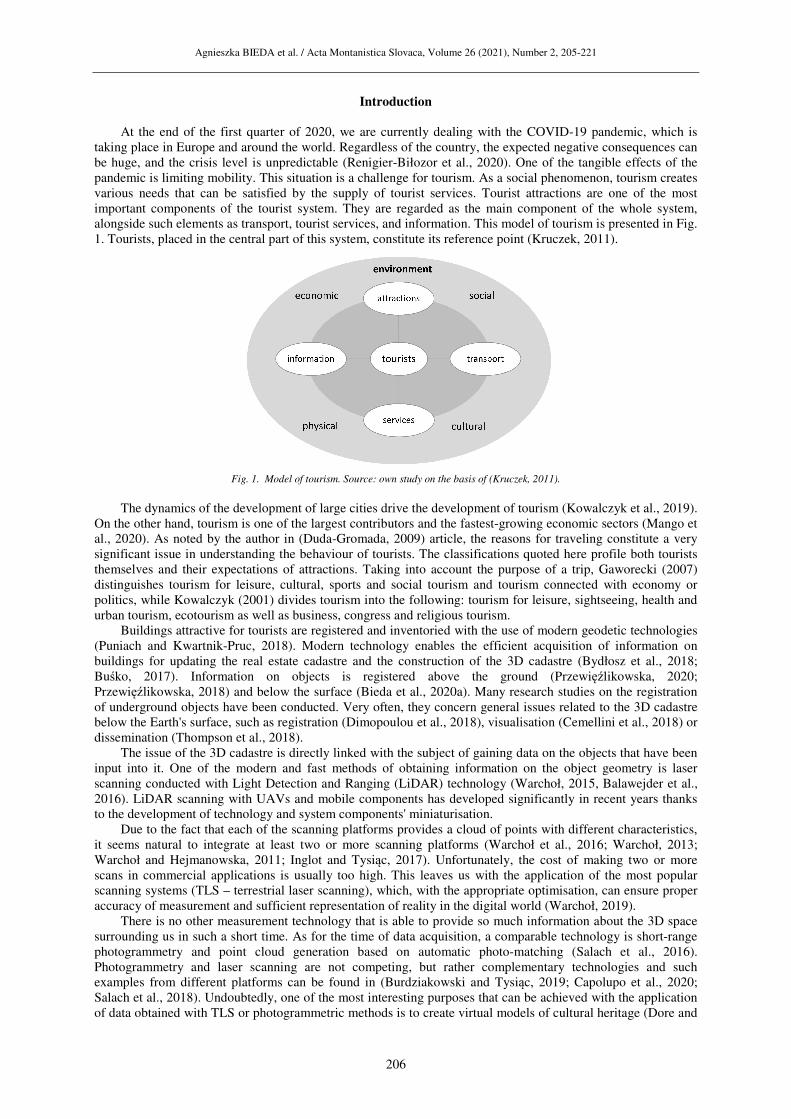
during surveying. After that, the views on this subject were gathered in survey research. The research scheme is
presented in Fig. 2.
Fig. 2. The research scheme. Source: own study.
Research objects
The research was conducted on two objects. The first one was Rzeszow Cellars, i.e. the Underground
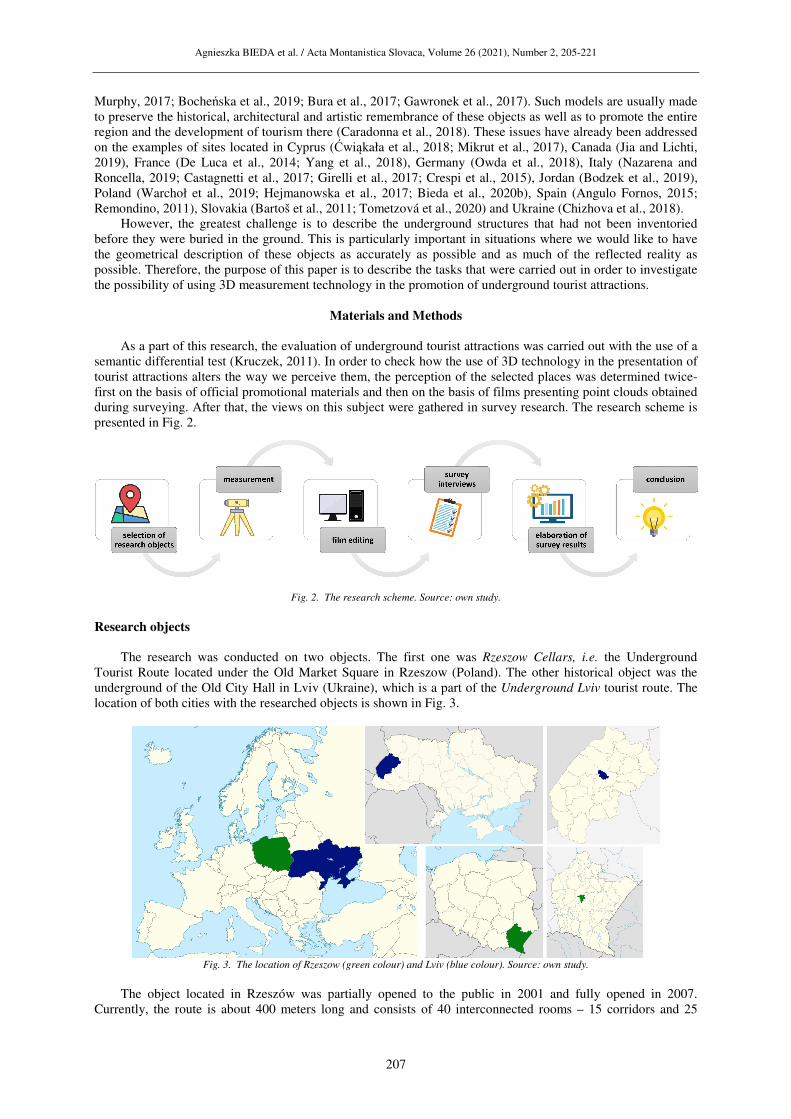
Tourist Route located under the Old Market Square in Rzeszow (Poland). The other historical object was the
underground of the Old City Hall in Lviv (Ukraine), which is a part of the Underground Lviv tourist route. The
location of both cities with the researched objects is shown in Fig. 3.
Fig. 3. The location of Rzeszow (green colour) and Lviv (blue colour). Source: own study.
The object located in Rzeszów was partially opened to the public in 2001 and fully opened in 2007.
Currently, the route is about 400 meters long and consists of 40 interconnected rooms – 15 corridors and 25
Agnieszka BIEDA et al. / Acta Montanistica Slovaca, Volume 26 (2021), Number 2, 205-221
208
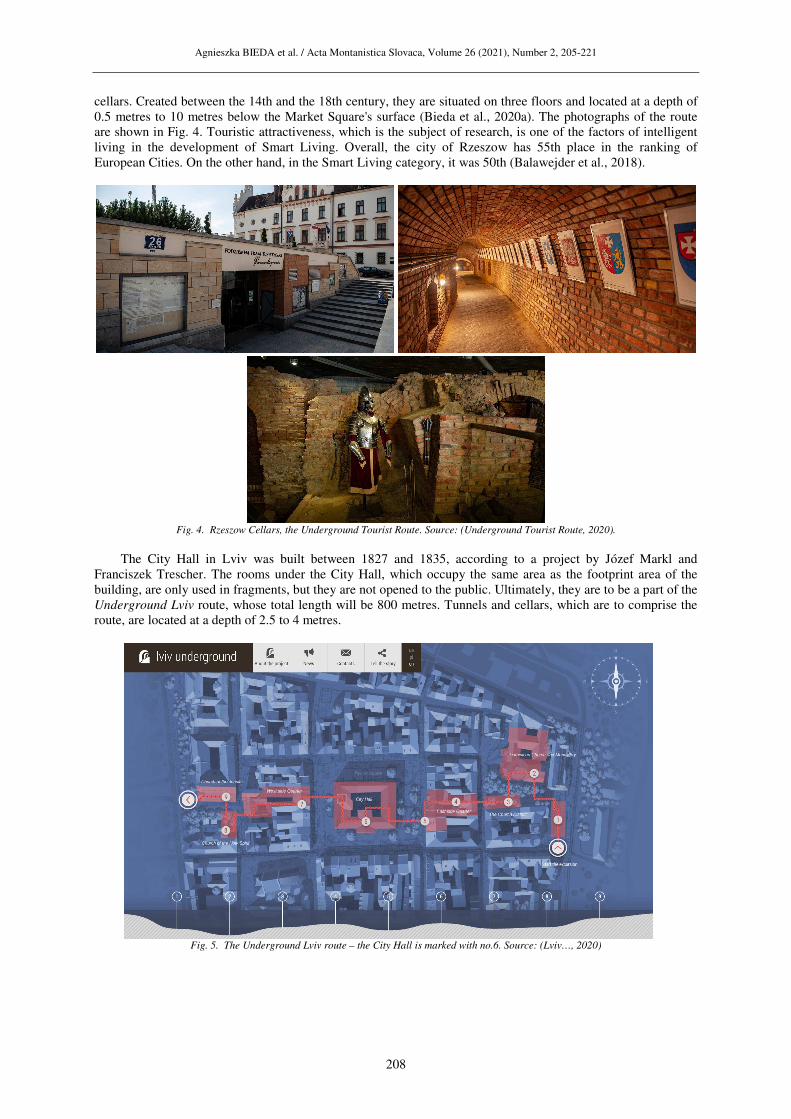
cellars. Created between the 14th and the 18th century, they are situated on three floors and located at a depth of
0.5 metres to 10 metres below the Market Square's surface (Bieda et al., 2020a). The photographs of the route
are shown in Fig. 4. Touristic attractiveness, which is the subject of research, is one of the factors of intelligent
living in the development of Smart Living. Overall, the city of Rzeszow has 55th place in the ranking of
European Cities. On the other hand, in the Smart Living category, it was 50th (Balawejder et al., 2018).
Fig. 4. Rzeszow Cellars, the Underground Tourist Route. Source: (Underground Tourist Route, 2020).
The City Hall in Lviv was built between 1827 and 1835, according to a project by Józef Markl and
Franciszek Trescher. The rooms under the City Hall, which occupy the same area as the footprint area of the
building, are only used in fragments, but they are not opened to the public. Ultimately, they are to be a part of the
Underground Lviv route, whose total length will be 800 metres. Tunnels and cellars, which are to comprise the
route, are located at a depth of 2.5 to 4 metres.
Fig. 5. The Underground Lviv route – the City Hall is marked with no.6. Source: (Lviv…, 2020)
Agnieszka BIEDA et al. / Acta Montanistica Slovaca, Volume 26 (2021), Number 2, 205-221
209
Methodology of Measurements
One way to achieve a true coloured visualisation and sets of cartometric data in a single step is to make an
inventory measurement, and this was performed in the course of our research with the use of LiDAR technology
with Terrestrial Laser Scanning (TLS).
Terrestrial Laser Scanning is a way to obtain single millimetre accuracy with a rate of data acquisition
ranging around 1 million points per second. A point cloud from each scan position is acquired in the local
coordinate system. Post-processing of all scans combines them into one coherent coordinate system (project
coordinate system). Depending on the object characteristics and the expected accuracy, different methods for
registering separate scans in the entire project could be used. The most popular methods are target-based
registration, cloud-to-cloud, and feature-based registration (Vosselman and Maas, 2010).
Accuracy that could be achieved with different methods of cloud registration is similar in each case. The
use of spheres or other targets takes much more time during the fieldwork. The time spent on target mounting
could be used to make some extra scans. In order to reduce shadows on the final point cloud, it is preferable to
make more scan positions. The main goal which sets the best method of making scans and the registration is the
object characteristics and the shape of the measurement network. When measurements are made in the building,
where many planes are located in different directions, then the registration based on point clouds (targetless) will
be a good solution. However, if we are in the natural environment and the shape of the scanned object is more
linear, then the target-based solution (spheres) will be better. In some projects, georeferencing is mandatory to
put clouds of points into the right place on the Earth with proper coordinates compatible with a global coordinate
system.
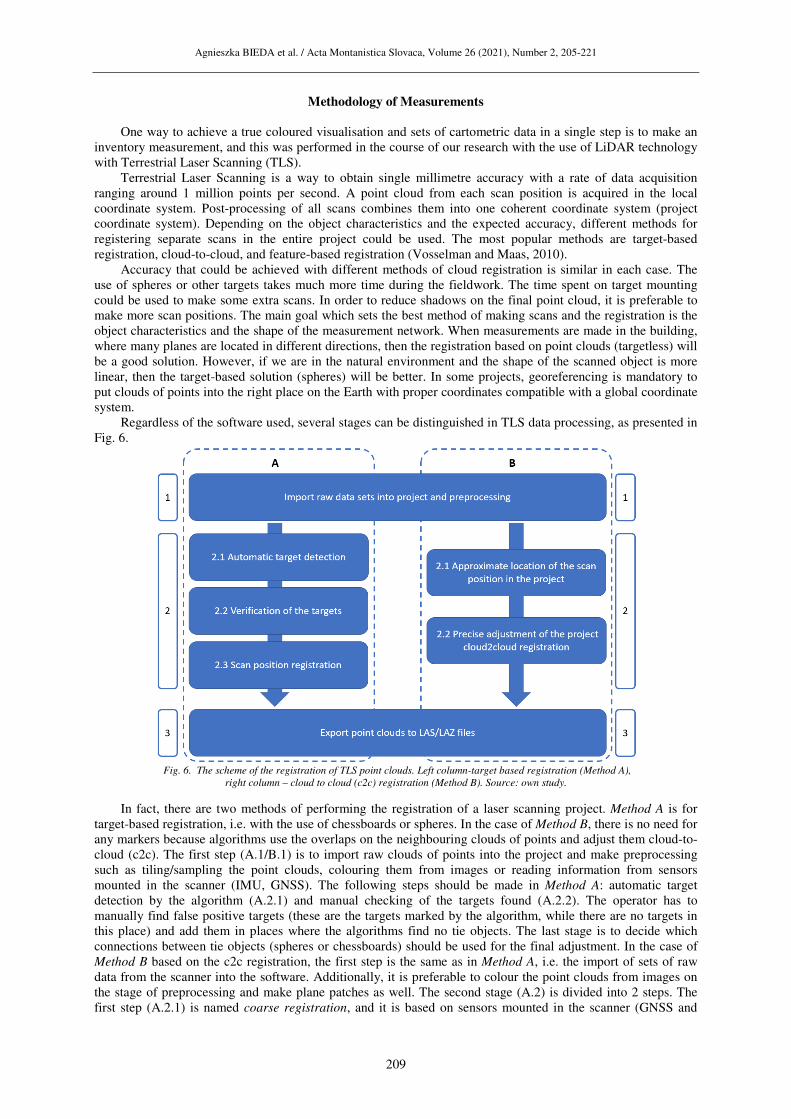
Regardless of the software used, several stages can be distinguished in TLS data processing, as presented in
Fig. 6.
Fig. 6. The scheme of the registration of TLS point clouds. Left column-target based registration (Method A),
right column – cloud to cloud (c2c) registration (Method B). Source: own study.
In fact, there are two methods of performing the registration of a laser scanning project. Method A is for
target-based registration, i.e. with the use of chessboards or spheres. In the case of Method B, there is no need for
any markers because algorithms use the overlaps on the neighbouring clouds of points and adjust them cloud-to-
cloud (c2c). The first step (A.1/B.1) is to import raw clouds of points into the project and make preprocessing
such as tiling/sampling the point clouds, colouring them from images or reading information from sensors
mounted in the scanner (IMU, GNSS). The following steps should be made in Method A: automatic target
detection by the algorithm (A.2.1) and manual checking of the targets found (A.2.2). The operator has to
manually find false positive targets (these are the targets marked by the algorithm, while there are no targets in
this place) and add them in places where the algorithms find no tie objects. The last stage is to decide which
connections between tie objects (spheres or chessboards) should be used for the final adjustment. In the case of
Method B based on the c2c registration, the first step is the same as in Method A, i.e. the import of sets of raw
data from the scanner into the software. Additionally, it is preferable to colour the point clouds from images on
the stage of preprocessing and make plane patches as well. The second stage (A.2) is divided into 2 steps. The
first step (A.2.1) is named coarse registration, and it is based on sensors mounted in the scanner (GNSS and
Agnieszka BIEDA et al. / Acta Montanistica Slovaca, Volume 26 (2021), Number 2, 205-221
210
IMU) and point clouds reduced to voxels. The second stage (A.2.2) is the precise adjustment, and the plane
patches found in the overlap of the point clouds are used. The last stage is the same as Method A – export of the
point clouds into the most popular file format (LAS/LAZ).
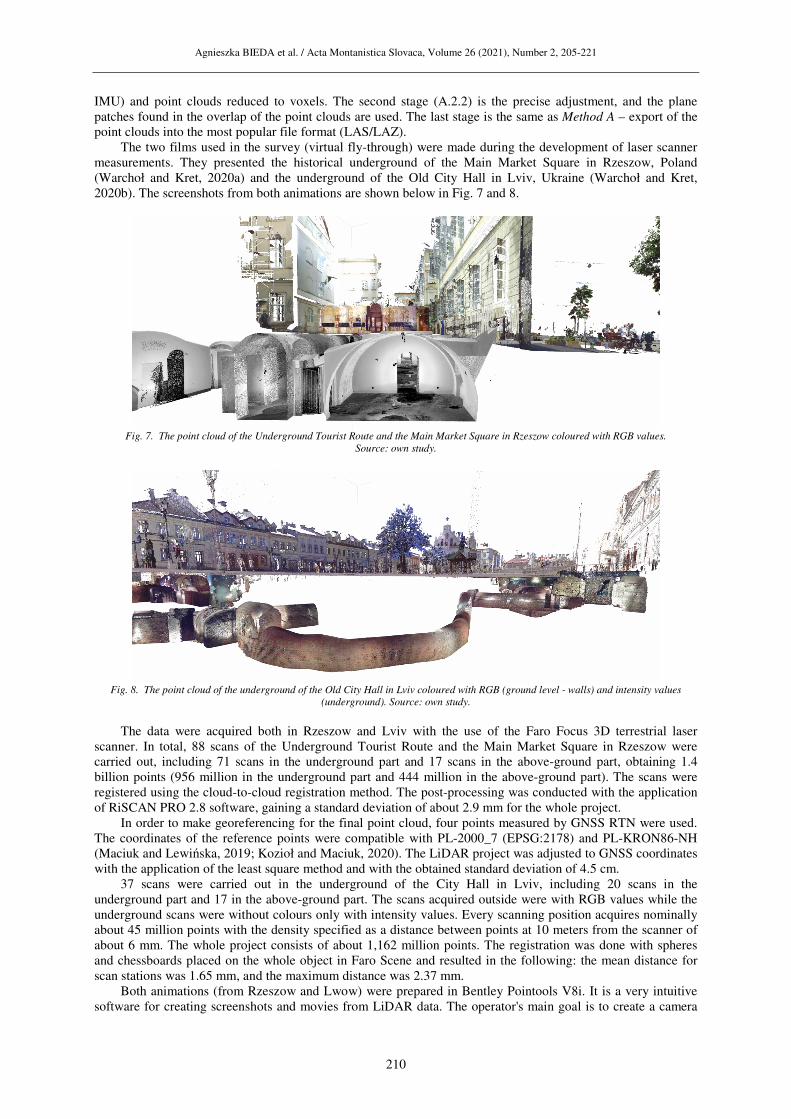
The two films used in the survey (virtual fly-through) were made during the development of laser scanner
measurements. They presented the historical underground of the Main Market Square in Rzeszow, Poland
(Warchoł and Kret, 2020a) and the underground of the Old City Hall in Lviv, Ukraine (Warchoł and Kret,
2020b). The screenshots from both animations are shown below in Fig. 7 and 8.
Fig. 7. The point cloud of the Underground Tourist Route and the Main Market Square in Rzeszow coloured with RGB values.
Source: own study.
Fig. 8. The point cloud of the underground of the Old City Hall in Lviv coloured with RGB (ground level - walls) and intensity values
(underground). Source: own study.
The data were acquired both in Rzeszow and Lviv with the use of the Faro Focus 3D terrestrial laser
scanner. In total, 88 scans of the Underground Tourist Route and the Main Market Square in Rzeszow were
carried out, including 71 scans in the underground part and 17 scans in the above-ground part, obtaining 1.4
billion points (956 million in the underground part and 444 million in the above-ground part). The scans were
registered using the cloud-to-cloud registration method. The post-processing was conducted with the application
of RiSCAN PRO 2.8 software, gaining a standard deviation of about 2.9 mm for the whole project.
In order to make georeferencing for the final point cloud, four points measured by GNSS RTN were used.
The coordinates of the reference points were compatible with PL-2000_7 (EPSG:2178) and PL-KRON86-NH
(Maciuk and Lewińska, 2019; Kozioł and Maciuk, 2020). The LiDAR project was adjusted to GNSS coordinates
with the application of the least square method and with the obtained standard deviation of 4.5 cm.
37 scans were carried out in the underground of the City Hall in Lviv, including 20 scans in the
underground part and 17 in the above-ground part. The scans acquired outside were with RGB values while the
underground scans were without colours only with intensity values. Every scanning position acquires nominally
about 45 million points with the density specified as a distance between points at 10 meters from the scanner of
about 6 mm. The whole project consists of about 1,162 million points. The registration was done with spheres
and chessboards placed on the whole object in Faro Scene and resulted in the following: the mean distance for
scan stations was 1.65 mm, and the maximum distance was 2.37 mm.
Both animations (from Rzeszow and Lwow) were prepared in Bentley Pointools V8i. It is a very intuitive
software for creating screenshots and movies from LiDAR data. The operator's main goal is to create a camera
Agnieszka BIEDA et al. / Acta Montanistica Slovaca, Volume 26 (2021), Number 2, 205-221
211
trajectory by the keyframes and set up the animation parameters. The films have been presented on YouTube
(Warchoł and Kret, 2020a; Warchoł and Kret, 2020b), and links to them were also included in the survey.
Methodology of evaluating the attractiveness of the historical undergrounds
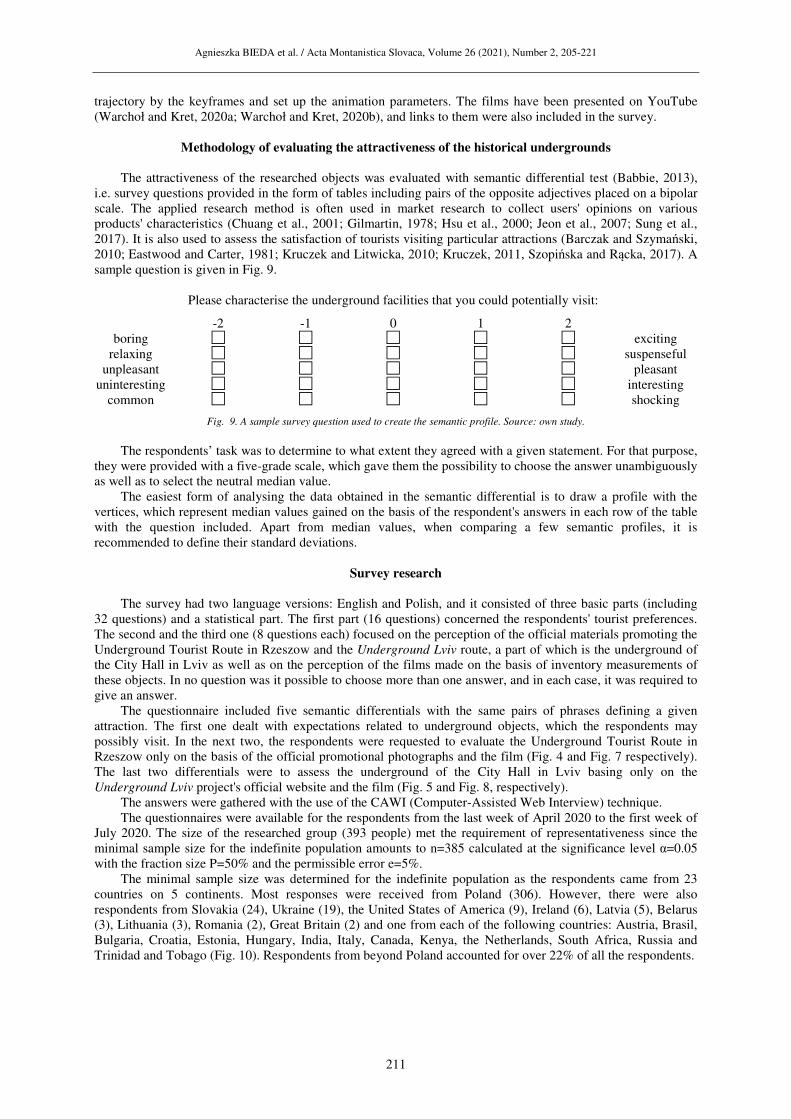
The attractiveness of the researched objects was evaluated with semantic differential test (Babbie, 2013),
i.e. survey questions provided in the form of tables including pairs of the opposite adjectives placed on a bipolar
scale. The applied research method is often used in market research to collect users' opinions on various
products' characteristics (Chuang et al., 2001; Gilmartin, 1978; Hsu et al., 2000; Jeon et al., 2007; Sung et al.,
2017). It is also used to assess the satisfaction of tourists visiting particular attractions (Barczak and Szymański,
2010; Eastwood and Carter, 1981; Kruczek and Litwicka, 2010; Kruczek, 2011, Szopińska and Rącka, 2017). A
sample question is given in Fig. 9.
Please characterise the underground facilities that you could potentially visit:
-2 -1 0 1 2
boring exciting
relaxing suspenseful
unpleasant pleasant
uninteresting interesting
common shocking
Fig. 9. A sample survey question used to create the semantic profile. Source: own study.
The respondents’ task was to determine to what extent they agreed with a given statement. For that purpose,
they were provided with a five-grade scale, which gave them the possibility to choose the answer unambiguously
as well as to select the neutral median value.
The easiest form of analysing the data obtained in the semantic differential is to draw a profile with the
vertices, which represent median values gained on the basis of the respondent's answers in each row of the table
with the question included. Apart from median values, when comparing a few semantic profiles, it is
recommended to define their standard deviations.
Survey research
The survey had two language versions: English and Polish, and it consisted of three basic parts (including
32 questions) and a statistical part. The first part (16 questions) concerned the respondents' tourist preferences.
The second and the third one (8 questions each) focused on the perception of the official materials promoting the
Underground Tourist Route in Rzeszow and the Underground Lviv route, a part of which is the underground of
the City Hall in Lviv as well as on the perception of the films made on the basis of inventory measurements of
these objects. In no question was it possible to choose more than one answer, and in each case, it was required to
give an answer.
The questionnaire included five semantic differentials with the same pairs of phrases defining a given
attraction. The first one dealt with expectations related to underground objects, which the respondents may
possibly visit. In the next two, the respondents were requested to evaluate the Underground Tourist Route in
Rzeszow only on the basis of the official promotional photographs and the film (Fig. 4 and Fig. 7 respectively).
The last two differentials were to assess the underground of the City Hall in Lviv basing only on the
Underground Lviv project's official website and the film (Fig. 5 and Fig. 8, respectively).
The answers were gathered with the use of the CAWI (Computer-Assisted Web Interview) technique.
The questionnaires were available for the respondents from the last week of April 2020 to the first week of
July 2020. The size of the researched group (393 people) met the requirement of representativeness since the
minimal sample size for the indefinite population amounts to n=385 calculated at the significance level α=0.05
with the fraction size P=50% and the permissible error e=5%.
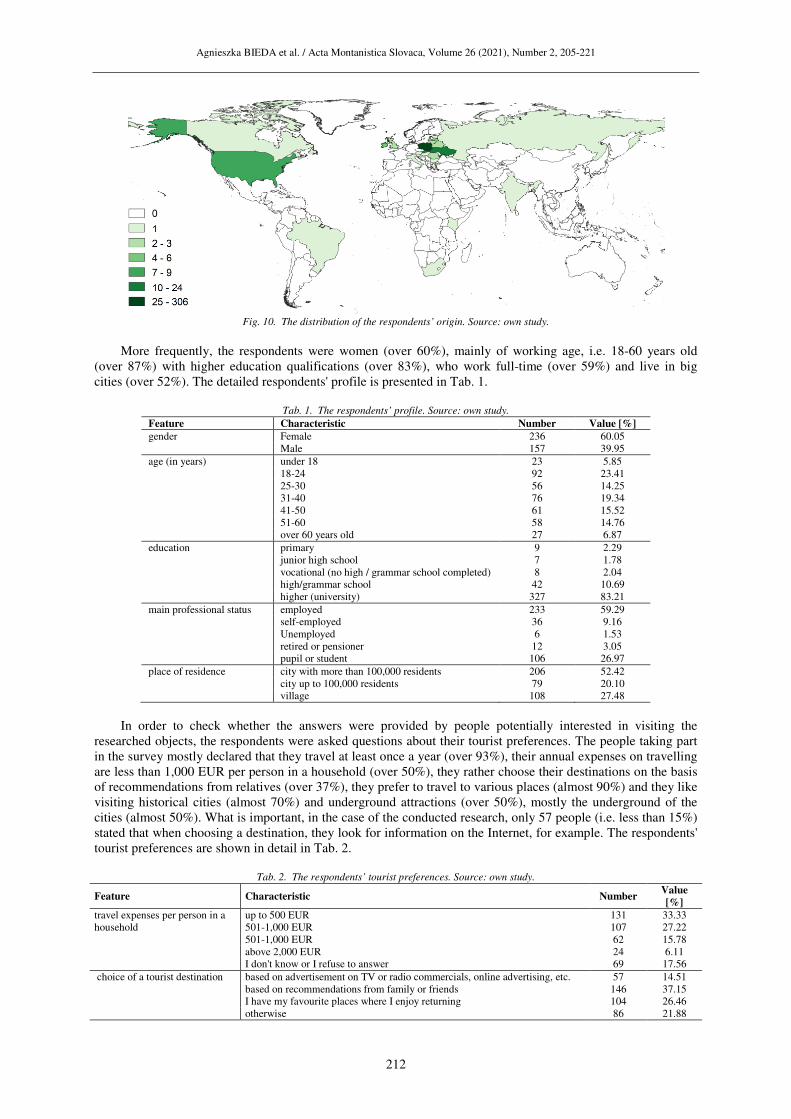
The minimal sample size was determined for the indefinite population as the respondents came from 23
countries on 5 continents. Most responses were received from Poland (306). However, there were also
respondents from Slovakia (24), Ukraine (19), the United States of America (9), Ireland (6), Latvia (5), Belarus
(3), Lithuania (3), Romania (2), Great Britain (2) and one from each of the following countries: Austria, Brasil,
Bulgaria, Croatia, Estonia, Hungary, India, Italy, Canada, Kenya, the Netherlands, South Africa, Russia and
Trinidad and Tobago (Fig. 10). Respondents from beyond Poland accounted for over 22% of all the respondents.
Agnieszka BIEDA et al. / Acta Montanistica Slovaca, Volume 26 (2021), Number 2, 205-221
212
Fig. 10. The distribution of the respondents’ origin. Source: own study.
More frequently, the respondents were women (over 60%), mainly of working age, i.e. 18-60 years old
(over 87%) with higher education qualifications (over 83%), who work full-time (over 59%) and live in big
cities (over 52%). The detailed respondents' profile is presented in Tab. 1.
Tab. 1. The respondents’ profile. Source: own study.
Feature Characteristic Number Value [%]
gender Female 236 60.05
Male 157 39.95
age (in years) under 18 23 5.85
18-24 92 23.41
25-30 56 14.25
31-40 76 19.34
41-50 61 15.52
51-60 58 14.76
over 60 years old 27 6.87
education primary 9 2.29
junior high school 7 1.78
vocational (no high / grammar school completed) 8 2.04
high/grammar school 42 10.69
higher (university) 327 83.21
main professional status employed 233 59.29
self-employed 36 9.16
Unemployed 6 1.53
retired or pensioner 12 3.05
pupil or student 106 26.97
place of residence city with more than 100,000 residents 206 52.42
city up to 100,000 residents 79 20.10
village 108 27.48
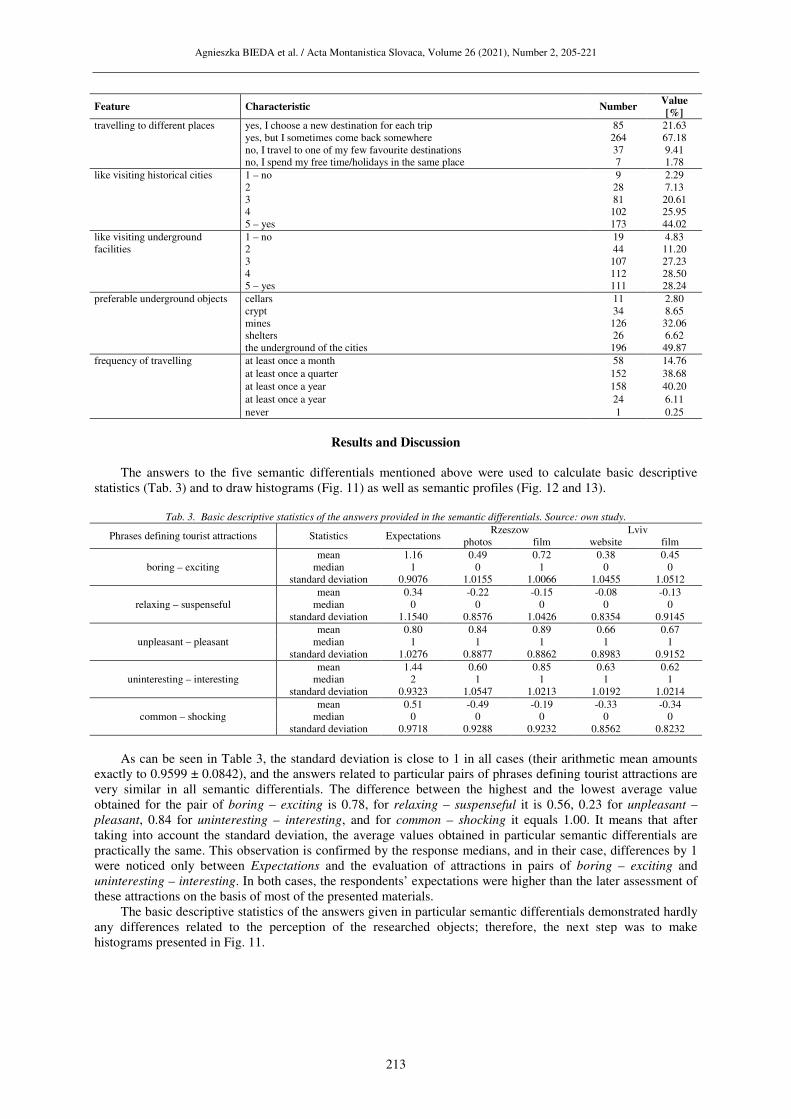
In order to check whether the answers were provided by people potentially interested in visiting the
researched objects, the respondents were asked questions about their tourist preferences. The people taking part
in the survey mostly declared that they travel at least once a year (over 93%), their annual expenses on travelling
are less than 1,000 EUR per person in a household (over 50%), they rather choose their destinations on the basis
of recommendations from relatives (over 37%), they prefer to travel to various places (almost 90%) and they like
visiting historical cities (almost 70%) and underground attractions (over 50%), mostly the underground of the
cities (almost 50%). What is important, in the case of the conducted research, only 57 people (i.e. less than 15%)
stated that when choosing a destination, they look for information on the Internet, for example. The respondents'
tourist preferences are shown in detail in Tab. 2.
Tab. 2. The respondents’ tourist preferences. Source: own study.
Feature Characteristic Number Value
[%]
travel expenses per person in a
household
up to 500 EUR 131 33.33
501-1,000 EUR 107 27.22
501-1,000 EUR 62 15.78
above 2,000 EUR 24 6.11
I don't know or I refuse to answer 69 17.56
choice of a tourist destination
based on advertisement on TV or radio commercials, online advertising, etc. 57 14.51
based on recommendations from family or friends 146 37.15
I have my favourite places where I enjoy returning 104 26.46
otherwise 86 21.88
Agnieszka BIEDA et al. / Acta Montanistica Slovaca, Volume 26 (2021), Number 2, 205-221
213
Feature Characteristic Number Value
[%]
travelling to different places yes, I choose a new destination for each trip 85 21.63
yes, but I sometimes come back somewhere 264 67.18
no, I travel to one of my few favourite destinations 37 9.41
no, I spend my free time/holidays in the same place 7 1.78
like visiting historical cities
1 – no 9 2.29
2 28 7.13
3 81 20.61
4 102 25.95
5 – yes 173 44.02
like visiting underground
facilities
1 – no 19 4.83
2 44 11.20
3 107 27.23
4 112 28.50
5 – yes 111 28.24
preferable underground objects
cellars 11 2.80
crypt 34 8.65
mines 126 32.06
shelters 26 6.62
the underground of the cities 196 49.87
frequency of travelling
at least once a month 58 14.76
at least once a quarter 152 38.68
at least once a year 158 40.20
at least once a year 24 6.11
never 1 0.25
Results and Discussion
The answers to the five semantic differentials mentioned above were used to calculate basic descriptive
statistics (Tab. 3) and to draw histograms (Fig. 11) as well as semantic profiles (Fig. 12 and 13).
Tab. 3. Basic descriptive statistics of the answers provided in the semantic differentials. Source: own study.
Phrases defining tourist attractions Statistics Expectations Rzeszow Lviv
photos film website film
boring – exciting
mean 1.16 0.49 0.72 0.38 0.45
median 1 0 1 0 0
standard deviation 0.9076 1.0155 1.0066 1.0455 1.0512
relaxing – suspenseful
mean 0.34 -0.22 -0.15 -0.08 -0.13
median 0 0 0 0 0
standard deviation 1.1540 0.8576 1.0426 0.8354 0.9145
unpleasant – pleasant
mean 0.80 0.84 0.89 0.66 0.67
median 1 1 1 1 1
standard deviation 1.0276 0.8877 0.8862 0.8983 0.9152
uninteresting – interesting
mean 1.44 0.60 0.85 0.63 0.62
median 2 1 1 1 1
standard deviation 0.9323 1.0547 1.0213 1.0192 1.0214
common – shocking
mean 0.51 -0.49 -0.19 -0.33 -0.34
median 0 0 0 0 0
standard deviation 0.9718 0.9288 0.9232 0.8562 0.8232
As can be seen in Table 3, the standard deviation is close to 1 in all cases (their arithmetic mean amounts
exactly to 0.9599 ± 0.0842), and the answers related to particular pairs of phrases defining tourist attractions are
very similar in all semantic differentials. The difference between the highest and the lowest average value
obtained for the pair of boring – exciting is 0.78, for relaxing – suspenseful it is 0.56, 0.23 for unpleasant –
pleasant, 0.84 for uninteresting – interesting, and for common – shocking it equals 1.00. It means that after
taking into account the standard deviation, the average values obtained in particular semantic differentials are
practically the same. This observation is confirmed by the response medians, and in their case, differences by 1
were noticed only between Expectations and the evaluation of attractions in pairs of boring – exciting and
uninteresting – interesting. In both cases, the respondents’ expectations were higher than the later assessment of
these attractions on the basis of most of the presented materials.
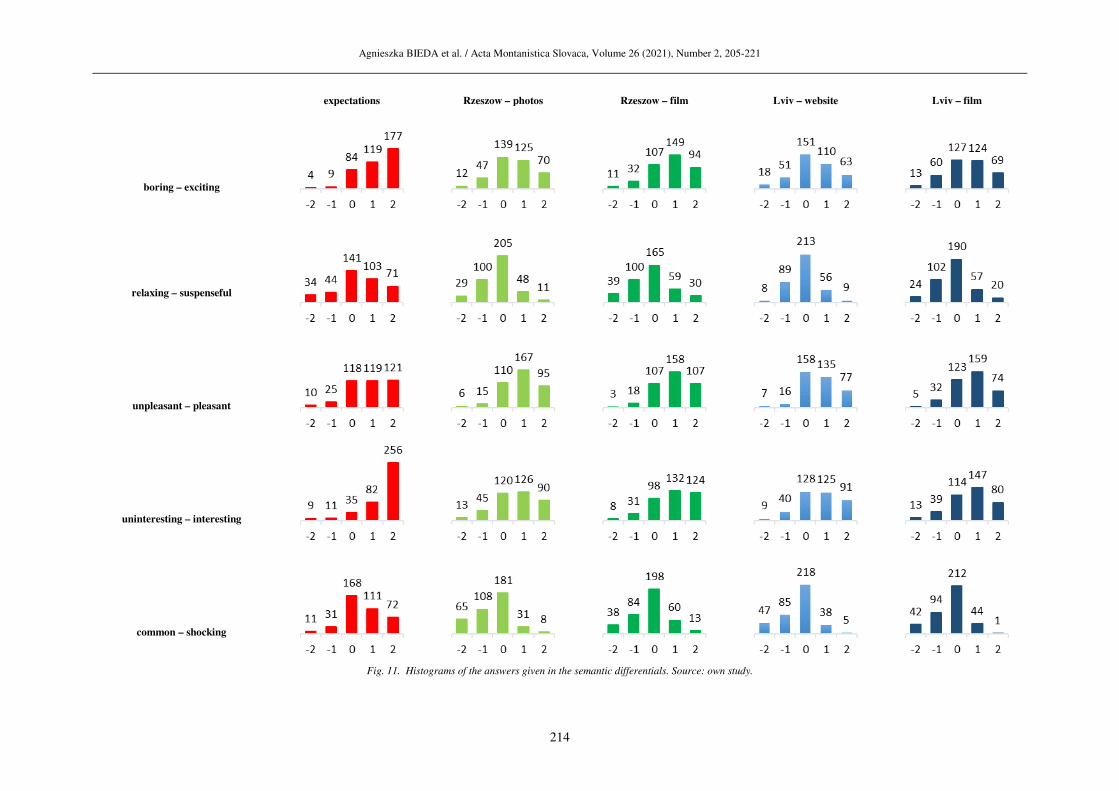
The basic descriptive statistics of the answers given in particular semantic differentials demonstrated hardly
any differences related to the perception of the researched objects; therefore, the next step was to make
histograms presented in Fig. 11.
Agnieszka BIEDA et al. / Acta Montanistica Slovaca, Volume 26 (2021), Number 2, 205-221
214
expectations Rzeszow – photos Rzeszow – film Lviv – website Lviv – film
boring – exciting
relaxing – suspenseful
unpleasant – pleasant
uninteresting – interesting
common – shocking
Fig. 11. Histograms of the answers given in the semantic differentials. Source: own study.
Agnieszka BIEDA et al. / Acta Montanistica Slovaca, Volume 26 (2021), Number 2, 205-221
215
It could be clearly noted that in the respondents' opinions, a historical underground should be extremely
exciting and interesting. However, the evaluation of the researched objects left them with a feeling of
dissatisfaction. The most frequent answer in the pair of boring – exciting was usually the middle one. Only the
film about the Underground Tourist Route in Rzeszow seemed to the respondents to be more exciting than
boring. In contrast, in the case of the pair of uninteresting – interesting, a large proportion of the respondents
answered in a conservative way marking the value of 0 in each semantic differential. One group of similar size
found it more interesting than uninteresting in any possible case. Again, the film about the Underground Tourist
Route in Rzeszow received the best notes. It was the only one regarded as interesting by 25% of the respondents.
As for the pair of relaxing – suspenseful, a large number of the respondents expected the underground
attractions to hold them captive. However, during the assessment, they found that the materials presenting the
researched objects rather demonstrated their neutrality in this regard. A similar relationship could be noticed for
the common – shocking pair. In this case, the respondents were expecting something more shocking, but they
were provided with more common objects.
The expectations of the respondents and their evaluation of the researched objects were the most consistent
in the case of the unpleasant – pleasant pair as only the proportions between the answers 0, 1 and 2 were slightly
different.
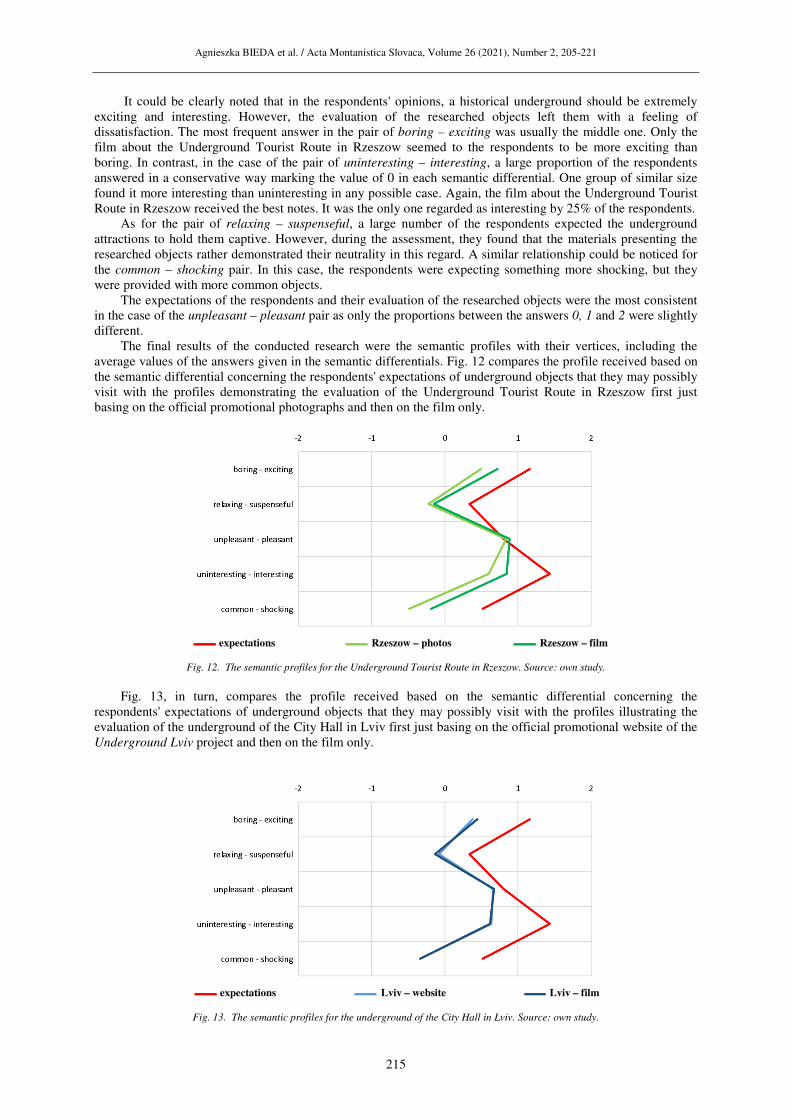
The final results of the conducted research were the semantic profiles with their vertices, including the
average values of the answers given in the semantic differentials. Fig. 12 compares the profile received based on
the semantic differential concerning the respondents' expectations of underground objects that they may possibly
visit with the profiles demonstrating the evaluation of the Underground Tourist Route in Rzeszow first just
basing on the official promotional photographs and then on the film only.
expectations Rzeszow – photos Rzeszow – film
Fig. 12. The semantic profiles for the Underground Tourist Route in Rzeszow. Source: own study.
Fig. 13, in turn, compares the profile received based on the semantic differential concerning the
respondents' expectations of underground objects that they may possibly visit with the profiles illustrating the
evaluation of the underground of the City Hall in Lviv first just basing on the official promotional website of the
Underground Lviv project and then on the film only.
expectations Lviv – website Lviv – film
Fig. 13. The semantic profiles for the underground of the City Hall in Lviv. Source: own study.
Agnieszka BIEDA et al. / Acta Montanistica Slovaca, Volume 26 (2021), Number 2, 205-221
216
The compiled semantic profiles confirm all the previously discussed observations. They clearly demonstrate
that the respondents' expectations of underground objects that they may possibly visit were always higher than
the profiles illustrating the evaluation of the researched objects (regardless of a method presenting these objects).
A slight exception is the pair of unpleasant – pleasant phrases for the Underground Tourist Route in Rzeszow.
In this case, the average photograph-based rating was higher by 0.04 than the respondents' expectations, and the
film-based rating was higher by 0.09.
In addition, the whole semantic profile for the film-based evaluation of the Underground Tourist Route in
Rzeszow is closer to the profile illustrating the respondents’ expectations than the profile for the assessment
based on the promotional photographs.
Undoubtedly, the two almost identical semantic profiles for the City Hall's underground in Lviv turned out
to the biggest surprise about the conducted research.
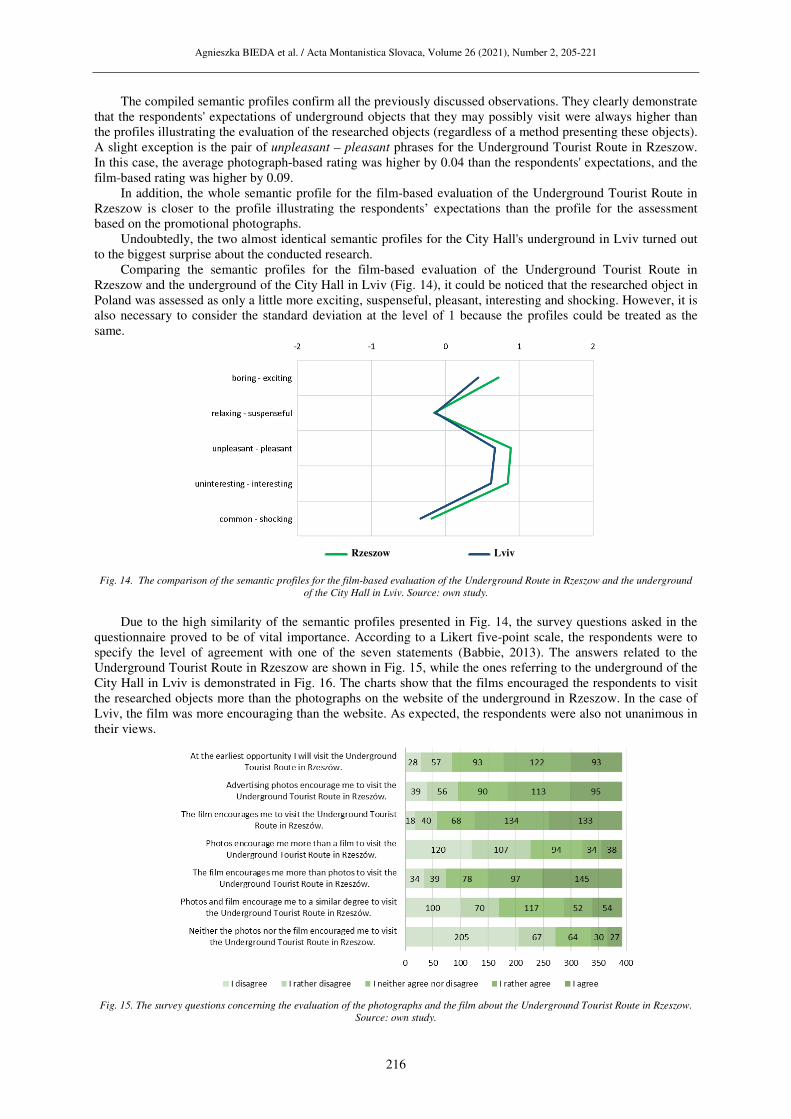
Comparing the semantic profiles for the film-based evaluation of the Underground Tourist Route in
Rzeszow and the underground of the City Hall in Lviv (Fig. 14), it could be noticed that the researched object in
Poland was assessed as only a little more exciting, suspenseful, pleasant, interesting and shocking. However, it is
also necessary to consider the standard deviation at the level of 1 because the profiles could be treated as the
same.
Rzeszow Lviv
Fig. 14. The comparison of the semantic profiles for the film-based evaluation of the Underground Route in Rzeszow and the underground
of the City Hall in Lviv. Source: own study.
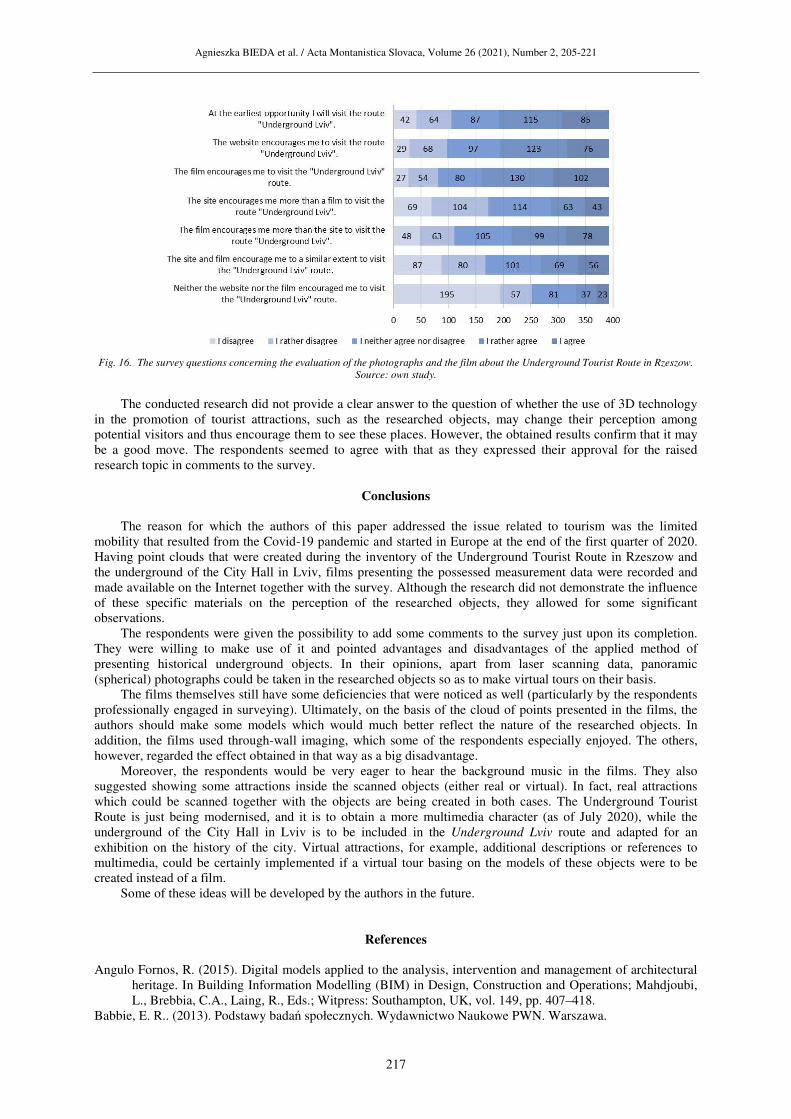
Due to the high similarity of the semantic profiles presented in Fig. 14, the survey questions asked in the
questionnaire proved to be of vital importance. According to a Likert five-point scale, the respondents were to
specify the level of agreement with one of the seven statements (Babbie, 2013). The answers related to the
Underground Tourist Route in Rzeszow are shown in Fig. 15, while the ones referring to the underground of the
City Hall in Lviv is demonstrated in Fig. 16. The charts show that the films encouraged the respondents to visit
the researched objects more than the photographs on the website of the underground in Rzeszow. In the case of
Lviv, the film was more encouraging than the website. As expected, the respondents were also not unanimous in
their views.
Fig. 15. The survey questions concerning the evaluation of the photographs and the film about the Underground Tourist Route in Rzeszow.
Source: own study.
Agnieszka BIEDA et al. / Acta Montanistica Slovaca, Volume 26 (2021), Number 2, 205-221
217
Fig. 16. The survey questions concerning the evaluation of the photographs and the film about the Underground Tourist Route in Rzeszow.
Source: own study.
The conducted research did not provide a clear answer to the question of whether the use of 3D technology
in the promotion of tourist attractions, such as the researched objects, may change their perception among
potential visitors and thus encourage them to see these places. However, the obtained results confirm that it may
be a good move. The respondents seemed to agree with that as they expressed their approval for the raised
research topic in comments to the survey.
Conclusions
The reason for which the authors of this paper addressed the issue related to tourism was the limited
mobility that resulted from the Covid-19 pandemic and started in Europe at the end of the first quarter of 2020.
Having point clouds that were created during the inventory of the Underground Tourist Route in Rzeszow and
the underground of the City Hall in Lviv, films presenting the possessed measurement data were recorded and
made available on the Internet together with the survey. Although the research did not demonstrate the influence
of these specific materials on the perception of the researched objects, they allowed for some significant
observations.
The respondents were given the possibility to add some comments to the survey just upon its completion.
They were willing to make use of it and pointed advantages and disadvantages of the applied method of
presenting historical underground objects. In their opinions, apart from laser scanning data, panoramic
(spherical) photographs could be taken in the researched objects so as to make virtual tours on their basis.
The films themselves still have some deficiencies that were noticed as well (particularly by the respondents
professionally engaged in surveying). Ultimately, on the basis of the cloud of points presented in the films, the
authors should make some models which would much better reflect the nature of the researched objects. In
addition, the films used through-wall imaging, which some of the respondents especially enjoyed. The others,
however, regarded the effect obtained in that way as a big disadvantage.
Moreover, the respondents would be very eager to hear the background music in the films. They also
suggested showing some attractions inside the scanned objects (either real or virtual). In fact, real attractions
which could be scanned together with the objects are being created in both cases. The Underground Tourist
Route is just being modernised, and it is to obtain a more multimedia character (as of July 2020), while the
underground of the City Hall in Lviv is to be included in the Underground Lviv route and adapted for an
exhibition on the history of the city. Virtual attractions, for example, additional descriptions or references to
multimedia, could be certainly implemented if a virtual tour basing on the models of these objects were to be
created instead of a film.
Some of these ideas will be developed by the authors in the future.
References
Angulo Fornos, R. (2015). Digital models applied to the analysis, intervention and management of architectural
heritage. In Building Information Modelling (BIM) in Design, Construction and Operations; Mahdjoubi,
L., Brebbia, C.A., Laing, R., Eds.; Witpress: Southampton, UK, vol. 149, pp. 407–418.
Babbie, E. R.. (2013). Podstawy badań społecznych. Wydawnictwo Naukowe PWN. Warszawa.
Agnieszka BIEDA et al. / Acta Montanistica Slovaca, Volume 26 (2021), Number 2, 205-221
218
Balawejder, M.; Matkowska, K.; Colak, H. E. (2018). The Impact of Surveying Works on The Development of
Smart City. In Proceedings of the 25th Anniversary Conference Geographic Information Systems
Conference and Exhibition GIS ODYSSEY 2018, Perugia, Italy, 10–14 September 2018, pp. 20–32.
Balawejder M.; Warchoł A.; Matuła P.; Kret M. (2016). Use technology LIDAR in passive documentation of
historical sites. Use and Protection of Land Rasources: Actual Issues of the Science and Practice,
pp. 97-100, Lviv, УДК 332.33, ББК 65.9(4Укр)32-51я54, В-43.
http://www.lnau.lviv.ua/lnau/attachments/3665_Konf_LNAU_18.05.2016.pdf#page=97.
Barczak, M. and Szymański, P. (2010). Test zróżnicowania semantycznego dla bydgoskiego tramwaju wodnego.
Zeszyty Naukowe Uniwersytetu Szczecińskiego, nr 590, pp. 439-453.
Bartoš, K.; Pukanská, K.; Gajdošík, J.; Krajňák, M. (2011). The issue of documentation of hardly accessible
historical monuments by using of photogrammetry and laser scanner techniques. Geoinformatics, 6, pp.
40–47, https://doi.org/10.14311/gi.6.6.
Bieda, A.; Bydłosz, J.; Warchoł, A.; Balawejder, M. (2020a). Historical Underground Structures as 3D Cadastral
Objects. Remote Sensing, 12, 1547, https://doi.org/10.3390/rs12101547.
Bieda, A.; Bydłosz, J.; Parzych, P.; Pukanská, K.; Wójciak, E. (2020b). 3D Technologies as the Future of Spatial
Planning: The Example of Krakow. Geomatics and Environmental Engineering, vol. 14, no. 1, pp. 15–33,
https://doi.org/10.7494/geom.2020.14.1.15.
Bocheńska, A.; Markiewicz, J.; Łapiński, S. (2019). The combination of the image and range-based 3d
acquisition in archaeological and architectural research in the royal castle in Warsaw, ISPRS –
International Archives of the Photogrammetry, Remote Sensing and Spatial Information Sciences,
Volume XLII-2/W15, 2019, pp.177-184, https://doi.org/10.5194/isprs-archives-XLII-2-W15-177-2019.
Bodzek, J.; Kopij, K.; Miszk, Ł.; Ćwiąkała, P.; Puniach, E.; Kajzer, M.; Ochałek, A.; Mrocheń, D.; Słodowska,
A.; Sawicka, K.; et al. (2018). Results of “Archaeological Study of Dajaniya & Tuwaneh” (ArTu:DTu)
2018 survey of Dajaniya (Ma’an-Husseiniyeh), Southern Jordan. In Discovering Edom: Polish
Archaeological Activity in Southern Jordan; Kołodziejczyk, P., Ed.; Profil-Archeo Magdalena
Dzięgielewska, Euclid Foundation for Science Popularization, Institute of Archaeology: Kraków, Poland,
pp. 51–67.
Bura, M.; Janowski, J.; Wężyk, P.; Zięba, K. (2017). The digital von Fahrenheid pyramid. ISPRS – International
Archives of the Photogrammetry, Remote Sensing and Spatial Information Sciences, vol. XLII-2/W5, 42,
pp. 105–111, https://doi.org/10.5194/isprs-archives-XLII-2-W5-105-2017.
Burdziakowski, P. and Tysiąc, P. (2019). Combined Close Range Photogrammetry and Terrestrial Laser
Scanning for Ship Hull Modelling. Geosciences, 9, 242, https://doi.org/10.3390/geosciences9050242.
Buśko, M. (2017). Intended Use of a Building in Terms of Updating the Cadastral Database and Harmonising
the Data with other Public Records. Reports on Geodesy and Geoinformatics. Volume: 103, Issue: 1.
Pages: 78-93. https://doi.org/:10.1515/rgg-2017-0007.
Bydłosz, J.; Bieda, A.; Parzych, P. (2018). The Implementation of Spatial Planning Objects in a 3D Cadastral
Model. ISPRS International Journal of Geo-Information, 7, 153, https://doi.org/10.3390/ijgi7040153.
Capolupo, A.; Monterisi, C.; Tarantino, E. (2020). Landsat Images Classification Algorithm (LICA) to
Automatically Extract Land Cover Information in Google Earth Engine Environment. Remote Sensing,
12, 1201. https://doi.org/10.3390/rs12071201.
Caradonna, G.; Tarantino, E.; Scaioni, M.; Figorito, B. (2018). Multi-image 3D Reconstruction: A
Photogrammetric and Structure from Motion Comparative Analysis. In Proceedings of the International
Conference on Computational Science and Its Applications, Part V, Melbourne, Australia, 2–5 July 2018,
pp. 305–316.
Castagnetti, C.; Dubbini, M.; Ricci, P.C.; Rivola, R.; Giannini, M.; Capra, A. (2017). Critical issues and key
points from the survey to the creation of the historical building information model: The case of Santo
Stefano Basilica. ISPRS – International Archives of the Photogrammetry, Remote Sensing and Spatial
Information Sciences, vol. XLII-5/W1, pp. 467–474, http://dx.doi.org/10.5194/isprs-Archives-XLII-5-
W1-467-2017.
Cemellini, B.; Thompson, R.; de Vries, M.; van Oosterom, P. (2018). Visualization/Dissemination of 3D
Cadastre. In Proceedings of the FIG Congress, Istanbul, Turkey, 6–11 May 2018.
Crespi, P.; Franchi, A.; Ronca, P.; Giordano, N.; Scamardo, M.; Gusmeroli, G.; Schiantarelli, G. (2015). From
BIM to FEM: The analysis of an historical masonry building. In Building Information Modelling (BIM)
in Design, Construction and Operations; Mahdjoubi, L., Brebbia, C.A., Laing, R., Eds.; Witpress:
Southampton, UK, vol. 149, pp. 581–592.
Chizhova, M.; Gurianov, A.; Hess, M.; (2018). Luhmann, T.; Brunn, A.; Stilla, U. Semantic segmentation of
building elements using point cloud hashing. ISPRS – International Archives of the Photogrammetry,
Remote Sensing and Spatial Information Sciences, vol. XLII2, pp. 241–250,
http://dx.doi.org/10.5194/isprs-archives-XLII-2-241-2018.
Agnieszka BIEDA et al. / Acta Montanistica Slovaca, Volume 26 (2021), Number 2, 205-221
219
Chuang, M. C.; Chang, C. C.; Hsu, S. H. (2001). Perceptual factors underlying user preferences toward product
form of mobile phones. International journal of industrial ergonomics, 27(4), pp. 247-258.
https://doi.org/10.1016/S0169-8141(00)00054-8.
Ćwiąkała, P.; Matwij, W.; Matwij, K.; Puniach, E. (2018). Agora Project – Laser scanning in archaeology:
Experiences from the Paphos Agora Project. [In:] Paphos – Mystery of the City of Aphrodite:
Archaeological Heritage Versus New Technologies; Papuci-Władyka, E., Ed.; Archaeologica Foundation:
Kraków, Poland, pp. 124–131.
De Luca, L.; Driscu, T.; Peyrols, E.; Labrosse, D.; Berthelot, M. (2014). A complete methodology for the virtual
assembling of dismounted historic buildings. International Journal on Interactive Design and
Manufacturing, 8, pp. 265–276, https://doi.org/10.1007/s12008-014-0224-5.
Dimopoulou, E.; Karki, S.; Roić, M.; De Almeida, J.; Griffith-Charles, C.; Thompson, R.; Ying, S.; Paasch, J.;
van Oosterom, P. (2018). 3D Cadastres Best Practices, Initial Registration of 3D Parcels. In Proceedings
of the FIG Congress, Istanbul, Turkey, 6–11 May 2018.
Dore, C. and Murphy, M. (2017). Current state of the art historic building information modelling. ISPRS –
International Archives of the Photogrammetry, Remote Sensing and Spatial Information Sciences, vol.
XLII-2/W5, pp. 185–192, https://doi.org/10.5194/ispr-archives-XLII-2-W5-185-2017
Duda-Gromada K. (2009). Tourism characteristics of selected reservoir areas in Poland. Prace Geograficzne, UJ
Krakow, 121, pp. 87-95.
Eastwood, D. A. and Carter, R. W. G. (1981). The Irish dune consumer. Journal of Leisure Research, 13(4),
pp. 273-281. https://doi.org/10.1080/00222216.1981.11969492.
Gaworecki W. W. (2007). Turystyka, Polskie Wydawnictwo Ekonomiczne, Warszawa.
Gawronek, P.; Makuch, M.; Mitka, B.; Bożek, P.; Klapa, P. (2017). 3D scanning of the historical underground of
Benedictine Abbey in Tyniec (Poland). In Proceedings of the 17th International Multidisciplinary
Scientific GeoConference SGEM, Albena, Bulgaria, 29 June–5 July 2017, vol. 17, pp. 3–10, Issue 22.
Gilmartin, P. P. (1978). Evaluation of thematic maps using the semantic differential test. The American
Cartographer, 5(2), pp. 133-139. https://doi.org/10.1559/152304078784022863.
Girelli, V.A.; Borgatti, L.; Dellapasqua, M.; Mandanici, E.; Spreafico, M.C.; Tini, M.A.; Bitelli, G. (2017).
Integration of geomatics techniques for digitising highly relevant geological and cultural heritage sites:
The case of San Leo (Italy). ISPRS – International Archives of the Photogrammetry, Remote Sensing and
Spatial Information Sciences, vol. XLII-2/W5, pp. 281–286, https://doi.org/10.5194/isprs-archives-XLII-
2-W5-281-2017.
Hejmanowska, B.; Głowienka, E.; Michałowska, K.; Mikrut, S.; Kramarczyk, P.; Opaliński, P.; Struś, A. (2017).
4D Reconstruction and Visualisation of Krakow Fortress. [In:] Proceedings of the 2017 Baltic Geodetic
Congress (BGC Geomatics), Gdansk, Poland, 22–25 June 2017, pp. 1–5,
https://doi.org/10.1109/BGC.Geomatics.2017.83.
Hsu, S. H.; Chuang, M. C.; Chang, C. C. (2000). A semantic differential study of designers’ and users’ product
form perception. International journal of industrial ergonomics, 25(4), pp. 375-391.
https://doi.org/10.1016/S0169-8141(99)00026-8.
Inglot, A. and Tysiąc, P. (2017). Airborne Laser Scanning Point Cloud Update by Used of the Terrestrial Laser
Scanning and the Low-Level Aerial Photogrammetry. [In:] Proceedings of the 2017 Baltic Geodetic
Congress (BGC Geomatics), Gdansk, Poland, 22–25 June 2017, pp. 34–38,
https://doi.org/10.1109/bgc.geomatics.2017.75.
Jeon, J. Y.; You, J.; Chang, H. Y. (2007). Sound radiation and sound quality characteristics of refrigerator noise
in real living environments. Applied acoustics, 68(10), pp. 1118-1134.
https://doi.org/10.1016/j.apacoust.2006.06.005.
Jia, F. and Lichti, D.D. (2019) A Model-Based Design System for Terrestrial Laser Scanning Networks in
Complex Sites. Remote Sensing, 11, 1749, https://doi.org/10.3390/rs11151749.
Kowalczyk A. (2001). Geografia turyzmu, Wydawnictwo Naukowe PWN, Warszawa.
Kowalczyk C.; Kil J.; Kurowska K. (2019) Dynamics of development of the largest cities-Evidence from
Poland. Cities. Volume 89, June 2019, pp. 26-34, https://doi.org/10.1016/j.cities.2019.01.018
Kozioł, K. and Maciuk, K. (2020). New heights of the highest peaks of Polish mountain ranges. Remote Sensing,
12, 1446, https://doi.org/10.3390/rs12091446.
Kruczek, Z. (2011). Atrakcje turystyczne: fenomen, typologia, metody badań. Wydawnictwo „Proksenia”.
Kruczek Z. and Litwicka P. (2010). Ocena atrakcyjności turystycznej Muzeum Inżynierii Miejskiej w Krakowie,
[In:] Turystyka kulturowa a regiony turystyczne Polski, D. Orłowski, E. Puchnarewicz (red.), Wyższa
Szkoła Turystyki i Języków Obcych, Warszawa.
Lviv Underground, http://www.underlviv.com.ua/index-en.html, access: 10.07.2020.
Mango J.; Çolak E.; Li X. (2020). Web-based GIS for managing and promoting tourism in sub-Saharan Africa,
Current Issues in Tourism, https://doi.org/10.1080/13683500.2019.1711028.
Agnieszka BIEDA et al. / Acta Montanistica Slovaca, Volume 26 (2021), Number 2, 205-221
220
Maciuk K. and Lewińska P. (2019). High-rate monitoring of satellite clocks using two methods of averaging
time. Remote Sensing, 11, 2754, https://doi.org/10.3390/rs11232754.
Mikrut, S.; Papuci-Wladyka, E.; Strus, A.; Głowienka, E.; Puntos, J.K. (2017). The Use of Photogrammetry in
Archaeology and Multimedia Open-Air Performance in the Castle Square of Kato Paphos. [In:]
Proceedings of the 2017 Baltic Geodetic Congress (BGC Geomatics), Gdansk, Poland, 22–25 June 2017,
pp. 353–358, https://doi.org/10.1109/BGC-Geomatics.2018.00073.
Nazarena, B. and Roncella, R. (2019). HBIM for Conservation: A New Proposal for Information Modeling.
Remote Sensing, 11, 1751, https://doi.org/10.3390/rs11151751.
Owda, A.; Balsa-Barreiro, J.; Fritsch, D. (2018). Methodology for digital preservation of the cultural and
patrimonial heritage: Generation of a 3D model of the Church St. Peter and Paul (Calw, Germany) by
using laser scanning and digital photogrammetry. Sensor Review, vol. 38, no. 3, pp. 282-288,
https://doi.org/10.1108/SR-06-2017-0106.
Puniach E. and Kwartnik-Pruc A. (2018). The Use of Laser Scanning and Unmanned Aerial Vehicles in
Construction Surveying in the Light of Legal Regulations in Poland. Journal of Applied Engineering
Sciences, vol. 8 (21), issue 2/2018, art. no. 245, pp. 79-88, https://doi.org/10.2478/jaes-2018-0022.
Przewięźlikowska A. (2018). Principles of defining and recording data on structures permanently attached to
buildings and their influence on coherence of cadastral data on buildings in Poland. Reports on Geodesy
and Geoinformatics, vol. 105, iss. 1, pp. 43–51, https://doi.org/10.2478/rgg-2018-0005.
Przewięźlikowska A. (2020). Legal aspects of synchronising data on real property location in polish cadastre and
land and mortgage register, Land Use Policy, vol. 95, art. no. 104606,
https://doi.org/10.1016/j.landusepol.2020.104606.
Remondino, F. (2011). Heritage recording and 3D modeling with photogrammetry and 3D scanning. Remote
Sensing, 3, pp. 1104–1138, https://doi.org/10.3390/rs3061104.
Renigier-Biłozor M.; Źróbek S.; Walacik M.; Janowski M. (2020). Hybridisation of valuation procedures as a
medicine supporting the real estate market and sustainable land use development during the covid-19
pandemic and afterwards. Land Use Policy. Volume 99, December 2020, 105070
https://doi.org/10.1016/j.landusepol.2020.105070.
Salach, A.; Bakuła, K.; Pilarska, M.; Ostrowski, W.; Górski, K.; Kurczyński, Z. (2018). Accuracy Assessment of
Point Clouds from LiDAR and Dense Image Matching Acquired Using the UAV Platform for DTM
Creation. ISPRS International Journal of Geo-Information, vol. 7, issue 9, p. 342,
https://doi.org/10.3390/ijgi7090342.
Salach, A.; Markiewicz, J.S.; Zawieska, D. (2016). Integration of point clouds from terrestrial laser scanning and
image-based matching for generating high-resolution orthoimages. ISPRS – International Archives of the
Photogrammetry, Remote Sensing and Spatial Information Sciences, vol. XLI-B5, pp. 399–404,
https://doi.org/10.5194/isprs-archives-XLI-B5-399-2016..
Sung, W.; Davies, P.; Bolton, J. S. (2017). Results of a semantic differential test to evaluate HVAC&R
equipment noise. [In:] INTER-NOISE and NOISE-CON Congress and Conference Proceedings, vol. 255,
no. 5, pp. 2390-2398.
Szopińska, K. and Rącka, I. (2017). Wpływ hałasu na jakość przestrzeni publicznej w mieście (The impact of
noise on the quality of public space in a city). Prace Naukowe Uniwersytetu Ekonomicznego we
Wrocławiu – Research Papers of Wrocław University of Economics, No. 483, pp. 163-180,
https://doi.org/10.15611/pn.2017.483.13.
Thompson, R.; van Oosterom, P.; Cemellini, B.; de Vries, M. (2018). Developing an LADM Compliant
Dissemination and Visualization System for 3D Spatial Units. [In:] Proceedings of the 7th Land
Administration Domain Model Workshop, Zagreb, Croatia, 11–13 April 2018, pp. 103–124.
Tometzová, D.; Hlavňová, B.; Drevko, S.; Pukanská, K.; Bartoš, K.; Bieda, A.; Kseňak, Ľ. (2020). The
Development of Geotourism with the Use of 3D Digital Cave Model. A Case Study of the Bear Cave,
Slovakia. Geomatics and Environmental Engineering, vol. 14, no. 2, pp. 83-105.
https://doi.org/10.7494/geom.2020.14.2.83
Underground Tourist Route,
https://www.google.com/maps/contrib/107731584902808669290/photos/@50.0377408,22.0039893,17z/
data=!3m1!4b1!4m3!8m2!3m1!1e1, access: 10.07.2020.
Warchoł, A. (2013). Analiza dokładności przestrzennej danych z lotniczego, naziemnego i mobilnego skaningu
laserowego jako wstęp do ich integracji (Analysis of accuracy airborne, terrestrial and mobile laser
scanning data as an introduction to their integration). Archives of Photogrammetry, Cartography and
Remote Sensing, vol. 25, pp. 255–260.
Warchoł, A. (2015). Analysis of possibilities to registration TLS point clouds without targets on the example of
the castle bridge in Rzeszow. [In:] Proceedings of the 15th International Multidisciplinary Scientific
GeoConference SGEM, Albena, Bulgaria, 18–24 June 2015, vol. 1, pp. 737–742.
Agnieszka BIEDA et al. / Acta Montanistica Slovaca, Volume 26 (2021), Number 2, 205-221
221
Warchoł, A. (2019). The concept of LiDAR data quality assessment in the context of BIM modeling. ISPRS –
International Archives of the Photogrammetry, Remote Sensing and Spatial Information Sciences, vol.
XLII-1/W2, pp. 61–66, https://doi.org/10.5194/isprs-archives-XLII-1-W2-61-2019.
Warchoł, A.; Balawejder, M.; Banaś, M.; Matkowska, K.; Nalewajek, P.; Wysmulski, G. (2019). Measurement
and calculation of the volume of the heap located in Zastawie village in Poland. In Proceedings of the
18th edition National Technical-Scientific Conference Modern Technologies for the 3rd Millennium,
Oradea, Romania, 4–5 April 2019, pp. 85–90.
Warchoł, A. and Hejmanowska, B. (2011). Example of the assessment of data integration accuracy on the base
of airborne and terrestrial laser scanning. Archives of Photogrammetry, Cartography and Remote
Sensing, vol. 22, 411–421.
Warchoł, A.; Szwed, P.; Wężyk, P. (2016). Integracja technologii lotniczego, mobilnego i naziemnego
skanowania laserowego w procesie inwentaryzacji zieleni miejskiej wybranych fragmentów Krakowa
(Integration of technology of airborne, mobile and terrestrial laser scanning in the process of inventory
urban vegetation in selected parts of Kraków). [In:] Proceedings of the Summary conference of MONIT-
AIR Project, Krakow, Poland, 20 October 2016, pp. 67–80.
Warchoł, A. and Kret, M. (2020a). Virtual Walk through the Historic Underground of the Old Market in
Rzeszów. Available online: https://www.youtube.com/watch?v=G4p9WZy_yvQ, access: 24.07.2020.
Warchoł, A. and Kret, M. (2020b). Virtual Walk through the Historic Underground of the Old Town Hall in
Lviv Available online: https://www.youtube.com/watch?v=iTBa2UsbnTg&t=62s, access: 24.07.2020.
Vosselman, G. and Maas, H.-G. (2010). Airborne and Terrestrial Laser Scanning; CRC: Boca Raton, FL, USA,
2010.
Yang, X.; Koehl, M.; Grussenmeyer, P: (2018). Mesh-to-BIM: From segmented mesh elements to BIM model
with limited parameters. ISPRS – International Archives of the Photogrammetry, Remote Sensing and
Spatial Information Sciences, vol. XLII-2, pp. 1213–1218, , https://doi.org/10.5194/isprs-archives-XLII-
2-1213-2018.