47
Innovative waste management products European market survey Technology Review 147/2003 Christoph Genter
Innovativewaste management productsEuropean market survey
Technology Review 147/2003
Christoph Genter
Tekes• Innovative w
aste managem
ent prod
ucts – Europ
ean market survey
Technology Review
147
03
November 2003 ISSN 1239-758XISBN 952-457-139-0
National Technology AgencyKyllikinportti 2
P.O. Box 69, FIN-00101 Helsinki, FinlandTel. +358 105 2151, fax +358 9 694 9196
e-mail: [email protected]
Innovative waste management products – European market surveyTechnology Review 147/2003
For more information, please contact
Arto SilvennoinenTel. +358 15 535 5088
Helena ManninenTel. + 358 010 521 5888
Innovativewaste management products
European market survey
Christoph Genter
National Technology Agency
Technology Review 147/2003Helsinki 2003
Tekes – your contact for Finnish technology
Tekes, the National Technology Agency, is the main financing organisationfor applied and industrial R&D in Finland. Funding is granted from the statebudget.
Tekes’ primary objective is to promote the competitiveness of Finnish indus-try and the service sector by technological means. Activities are aimed at di-versifying production structures, increasing productivity and exports andcreating a foundation for employment and social well-being. Tekes financesapplied and industrial R&D in Finland to the extent of nearly 400 million eurosannually. The Tekes network in Finland and overseas offers excellent chan-nels for cooperation with Finnish companies, universities and research insti-tutes.
Technology programmes – part of the innovation chain
The technology programmes are an essential part of the Finnish innovationsystem. These programmes have proved to be an effective form of coopera-tion and networking for companies and the research sector for developinginnovative products and processes. Technology programmes promote de-velopment in specific sectors of technology or industry, and the results ofthe research work are passed on to business systematically. The pro-grammes also serve as excellent frameworks for international R&D coopera-tion. Currently, 35 extensive technology programmes are under way.
Copyright Tekes 2003. All rights reserved.
This publication includes materials protected under copyright law, thecopyright for which is held by Tekes or a third party. The materials appearingin publications may not be used for commercial purposes. The contents ofpublications are the opinion of the writers and do not represent the officialposition of Tekes. Tekes bears no responsibility for any possible damages
arising from their use. The original source must be mentioned when quotingfrom the materials.
ISSN 1239-758XISBN 952-457-139-0
Cover: Oddball GraphicsPage layot: DTPage Oy
Printers: Paino-Center Oy, 2003
Preface
The Streams Technology Programme (2001–2004) – Recycling Technologies and Waste Manage-ment – focuses on developing products and services for waste management and the recycling andreuse of waste materials. New, more advanced technology will be needed in order to fulfil the newand more stringent stipulations for waste management, recycling and reuse which now apply to theentire EU. Finnish industrial companies operating in the environmental sector could benefit fromdrawing on information and communications technology (ICT) and biotechnology in their tradi-tional waste management products. Consequently, the development of intelligent products forwaste management and reuse has been made one of the main objectives of the Streams TechnologyProgramme.
This report was commissioned by the Tekes Streams Technology Programme and written duringthe summer of 2003. The purpose of the report was to give an overview of the market potential ofFinnish intelligent waste management products within the European Union. The report was pro-duced by AMCG Unternehmensberatung GmbH International Management Consultants. Thework was supervised and monitored by the Streams Technology Programme management group.The members of the group were Juha Kaila, YTV (the Helsinki Metropolitan Area Council); AimoAalto, the Ministry of Trade and Industry; Osmo Bolander, Lassila&Tikanoja Plc; Keijo Hämä-läinen, Efirec Oy; Juhani Ilmola, SOK Corporation; Kari Kangas, Tanacorp Oy Ltd; Markku Salo,the Finnish Solid Waste Association; Matti Vehkalahti, the Ministry of the Environment; ArtoSilvennoinen, Consulting Engineers Paavo Ristola Ltd; Helena Manninen, Tekes and AskoVesanto, Tekes.
The report is intended for use by Finnish corporations in the waste management sector and for com-panies which may be able to adapt and develop their existing products for use in the waste manage-ment sector. The report gives an overview of the present situation in the waste management sectortogether with business opportunities in Europe.
Tekes wishes to express its warmest thanks to Christoph Genter and his team at AMCG GmbH.The management group of the Streams Technology Programme also deserves gratitude for creativeand constructive work supervision.
Helsinki, October 2003
Tekes – The National Technology Agency of Finland

Contact information
AMCG Unternehmensberatung GmbHInternational Management ConsultantsLandshuter Allee 45D-80637 Munich, GermanyPhone +49-89-130 757 0
Contact person
Christoph Genter, e-mail: [email protected]
Contents
Foreword
1 Objectives and content of the study . . . . . . . . . . . . . . . . . . . . . . . . . . . . . . . . . . . . . 1
2 Methodology and timing . . . . . . . . . . . . . . . . . . . . . . . . . . . . . . . . . . . . . . . . . . . . . . . 3
3 Waste management business in Europe – overview . . . . . . . . . . . . . . . . . . . . . . . . 5
4 Markets for intelligent waste management products and services – overview. . 13
5 Characterization of intelligent products and services . . . . . . . . . . . . . . . . . . . . . . 175.1 Waste prevention . . . . . . . . . . . . . . . . . . . . . . . . . . . . . . . . . . . . . . . . . . . . . . . . . . . . . . . . 17
5.2 Waste collection . . . . . . . . . . . . . . . . . . . . . . . . . . . . . . . . . . . . . . . . . . . . . . . . . . . . . . . . . 185.2.1 New collection trucks . . . . . . . . . . . . . . . . . . . . . . . . . . . . . . . . . . . . . . . . . . 185.2.2 Separation of collection and transport . . . . . . . . . . . . . . . . . . . . . . . . . . . . . . 205.2.3 Route planning and supervision . . . . . . . . . . . . . . . . . . . . . . . . . . . . . . . . . . . 225.2.4 Individual billing systems. . . . . . . . . . . . . . . . . . . . . . . . . . . . . . . . . . . . . . . . 245.2.5 Deposit automats for bottles/cans . . . . . . . . . . . . . . . . . . . . . . . . . . . . . . . . . 265.2.6 Suction systems . . . . . . . . . . . . . . . . . . . . . . . . . . . . . . . . . . . . . . . . . . . . . . 27
5.3 Waste handling. . . . . . . . . . . . . . . . . . . . . . . . . . . . . . . . . . . . . . . . . . . . . . . . . . . . . . . . . . 295.3.1 Automated sorting plants . . . . . . . . . . . . . . . . . . . . . . . . . . . . . . . . . . . . . . . 295.3.2 Electronic scrap handling and recycling . . . . . . . . . . . . . . . . . . . . . . . . . . . . . 30
5.4 Waste recycling . . . . . . . . . . . . . . . . . . . . . . . . . . . . . . . . . . . . . . . . . . . . . . . . . . . . . . . . . 335.4.1 Mechanical biological treatment. . . . . . . . . . . . . . . . . . . . . . . . . . . . . . . . . . . 335.4.2 Optimization of grate incinerators . . . . . . . . . . . . . . . . . . . . . . . . . . . . . . . . . 365.4.3 New incineration technologies . . . . . . . . . . . . . . . . . . . . . . . . . . . . . . . . . . . . 38
6 Attractive businesses for the Finnish waste industry . . . . . . . . . . . . . . . . . . . . . . 39
Tekes Technology Reviews. . . . . . . . . . . . . . . . . . . . . . . . . . . . . . . . . . . . . . . . . . . . . . . 41
1 Objectives and content of the study
The objective of this study is to identify attractive busi-nesses for the Finnish waste industry in the area of intelli-gent waste management products and services.The follow-ing topics are covered in detail by the study:
• The waste management service business in Europe
– an overview of the current business and its mainactors in Europe
• Current and future markets for intelligent waste manage-ment products and services
– including identification of these products/servicesand evaluation of the technologies, markets andsuppliers
• Selection of attractive businesses for the Finnish wasteindustry
– the selection is based on the competitiveness of theFinnish waste industry and on the attractiveness ofthe different businesses for intelligent products andservices.
Tekes has contracted AMCG to perform the analysis. Thestudy was conducted for the Finnish environmental indus-try as well as for other Finnish industries offering the re-quired products and services. The results should serveFinnish companies as a basis for the development of prod-uct and market strategies to allow them to enter these mar-kets for intelligent products and services in Europe.
The study examines intelligent waste management prod-ucts and services which are used for the prevention andtreatment of municipal solid waste (MSW). The goal of thestudy was to analyze the market volume and future potentialof these products within the European Union, i.e. in the cur-rent 15 EU member states as well as in the 10 new EU mem-ber states (as from 2004). Intelligent waste managementproducts and services are not a defined group of productsand/or services. In the course of this study, “intelligent prod-ucts/services” means
• innovative concepts for waste prevention or wastetreatment,
• consisting of one or many different products and/orservices,
• creating benefits for the customer in terms of costs,quality, etc.
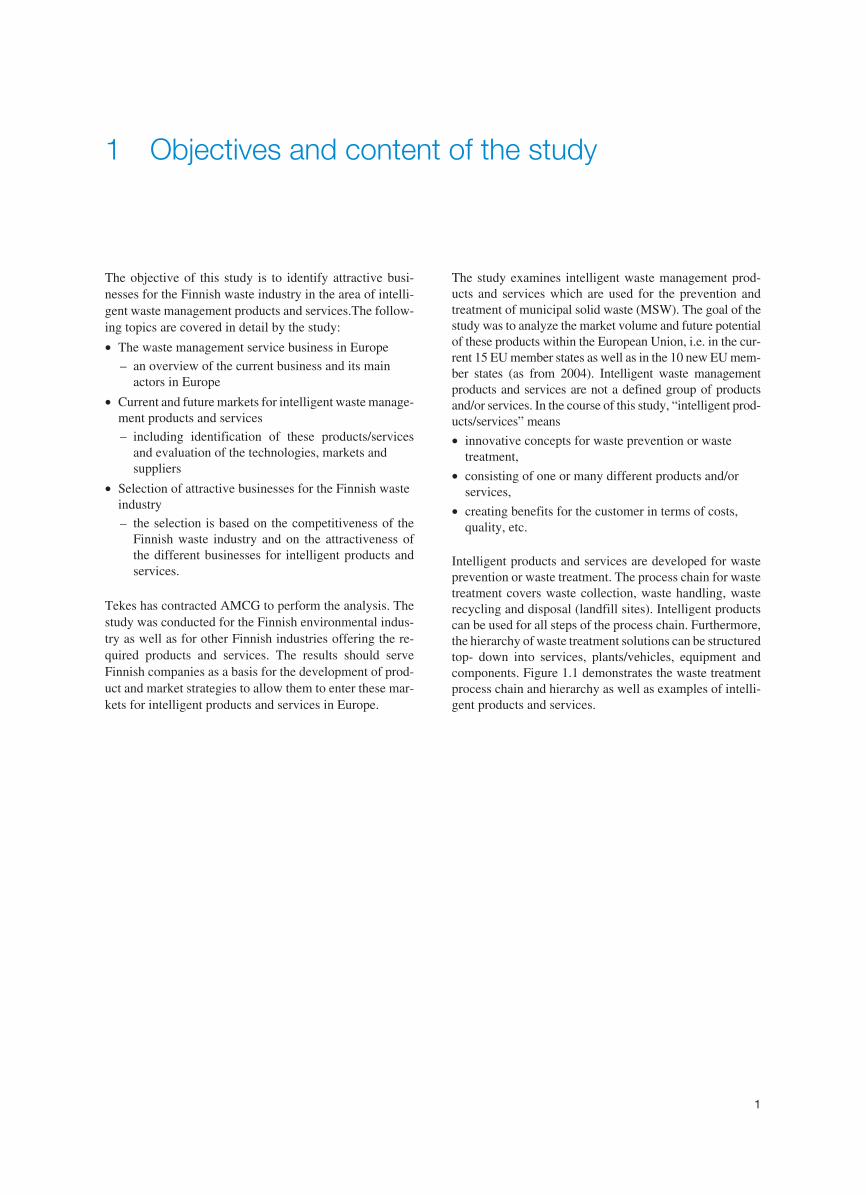
Intelligent products and services are developed for wasteprevention or waste treatment. The process chain for wastetreatment covers waste collection, waste handling, wasterecycling and disposal (landfill sites). Intelligent productscan be used for all steps of the process chain. Furthermore,the hierarchy of waste treatment solutions can be structuredtop- down into services, plants/vehicles, equipment andcomponents. Figure 1.1 demonstrates the waste treatmentprocess chain and hierarchy as well as examples of intelli-gent products and services.
1
2
Collection services, BOT*, BOO**
Incineration plants,garbage collection trucks
Engines, pipelines,sensors
Shredders,control units,analyzers
Products, services (examples)
New services
New types of plants,new vehicles
New materials,sensor
technologies,ICT
New equipment,measurement and
identificationtechnologies
Intelligent products/services (examples )
Wastecollection
Wastehandling
Wasterecycling
Landfill sites
Process chain
* BOT – build, operate, transfer **BOO – build, own, operate
Components
Equipment
Plants, vehicles
Services
Figure 1.1. Waste treatment: Hierarchy and process chain.
2 Methodology and timing
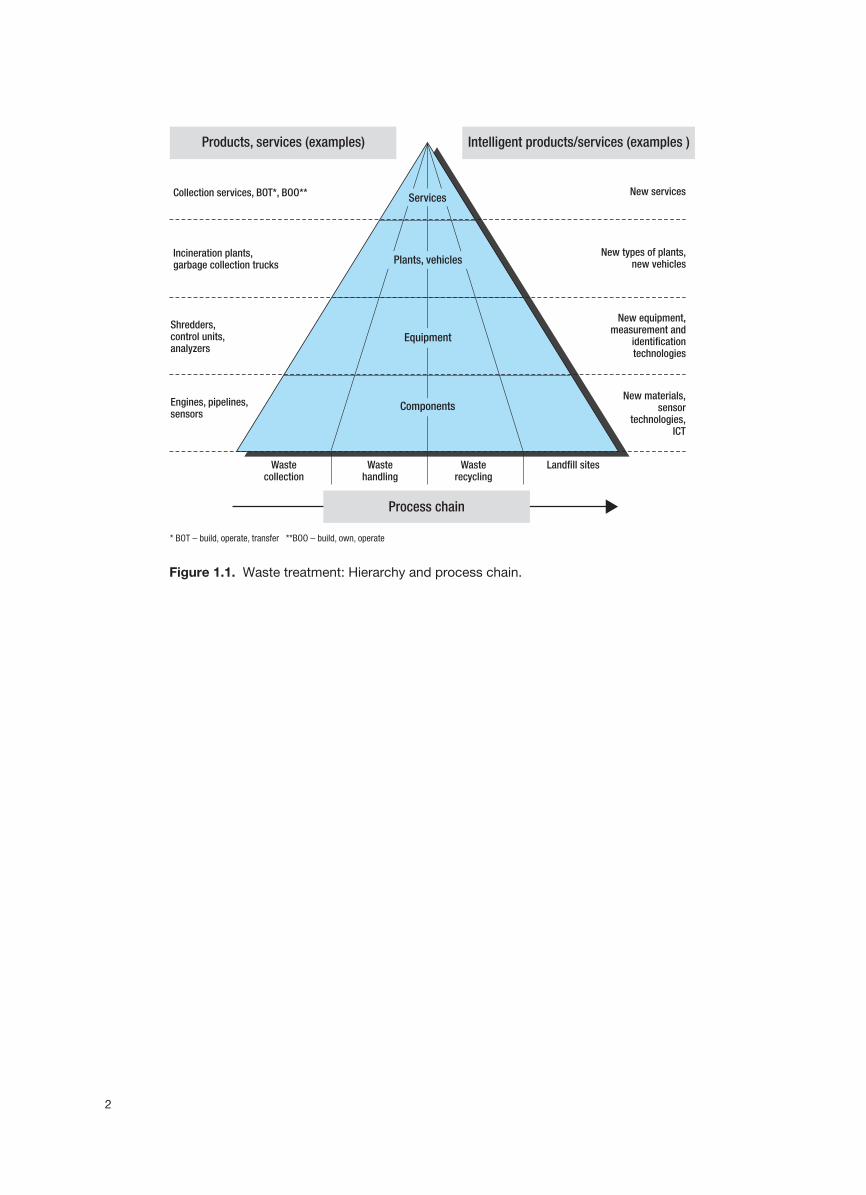
A top-down approach was chosen for the execution of thestudy. First, the innovative concepts for waste preventionand waste treatment, as well as its products and services,were identified. Second, the identified innovative conceptswere evaluated relative to their status within the productlife cycle, their current market volume and market growthfor the coming years. Based on these data, a ranking of at-tractive markets in terms of market volume and growth waselaborated. Third, innovative concepts were investigated,i.e. the competitive situation in the different markets. Thisevaluation made possible the selection and ranking of at-tractive businesses. Attractive business means a marketwith high market volume and medium/high market growth(or a market with medium market volume and high marketgrowth) on the one hand and a market with low/mediumcompetitive pressure on the other.
Finally, attractive businesses for the Finnish waste industrywere selected. For this evaluation, the basis was the above-
selected attractive businesses, as well as the competitive-ness of the Finnish waste industry. AMCG used differentsources to compile a list of Finnish waste industry compa-nies. The product portfolio of these companies was ana-lyzed and investigation was carried out into how each prod-uct portfolio fit into the identified innovative concepts. Inaddition, this issue was discussed with the ManagementGroup and the Program Manager of the Streams pro-gramme in two meetings in Helsinki. Last, but not least, forthe evaluation of the Finnish waste industry, AMCG wasable to use the results of studies carried out in the past forthe environmental industry in Finland. The methodologicalapproach of the study is shown in Fig. 2.1.
For the purposes of the study it was necessary to collectqualitative and quantitative data. This was achieved bydesk research and field research. The latter involved inter-views with companies and experts in the European wasteindustry. For desk research, data were gathered from
3
Innovative and treatmentconcepts for waste prevention
●
●
Market volume
Market growth 2003 - 2008
● Competitive situation
1.
2.
3.
● Competitiveness of theFinnish waste industry
Attractive businesses forthe Finnish waste industry
Attractive businesses
Attractive markets
Figure 2.1. Methodological approach of the study.
sources such as statistics, waste magazines, product bro-chures, annual reports of waste industry companies and da-tabases. In addition, AMCG used the results and experi-ence from numerous studies that were carried out in thepast for the European environmental industry.
The majority of the data were collected through interviewswith companies and experts. AMCG conducted in total 65interviews in Europe. For the identification and evaluationof innovative concepts this issue was discussed with• 23 of the 30 leading waste management service compa-
nies in Europe• 8 public and private organizations of the European waste
industry.
The waste management service companies are the majorusers and clients for waste management products and ser-vices, and also for innovative concepts. Therefore, the fol-lowing topics were discussed with these companies:• What are the main problems with currently used prod-
ucts and services in terms of quality and costs?• Which types of innovative concepts will be used and/or
would be necessary in the future?• What are the main investments the companies will
makein subsequent years?
Furthermore, interviews were conducted with public andprivate organizations in Europe to identify innovative con-cepts; these included Ministries for Environment, environ-mental protection agencies, associations for waste, glass,and plastic recycling and research organizations for envi-ronmental technologies.
The second round of interviews was conducted with com-panies who offer or use the identified innovative concepts.In total, interviews were held with 33 companies in order toevaluate the market and competitive situation for theseconcepts.
The data collected by desk and field research were sub-jected to a plausibility check and finally the required resultswere elaborated according to the methodology describedabove. The study was performed from May to August 2003in close cooperation with the Management Group and theProgram Manager of the Streams programme. The kick-offmeeting for the study took place in mid-May in Helsinki.The interim results were presented and discussed inmid-June and the final results were presented and dis-cussed at the end of August in Helsinki.
4
3 Waste management business in Europe– overview
This chapter covers an overview of the waste managementbusiness in Europe. The value chain for waste manage-ment, waste quantities and waste treatment technologies,market volume for waste management products and ser-vices, major players as well as trends in the industry are de-scribed.
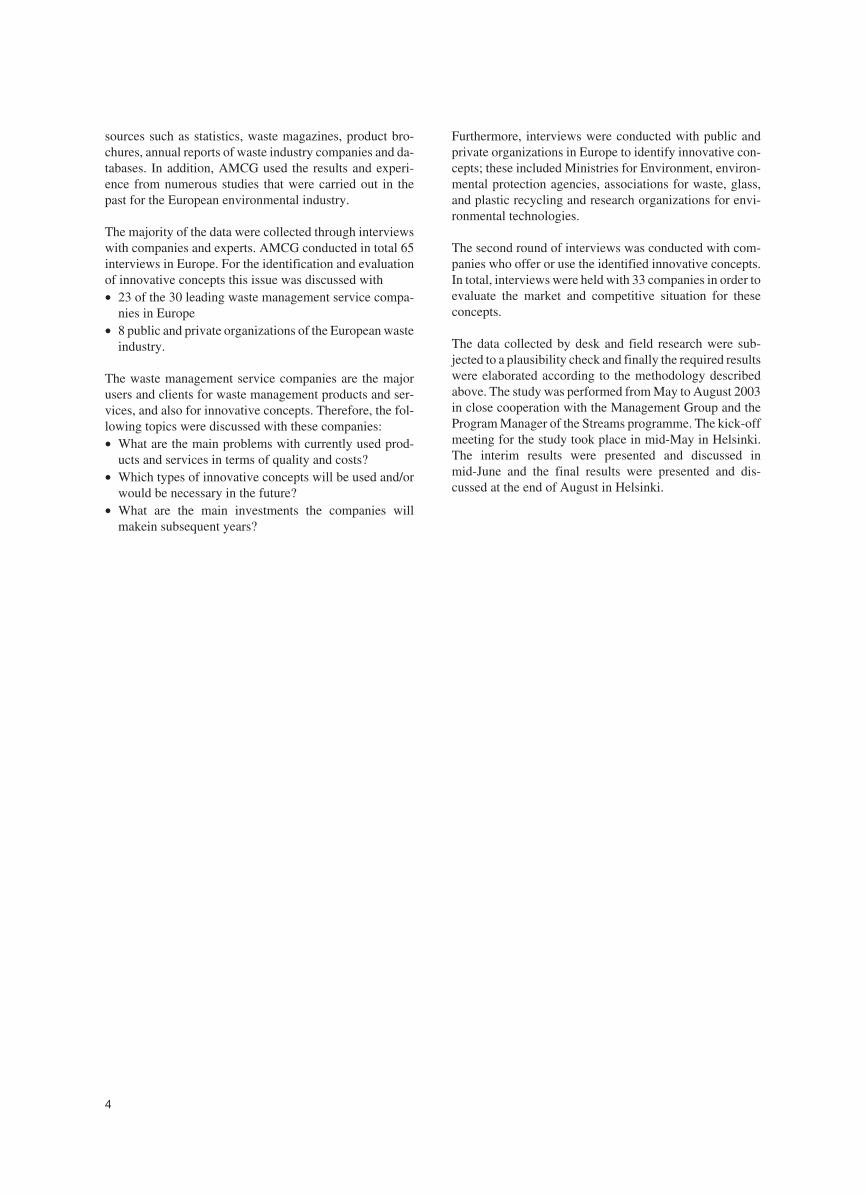
Value chain for waste management
The value chain for waste management covers varioussteps from analysis and consulting to after-sales productsand services. The first steps in the value chain are analysisand consulting/engineering, i.e. “problems” are recog-nized, problem-solving alternatives are developed and themost promising solutions are selected. The next step is typ-ically to invest in measures such as collection trucks, col-lection and handling systems and treatment plants. This in-cludes, more specifically, manufacturing and/or procure-ment of components and equipment, the assembly of plants
and systems as well as the commissioning of plants. Aftercommissioning, the plants or systems (for collection, han-dling, recycling and disposal of waste) are operated bypublic institutions and/or private companies. Finally, af-ter-sales products and services are necessary for the contin-ued and optimized operation of plants and systems. Thevalue chain is shown in Fig. 3.1.
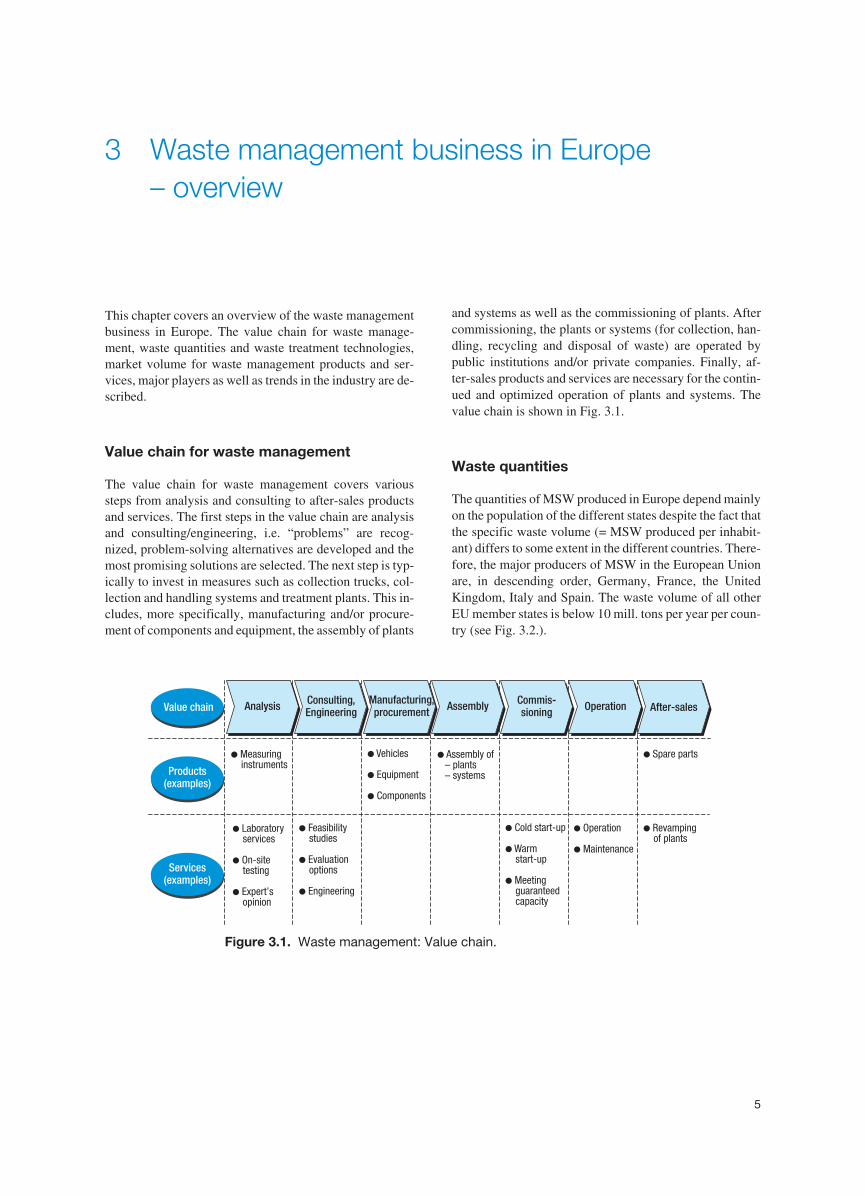
Waste quantities
The quantities of MSW produced in Europe depend mainlyon the population of the different states despite the fact thatthe specific waste volume (= MSW produced per inhabit-ant) differs to some extent in the different countries. There-fore, the major producers of MSW in the European Unionare, in descending order, Germany, France, the UnitedKingdom, Italy and Spain. The waste volume of all otherEU member states is below 10 mill. tons per year per coun-try (see Fig. 3.2.).
5
Value chainManufacturing,procurementAnalysis Consulting,
Engineering Assembly Commis-sioning Operation After-sales
● Measuringinstruments
●
●
●
quipment
Components
Vehicles
E
● of– plants– systems
Assembly ● partsSpare
Products(examples)
●
●
●
Laboratoryservices
On-sitetesting
Expert’sopinion
●
●
●
studies
Evaluationoptions
Engineering
Feasibility ●
●
●
Cold start-up
Warmstart-up
Meetingguaranteedcapacity
●
● Maintenance
Operation
Services(examples)
●
plantsRevampingof
Figure 3.1. Waste management: Value chain.
Poland is, due to its large population, the major producer ofMSW in the new EU member states followed by Hungaryand the Czech Republic. The waste quantities of MSW in
the other new European member states are much lower (seeFig. 3.3.).
6
Countries
5,300
Austr
ia
Belgium
Denmark
Finlan
dFra
nce
German
y
Greece
Irelan
dIta
ly
Luxe
mbourg
Netherl
ands
Portu
gal
Spain
Swed
en UK
5,5003,100 2,500
37,800
44,000
3,9001,900
27,000
200
9,400
4,400
24,500
4,000
30,000
0
10 000
20 000
30 000
40 000
50 000
Waste quantities(1,000 tpy)
Figure 3.2. European Union: MSW – municipal solid waste quantities (source: latest availabledata from EUROSTAT).
400 600 (e) 150 (e)
3,400
600
4,400
1,300 1,0001,700
12,300
0
10 000
20 000
Slova
kia
Polan
dMalt
a
Lithu
ania
Latvi
a
Hunga
ry
Eston
ia
Czech
Repub
lic
Cyprus
Slove
niaCountries
Waste quantities(1,000 tpy)
Figure 3.3. New European Union member states: MSW – municipal solid waste quantities(source: latest available data from EUROSTAT).
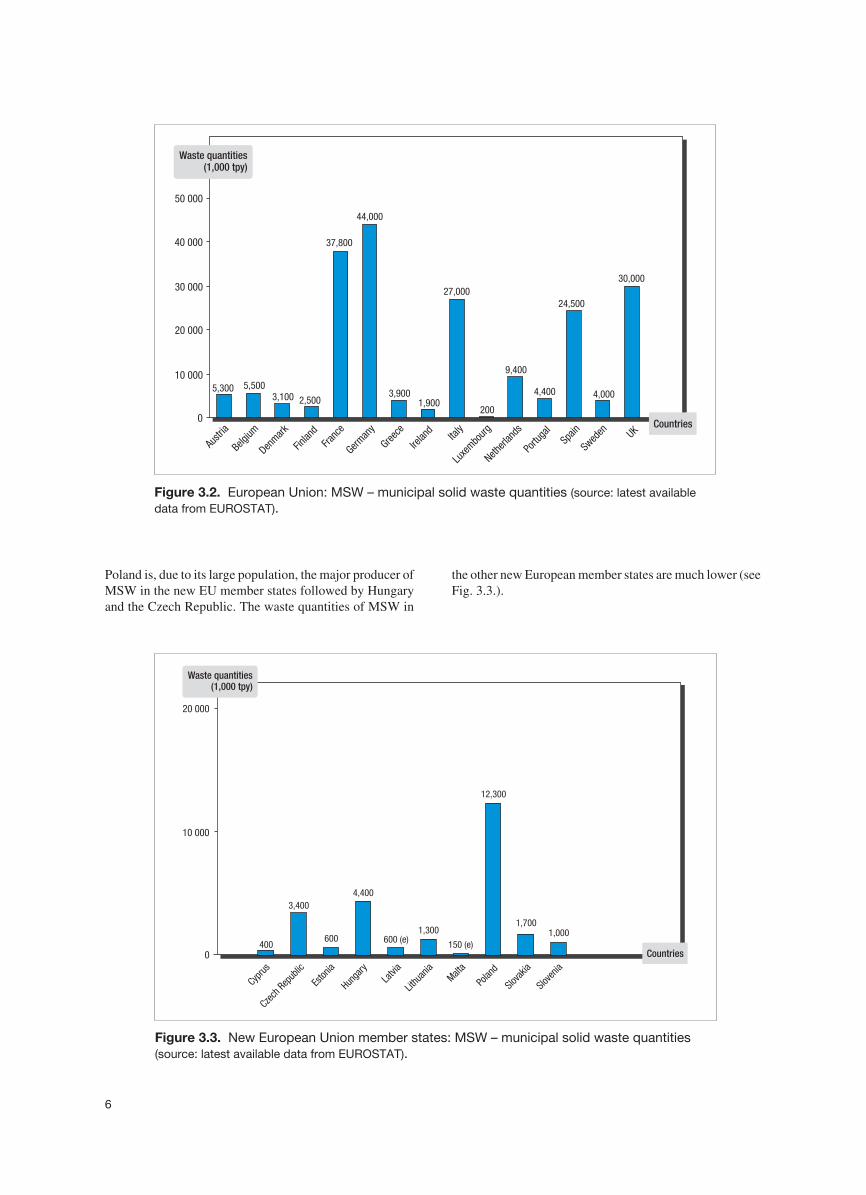
Waste treatment technologies
Three options exist for waste treatment – material recy-cling, thermal recycling (= incineration) and disposal inlandfill sites. The environmental policy in the EuropeanUnion and its member states aims to increase the level ofrecycling of MSW. Currently, the disposal of MSW inlandfill sites is still the predominant treatment technologyused in the majority of the EU member states. The leadersin terms of material and thermal recycling are Austria, Bel-gium, Scandinavia (Denmark, Sweden), Germany and theNetherlands.
The waste treatment technologies used in the EU memberstates are shown in Fig. 3.4. It has to be mentioned thatthese are the latest available data derived from EURO-STAT, so the data for many countries are not for 2002/03but refer to the year 1999/2000.
So far, disposal of MSW in landfill sites is the predominanttreatment technology used in the new EU member states. Inmany cases, the landfill sites in use do not yet havestate-of-the-art equipment. Therefore, heavy investmentshave already been made in these countries and are also nec-essary for new landfill sites as well as for recycling mea-sures in the future. The treatment technologies in use areshown in Fig. 3.5.
Market volume for waste managementproducts and service
The market volume for waste management services is de-termined by the sales revenues of the public organizationsand private companies providing these services. The mar-ket volume for waste management products is determinedby the sales revenues of companies supplying plants, vehi-cles, equipment and components.
Waste management services for collection, handling, recy-cling and disposal of MSW are provided by private compa-nies and public organizations (e.g. municipalities, associa-tions of municipalities). The sales revenues of these com-panies and organizations amount to approx. 57 bill. EUR(2002) in Europe with the majority (= 55 bill. EUR) beingearned in the EU member states and so far just a small part(= 2 bill. EUR) in the new EU member states.
To provide the above-mentioned services these companiesand organizations have to invest in plants, vehicles, equip-ment and components. These investments reflect the mar-ket volume for waste management products. The invest-ment rate amounts to 10–15%, i.e. the service companiesand organizations invest approx. 10–15% of their annualrevenues in waste management products. Therefore, themarket volume for waste management products in Europe
7
Material recycling
Thermal recycling(incineration)
Landfill sites
Share of treatmenttechnology (%)
3527
13
6558
34
92 8978
50
13
82
65
22
8016
1852
27
23
50
42
9
9
38
4855
35
15
43
8 11 15
45
9
2640
13
7 7
5
30
0
20
40
60
80
100
Countries
%
Austr
ia
Belgium
Denmark
Finlan
dFra
nce
German
y
Greece
Irelan
dIta
ly
Luxe
mbourg
Netherl
ands
Portu
gal
Spain
Swed
en UK
Figure 3.4. European Union: Waste treatment technologies (source: latest available data fromEUROSTAT).
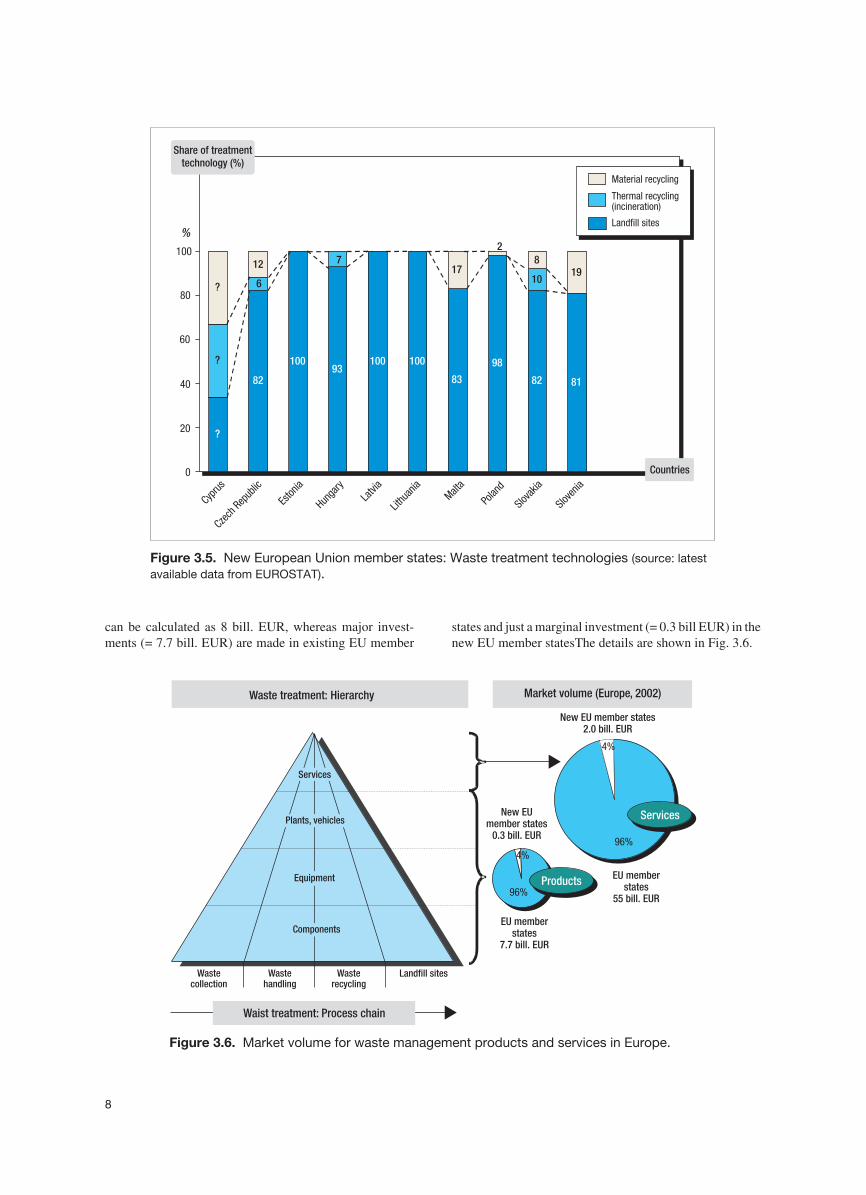
can be calculated as 8 bill. EUR, whereas major invest-ments (= 7.7 bill. EUR) are made in existing EU member
states and just a marginal investment (= 0.3 bill EUR) in thenew EU member statesThe details are shown in Fig. 3.6.
8
Czech
Repub
lic
10093
100
82 81
1019
?
100 98
82 83
?
7
6?
812 17
2
0
20
40
60
80
100
Material recycling
Thermal recycling(incineration)
Landfill sites
Countries
%
Share of treatmenttechnology (%)
Slova
kia
Polan
dMalt
a
Lithu
ania
Latvi
a
Hunga
ry
Eston
ia
Cyprus
Slove
nia
Figure 3.5. New European Union member states: Waste treatment technologies (source: latestavailable data from EUROSTAT).
96%
4%
96%
4%
96%
4%
96%
4%
Waste treatment: Hierarchy Market volume (Europe, 2002)
New EU member states2.0 bill. EUR
New EUmember states
0.3 bill. EUR
EU memberstates
55 bill. EUR
EU memberstates
7.7 bill. EUR
ProductsProducts
ServicesServices
Equipment
Plants, vehicles
Services
Components
Wastecollection
Wastehandling
Wasterecycling
Landfill sites
Waist treatment: Process chain
Figure 3.6. Market volume for waste management products and services in Europe.
The market for waste management services in the EUmember states is structured in more detail as follows.
The total market for waste management services amountsto approx. 110 bill. EUR in the EU, whereas the marketvolume is split 50/50 between services for MSW and ser-vices for industrial waste.
The services for MSW are provided by public organiza-tions as well as private companies. The degree of privatiza-tion, i.e. the market share of the private companies, differsin the various member states. In total, it is estimated thatthe market for MSW services is split equally between pub-lic organizations and private companies.
The market volume according to the process chain of wastetreatment is structured as follows:• Approx. 50% of total revenues come from collection
services (= 27.5 bill. EUR)• Approx. 50% of total revenues come from handling, re-
cycling and landfill site services (= 27.5 bill. EUR).
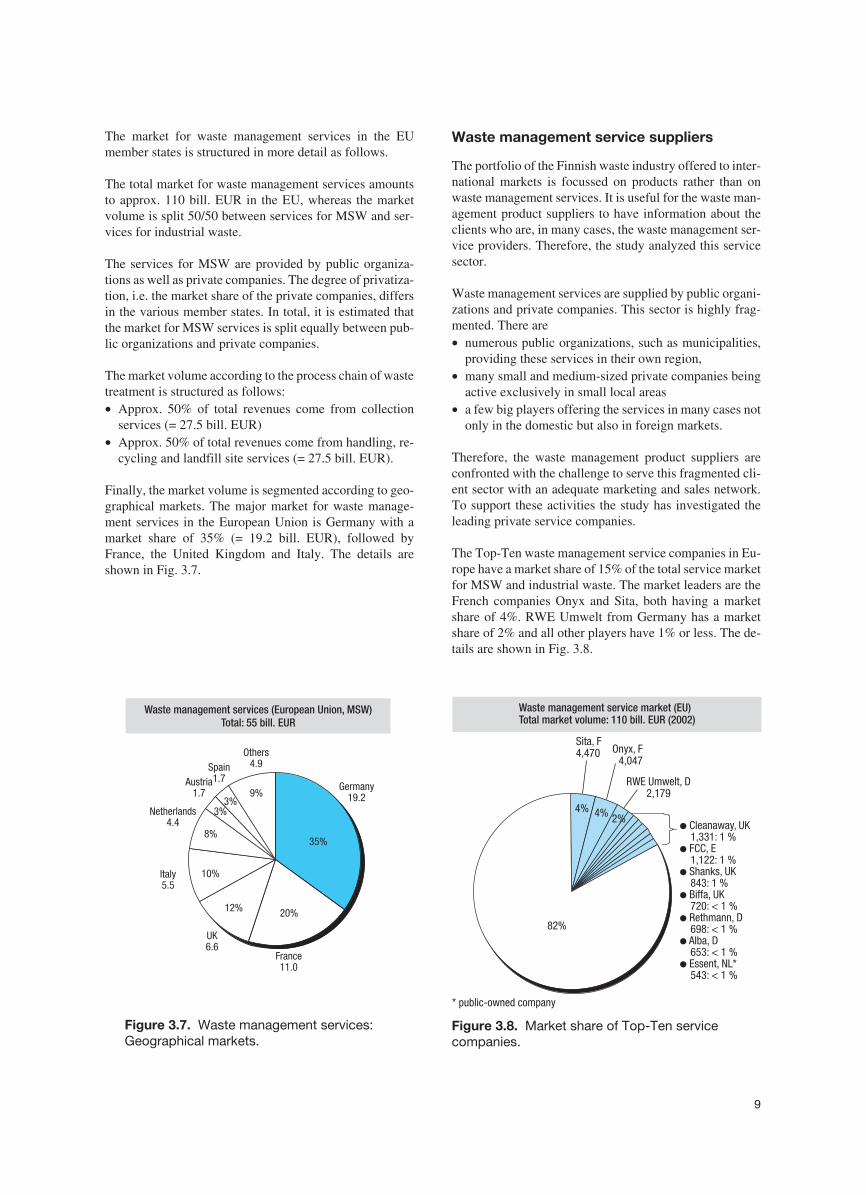
Finally, the market volume is segmented according to geo-graphical markets. The major market for waste manage-ment services in the European Union is Germany with amarket share of 35% (= 19.2 bill. EUR), followed byFrance, the United Kingdom and Italy. The details areshown in Fig. 3.7.
Waste management service suppliers
The portfolio of the Finnish waste industry offered to inter-national markets is focussed on products rather than onwaste management services. It is useful for the waste man-agement product suppliers to have information about theclients who are, in many cases, the waste management ser-vice providers. Therefore, the study analyzed this servicesector.
Waste management services are supplied by public organi-zations and private companies. This sector is highly frag-mented. There are• numerous public organizations, such as municipalities,
providing these services in their own region,• many small and medium-sized private companies being
active exclusively in small local areas• a few big players offering the services in many cases not
only in the domestic but also in foreign markets.
Therefore, the waste management product suppliers areconfronted with the challenge to serve this fragmented cli-ent sector with an adequate marketing and sales network.To support these activities the study has investigated theleading private service companies.
The Top-Ten waste management service companies in Eu-rope have a market share of 15% of the total service marketfor MSW and industrial waste. The market leaders are theFrench companies Onyx and Sita, both having a marketshare of 4%. RWE Umwelt from Germany has a marketshare of 2% and all other players have 1% or less. The de-tails are shown in Fig. 3.8.
9
9%
3%3%
10%
8%35%
20%12%
Germany19.2
France11.0
UK6.6
Italy5.5
Netherlands4.4
Austria1.7
Spain1.7
Others4.9
Waste management services (European Union, MSW)Total: 55 bill. EUR
Figure 3.7. Waste management services:Geographical markets.
Waste management service market (EU)Total market volume: 110 bill. EUR (2002)
Sita, F4,470
82%82%
4% 4% 2%
Onyx, F4,047
RWE Umwelt, D2,179
● Cleanaway, UK1,331: 1 %FCC, E1,122: 1 %Shanks, UK843: 1 %Biffa, UK720: < 1 %Rethmann, D698: < 1 %Alba, D653: < 1 %Essent, NL*543: < 1 %
●
●
●
●
●
●
* companypublic-owned
Figure 3.8. Market share of Top-Ten servicecompanies.
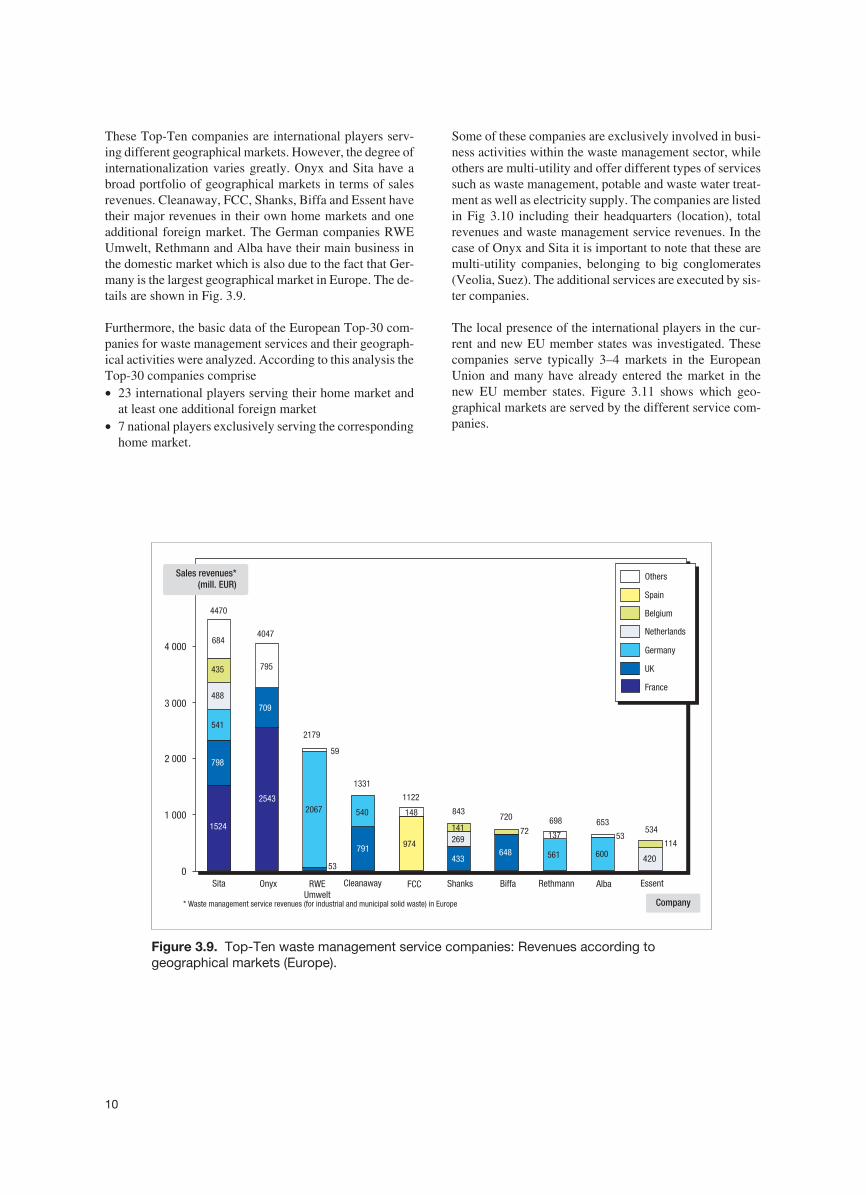
These Top-Ten companies are international players serv-ing different geographical markets. However, the degree ofinternationalization varies greatly. Onyx and Sita have abroad portfolio of geographical markets in terms of salesrevenues. Cleanaway, FCC, Shanks, Biffa and Essent havetheir major revenues in their own home markets and oneadditional foreign market. The German companies RWEUmwelt, Rethmann and Alba have their main business inthe domestic market which is also due to the fact that Ger-many is the largest geographical market in Europe. The de-tails are shown in Fig. 3.9.
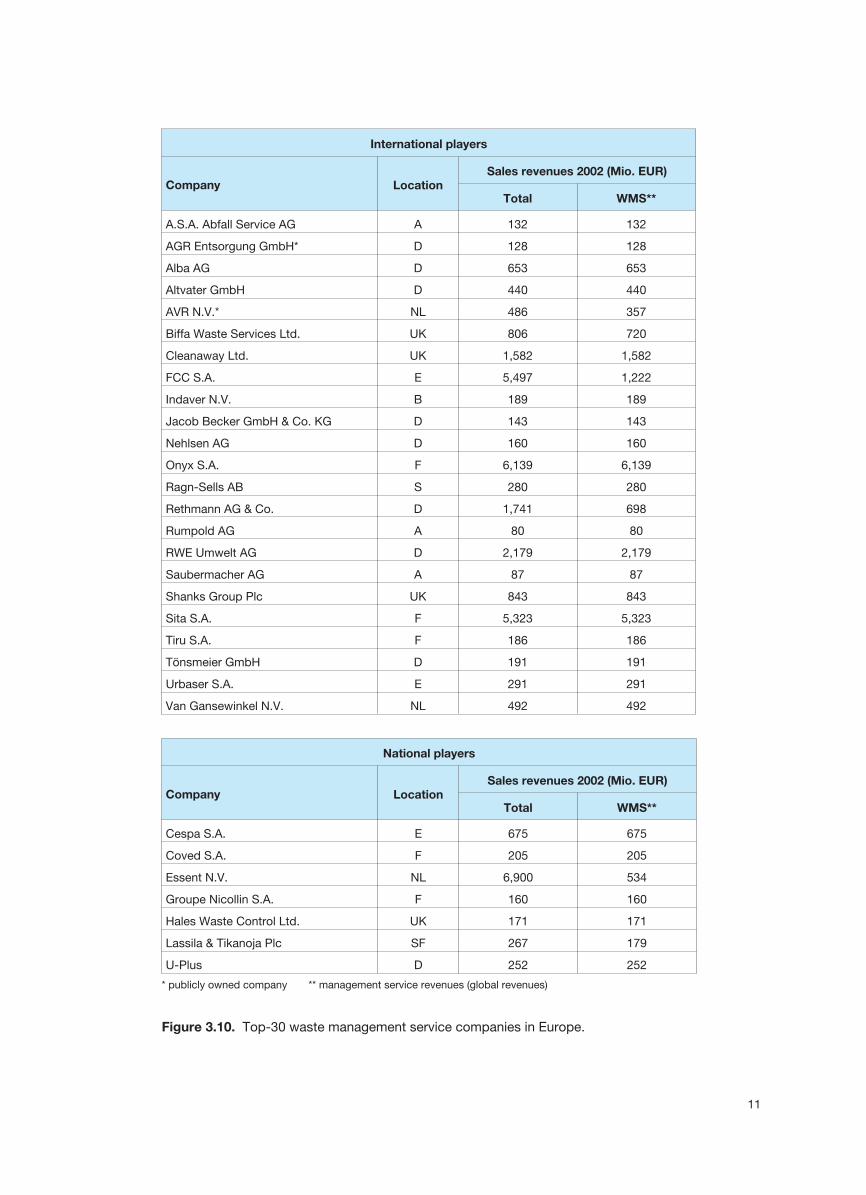
Furthermore, the basic data of the European Top-30 com-panies for waste management services and their geograph-ical activities were analyzed. According to this analysis theTop-30 companies comprise• 23 international players serving their home market and
at least one additional foreign market• 7 national players exclusively serving the corresponding
home market.
Some of these companies are exclusively involved in busi-ness activities within the waste management sector, whileothers are multi-utility and offer different types of servicessuch as waste management, potable and waste water treat-ment as well as electricity supply. The companies are listedin Fig 3.10 including their headquarters (location), totalrevenues and waste management service revenues. In thecase of Onyx and Sita it is important to note that these aremulti-utility companies, belonging to big conglomerates(Veolia, Suez). The additional services are executed by sis-ter companies.
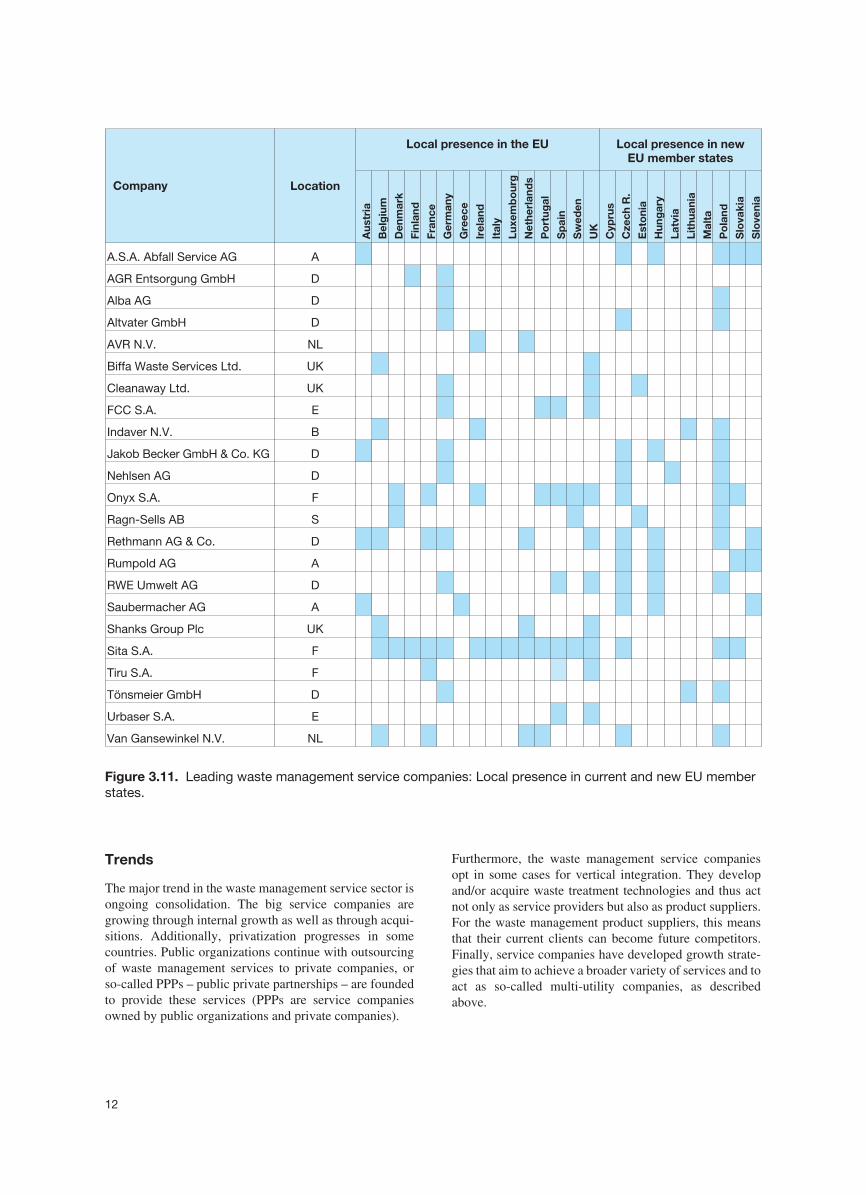
The local presence of the international players in the cur-rent and new EU member states was investigated. Thesecompanies serve typically 3–4 markets in the EuropeanUnion and many have already entered the market in thenew EU member states. Figure 3.11 shows which geo-graphical markets are served by the different service com-panies.
10
1524
2543
798
791433
648
541
2067 540
600
488
420
974
684
795
709
53561
269 114
435
141 72 137
148
53
59
0
1 000
2 000
3 000
4 000
5 000
* management service revenues (for industrial and municipal solid waste) in EuropeWaste
Sales revenues*(mill. EUR)
Belgium
Germany
UK
France
Spain
Netherlands
Others
4470
4047
2179
1122
843698720
1331
653534
Company
Sita Onyx RWEUmwelt
Cleanaway FCC Shanks EssentRethmannBiffa Alba
Figure 3.9. Top-Ten waste management service companies: Revenues according togeographical markets (Europe).
11
International players
Company LocationSales revenues 2002 (Mio. EUR)
Total WMS**
A.S.A. Abfall Service AG A 132 132
AGR Entsorgung GmbH* D 128 128
Alba AG D 653 653
Altvater GmbH D 440 440
AVR N.V.* NL 486 357
Biffa Waste Services Ltd. UK 806 720
Cleanaway Ltd. UK 1,582 1,582
FCC S.A. E 5,497 1,222
Indaver N.V. B 189 189
Jacob Becker GmbH & Co. KG D 143 143
Nehlsen AG D 160 160
Onyx S.A. F 6,139 6,139
Ragn-Sells AB S 280 280
Rethmann AG & Co. D 1,741 698
Rumpold AG A 80 80
RWE Umwelt AG D 2,179 2,179
Saubermacher AG A 87 87
Shanks Group Plc UK 843 843
Sita S.A. F 5,323 5,323
Tiru S.A. F 186 186
Tönsmeier GmbH D 191 191
Urbaser S.A. E 291 291
Van Gansewinkel N.V. NL 492 492
Figure 3.10. Top-30 waste management service companies in Europe.
National players
Company LocationSales revenues 2002 (Mio. EUR)
Total WMS**
Cespa S.A. E 675 675
Coved S.A. F 205 205
Essent N.V. NL 6,900 534
Groupe Nicollin S.A. F 160 160
Hales Waste Control Ltd. UK 171 171
Lassila & Tikanoja Plc SF 267 179
U-Plus D 252 252
* publicly owned company ** management service revenues (global revenues)
Trends
The major trend in the waste management service sector isongoing consolidation. The big service companies aregrowing through internal growth as well as through acqui-sitions. Additionally, privatization progresses in somecountries. Public organizations continue with outsourcingof waste management services to private companies, orso-called PPPs – public private partnerships – are foundedto provide these services (PPPs are service companiesowned by public organizations and private companies).
Furthermore, the waste management service companiesopt in some cases for vertical integration. They developand/or acquire waste treatment technologies and thus actnot only as service providers but also as product suppliers.For the waste management product suppliers, this meansthat their current clients can become future competitors.Finally, service companies have developed growth strate-gies that aim to achieve a broader variety of services and toact as so-called multi-utility companies, as describedabove.
12
Company Location
Local presence in the EU Local presence in newEU member states
Aus
tria
Bel
giu
m
Den
mar
k
Finl
and
Fran
ce
Ger
man
y
Gre
ece
Irel
and
Ital
y
Luxe
mb
our
g
Net
herl
and
s
Po
rtug
al
Sp
ain
Sw
eden
UK
Cyp
rus
Cze
chR
.
Est
oni
a
Hun
gar
y
Latv
ia
Lith
uani
a
Mal
ta
Po
land
Slo
vaki
a
Slo
veni
a
A.S.A. Abfall Service AG A
AGR Entsorgung GmbH D
Alba AG D
Altvater GmbH D
AVR N.V. NL
Biffa Waste Services Ltd. UK
Cleanaway Ltd. UK
FCC S.A. E
Indaver N.V. B
Jakob Becker GmbH & Co. KG D
Nehlsen AG D
Onyx S.A. F
Ragn-Sells AB S
Rethmann AG & Co. D
Rumpold AG A
RWE Umwelt AG D
Saubermacher AG A
Shanks Group Plc UK
Sita S.A. F
Tiru S.A. F
Tönsmeier GmbH D
Urbaser S.A. E
Van Gansewinkel N.V. NL
Figure 3.11. Leading waste management service companies: Local presence in current and new EU memberstates.
4 Markets for intelligent waste managementproducts and services – overview
This chapter gives an overview of the drivers for innova-tive concepts as well as the identified innovative conceptsand attractivity in terms of the market and competitive situ-ation. The details of the individual concepts are describedin Chapter 5.
Driving forces for innovative concepts
Based on the findings of this study, it can be said that envi-ronmental rules and their implementation are still the majordrivers for the development of new markets and innovativeconcepts for waste management products and services. Ad-ditionally, cost savings and quality improvements play animportant role.
Currently, the markets for mechanical biological treatmentplants, as well as for electronic scrap handling and recy-cling, are pushed by new rules of the European Union andits member states. However, the implementation of theserules differs a great deal in the various EU member states.While in some countries a market for these products al-ready exists it is not clear yet for other countries when amarket will arise.
In many EU member states, the citizens are confrontedwith steadily increasing fees for waste management overmany years. It is becoming apparent that people will nolonger accept the present price developments; therefore,waste management service providers have to look for newsolutions with lower costs. In general, cost savings can beachieved by automation of logistics and processes as wellas new solutions for collection, handling, recycling anddisposal of waste. Additionally, cost savings can beachieved through the optimization of the organizations andthe organizational processes of waste management serviceproviders.
Finally, quality improvements of products and services arealso an important driver. Examples are suction systems andautomated sorting plants. At present, waste collection is
achieved in most cases by storing waste in bins and collect-ing the bins through collection trucks. In some countries,vacuum piping systems for waste collection in office build-ings, shopping centres and residential areas have been in-troduced; these systems offer easier-to-handle systems forthe customers. Furthermore, there are ongoing discussions(e.g. in Germany) about substitution of the current complexcollection system consisting of different bins for differentwaste fractions with a new collection system with one bin(for all waste fractions) and automated sorting plants forthe waste fractions.
Innovative concepts
On the basis of the methodology used 11 innovative con-cepts consisting of different products and services havebeen identified. According to the process chain these are asfollows:• Waste prevention
– Biodegradable materials• Waste collection
– New collection trucks– Separation of collection and transport– Route planning and supervision– Individual billing systems– Deposit automats for bottles/cans– Suction systems
• Waste handling– Automated sorting plants– Electronic scrap handling and recycling
• Waste recycling– Mechanical biological treatment– Optimization of grate incinerators– New incineration technologies.
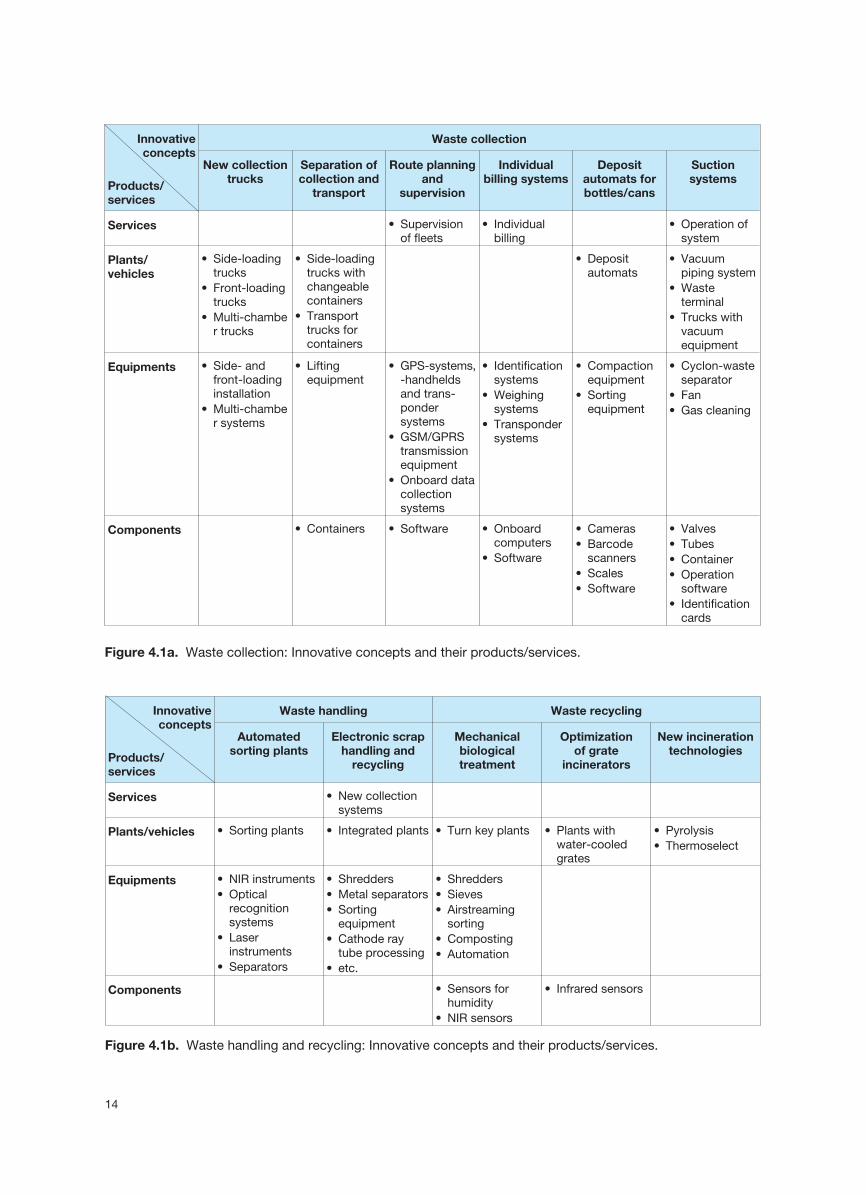
These innovative concepts cover a broad variety of prod-ucts and services which are shown according to individualconcepts in Fig. 4.1a for waste collection and in Fig. 4.1bfor waste handling and recycling.
13
14
Innovativeconcepts
Products/services
Waste collection
New collectiontrucks
Separation ofcollection and
transport
Route planningand
supervision
Individualbilling systems
Depositautomats forbottles/cans
Suctionsystems
Services • Supervisionof fleets
• Individualbilling
• Operation ofsystem
Plants/vehicles
• Side-loadingtrucks
• Front-loadingtrucks
• Multi-chamber trucks
• Side-loadingtrucks withchangeablecontainers
• Transporttrucks forcontainers
• Depositautomats
• Vacuumpiping system
• Wasteterminal
• Trucks withvacuumequipment
Equipments • Side- andfront-loadinginstallation
• Multi-chamber systems
• Liftingequipment
• GPS-systems,-handheldsand trans-pondersystems
• GSM/GPRStransmissionequipment
• Onboard datacollectionsystems
• Identificationsystems
• Weighingsystems
• Transpondersystems
• Compactionequipment
• Sortingequipment
• Cyclon-wasteseparator
• Fan• Gas cleaning
Components • Containers • Software • Onboardcomputers
• Software
• Cameras• Barcode
scanners• Scales• Software
• Valves• Tubes• Container• Operation
software• Identification
cards
Figure 4.1a. Waste collection: Innovative concepts and their products/services.
Innovativeconcepts
Products/services
Waste handling Waste recycling
Automatedsorting plants
Electronic scraphandling and
recycling
Mechanicalbiologicaltreatment
Optimizationof grate
incinerators
New incinerationtechnologies
Services • New collectionsystems
Plants/vehicles • Sorting plants • Integrated plants • Turn key plants • Plants withwater-cooledgrates
• Pyrolysis• Thermoselect
Equipments • NIR instruments• Optical
recognitionsystems
• Laserinstruments
• Separators
• Shredders• Metal separators• Sorting
equipment• Cathode ray
tube processing• etc.
• Shredders• Sieves• Airstreaming
sorting• Composting• Automation
Components • Sensors forhumidity
• NIR sensors
• Infrared sensors
Figure 4.1b. Waste handling and recycling: Innovative concepts and their products/services.
The following clarifications are necessary in relation to thelist of identified innovative concepts in order to avoid mis-understandings.
New and innovative concepts for waste prevention andminimization are mainly developed by the product/wasteproducers (e.g. chemical, packaging, mobile phone indus-try) and not by the waste industry. Due to the fact that thisstudy is focussing on opportunities for the Finnish wasteindustry, waste prevention can be ignored. Furthermore, itis necessary for the waste management service sector –consisting of public organizations and private companies –to increase its efficiency by investments in information andcommunication technology (ICT). However, ICT is not aproduct of the waste industry, therefore, this market wasnot investigated independently.
In conclusion, further innovative concepts may exist but,due to the chosen methodological approach, it can be as-sumed that this study covers all of the important innovativeconcepts in terms of market volume.
Attractive markets
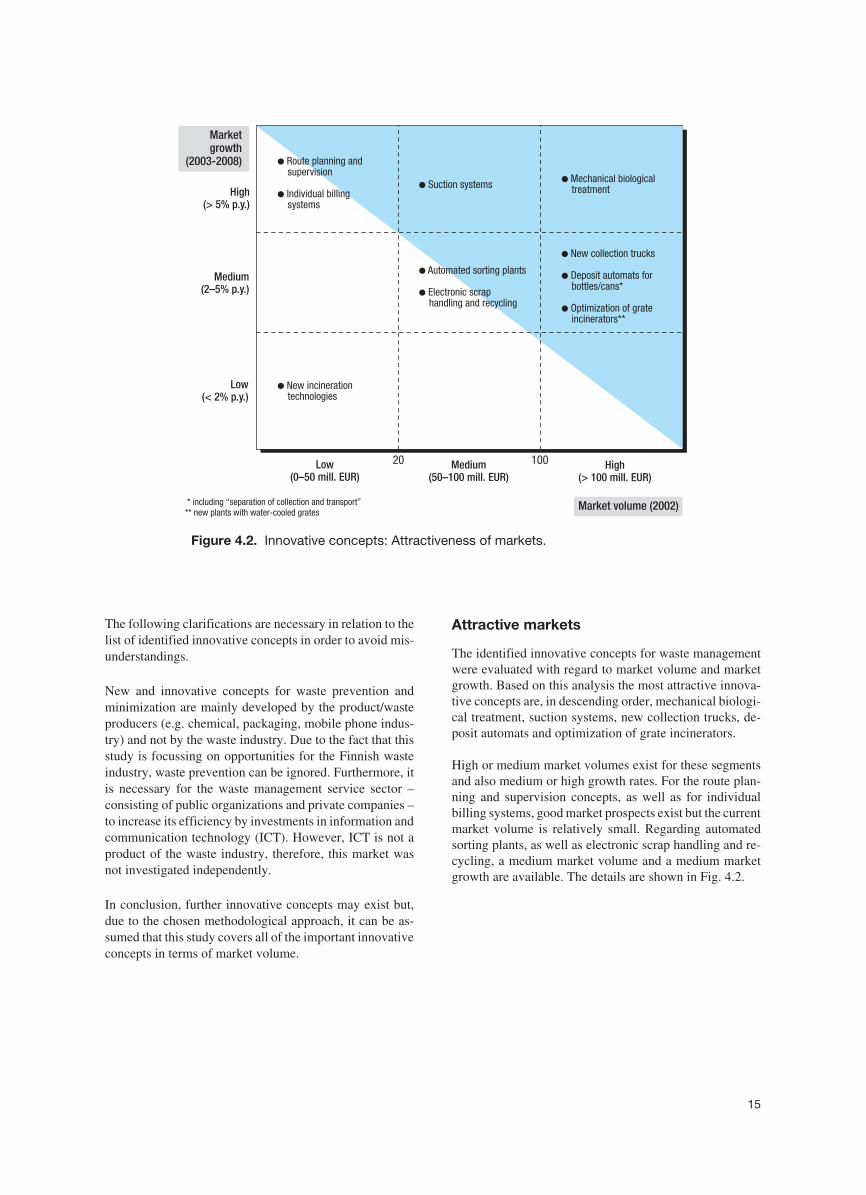
The identified innovative concepts for waste managementwere evaluated with regard to market volume and marketgrowth. Based on this analysis the most attractive innova-tive concepts are, in descending order, mechanical biologi-cal treatment, suction systems, new collection trucks, de-posit automats and optimization of grate incinerators.
High or medium market volumes exist for these segmentsand also medium or high growth rates. For the route plan-ning and supervision concepts, as well as for individualbilling systems, good market prospects exist but the currentmarket volume is relatively small. Regarding automatedsorting plants, as well as electronic scrap handling and re-cycling, a medium market volume and a medium marketgrowth are available. The details are shown in Fig. 4.2.
15
* including “separation of collection and transport”** new plants with water-cooled grates
Market volume (2002)
High(> 5% p.y.)
Medium(2–5% p.y.)
Low(< 2% p.y.)
Low(0–50 mill. EUR)
High(> 100 mill. EUR)
Marketgrowth
(2003-2008)
●
technologiesNew incineration
Medium(50–100 mill. EUR)
20 100
●
●
●
New collection trucks
Deposit automats forbottles/cans*
Optimization of grateincinerators**
● biologicaltreatmentMechanical
●
●
Route planning andsupervision
Individual billingsystems
●
●
plants
Electronic scraphandling and recycling
Automated sorting
● Suction systems
Figure 4.2. Innovative concepts: Attractiveness of markets.
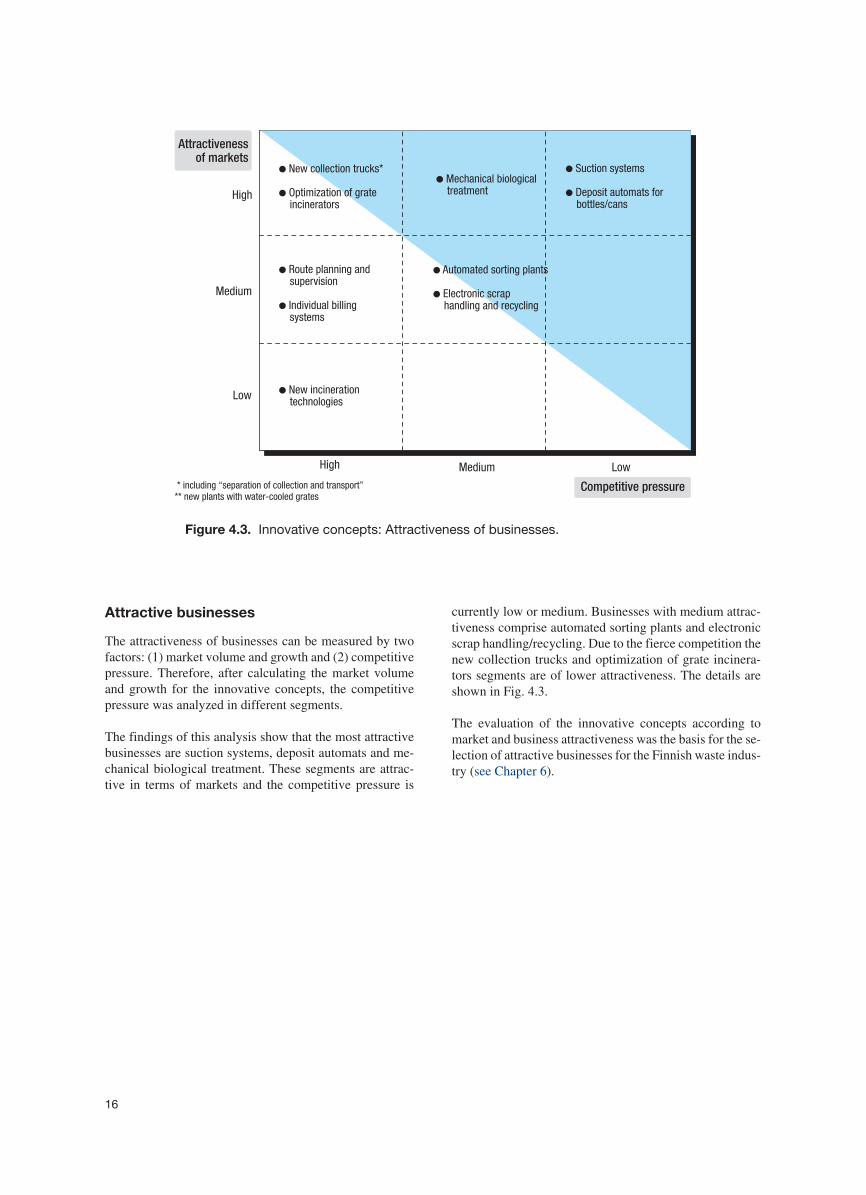
Attractive businesses
The attractiveness of businesses can be measured by twofactors: (1) market volume and growth and (2) competitivepressure. Therefore, after calculating the market volumeand growth for the innovative concepts, the competitivepressure was analyzed in different segments.
The findings of this analysis show that the most attractivebusinesses are suction systems, deposit automats and me-chanical biological treatment. These segments are attrac-tive in terms of markets and the competitive pressure is
currently low or medium. Businesses with medium attrac-tiveness comprise automated sorting plants and electronicscrap handling/recycling. Due to the fierce competition thenew collection trucks and optimization of grate incinera-tors segments are of lower attractiveness. The details areshown in Fig. 4.3.
The evaluation of the innovative concepts according tomarket and business attractiveness was the basis for the se-lection of attractive businesses for the Finnish waste indus-try (see Chapter 6).
16
High
High
Medium
Low
Medium Low
Attractivenessof markets
Competitive pressure
● tiontechnologiesNew incinera
●
● Deposit automats forbottles/cans
Suction systems●
treatmentMechanical biological
●
●
supervision
Individual billingsystems
Route planning and ●
●
plants
Electronic scraphandling and recycling
Automated sorting
●
●
trucks*
Optimization of grateincinerators
New collection
* including “separation of collection and transport”** new plants with water-cooled grates
Figure 4.3. Innovative concepts: Attractiveness of businesses.
5 Characterization of intelligent productsand services
5.1 Waste prevention
Introduction
Waste prevention means to avoid or minimize the produc-tion of waste and is a more favourable solution than wastetreatment. Waste prevention is possible to a certain extentbut it is not possible to avoid waste production altogether.
In general, measures for waste prevention are developedand executed by the waste producing industries (e.g. thechemical, packaging and electronics industry). These mea-sures lead, for example, to the development and use ofpackaging materials that are biodegradable or have a re-duced weight/volume or they lead to the reuse of productsin the electronics industry. However, the waste industry isnot normally involved in the development of waste preven-tion solutions. Therefore, the study does not focus on thisissue but investigates biodegradable materials as an exam-ple of waste prevention.
Biodegradable materials
An objective of the development and use of biodegradablematerials is to quantify the availability of products that canbe easily recycled through composting or anaerobic degra-dation. An additional advantage of these products is thatthe consumption of petroleum can be reduced because con-ventional products which are substituted by biodegradableproducts are mostly made from plastics (which are madefrom petroleum).
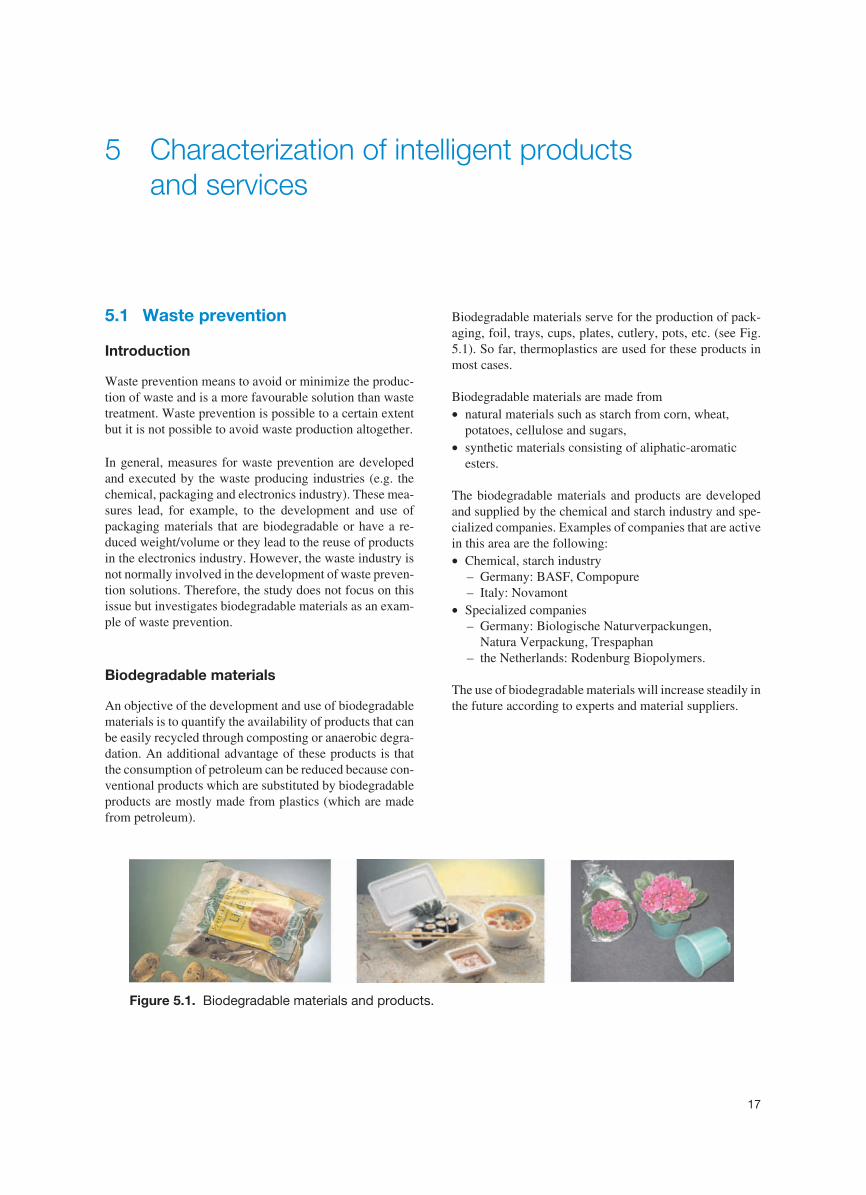
Biodegradable materials serve for the production of pack-aging, foil, trays, cups, plates, cutlery, pots, etc. (see Fig.5.1). So far, thermoplastics are used for these products inmost cases.
Biodegradable materials are made from• natural materials such as starch from corn, wheat,
potatoes, cellulose and sugars,• synthetic materials consisting of aliphatic-aromatic
esters.
The biodegradable materials and products are developedand supplied by the chemical and starch industry and spe-cialized companies. Examples of companies that are activein this area are the following:• Chemical, starch industry
– Germany: BASF, Compopure– Italy: Novamont
• Specialized companies– Germany: Biologische Naturverpackungen,
Natura Verpackung, Trespaphan– the Netherlands: Rodenburg Biopolymers.
The use of biodegradable materials will increase steadily inthe future according to experts and material suppliers.
17
Figure 5.1. Biodegradable materials and products.
5.2 Waste collection
5.2.1 New collection trucks
Introduction
The vast majority of private households in Europe collectand sort waste in bins. In some instances, one bin is usedfor all types of waste, whereas in others various bins areused for different waste fractions, for example paper,biowaste and residual waste.
Traditionally, these bins are collected by rear-loadingtrucks with a single chamber/container. This type of collec-tion truck requires at least two workers: one of them has todrive the truck, and the other one collects and empties thebins. There is often more than one worker employed in theactual collection process, depending on the individual col-lection situation (corresponding to the number of bins, thedistance from truck to bins, etc.).
With rear-loading trucks, each bin is placed manually on alifter at the rear end of the truck by the collection worker.The bin is lifted by the lifting equipment and emptied intothe truck‘s container. This process is controlled by theworker employing control units. The emptied bins have tobe put back on the sidewalk.
Using traditional rear-loading trucks for the collection ofMSW leads to high costs for two main reasons:
• High personnel costsFor the collection of MSW with rear-loading trucks atleast two, but often more, persons are needed per truck.
• Manifold collection runsIn general, rear-loading collection trucks have onechamber/container. Therefore, with one run, only onewaste fraction can be collected. In cases where differentwaste fractions (in different bins) are collected by theprivate households, double or threefold collection runsare necessary. This is time consuming and creates highcosts.
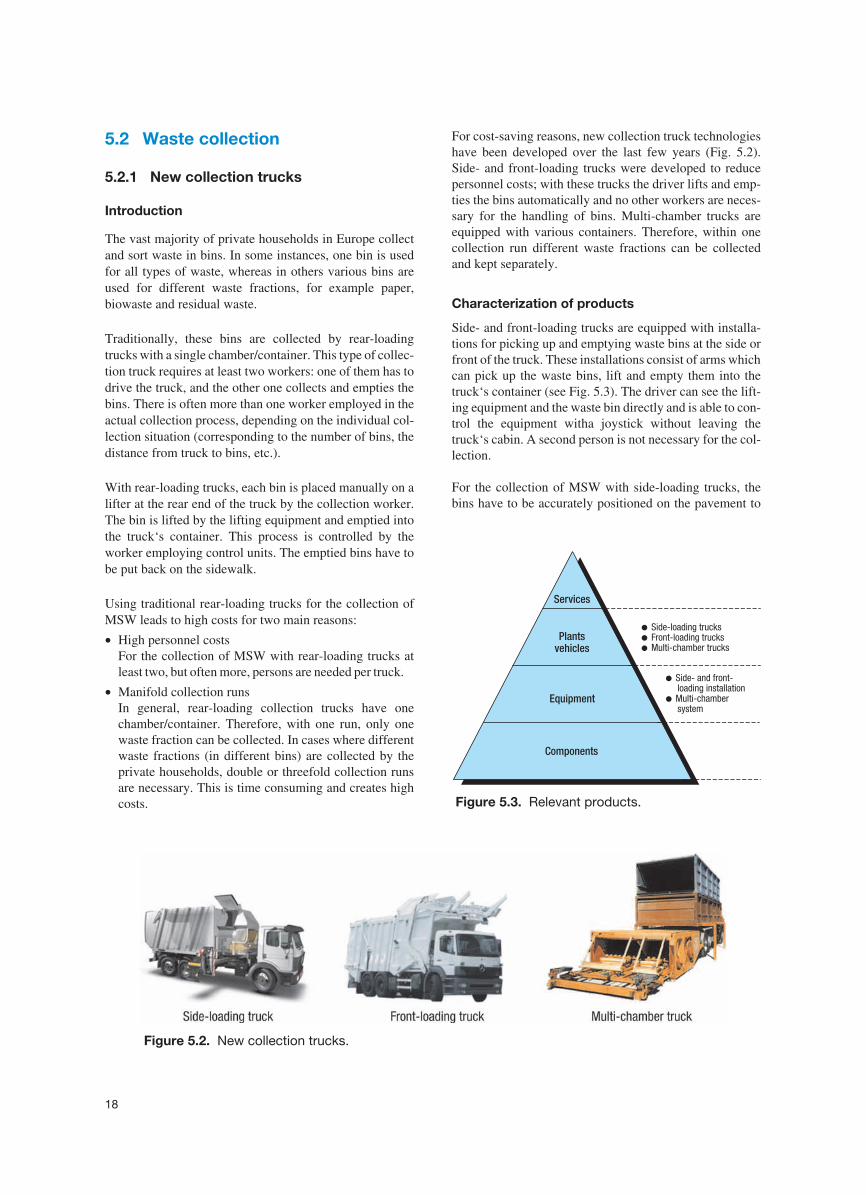
For cost-saving reasons, new collection truck technologieshave been developed over the last few years (Fig. 5.2).Side- and front-loading trucks were developed to reducepersonnel costs; with these trucks the driver lifts and emp-ties the bins automatically and no other workers are neces-sary for the handling of bins. Multi-chamber trucks areequipped with various containers. Therefore, within onecollection run different waste fractions can be collectedand kept separately.
Characterization of products
Side- and front-loading trucks are equipped with installa-tions for picking up and emptying waste bins at the side orfront of the truck. These installations consist of arms whichcan pick up the waste bins, lift and empty them into thetruck‘s container (see Fig. 5.3). The driver can see the lift-ing equipment and the waste bin directly and is able to con-trol the equipment witha joystick without leaving thetruck‘s cabin. A second person is not necessary for the col-lection.
For the collection of MSW with side-loading trucks, thebins have to be accurately positioned on the pavement to
18
Figure 5.2. New collection trucks.
Equipment
Services
Plantsvehicles
Components
●
●
●
Side-loading trucksFront-loading trucksMulti-chamber trucks
● - and front-loading installationMulti-chambersystem
Side
●
Figure 5.3. Relevant products.
enable the grabbing of the bin by the truck‘s arm. Thewaste bin is picked up, lifted and emptied sideways.
With front-loading trucks, the bins are picked up from thefront of the truck, lifted over the driver‘s cabin and emptiedinto the truck‘s container from above.
Multi-chamber trucks are equipped with two, three or fourseparate containers for separate waste fractions. For liftingand emptying of the waste bins, special lifters are usedwhich enable the filling of waste fractions in the respectivewaste containers. In this way the number of collection runsfor different waste fractions can be reduced.
Pros and cons
Side- and front-loading trucks offer personnel cost sav-ings compared to conventional rear-loading trucks becauseone person is able to empty the bins.
On the other hand there are higher investment costs fortrucks equipped with these technologies. The average pricelevel is as follows:• Side-loading truck: 220,000 EUR• Front-loading truck: 180,000 EUR• Rear-loading truck: 140,000 EUR
Additionally, the usefulness of these trucks can be some-what limited, especially in cities, due to problems that oc-cur when bins are not properly positioned for collection orwhen they are blocked by parked cars.
According to leading waste management companies, theside-loading truck is used mainly in rural areas and in citieswith an infrastructure well suited for this technology. Fur-thermore, major truck manufacturers predict that theside-loading truck will not be able to completely replacethe rear-loading truck in cities.
In general, according to major waste service companies,front-loading trucks are not used for municipal solid wastebut for industrial and specific commercial waste.
Multi-chamber trucks offer cost savings due to reducedcollection costs which result from a reduced number of col-lection runs.
On the other hand these types of trucks have major disad-vantages. Problems are caused by the different specificweights of the waste fractions when chambers are arrangedvertically.
The major problem is the low overall filling degree of thechambers due to the different volumes of waste fractionswhich cannot be predicted or calculated precisely in ad-vance. As a result, the truck has to stop the collection runwhen one of the chambers is full. Therefore, the theoreticaladvantage is lost in many cases.
We can conclude that multi-chamber trucks will not beused in the future due to these disadvantages. According toleading waste management service companiesmulti-chamber trucks do not have any future in the MSWcollection business.
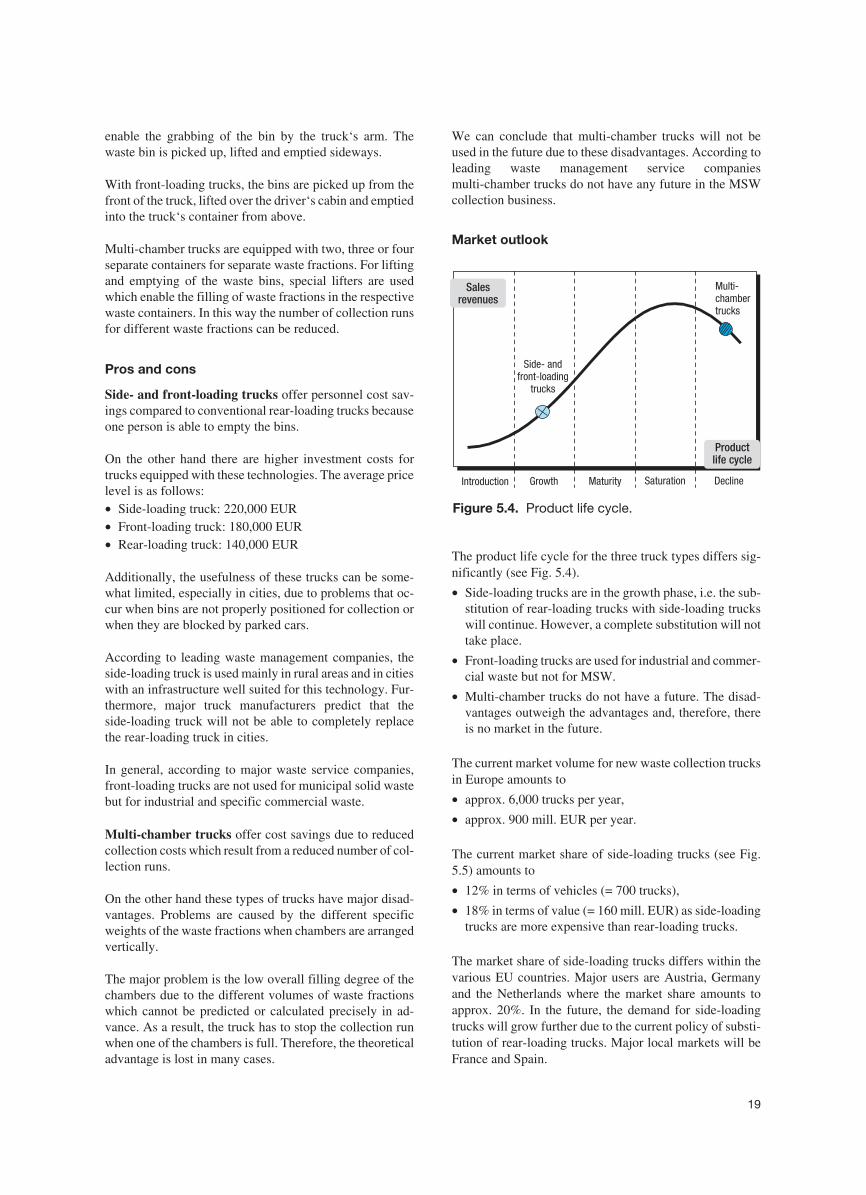
Market outlook
The product life cycle for the three truck types differs sig-nificantly (see Fig. 5.4).
• Side-loading trucks are in the growth phase, i.e. the sub-stitution of rear-loading trucks with side-loading truckswill continue. However, a complete substitution will nottake place.
• Front-loading trucks are used for industrial and commer-cial waste but not for MSW.
• Multi-chamber trucks do not have a future. The disad-vantages outweigh the advantages and, therefore, thereis no market in the future.
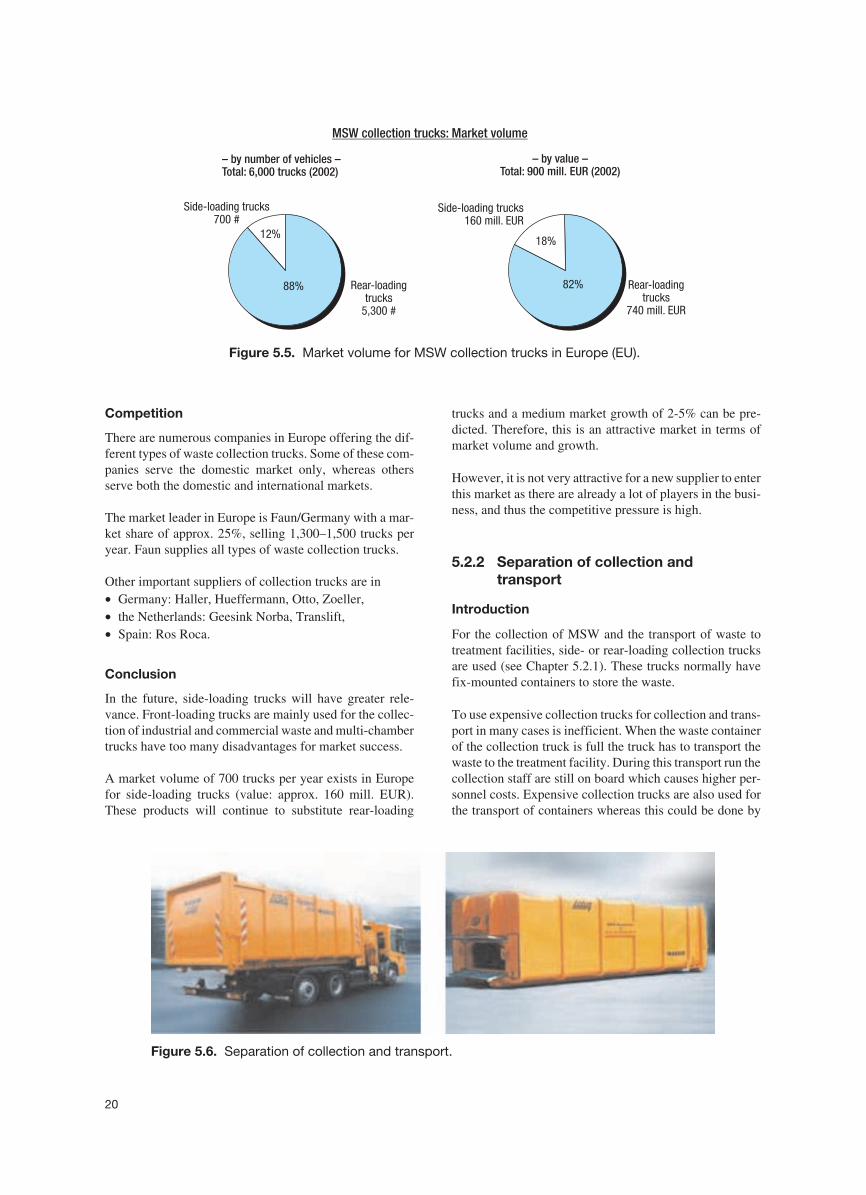
The current market volume for new waste collection trucksin Europe amounts to
• approx. 6,000 trucks per year,
• approx. 900 mill. EUR per year.
The current market share of side-loading trucks (see Fig.5.5) amounts to
• 12% in terms of vehicles (= 700 trucks),
• 18% in terms of value (= 160 mill. EUR) as side-loadingtrucks are more expensive than rear-loading trucks.
The market share of side-loading trucks differs within thevarious EU countries. Major users are Austria, Germanyand the Netherlands where the market share amounts toapprox. 20%. In the future, the demand for side-loadingtrucks will grow further due to the current policy of substi-tution of rear-loading trucks. Major local markets will beFrance and Spain.
19
Introduction Growth Maturity Saturation Decline
Multi-chambertrucks
Side- andfront-loading
trucks
Salesrevenues
Productlife cycle
Figure 5.4. Product life cycle.
Competition
There are numerous companies in Europe offering the dif-ferent types of waste collection trucks. Some of these com-panies serve the domestic market only, whereas othersserve both the domestic and international markets.
The market leader in Europe is Faun/Germany with a mar-ket share of approx. 25%, selling 1,300–1,500 trucks peryear. Faun supplies all types of waste collection trucks.
Other important suppliers of collection trucks are in• Germany: Haller, Hueffermann, Otto, Zoeller,• the Netherlands: Geesink Norba, Translift,• Spain: Ros Roca.
Conclusion
In the future, side-loading trucks will have greater rele-vance. Front-loading trucks are mainly used for the collec-tion of industrial and commercial waste and multi-chambertrucks have too many disadvantages for market success.
A market volume of 700 trucks per year exists in Europefor side-loading trucks (value: approx. 160 mill. EUR).These products will continue to substitute rear-loading
trucks and a medium market growth of 2-5% can be pre-dicted. Therefore, this is an attractive market in terms ofmarket volume and growth.
However, it is not very attractive for a new supplier to enterthis market as there are already a lot of players in the busi-ness, and thus the competitive pressure is high.
5.2.2 Separation of collection andtransport
Introduction
For the collection of MSW and the transport of waste totreatment facilities, side- or rear-loading collection trucksare used (see Chapter 5.2.1). These trucks normally havefix-mounted containers to store the waste.
To use expensive collection trucks for collection and trans-port in many cases is inefficient. When the waste containerof the collection truck is full the truck has to transport thewaste to the treatment facility. During this transport run thecollection staff are still on board which causes higher per-sonnel costs. Expensive collection trucks are also used forthe transport of containers whereas this could be done by
20
Figure 5.6. Separation of collection and transport.
88%
12%
Rear-loadingtrucks
5,300 #
Side-loading trucks700 #
82%
18%
Rear-loadingtrucks
740 mill. EUR
Side-loading trucks160 mill. EUR
– by number of vehicles –Total: 6,000 trucks (2002)
– by value –Total: 900 mill. EUR (2002)
MSW collection trucks: Market volume
Figure 5.5. Market volume for MSW collection trucks in Europe (EU).
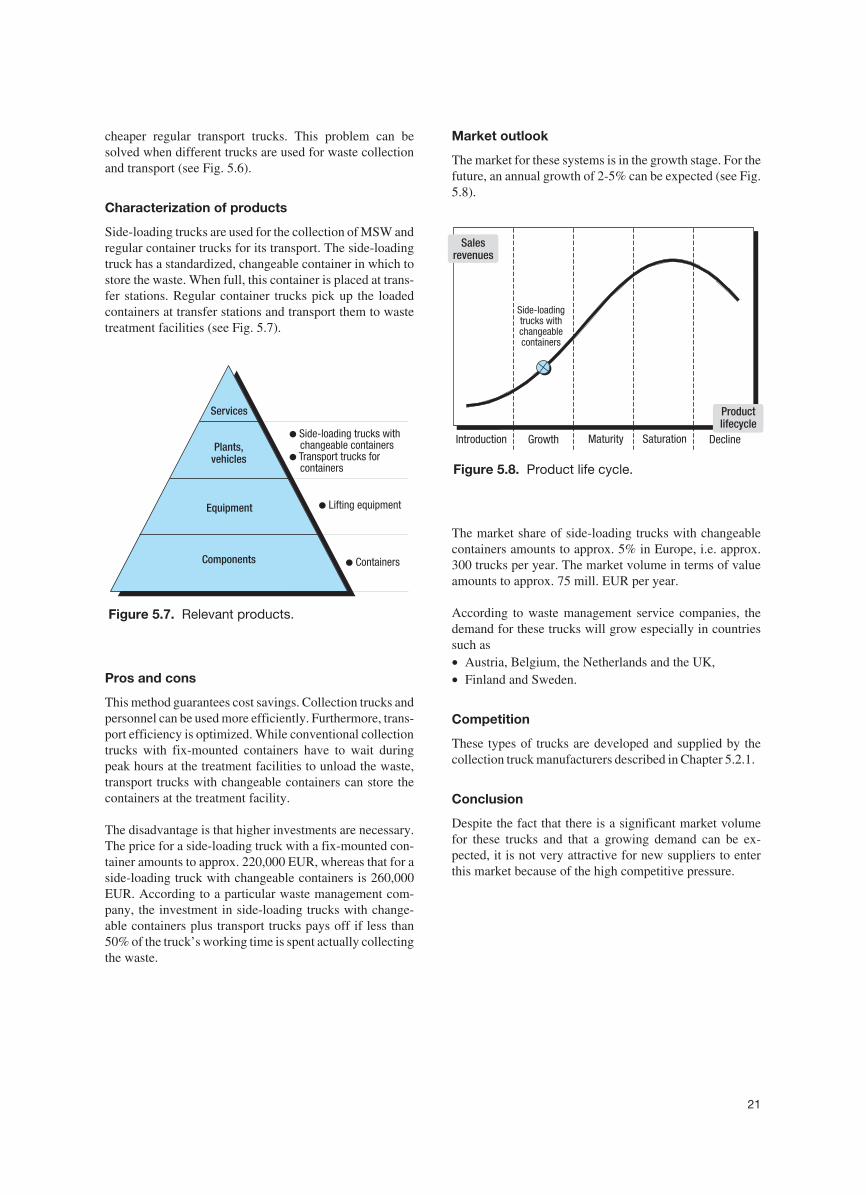
cheaper regular transport trucks. This problem can besolved when different trucks are used for waste collectionand transport (see Fig. 5.6).
Characterization of products
Side-loading trucks are used for the collection of MSW andregular container trucks for its transport. The side-loadingtruck has a standardized, changeable container in which tostore the waste. When full, this container is placed at trans-fer stations. Regular container trucks pick up the loadedcontainers at transfer stations and transport them to wastetreatment facilities (see Fig. 5.7).
Pros and cons
This method guarantees cost savings. Collection trucks andpersonnel can be used more efficiently. Furthermore, trans-port efficiency is optimized. While conventional collectiontrucks with fix-mounted containers have to wait duringpeak hours at the treatment facilities to unload the waste,transport trucks with changeable containers can store thecontainers at the treatment facility.
The disadvantage is that higher investments are necessary.The price for a side-loading truck with a fix-mounted con-tainer amounts to approx. 220,000 EUR, whereas that for aside-loading truck with changeable containers is 260,000EUR. According to a particular waste management com-pany, the investment in side-loading trucks with change-able containers plus transport trucks pays off if less than50% of the truck’s working time is spent actually collectingthe waste.
Market outlook
The market for these systems is in the growth stage. For thefuture, an annual growth of 2-5% can be expected (see Fig.5.8).
The market share of side-loading trucks with changeablecontainers amounts to approx. 5% in Europe, i.e. approx.300 trucks per year. The market volume in terms of valueamounts to approx. 75 mill. EUR per year.
According to waste management service companies, thedemand for these trucks will grow especially in countriessuch as• Austria, Belgium, the Netherlands and the UK,• Finland and Sweden.
Competition
These types of trucks are developed and supplied by thecollection truck manufacturers described in Chapter 5.2.1.
Conclusion
Despite the fact that there is a significant market volumefor these trucks and that a growing demand can be ex-pected, it is not very attractive for new suppliers to enterthis market because of the high competitive pressure.
21
● Lifting equipmentEquipment
Services
Plants,vehicles
Components
●
●
Side-loading trucks withchangeable containersTransport trucks forcontainers
● Containers
Figure 5.7. Relevant products.
Introduction Growth Maturity Saturation Decline
Productlifecycle
Side-loadingtrucks withchangeablecontainers
Salesrevenues
Figure 5.8. Product life cycle.
5.2.3 Route planning and supervision
Introduction
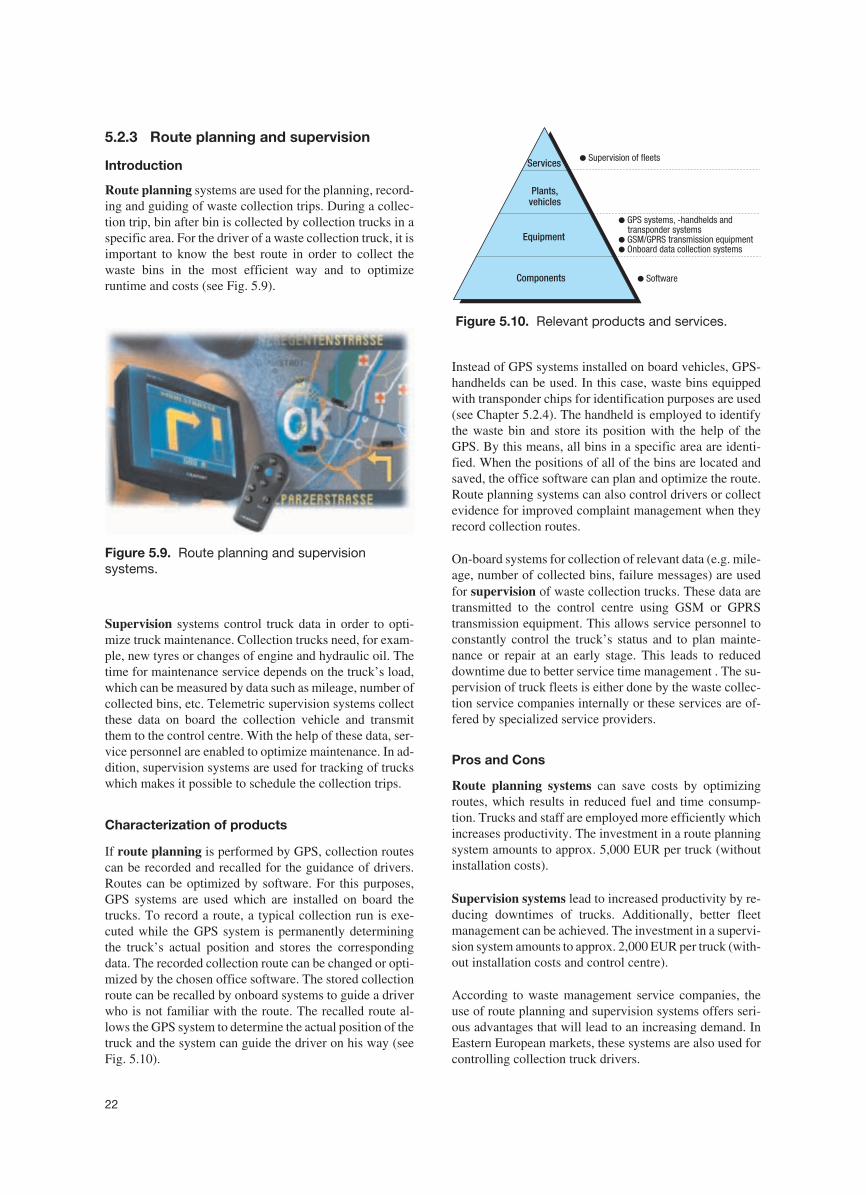
Route planning systems are used for the planning, record-ing and guiding of waste collection trips. During a collec-tion trip, bin after bin is collected by collection trucks in aspecific area. For the driver of a waste collection truck, it isimportant to know the best route in order to collect thewaste bins in the most efficient way and to optimizeruntime and costs (see Fig. 5.9).
Supervision systems control truck data in order to opti-mize truck maintenance. Collection trucks need, for exam-ple, new tyres or changes of engine and hydraulic oil. Thetime for maintenance service depends on the truck’s load,which can be measured by data such as mileage, number ofcollected bins, etc. Telemetric supervision systems collectthese data on board the collection vehicle and transmitthem to the control centre. With the help of these data, ser-vice personnel are enabled to optimize maintenance. In ad-dition, supervision systems are used for tracking of truckswhich makes it possible to schedule the collection trips.
Characterization of products
If route planning is performed by GPS, collection routescan be recorded and recalled for the guidance of drivers.Routes can be optimized by software. For this purposes,GPS systems are used which are installed on board thetrucks. To record a route, a typical collection run is exe-cuted while the GPS system is permanently determiningthe truck’s actual position and stores the correspondingdata. The recorded collection route can be changed or opti-mized by the chosen office software. The stored collectionroute can be recalled by onboard systems to guide a driverwho is not familiar with the route. The recalled route al-lows the GPS system to determine the actual position of thetruck and the system can guide the driver on his way (seeFig. 5.10).
Instead of GPS systems installed on board vehicles, GPS-handhelds can be used. In this case, waste bins equippedwith transponder chips for identification purposes are used(see Chapter 5.2.4). The handheld is employed to identifythe waste bin and store its position with the help of theGPS. By this means, all bins in a specific area are identi-fied. When the positions of all of the bins are located andsaved, the office software can plan and optimize the route.Route planning systems can also control drivers or collectevidence for improved complaint management when theyrecord collection routes.
On-board systems for collection of relevant data (e.g. mile-age, number of collected bins, failure messages) are usedfor supervision of waste collection trucks. These data aretransmitted to the control centre using GSM or GPRStransmission equipment. This allows service personnel toconstantly control the truck’s status and to plan mainte-nance or repair at an early stage. This leads to reduceddowntime due to better service time management . The su-pervision of truck fleets is either done by the waste collec-tion service companies internally or these services are of-fered by specialized service providers.
Pros and Cons
Route planning systems can save costs by optimizingroutes, which results in reduced fuel and time consump-tion. Trucks and staff are employed more efficiently whichincreases productivity. The investment in a route planningsystem amounts to approx. 5,000 EUR per truck (withoutinstallation costs).
Supervision systems lead to increased productivity by re-ducing downtimes of trucks. Additionally, better fleetmanagement can be achieved. The investment in a supervi-sion system amounts to approx. 2,000 EUR per truck (with-out installation costs and control centre).
According to waste management service companies, theuse of route planning and supervision systems offers seri-ous advantages that will lead to an increasing demand. InEastern European markets, these systems are also used forcontrolling collection truck drivers.
22
Figure 5.9. Route planning and supervisionsystems.
Equipment
Services
Plants,vehicles
Components
● Supervision of fleets
●
●●
GPS systems, -handhelds andtransponder systemsGSM/GPRS transmission equipmentOnboard data collection systems
● Software
Figure 5.10. Relevant products and services.
Market outlook
The market for route planning systems is in the growthstage, while the market for supervision systems is stillemerging (see Fig. 5.11).
In total the market volume for these systems amounts toapprox. 25 mill. EUR. The market will grow more than 5%per year in the coming years.
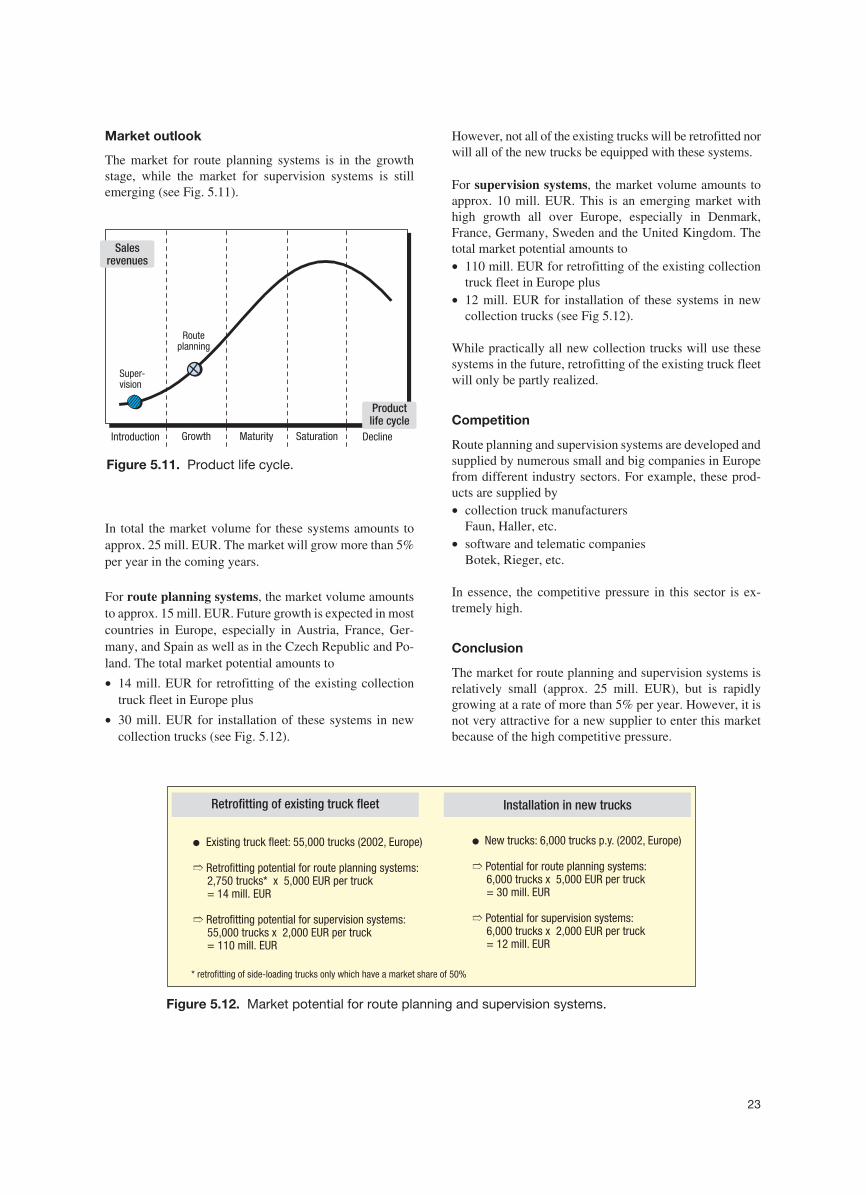
For route planning systems, the market volume amountsto approx. 15 mill. EUR. Future growth is expected in mostcountries in Europe, especially in Austria, France, Ger-many, and Spain as well as in the Czech Republic and Po-land. The total market potential amounts to
• 14 mill. EUR for retrofitting of the existing collectiontruck fleet in Europe plus
• 30 mill. EUR for installation of these systems in newcollection trucks (see Fig. 5.12).
However, not all of the existing trucks will be retrofitted norwill all of the new trucks be equipped with these systems.
For supervision systems, the market volume amounts toapprox. 10 mill. EUR. This is an emerging market withhigh growth all over Europe, especially in Denmark,France, Germany, Sweden and the United Kingdom. Thetotal market potential amounts to• 110 mill. EUR for retrofitting of the existing collection
truck fleet in Europe plus• 12 mill. EUR for installation of these systems in new
collection trucks (see Fig 5.12).
While practically all new collection trucks will use thesesystems in the future, retrofitting of the existing truck fleetwill only be partly realized.
Competition
Route planning and supervision systems are developed andsupplied by numerous small and big companies in Europefrom different industry sectors. For example, these prod-ucts are supplied by• collection truck manufacturers
Faun, Haller, etc.• software and telematic companies
Botek, Rieger, etc.
In essence, the competitive pressure in this sector is ex-tremely high.
Conclusion
The market for route planning and supervision systems isrelatively small (approx. 25 mill. EUR), but is rapidlygrowing at a rate of more than 5% per year. However, it isnot very attractive for a new supplier to enter this marketbecause of the high competitive pressure.
23
Retrofitting of existing truck fleet Installation in new trucks
● Existing truck fleet: 55,000 trucks (2002, Europe)
Retrofitting potential for route planning systems:2,750 trucks* x 5,000 EUR per truck= 14 mill. EUR
Retrofitting potential for supervision systems:55,000 trucks x 2,000 EUR per truck= 110 mill. EUR
➱
➱
●
Potential for route planning systems:6,000 trucks x 5,000 EUR per truck= 30 mill. EUR
Potential for supervision systems:6,000 trucks x 2,000 EUR per truck= 12 mill. EUR
➱
➱
New trucks: 6,000 trucks p.y. (2002, Europe)
* side-loading trucks only which have a market share of 50%retrofitting of
Figure 5.12. Market potential for route planning and supervision systems.
Introduction Growth Maturity Saturation Decline
Super-vision
Routeplanning
Salesrevenues
Productlife cycle
Figure 5.11. Product life cycle.
5.2.4 Individual billing systems
Introduction
In traditional waste collection schemes, all citizens of aspecific area pay the same waste fees regardless of theirvolume of waste production. This is the case because thewaste bins are emptied at regular intervals, whether thebins are full or not, while no data are collected about theamount of waste produced by an individual household.
However, waste bin identification systems are now beingused to gather information about the amount of waste ahousehold produces and to bill customers individually andappropriately (see Fig. 5.13).
Characterization of products
To offer the individual billing service by waste manage-ment service companies, each bin in the collection area isequipped with a transponder chip containing specific infor-mation about its identity and its location. This is the bin’sidentity card.
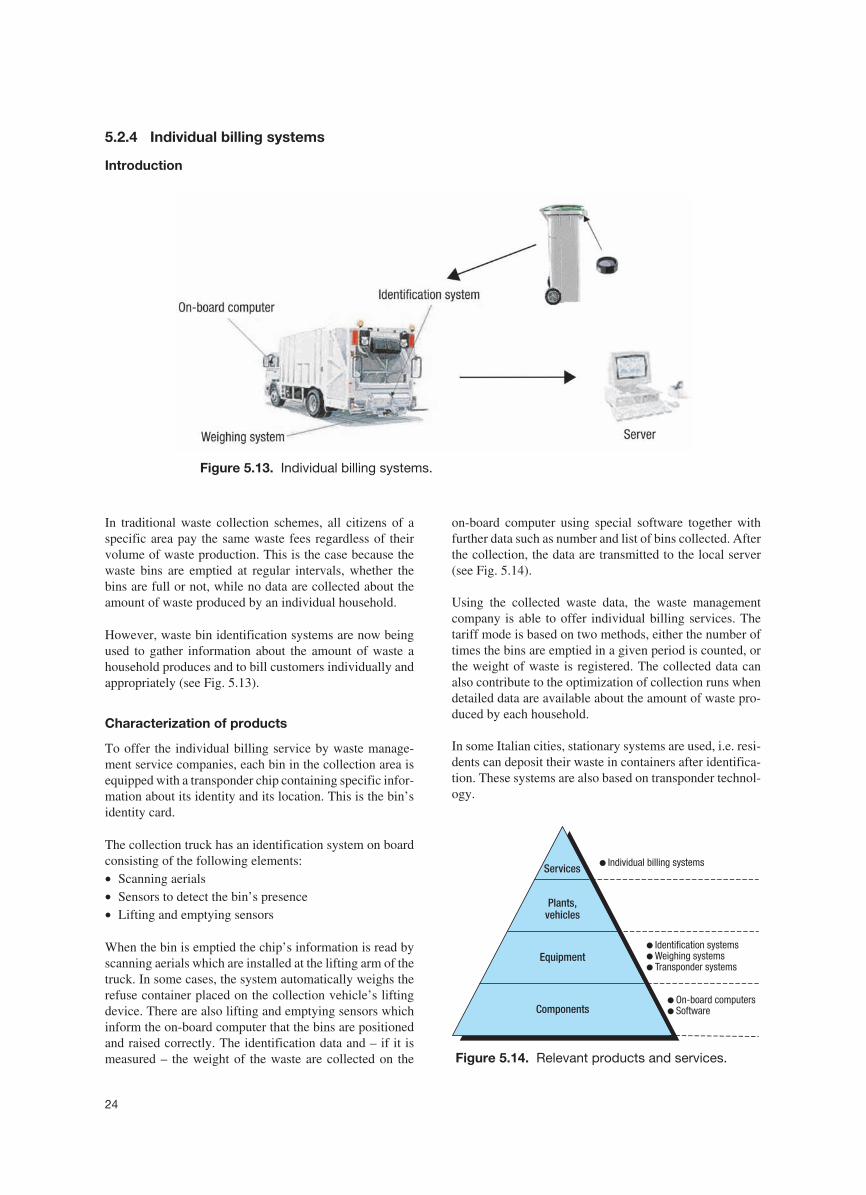
The collection truck has an identification system on boardconsisting of the following elements:• Scanning aerials• Sensors to detect the bin’s presence• Lifting and emptying sensors
When the bin is emptied the chip’s information is read byscanning aerials which are installed at the lifting arm of thetruck. In some cases, the system automatically weighs therefuse container placed on the collection vehicle’s liftingdevice. There are also lifting and emptying sensors whichinform the on-board computer that the bins are positionedand raised correctly. The identification data and – if it ismeasured – the weight of the waste are collected on the
on-board computer using special software together withfurther data such as number and list of bins collected. Afterthe collection, the data are transmitted to the local server(see Fig. 5.14).
Using the collected waste data, the waste managementcompany is able to offer individual billing services. Thetariff mode is based on two methods, either the number oftimes the bins are emptied in a given period is counted, orthe weight of waste is registered. The collected data canalso contribute to the optimization of collection runs whendetailed data are available about the amount of waste pro-duced by each household.
In some Italian cities, stationary systems are used, i.e. resi-dents can deposit their waste in containers after identifica-tion. These systems are also based on transponder technol-ogy.
24
Figure 5.13. Individual billing systems.
Equipment
Services
Plants,vehicles
Components
● Identification systems●
●
Weighing systemsTransponder systems
● Individual billing systems
●
●
computersSoftwareOn-board
Figure 5.14. Relevant products and services.
Pros and Cons
The principal advantage of individual billing systems is thefairness of the system. Individual billing implements the“polluter pays” principle. People with higher waste pro-duction are obliged to pay higher fees. An additional posi-tive result is decreasing waste volumes due to the fact thatwaste prevention by citizens is rewarded with lower fees.
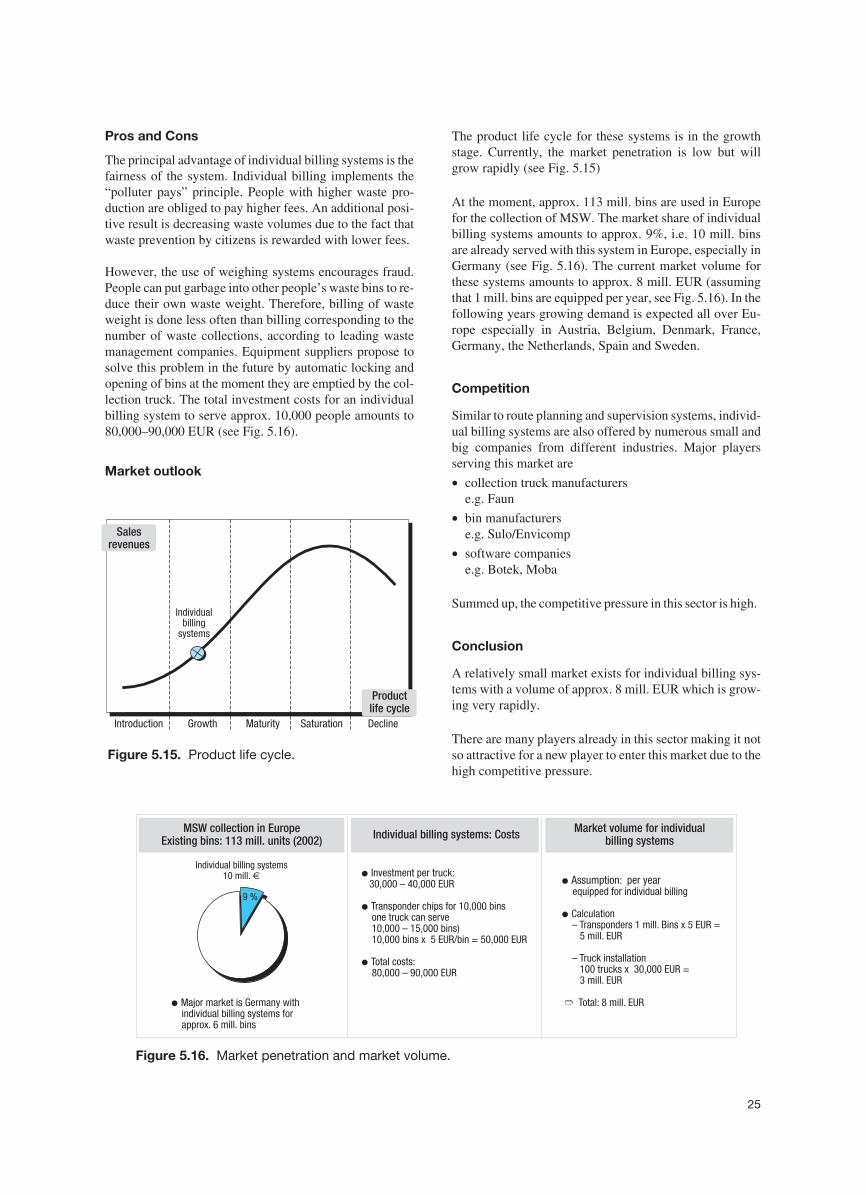
However, the use of weighing systems encourages fraud.People can put garbage into other people’s waste bins to re-duce their own waste weight. Therefore, billing of wasteweight is done less often than billing corresponding to thenumber of waste collections, according to leading wastemanagement companies. Equipment suppliers propose tosolve this problem in the future by automatic locking andopening of bins at the moment they are emptied by the col-lection truck. The total investment costs for an individualbilling system to serve approx. 10,000 people amounts to80,000–90,000 EUR (see Fig. 5.16).
Market outlook
The product life cycle for these systems is in the growthstage. Currently, the market penetration is low but willgrow rapidly (see Fig. 5.15)
At the moment, approx. 113 mill. bins are used in Europefor the collection of MSW. The market share of individualbilling systems amounts to approx. 9%, i.e. 10 mill. binsare already served with this system in Europe, especially inGermany (see Fig. 5.16). The current market volume forthese systems amounts to approx. 8 mill. EUR (assumingthat 1 mill. bins are equipped per year, see Fig. 5.16). In thefollowing years growing demand is expected all over Eu-rope especially in Austria, Belgium, Denmark, France,Germany, the Netherlands, Spain and Sweden.
Competition
Similar to route planning and supervision systems, individ-ual billing systems are also offered by numerous small andbig companies from different industries. Major playersserving this market are
• collection truck manufacturerse.g. Faun
• bin manufacturerse.g. Sulo/Envicomp
• software companiese.g. Botek, Moba
Summed up, the competitive pressure in this sector is high.
Conclusion
A relatively small market exists for individual billing sys-tems with a volume of approx. 8 mill. EUR which is grow-ing very rapidly.
There are many players already in this sector making it notso attractive for a new player to enter this market due to thehigh competitive pressure.
25
Introduction Growth Maturity Saturation Decline
Individualbilling
systems
Salesrevenues
Productlife cycle
Figure 5.15. Product life cycle.
●
●
●
Investment per truck:30,000 – 40,000 EUR
Transponder chips for 10,000 binsone truck can serve10,000 – 15,000 bins)10,000 bins x 5 EUR/bin = 50,000 EUR
Total costs:80,000 – 90,000 EUR
●
●
Assumption: per yearequipped for individual billing
Calculation– Transponders 1 mill. Bins x 5 EUR =
5 mill. EUR
– Truck installation100 trucks x 30,000 EUR =3 mill. EUR
Total: 8 mill. EUR➱
Individual billing systems: Costs Market volume for individualbilling systems
MSW collection in EuropeExisting bins: 113 mill. units (2002)
Individual billing systems10 mill. €
9 %
● Major market is Germany withindividual billing systems forapprox. 6 mill. bins
Figure 5.16. Market penetration and market volume.
5.2.5 Deposit automats for bottles/cans
Introduction
In many European countries, customers have to pay a de-posit when they buy beverages in bottles or cans. The de-posit is refunded when the container is returned at an ac-ceptance point. The acceptance, the calculation and the re-funding of such a deposit can be done with the help of de-posit automats (see Fig. 5.17).
Characterization of products
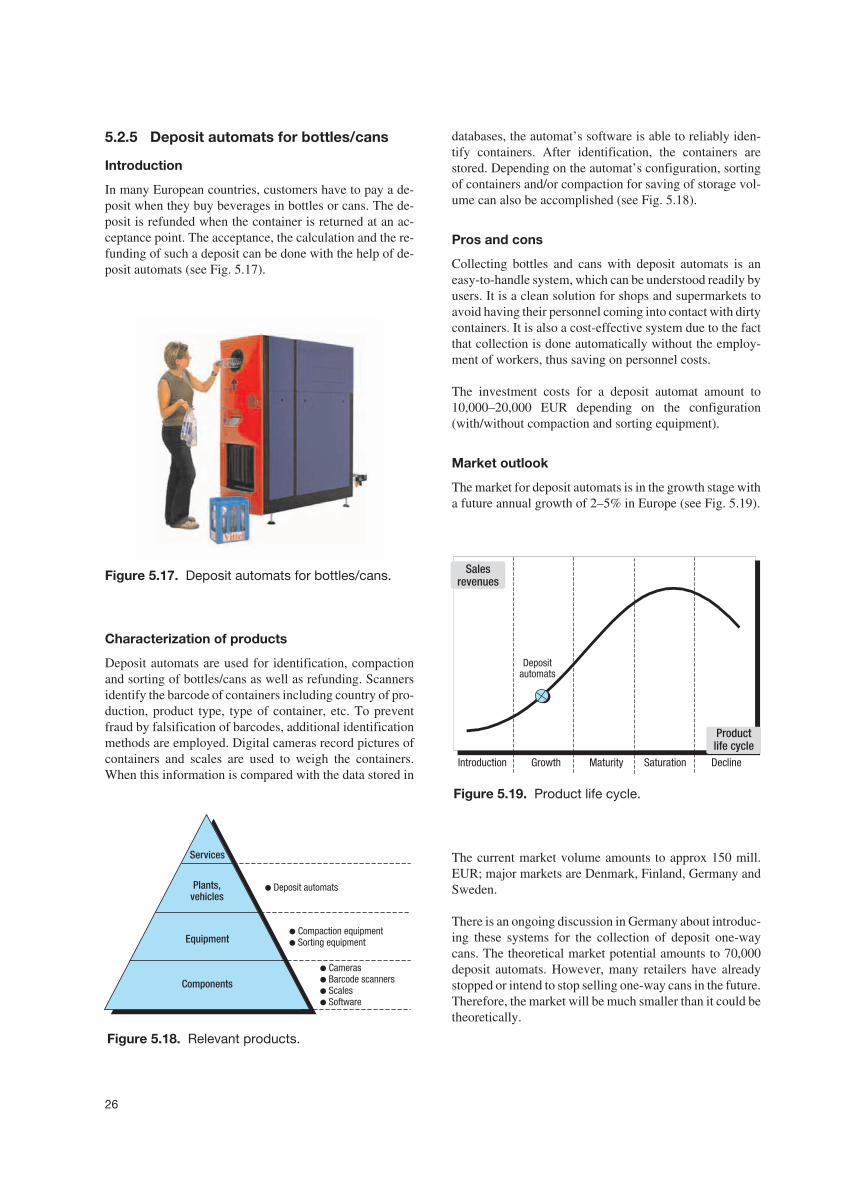
Deposit automats are used for identification, compactionand sorting of bottles/cans as well as refunding. Scannersidentify the barcode of containers including country of pro-duction, product type, type of container, etc. To preventfraud by falsification of barcodes, additional identificationmethods are employed. Digital cameras record pictures ofcontainers and scales are used to weigh the containers.When this information is compared with the data stored in
databases, the automat’s software is able to reliably iden-tify containers. After identification, the containers arestored. Depending on the automat’s configuration, sortingof containers and/or compaction for saving of storage vol-ume can also be accomplished (see Fig. 5.18).
Pros and cons
Collecting bottles and cans with deposit automats is aneasy-to-handle system, which can be understood readily byusers. It is a clean solution for shops and supermarkets toavoid having their personnel coming into contact with dirtycontainers. It is also a cost-effective system due to the factthat collection is done automatically without the employ-ment of workers, thus saving on personnel costs.
The investment costs for a deposit automat amount to10,000–20,000 EUR depending on the configuration(with/without compaction and sorting equipment).
Market outlook
The market for deposit automats is in the growth stage witha future annual growth of 2–5% in Europe (see Fig. 5.19).
The current market volume amounts to approx 150 mill.EUR; major markets are Denmark, Finland, Germany andSweden.
There is an ongoing discussion in Germany about introduc-ing these systems for the collection of deposit one-waycans. The theoretical market potential amounts to 70,000deposit automats. However, many retailers have alreadystopped or intend to stop selling one-way cans in the future.Therefore, the market will be much smaller than it could betheoretically.
26
Figure 5.17. Deposit automats for bottles/cans.
Equipment
Services
Plants,vehicles
Components
●
● Sorting equipmentCompaction equipment
● Deposit automats
●
●
●
●
Barcode scannersScalesSoftware
Cameras
Figure 5.18. Relevant products.
Introduction Growth Maturity Saturation Decline
Depositautomats
Salesrevenues
Productlife cycle
Figure 5.19. Product life cycle.
Competition
The market for deposit automats in Europe is dominated bythe Norwegian company Tomra, which has a market shareof more than 50%. Further suppliers exist, however, with asmall market share.
Conclusion
The market for deposit automats is very attractive due tothe large volume of approx. 150 mill. EUR and the mediumgrowth rate. There are only a few suppliers, therefore thecompetitive pressure is not very intensive.
5.2.6 Suction system
Introduction
Traditionally, MSW is collected in waste bins by citizens.These waste bins are placed near houses or apartments,generally in special waste bin rooms or other specifiedplaces. Waste collection trucks collect and empty thesebins at regular intervals. This system for collection of mu-nicipal solid waste has some disadvantages. The waste col-lection process is associated with noise and odour. Incrowded or remote areas collection trucks also have prob-lems reaching the bins. These and other factors led to thedevelopment of suction systems for the collection and stor-age of MSW.
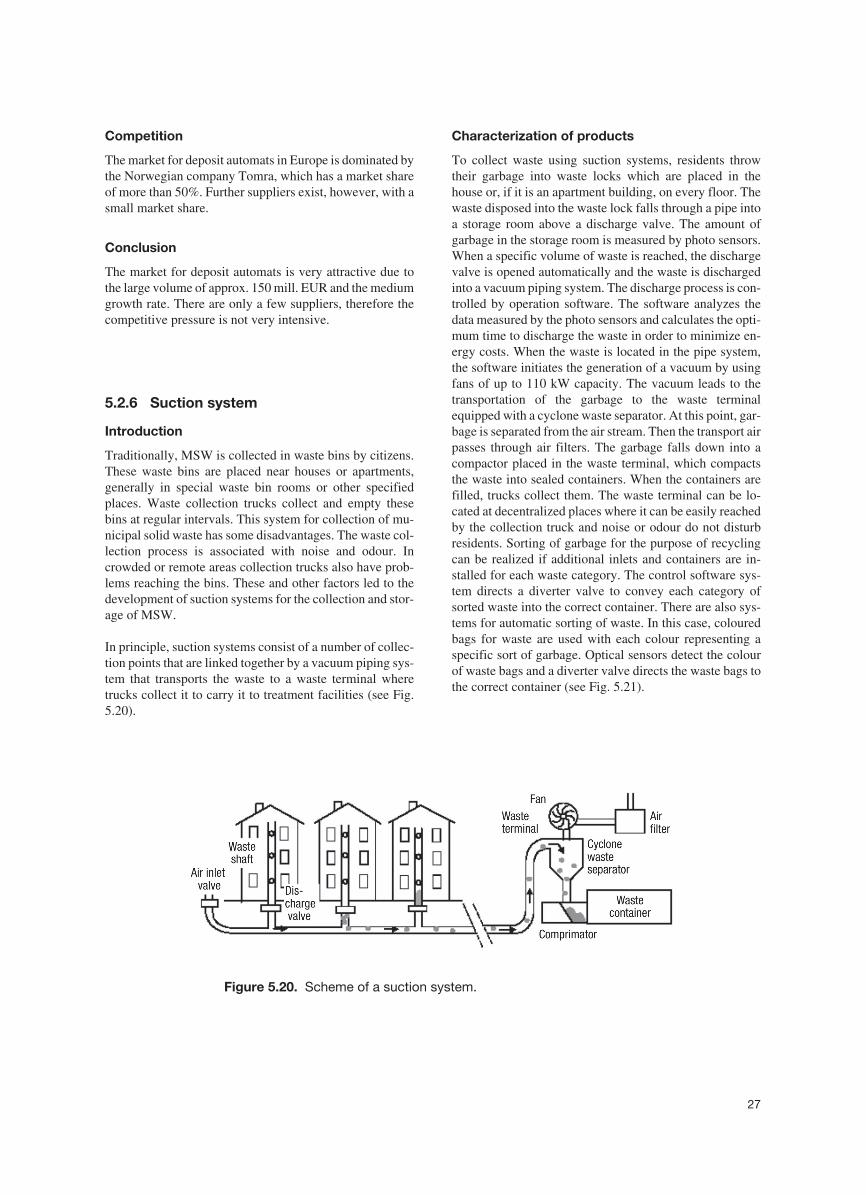
In principle, suction systems consist of a number of collec-tion points that are linked together by a vacuum piping sys-tem that transports the waste to a waste terminal wheretrucks collect it to carry it to treatment facilities (see Fig.5.20).
Characterization of products
To collect waste using suction systems, residents throwtheir garbage into waste locks which are placed in thehouse or, if it is an apartment building, on every floor. Thewaste disposed into the waste lock falls through a pipe intoa storage room above a discharge valve. The amount ofgarbage in the storage room is measured by photo sensors.When a specific volume of waste is reached, the dischargevalve is opened automatically and the waste is dischargedinto a vacuum piping system. The discharge process is con-trolled by operation software. The software analyzes thedata measured by the photo sensors and calculates the opti-mum time to discharge the waste in order to minimize en-ergy costs. When the waste is located in the pipe system,the software initiates the generation of a vacuum by usingfans of up to 110 kW capacity. The vacuum leads to thetransportation of the garbage to the waste terminalequipped with a cyclone waste separator. At this point, gar-bage is separated from the air stream. Then the transport airpasses through air filters. The garbage falls down into acompactor placed in the waste terminal, which compactsthe waste into sealed containers. When the containers arefilled, trucks collect them. The waste terminal can be lo-cated at decentralized places where it can be easily reachedby the collection truck and noise or odour do not disturbresidents. Sorting of garbage for the purpose of recyclingcan be realized if additional inlets and containers are in-stalled for each waste category. The control software sys-tem directs a diverter valve to convey each category ofsorted waste into the correct container. There are also sys-tems for automatic sorting of waste. In this case, colouredbags for waste are used with each colour representing aspecific sort of garbage. Optical sensors detect the colourof waste bags and a diverter valve directs the waste bags tothe correct container (see Fig. 5.21).
27
Figure 5.20. Scheme of a suction system.
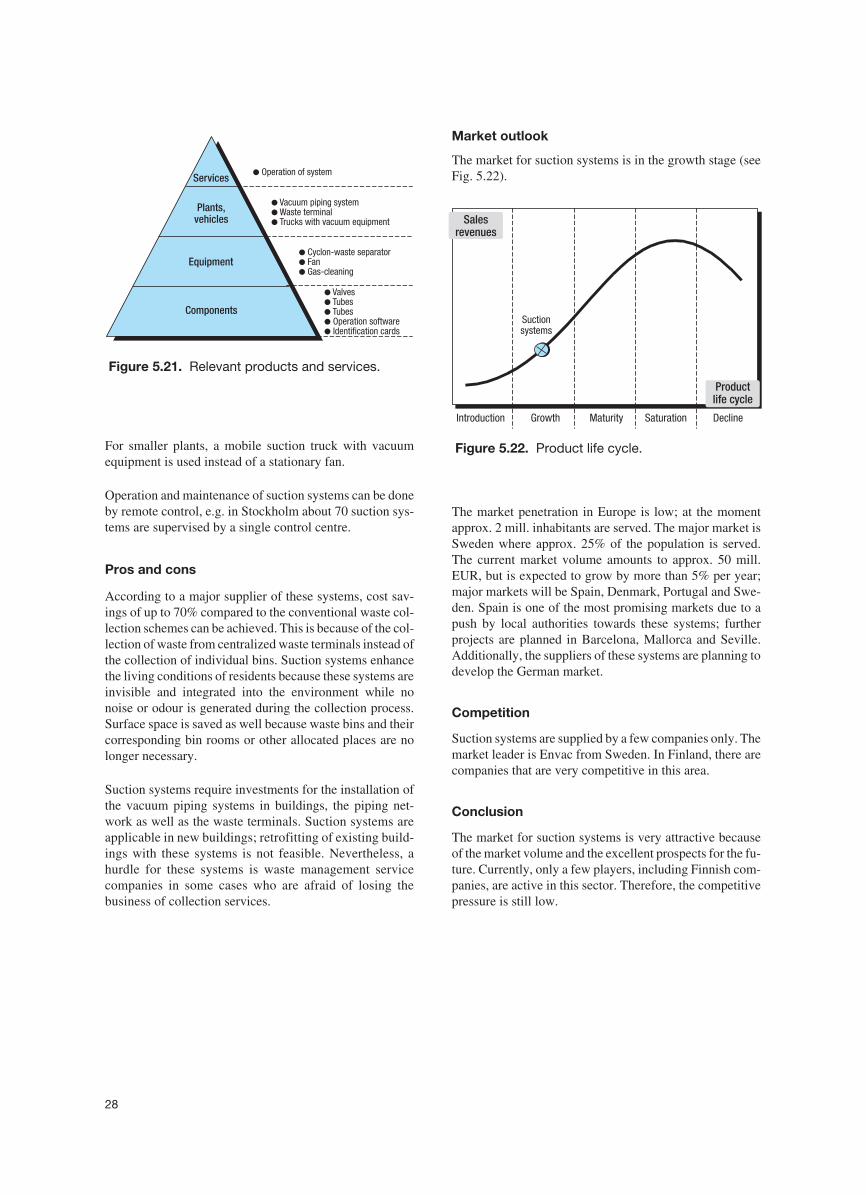
For smaller plants, a mobile suction truck with vacuumequipment is used instead of a stationary fan.
Operation and maintenance of suction systems can be doneby remote control, e.g. in Stockholm about 70 suction sys-tems are supervised by a single control centre.
Pros and cons
According to a major supplier of these systems, cost sav-ings of up to 70% compared to the conventional waste col-lection schemes can be achieved. This is because of the col-lection of waste from centralized waste terminals instead ofthe collection of individual bins. Suction systems enhancethe living conditions of residents because these systems areinvisible and integrated into the environment while nonoise or odour is generated during the collection process.Surface space is saved as well because waste bins and theircorresponding bin rooms or other allocated places are nolonger necessary.
Suction systems require investments for the installation ofthe vacuum piping systems in buildings, the piping net-work as well as the waste terminals. Suction systems areapplicable in new buildings; retrofitting of existing build-ings with these systems is not feasible. Nevertheless, ahurdle for these systems is waste management servicecompanies in some cases who are afraid of losing thebusiness of collection services.
Market outlook
The market for suction systems is in the growth stage (seeFig. 5.22).
The market penetration in Europe is low; at the momentapprox. 2 mill. inhabitants are served. The major market isSweden where approx. 25% of the population is served.The current market volume amounts to approx. 50 mill.EUR, but is expected to grow by more than 5% per year;major markets will be Spain, Denmark, Portugal and Swe-den. Spain is one of the most promising markets due to apush by local authorities towards these systems; furtherprojects are planned in Barcelona, Mallorca and Seville.Additionally, the suppliers of these systems are planning todevelop the German market.
Competition
Suction systems are supplied by a few companies only. Themarket leader is Envac from Sweden. In Finland, there arecompanies that are very competitive in this area.
Conclusion
The market for suction systems is very attractive becauseof the market volume and the excellent prospects for the fu-ture. Currently, only a few players, including Finnish com-panies, are active in this sector. Therefore, the competitivepressure is still low.
28
Equipment
Services
Plants,vehicles
Components
●●●
Cyclon-waste separatorFanGas-cleaning
●●●
Waste terminalTrucks with vacuum equipment
Vacuum piping system
●●●●●
TubesTubesOperation softwareIdentification cards
Valves
● Operation of system
Figure 5.21. Relevant products and services.
Introduction Growth Maturity Saturation Decline
Suctionsystems
Salesrevenues
Productlife cycle
Figure 5.22. Product life cycle.
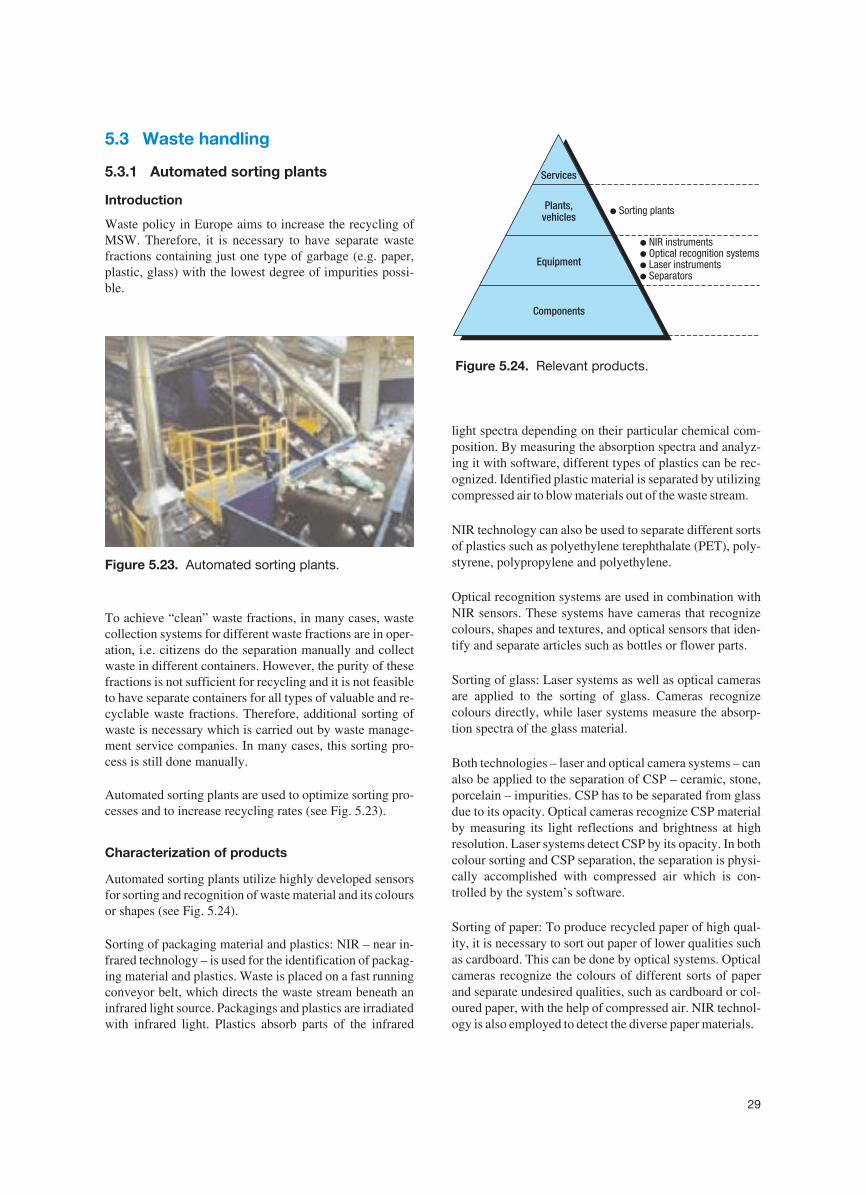
5.3 Waste handling
5.3.1 Automated sorting plants
Introduction
Waste policy in Europe aims to increase the recycling ofMSW. Therefore, it is necessary to have separate wastefractions containing just one type of garbage (e.g. paper,plastic, glass) with the lowest degree of impurities possi-ble.
To achieve “clean” waste fractions, in many cases, wastecollection systems for different waste fractions are in oper-ation, i.e. citizens do the separation manually and collectwaste in different containers. However, the purity of thesefractions is not sufficient for recycling and it is not feasibleto have separate containers for all types of valuable and re-cyclable waste fractions. Therefore, additional sorting ofwaste is necessary which is carried out by waste manage-ment service companies. In many cases, this sorting pro-cess is still done manually.
Automated sorting plants are used to optimize sorting pro-cesses and to increase recycling rates (see Fig. 5.23).
Characterization of products
Automated sorting plants utilize highly developed sensorsfor sorting and recognition of waste material and its coloursor shapes (see Fig. 5.24).
Sorting of packaging material and plastics: NIR – near in-frared technology – is used for the identification of packag-ing material and plastics. Waste is placed on a fast runningconveyor belt, which directs the waste stream beneath aninfrared light source. Packagings and plastics are irradiatedwith infrared light. Plastics absorb parts of the infrared
light spectra depending on their particular chemical com-position. By measuring the absorption spectra and analyz-ing it with software, different types of plastics can be rec-ognized. Identified plastic material is separated by utilizingcompressed air to blow materials out of the waste stream.
NIR technology can also be used to separate different sortsof plastics such as polyethylene terephthalate (PET), poly-styrene, polypropylene and polyethylene.
Optical recognition systems are used in combination withNIR sensors. These systems have cameras that recognizecolours, shapes and textures, and optical sensors that iden-tify and separate articles such as bottles or flower parts.
Sorting of glass: Laser systems as well as optical camerasare applied to the sorting of glass. Cameras recognizecolours directly, while laser systems measure the absorp-tion spectra of the glass material.
Both technologies – laser and optical camera systems – canalso be applied to the separation of CSP – ceramic, stone,porcelain – impurities. CSP has to be separated from glassdue to its opacity. Optical cameras recognize CSP materialby measuring its light reflections and brightness at highresolution. Laser systems detect CSP by its opacity. In bothcolour sorting and CSP separation, the separation is physi-cally accomplished with compressed air which is con-trolled by the system’s software.
Sorting of paper: To produce recycled paper of high qual-ity, it is necessary to sort out paper of lower qualities suchas cardboard. This can be done by optical systems. Opticalcameras recognize the colours of different sorts of paperand separate undesired qualities, such as cardboard or col-oured paper, with the help of compressed air. NIR technol-ogy is also employed to detect the diverse paper materials.
29
Figure 5.23. Automated sorting plants.
Equipment
Services
Plants,vehicles
Components
● NIR instrumentsOptical recognition systemsLaser instrumentsSeparators
●
●
●
● Sorting plants
Figure 5.24. Relevant products.
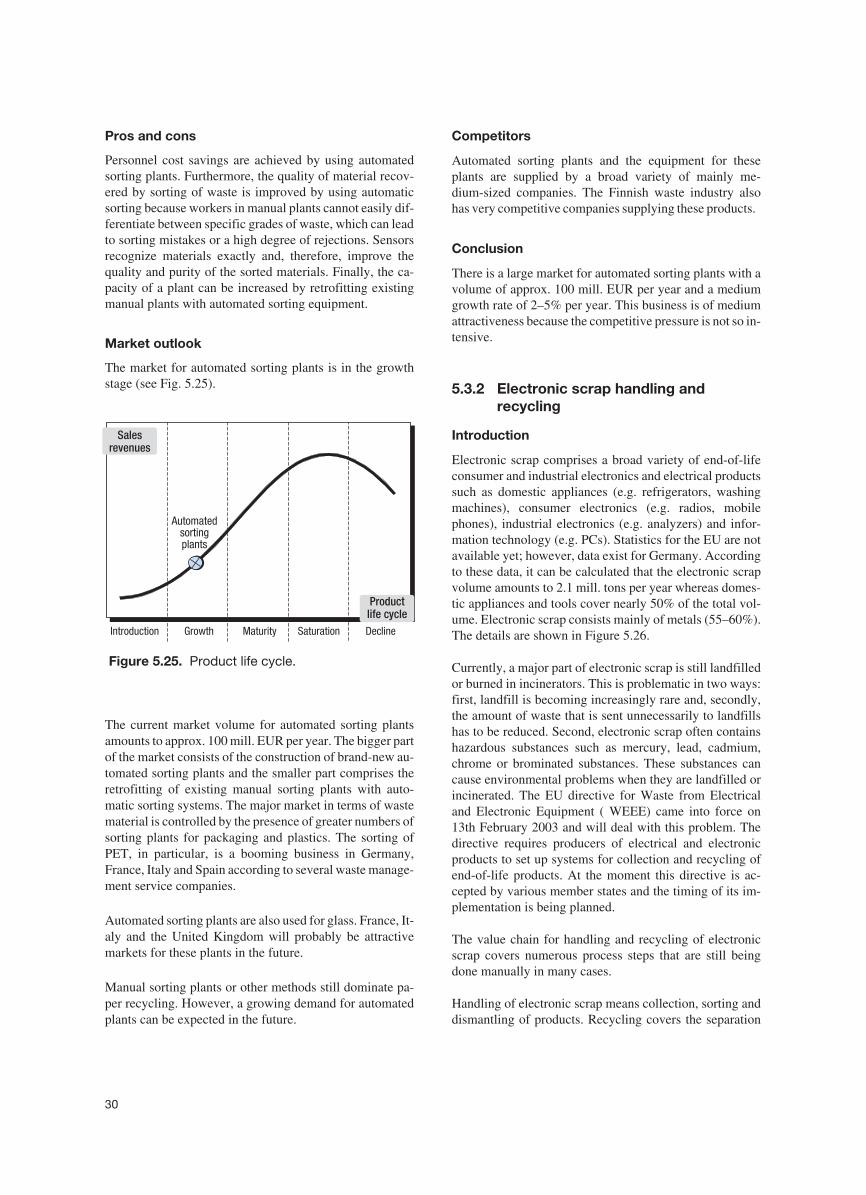
Pros and cons
Personnel cost savings are achieved by using automatedsorting plants. Furthermore, the quality of material recov-ered by sorting of waste is improved by using automaticsorting because workers in manual plants cannot easily dif-ferentiate between specific grades of waste, which can leadto sorting mistakes or a high degree of rejections. Sensorsrecognize materials exactly and, therefore, improve thequality and purity of the sorted materials. Finally, the ca-pacity of a plant can be increased by retrofitting existingmanual plants with automated sorting equipment.
Market outlook
The market for automated sorting plants is in the growthstage (see Fig. 5.25).
The current market volume for automated sorting plantsamounts to approx. 100 mill. EUR per year. The bigger partof the market consists of the construction of brand-new au-tomated sorting plants and the smaller part comprises theretrofitting of existing manual sorting plants with auto-matic sorting systems. The major market in terms of wastematerial is controlled by the presence of greater numbers ofsorting plants for packaging and plastics. The sorting ofPET, in particular, is a booming business in Germany,France, Italy and Spain according to several waste manage-ment service companies.
Automated sorting plants are also used for glass. France, It-aly and the United Kingdom will probably be attractivemarkets for these plants in the future.
Manual sorting plants or other methods still dominate pa-per recycling. However, a growing demand for automatedplants can be expected in the future.
Competitors
Automated sorting plants and the equipment for theseplants are supplied by a broad variety of mainly me-dium-sized companies. The Finnish waste industry alsohas very competitive companies supplying these products.
Conclusion
There is a large market for automated sorting plants with avolume of approx. 100 mill. EUR per year and a mediumgrowth rate of 2–5% per year. This business is of mediumattractiveness because the competitive pressure is not so in-tensive.
5.3.2 Electronic scrap handling andrecycling
Introduction
Electronic scrap comprises a broad variety of end-of-lifeconsumer and industrial electronics and electrical productssuch as domestic appliances (e.g. refrigerators, washingmachines), consumer electronics (e.g. radios, mobilephones), industrial electronics (e.g. analyzers) and infor-mation technology (e.g. PCs). Statistics for the EU are notavailable yet; however, data exist for Germany. Accordingto these data, it can be calculated that the electronic scrapvolume amounts to 2.1 mill. tons per year whereas domes-tic appliances and tools cover nearly 50% of the total vol-ume. Electronic scrap consists mainly of metals (55–60%).The details are shown in Figure 5.26.
Currently, a major part of electronic scrap is still landfilledor burned in incinerators. This is problematic in two ways:first, landfill is becoming increasingly rare and, secondly,the amount of waste that is sent unnecessarily to landfillshas to be reduced. Second, electronic scrap often containshazardous substances such as mercury, lead, cadmium,chrome or brominated substances. These substances cancause environmental problems when they are landfilled orincinerated. The EU directive for Waste from Electricaland Electronic Equipment ( WEEE) came into force on13th February 2003 and will deal with this problem. Thedirective requires producers of electrical and electronicproducts to set up systems for collection and recycling ofend-of-life products. At the moment this directive is ac-cepted by various member states and the timing of its im-plementation is being planned.
The value chain for handling and recycling of electronicscrap covers numerous process steps that are still beingdone manually in many cases.
Handling of electronic scrap means collection, sorting anddismantling of products. Recycling covers the separation
30
Introduction Growth Maturity Saturation Decline
Automatedsortingplants
Salesrevenues
Productlife cycle
Figure 5.25. Product life cycle.
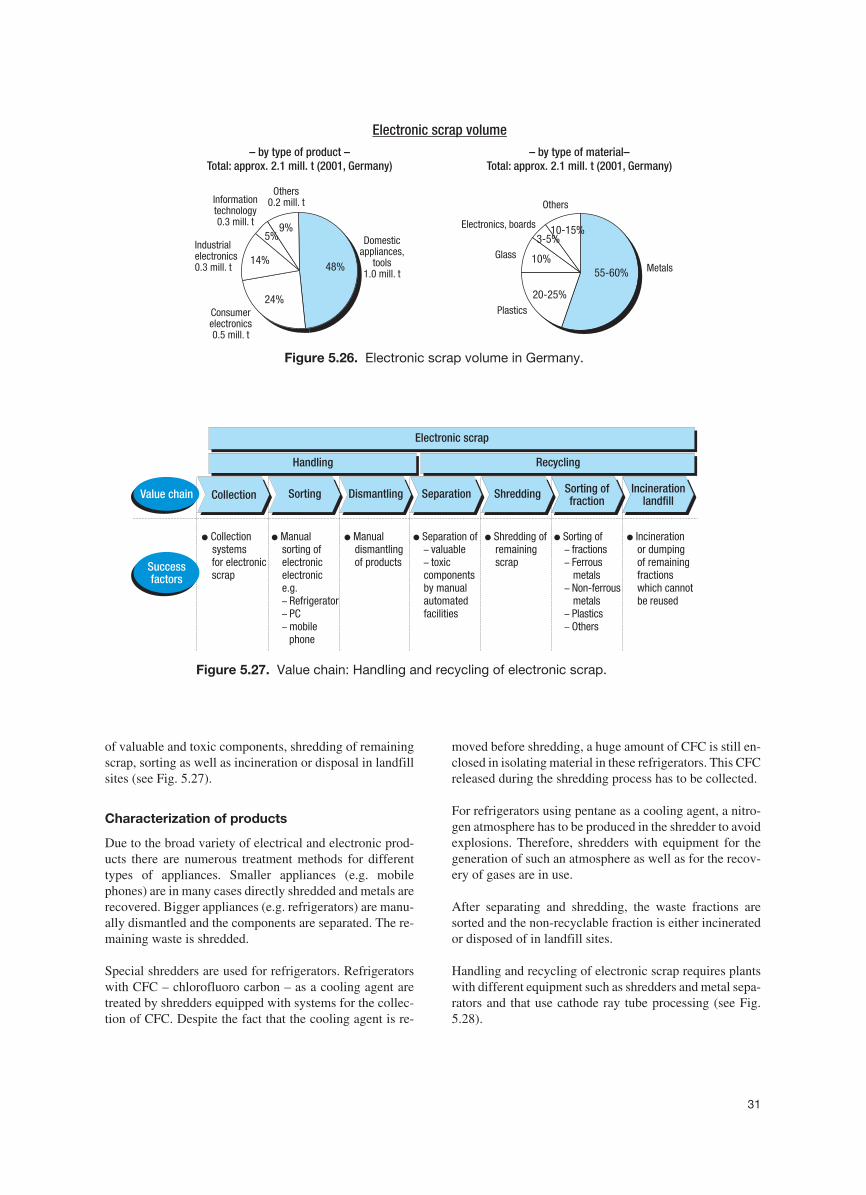
of valuable and toxic components, shredding of remainingscrap, sorting as well as incineration or disposal in landfillsites (see Fig. 5.27).
Characterization of products
Due to the broad variety of electrical and electronic prod-ucts there are numerous treatment methods for differenttypes of appliances. Smaller appliances (e.g. mobilephones) are in many cases directly shredded and metals arerecovered. Bigger appliances (e.g. refrigerators) are manu-ally dismantled and the components are separated. The re-maining waste is shredded.
Special shredders are used for refrigerators. Refrigeratorswith CFC – chlorofluoro carbon – as a cooling agent aretreated by shredders equipped with systems for the collec-tion of CFC. Despite the fact that the cooling agent is re-
moved before shredding, a huge amount of CFC is still en-closed in isolating material in these refrigerators. This CFCreleased during the shredding process has to be collected.
For refrigerators using pentane as a cooling agent, a nitro-gen atmosphere has to be produced in the shredder to avoidexplosions. Therefore, shredders with equipment for thegeneration of such an atmosphere as well as for the recov-ery of gases are in use.
After separating and shredding, the waste fractions aresorted and the non-recyclable fraction is either incineratedor disposed of in landfill sites.
Handling and recycling of electronic scrap requires plantswith different equipment such as shredders and metal sepa-rators and that use cathode ray tube processing (see Fig.5.28).
31
● Collectionsystemsfor electronicscrap
●
–––
Manualsorting ofelectronicelectronice.g.
RefrigeratorPCmobilephone
● Manualdismantlingof products
●
––
Separation ofvaluabletoxic
componentsby manualautomatedfacilities
● Shredding ofremainingscrap
●
––
–
––
Sorting offractionsFerrousmetalsNon-ferrousmetalsPlasticsOthers
● Incinerationor dumpingof remainingfractionswhich cannotbe reused
Electronic scrap
Handling Recycling
Successfactors
DismantlingCollection Sorting Separation Shredding Sorting offraction
IncinerationlandfillValue chain
Figure 5.27. Value chain: Handling and recycling of electronic scrap.
Electronic scrap volume
– by type of product –Total: approx. 2.1 mill. t (2001, Germany)
– by type of material–Total: approx. 2.1 mill. t (2001, Germany)
5%9%
48%
24%
14%
Domesticappliances,
tools1.0 mill. t
Informationtechnology0.3 mill. t
Consumerelectronics0.5 mill. t
Industrialelectronics0.3 mill. t
Others0.2 mill. t
10%
20-25%
55-60%
10-15%3-5%
Metals
Plastics
Others
Electronics, boards
Glass
Figure 5.26. Electronic scrap volume in Germany.
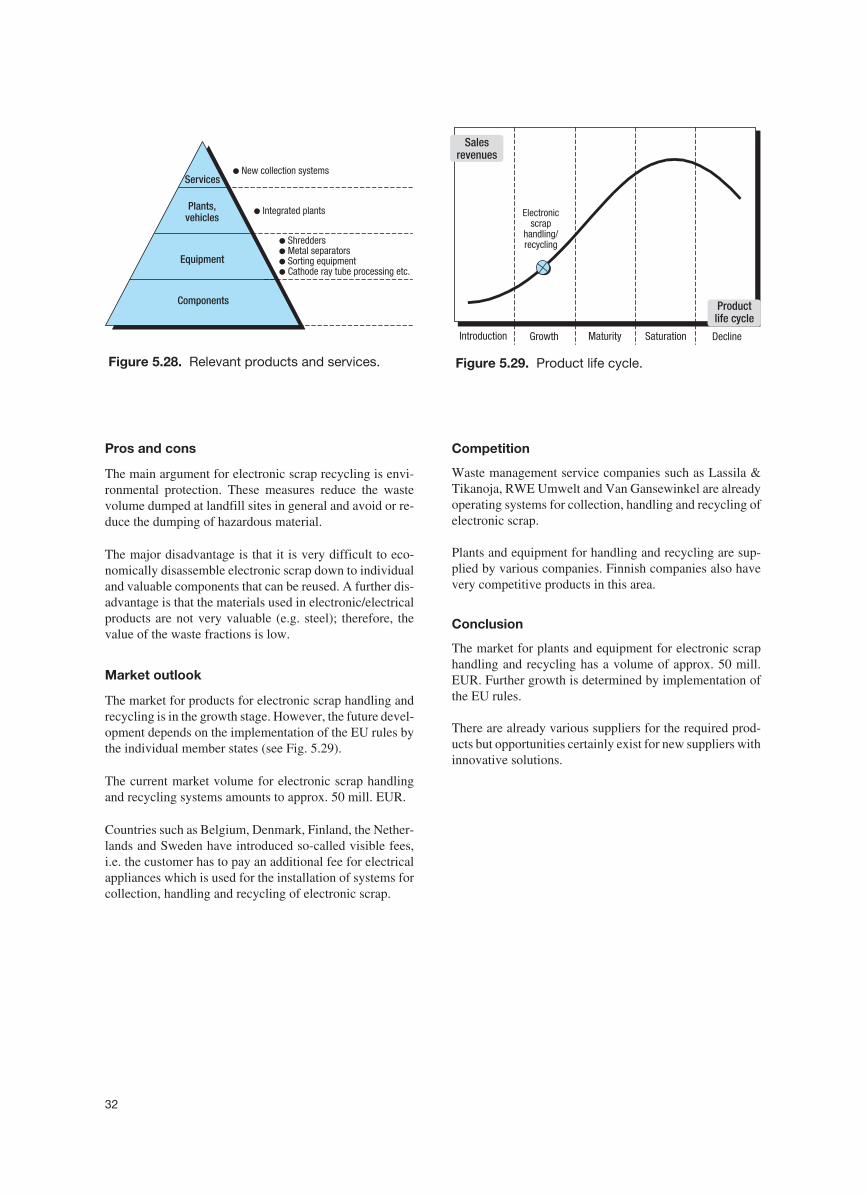
Pros and cons
The main argument for electronic scrap recycling is envi-ronmental protection. These measures reduce the wastevolume dumped at landfill sites in general and avoid or re-duce the dumping of hazardous material.
The major disadvantage is that it is very difficult to eco-nomically disassemble electronic scrap down to individualand valuable components that can be reused. A further dis-advantage is that the materials used in electronic/electricalproducts are not very valuable (e.g. steel); therefore, thevalue of the waste fractions is low.
Market outlook
The market for products for electronic scrap handling andrecycling is in the growth stage. However, the future devel-opment depends on the implementation of the EU rules bythe individual member states (see Fig. 5.29).
The current market volume for electronic scrap handlingand recycling systems amounts to approx. 50 mill. EUR.
Countries such as Belgium, Denmark, Finland, the Nether-lands and Sweden have introduced so-called visible fees,i.e. the customer has to pay an additional fee for electricalappliances which is used for the installation of systems forcollection, handling and recycling of electronic scrap.
Competition
Waste management service companies such as Lassila &Tikanoja, RWE Umwelt and Van Gansewinkel are alreadyoperating systems for collection, handling and recycling ofelectronic scrap.
Plants and equipment for handling and recycling are sup-plied by various companies. Finnish companies also havevery competitive products in this area.
Conclusion
The market for plants and equipment for electronic scraphandling and recycling has a volume of approx. 50 mill.EUR. Further growth is determined by implementation ofthe EU rules.
There are already various suppliers for the required prod-ucts but opportunities certainly exist for new suppliers withinnovative solutions.
32
Equipment
Services
Plants,vehicles
Components
●
●
●
●
Metal separatorsSorting equipmentCathode ray tube processing etc.
Shredders
● Integrated plants
● New collection systems
Figure 5.28. Relevant products and services.
Introduction Growth Maturity Saturation Decline
Electronicscrap
handling/recycling
Salesrevenues
Productlife cycle
Figure 5.29. Product life cycle.
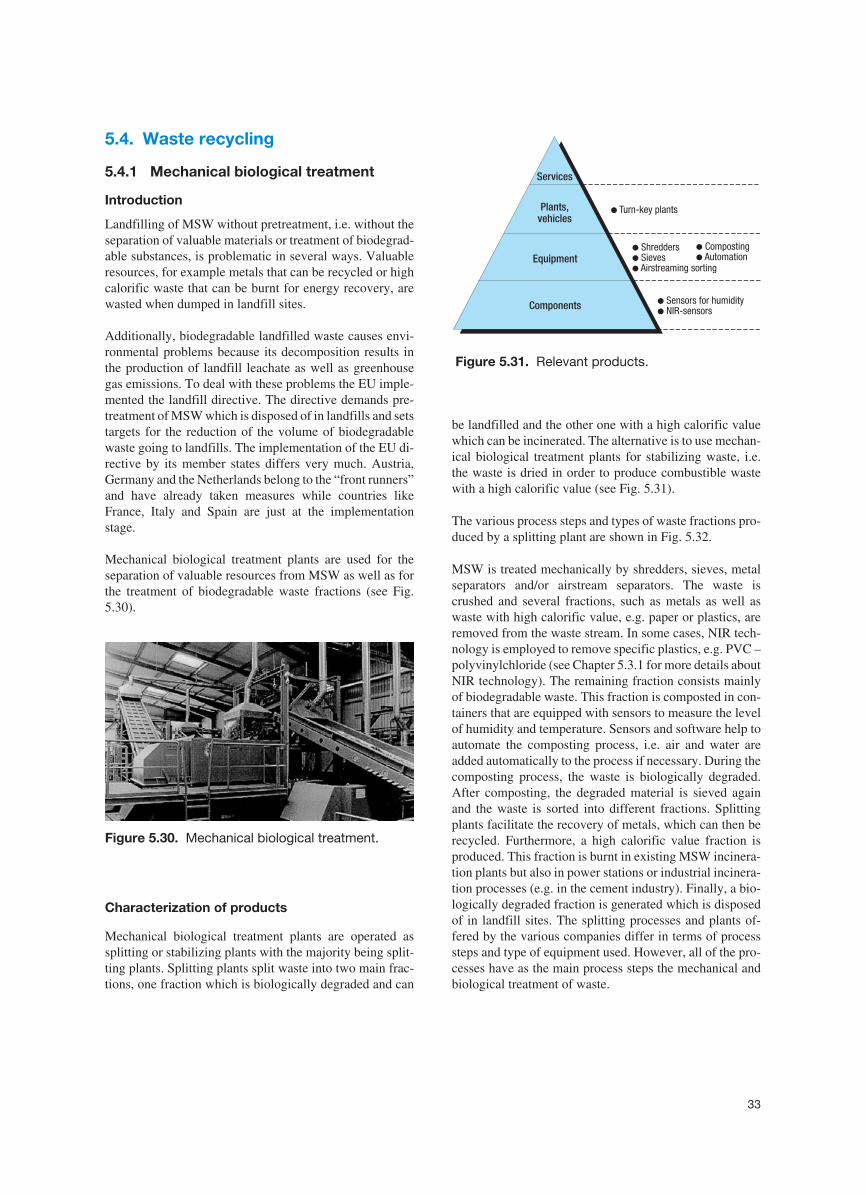
5.4. Waste recycling
5.4.1 Mechanical biological treatment
Introduction
Landfilling of MSW without pretreatment, i.e. without theseparation of valuable materials or treatment of biodegrad-able substances, is problematic in several ways. Valuableresources, for example metals that can be recycled or highcalorific waste that can be burnt for energy recovery, arewasted when dumped in landfill sites.
Additionally, biodegradable landfilled waste causes envi-ronmental problems because its decomposition results inthe production of landfill leachate as well as greenhousegas emissions. To deal with these problems the EU imple-mented the landfill directive. The directive demands pre-treatment of MSW which is disposed of in landfills and setstargets for the reduction of the volume of biodegradablewaste going to landfills. The implementation of the EU di-rective by its member states differs very much. Austria,Germany and the Netherlands belong to the “front runners”and have already taken measures while countries likeFrance, Italy and Spain are just at the implementationstage.
Mechanical biological treatment plants are used for theseparation of valuable resources from MSW as well as forthe treatment of biodegradable waste fractions (see Fig.5.30).
Characterization of products
Mechanical biological treatment plants are operated assplitting or stabilizing plants with the majority being split-ting plants. Splitting plants split waste into two main frac-tions, one fraction which is biologically degraded and can
be landfilled and the other one with a high calorific valuewhich can be incinerated. The alternative is to use mechan-ical biological treatment plants for stabilizing waste, i.e.the waste is dried in order to produce combustible wastewith a high calorific value (see Fig. 5.31).
The various process steps and types of waste fractions pro-duced by a splitting plant are shown in Fig. 5.32.
MSW is treated mechanically by shredders, sieves, metalseparators and/or airstream separators. The waste iscrushed and several fractions, such as metals as well aswaste with high calorific value, e.g. paper or plastics, areremoved from the waste stream. In some cases, NIR tech-nology is employed to remove specific plastics, e.g. PVC –polyvinylchloride (see Chapter 5.3.1 for more details aboutNIR technology). The remaining fraction consists mainlyof biodegradable waste. This fraction is composted in con-tainers that are equipped with sensors to measure the levelof humidity and temperature. Sensors and software help toautomate the composting process, i.e. air and water areadded automatically to the process if necessary. During thecomposting process, the waste is biologically degraded.After composting, the degraded material is sieved againand the waste is sorted into different fractions. Splittingplants facilitate the recovery of metals, which can then berecycled. Furthermore, a high calorific value fraction isproduced. This fraction is burnt in existing MSW incinera-tion plants but also in power stations or industrial incinera-tion processes (e.g. in the cement industry). Finally, a bio-logically degraded fraction is generated which is disposedof in landfill sites. The splitting processes and plants of-fered by the various companies differ in terms of processsteps and type of equipment used. However, all of the pro-cesses have as the main process steps the mechanical andbiological treatment of waste.
33
Figure 5.30. Mechanical biological treatment.
●
● NIR-sensorsSensors for humidity
●
●
●
SievesAirstreaming sorting
Shredders
● Turn-key plants
Equipment
Services
Plants,vehicles
Components
●
● AutomationComposting
Figure 5.31. Relevant products.
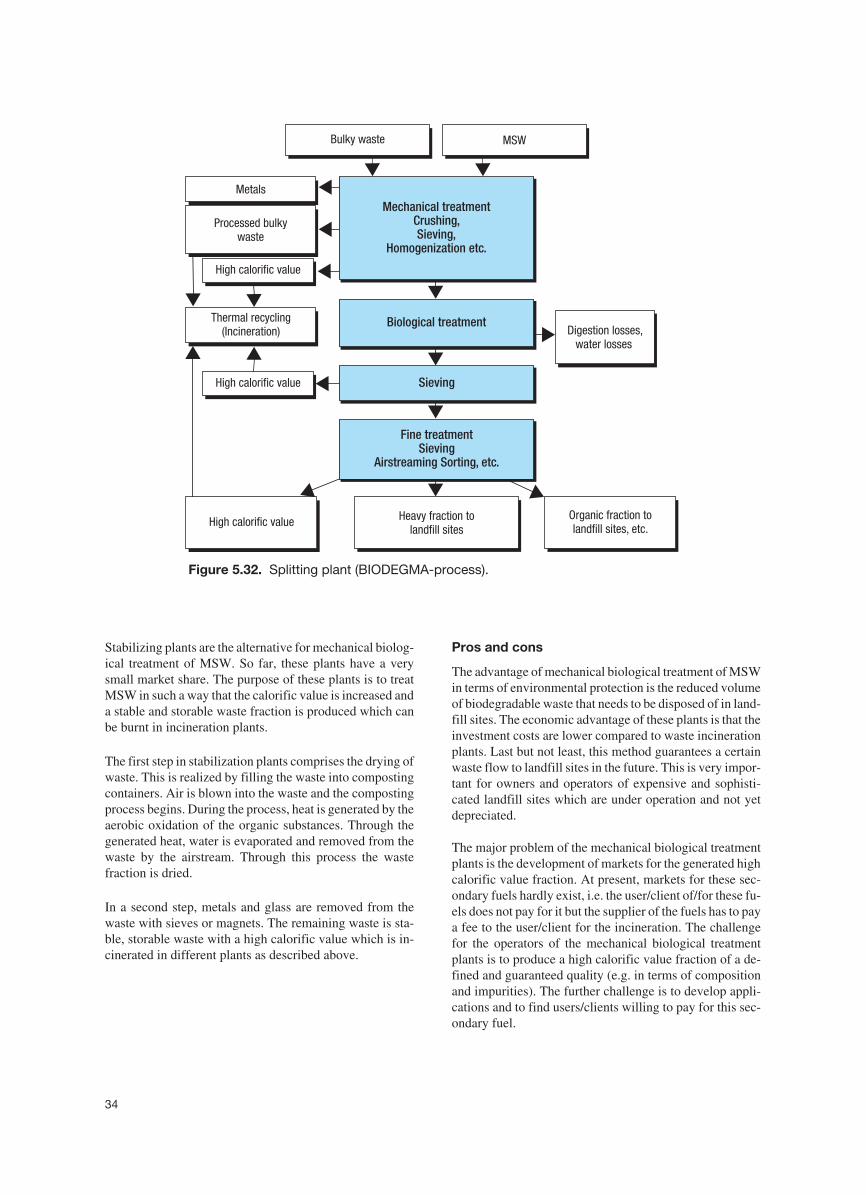
Stabilizing plants are the alternative for mechanical biolog-ical treatment of MSW. So far, these plants have a verysmall market share. The purpose of these plants is to treatMSW in such a way that the calorific value is increased anda stable and storable waste fraction is produced which canbe burnt in incineration plants.
The first step in stabilization plants comprises the drying ofwaste. This is realized by filling the waste into compostingcontainers. Air is blown into the waste and the compostingprocess begins. During the process, heat is generated by theaerobic oxidation of the organic substances. Through thegenerated heat, water is evaporated and removed from thewaste by the airstream. Through this process the wastefraction is dried.
In a second step, metals and glass are removed from thewaste with sieves or magnets. The remaining waste is sta-ble, storable waste with a high calorific value which is in-cinerated in different plants as described above.
Pros and cons
The advantage of mechanical biological treatment of MSWin terms of environmental protection is the reduced volumeof biodegradable waste that needs to be disposed of in land-fill sites. The economic advantage of these plants is that theinvestment costs are lower compared to waste incinerationplants. Last but not least, this method guarantees a certainwaste flow to landfill sites in the future. This is very impor-tant for owners and operators of expensive and sophisti-cated landfill sites which are under operation and not yetdepreciated.
The major problem of the mechanical biological treatmentplants is the development of markets for the generated highcalorific value fraction. At present, markets for these sec-ondary fuels hardly exist, i.e. the user/client of/for these fu-els does not pay for it but the supplier of the fuels has to paya fee to the user/client for the incineration. The challengefor the operators of the mechanical biological treatmentplants is to produce a high calorific value fraction of a de-fined and guaranteed quality (e.g. in terms of compositionand impurities). The further challenge is to develop appli-cations and to find users/clients willing to pay for this sec-ondary fuel.
34
Biological treatment
Heavy fraction tolandfill sites
Organic fraction tolandfill sites, etc.
Digestion losses,water losses
Bulky waste MSW
Mechanical treatmentCrushing,Sieving,
Homogenization etc.
Sieving
Fine treatmentSieving
Airstreaming Sorting, etc.
Metals
Processed bulkywaste
High calorific value
Thermal recycling(Incineration)
High calorific value
High calorific value
Figure 5.32. Splitting plant (BIODEGMA-process).
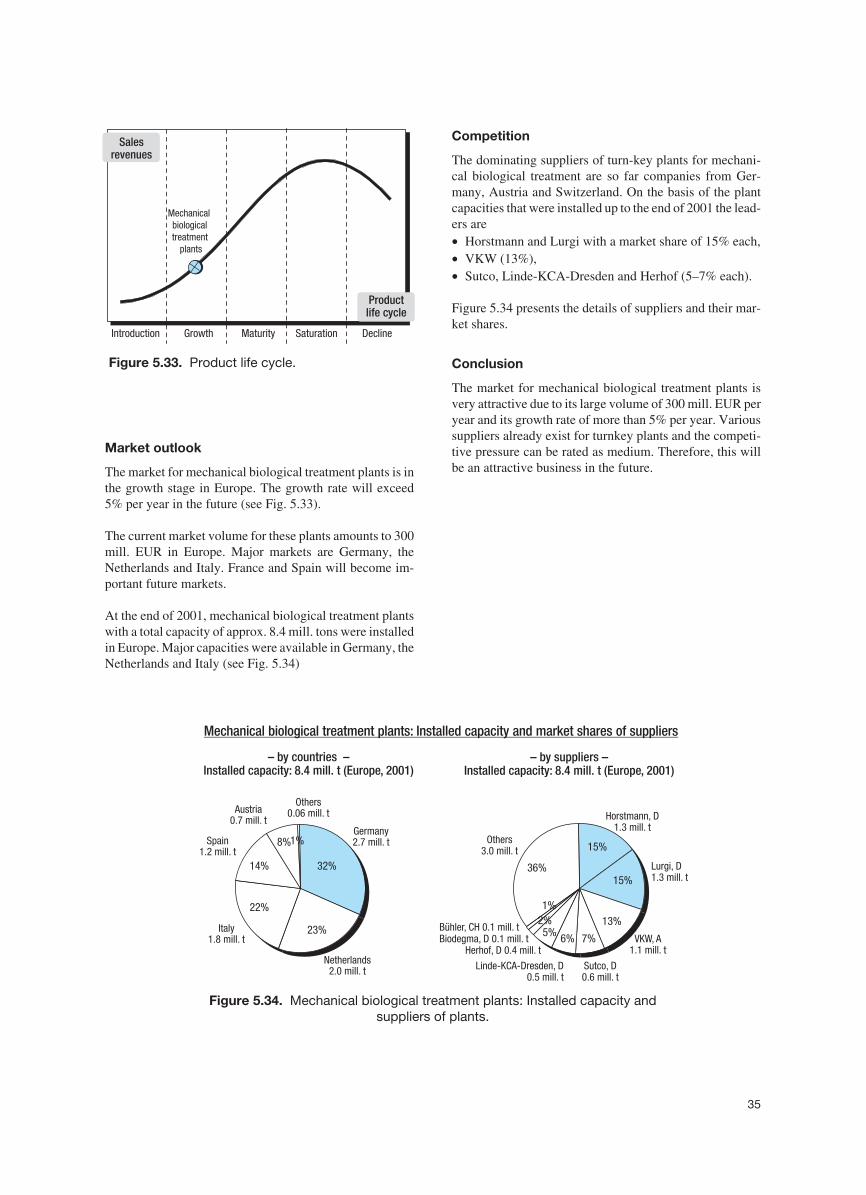
Market outlook
The market for mechanical biological treatment plants is inthe growth stage in Europe. The growth rate will exceed5% per year in the future (see Fig. 5.33).
The current market volume for these plants amounts to 300mill. EUR in Europe. Major markets are Germany, theNetherlands and Italy. France and Spain will become im-portant future markets.
At the end of 2001, mechanical biological treatment plantswith a total capacity of approx. 8.4 mill. tons were installedin Europe. Major capacities were available in Germany, theNetherlands and Italy (see Fig. 5.34)
Competition
The dominating suppliers of turn-key plants for mechani-cal biological treatment are so far companies from Ger-many, Austria and Switzerland. On the basis of the plantcapacities that were installed up to the end of 2001 the lead-ers are• Horstmann and Lurgi with a market share of 15% each,• VKW (13%),• Sutco, Linde-KCA-Dresden and Herhof (5–7% each).
Figure 5.34 presents the details of suppliers and their mar-ket shares.
Conclusion
The market for mechanical biological treatment plants isvery attractive due to its large volume of 300 mill. EUR peryear and its growth rate of more than 5% per year. Varioussuppliers already exist for turnkey plants and the competi-tive pressure can be rated as medium. Therefore, this willbe an attractive business in the future.
35
13%
15%
15%
6% 7%5%
1%2%
36%
– by countries –Installed capacity: 8.4 mill. t (Europe, 2001)
– by suppliers –Installed capacity: 8.4 mill. t (Europe, 2001)
Mechanical biological treatment plants: Installed capacity and market shares of suppliers
23%
1%
14%
8%
32%
23%
22%
Germany2.7 mill. t
Austria0.7 mill. t
Italy1.8 mill. t
Spain1.2 mill. t
Others0.06 mill. t
Netherlands2.0 mill. t
Others3.0 mill. t
Horstmann, D1.3 mill. t
Lurgi, D1.3 mill. t
VKW, A1.1 mill. t
Sutco, D0.6 mill. t
Linde0.5 mill. t
-KCA-Dresden, D
Herhof, D 0.4 mill. tBiodegma, D 0.1 mill. tBühler, CH 0.1 mill. t
Figure 5.34. Mechanical biological treatment plants: Installed capacity andsuppliers of plants.
Introduction Growth Maturity Saturation Decline
Mechanicalbiologicaltreatment
plants
Salesrevenues
Productlife cycle
Figure 5.33. Product life cycle.
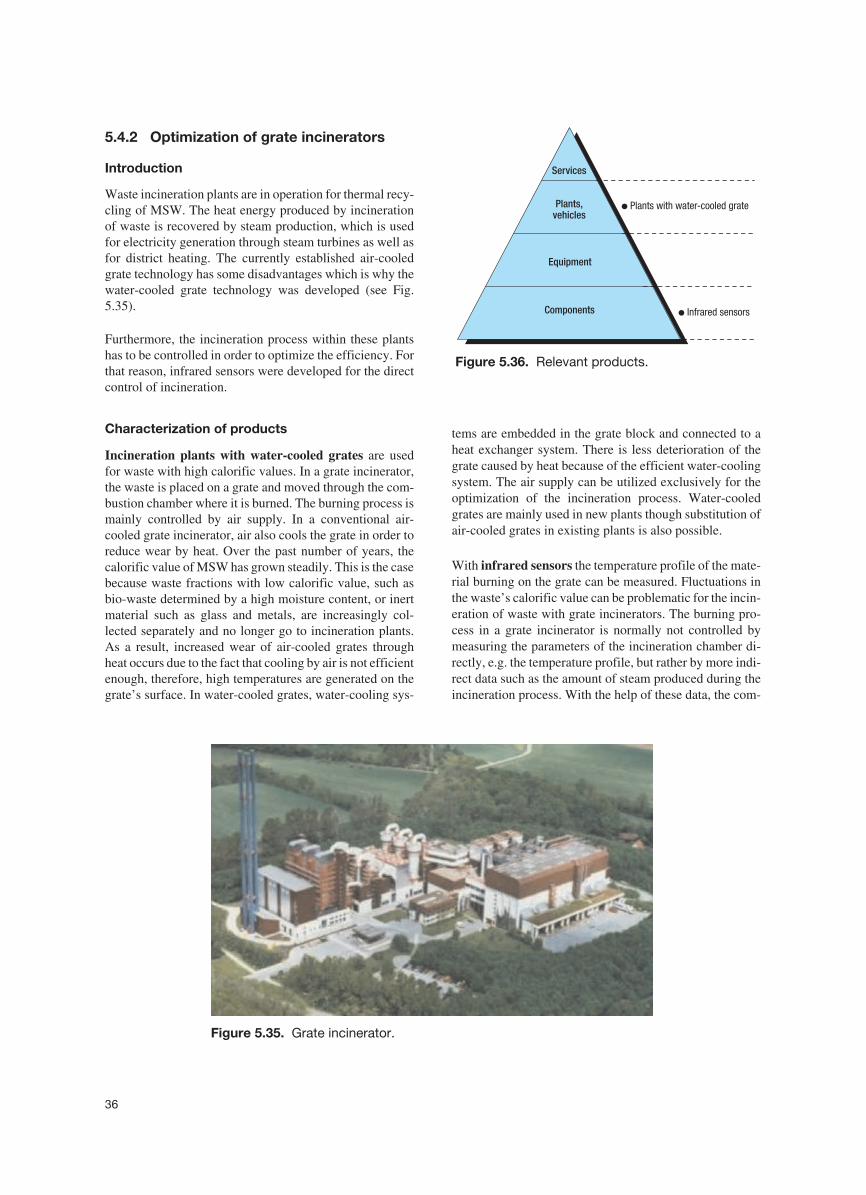
5.4.2 Optimization of grate incinerators
Introduction
Waste incineration plants are in operation for thermal recy-cling of MSW. The heat energy produced by incinerationof waste is recovered by steam production, which is usedfor electricity generation through steam turbines as well asfor district heating. The currently established air-cooledgrate technology has some disadvantages which is why thewater-cooled grate technology was developed (see Fig.5.35).
Furthermore, the incineration process within these plantshas to be controlled in order to optimize the efficiency. Forthat reason, infrared sensors were developed for the directcontrol of incineration.
Characterization of products
Incineration plants with water-cooled grates are usedfor waste with high calorific values. In a grate incinerator,the waste is placed on a grate and moved through the com-bustion chamber where it is burned. The burning process ismainly controlled by air supply. In a conventional air-cooled grate incinerator, air also cools the grate in order toreduce wear by heat. Over the past number of years, thecalorific value of MSW has grown steadily. This is the casebecause waste fractions with low calorific value, such asbio-waste determined by a high moisture content, or inertmaterial such as glass and metals, are increasingly col-lected separately and no longer go to incineration plants.As a result, increased wear of air-cooled grates throughheat occurs due to the fact that cooling by air is not efficientenough, therefore, high temperatures are generated on thegrate’s surface. In water-cooled grates, water-cooling sys-
tems are embedded in the grate block and connected to aheat exchanger system. There is less deterioration of thegrate caused by heat because of the efficient water-coolingsystem. The air supply can be utilized exclusively for theoptimization of the incineration process. Water-cooledgrates are mainly used in new plants though substitution ofair-cooled grates in existing plants is also possible.
With infrared sensors the temperature profile of the mate-rial burning on the grate can be measured. Fluctuations inthe waste’s calorific value can be problematic for the incin-eration of waste with grate incinerators. The burning pro-cess in a grate incinerator is normally not controlled bymeasuring the parameters of the incineration chamber di-rectly, e.g. the temperature profile, but rather by more indi-rect data such as the amount of steam produced during theincineration process. With the help of these data, the com-
36
Figure 5.35. Grate incinerator.
● Infrared sensors
● Plants with water-cooled grate
Equipment
Services
Plants,vehicles
Components
Figure 5.36. Relevant products.
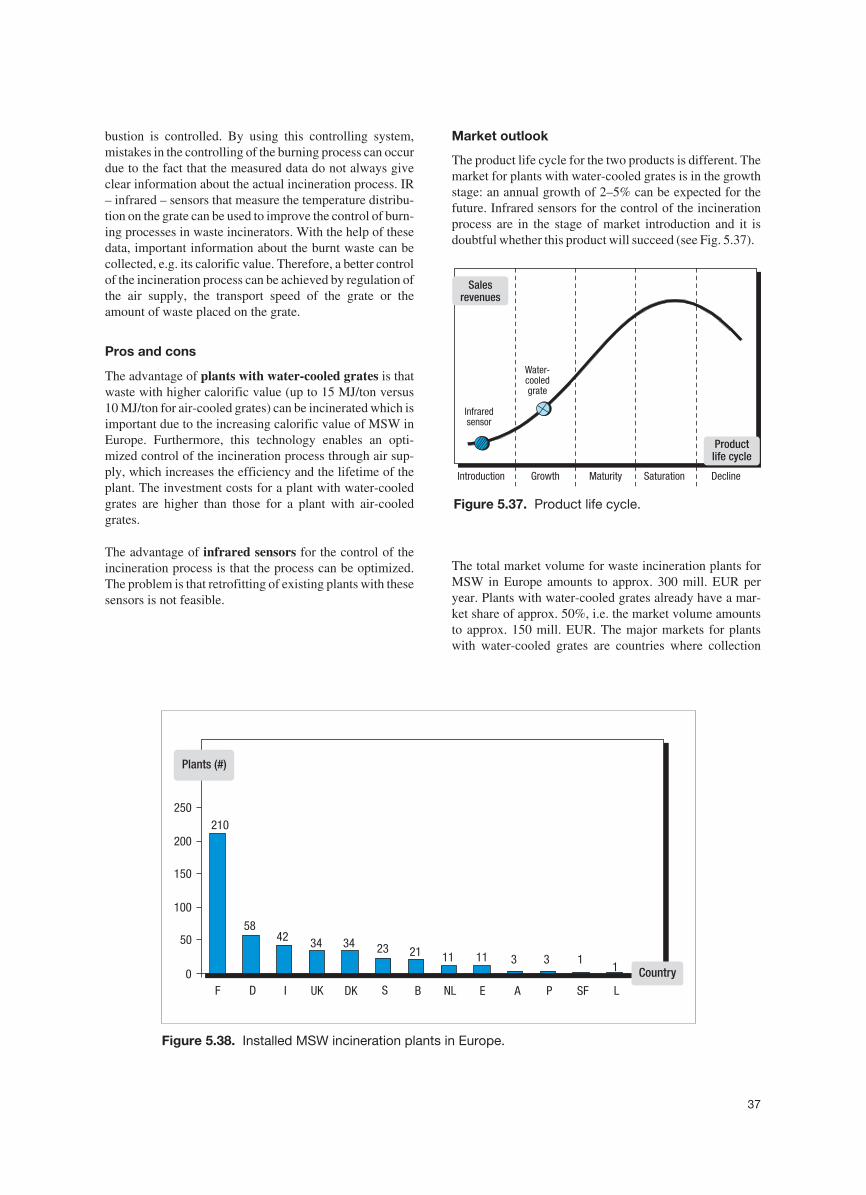
bustion is controlled. By using this controlling system,mistakes in the controlling of the burning process can occurdue to the fact that the measured data do not always giveclear information about the actual incineration process. IR– infrared – sensors that measure the temperature distribu-tion on the grate can be used to improve the control of burn-ing processes in waste incinerators. With the help of thesedata, important information about the burnt waste can becollected, e.g. its calorific value. Therefore, a better controlof the incineration process can be achieved by regulation ofthe air supply, the transport speed of the grate or theamount of waste placed on the grate.
Pros and cons
The advantage of plants with water-cooled grates is thatwaste with higher calorific value (up to 15 MJ/ton versus10 MJ/ton for air-cooled grates) can be incinerated which isimportant due to the increasing calorific value of MSW inEurope. Furthermore, this technology enables an opti-mized control of the incineration process through air sup-ply, which increases the efficiency and the lifetime of theplant. The investment costs for a plant with water-cooledgrates are higher than those for a plant with air-cooledgrates.
The advantage of infrared sensors for the control of theincineration process is that the process can be optimized.The problem is that retrofitting of existing plants with thesesensors is not feasible.
Market outlook
The product life cycle for the two products is different. Themarket for plants with water-cooled grates is in the growthstage: an annual growth of 2–5% can be expected for thefuture. Infrared sensors for the control of the incinerationprocess are in the stage of market introduction and it isdoubtful whether this product will succeed (see Fig. 5.37).
The total market volume for waste incineration plants forMSW in Europe amounts to approx. 300 mill. EUR peryear. Plants with water-cooled grates already have a mar-ket share of approx. 50%, i.e. the market volume amountsto approx. 150 mill. EUR. The major markets for plantswith water-cooled grates are countries where collection
37
Introduction Growth Maturity Saturation Decline
Water-cooledgrate
Infraredsensor
Salesrevenues
Productlife cycle
Figure 5.37. Product life cycle.
3 11
21 11
42 34 34 2311 3
210
58
0
50
100
150
200
250
F D I UK DK S B NL E A P SF L
Plants (#)
Country
Figure 5.38. Installed MSW incineration plants in Europe.
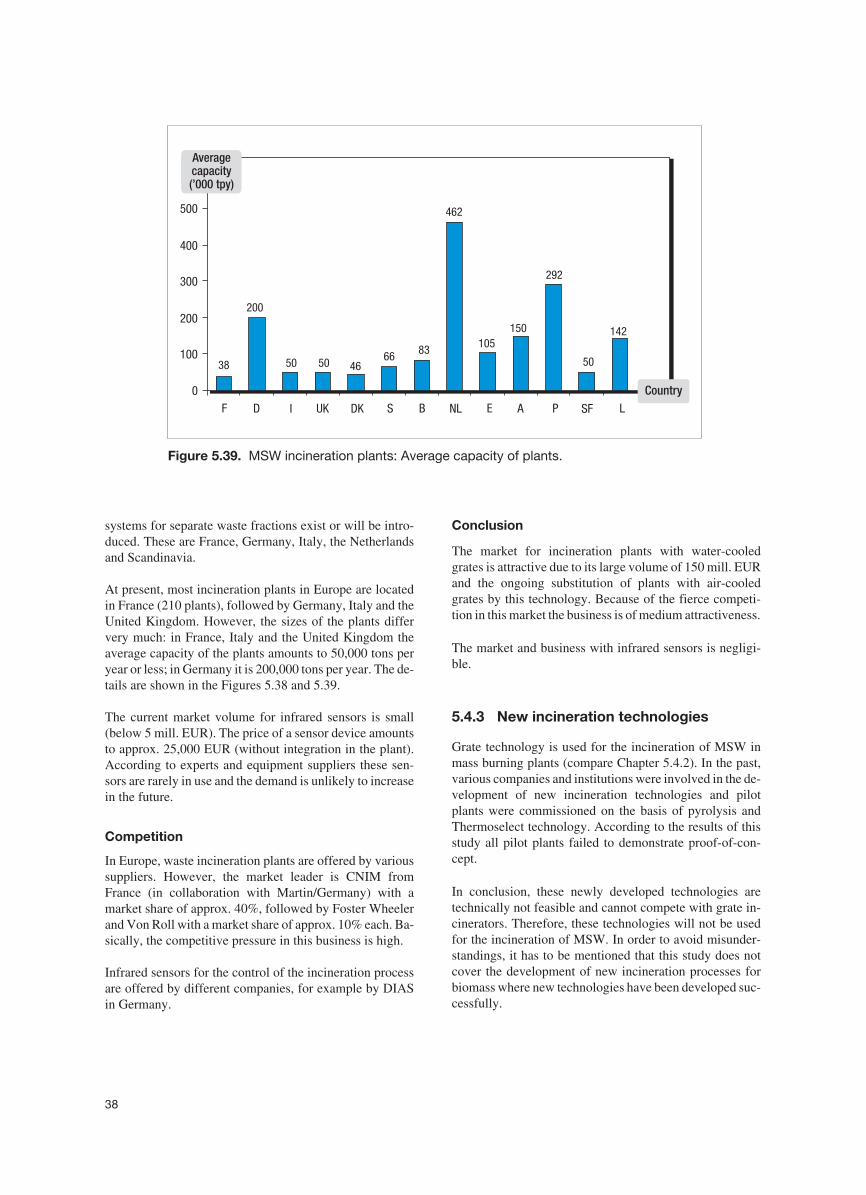
systems for separate waste fractions exist or will be intro-duced. These are France, Germany, Italy, the Netherlandsand Scandinavia.
At present, most incineration plants in Europe are locatedin France (210 plants), followed by Germany, Italy and theUnited Kingdom. However, the sizes of the plants differvery much: in France, Italy and the United Kingdom theaverage capacity of the plants amounts to 50,000 tons peryear or less; in Germany it is 200,000 tons per year. The de-tails are shown in the Figures 5.38 and 5.39.
The current market volume for infrared sensors is small(below 5 mill. EUR). The price of a sensor device amountsto approx. 25,000 EUR (without integration in the plant).According to experts and equipment suppliers these sen-sors are rarely in use and the demand is unlikely to increasein the future.
Competition
In Europe, waste incineration plants are offered by varioussuppliers. However, the market leader is CNIM fromFrance (in collaboration with Martin/Germany) with amarket share of approx. 40%, followed by Foster Wheelerand Von Roll with a market share of approx. 10% each. Ba-sically, the competitive pressure in this business is high.
Infrared sensors for the control of the incineration processare offered by different companies, for example by DIASin Germany.
Conclusion
The market for incineration plants with water-cooledgrates is attractive due to its large volume of 150 mill. EURand the ongoing substitution of plants with air-cooledgrates by this technology. Because of the fierce competi-tion in this market the business is of medium attractiveness.
The market and business with infrared sensors is negligi-ble.
5.4.3 New incineration technologies
Grate technology is used for the incineration of MSW inmass burning plants (compare Chapter 5.4.2). In the past,various companies and institutions were involved in the de-velopment of new incineration technologies and pilotplants were commissioned on the basis of pyrolysis andThermoselect technology. According to the results of thisstudy all pilot plants failed to demonstrate proof-of-con-cept.
In conclusion, these newly developed technologies aretechnically not feasible and cannot compete with grate in-cinerators. Therefore, these technologies will not be usedfor the incineration of MSW. In order to avoid misunder-standings, it has to be mentioned that this study does notcover the development of new incineration processes forbiomass where new technologies have been developed suc-cessfully.
38
50
292
142
83
462
50 50 4666
105150
38
200
0
100
200
300
400
500
F D I UK DK S B NL E A P SF L
Averagecapacity(’000 tpy)
Country
Figure 5.39. MSW incineration plants: Average capacity of plants.
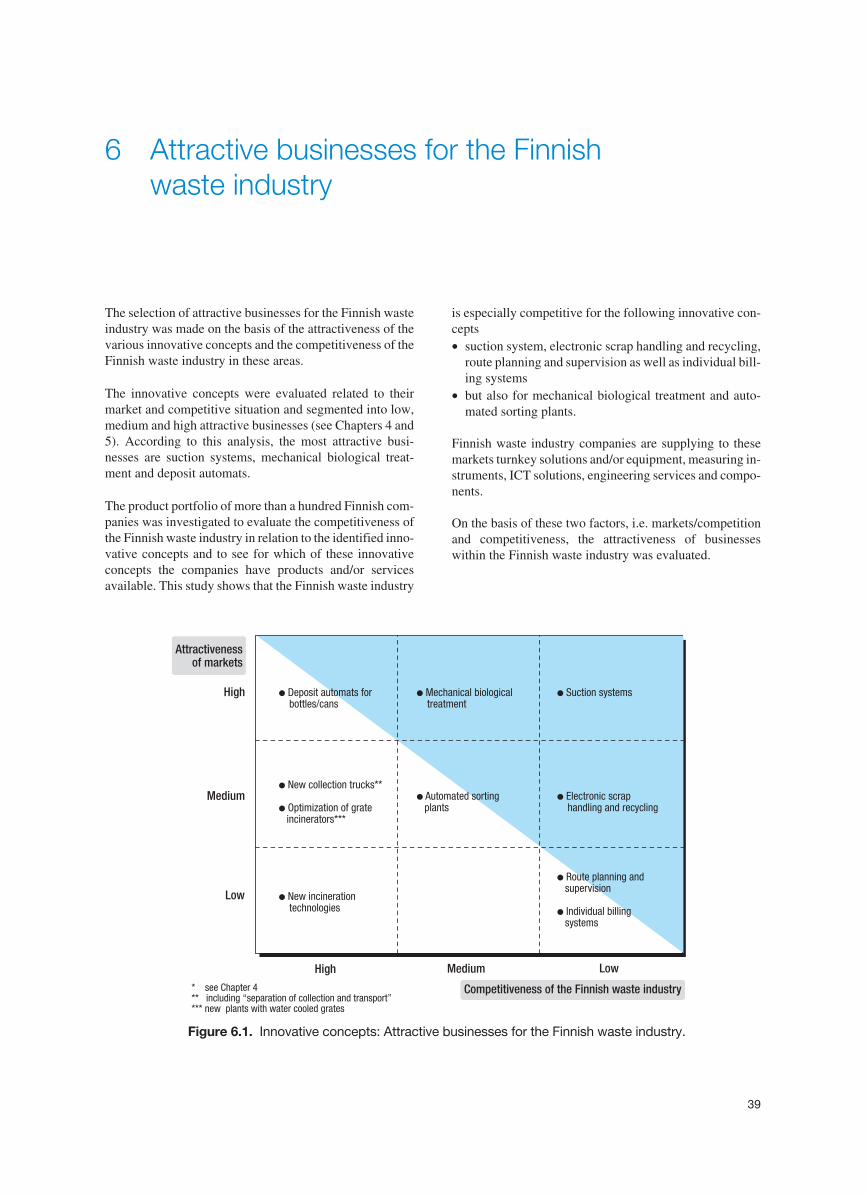
6 Attractive businesses for the Finnishwaste industry
The selection of attractive businesses for the Finnish wasteindustry was made on the basis of the attractiveness of thevarious innovative concepts and the competitiveness of theFinnish waste industry in these areas.
The innovative concepts were evaluated related to theirmarket and competitive situation and segmented into low,medium and high attractive businesses (see Chapters 4 and5). According to this analysis, the most attractive busi-nesses are suction systems, mechanical biological treat-ment and deposit automats.
The product portfolio of more than a hundred Finnish com-panies was investigated to evaluate the competitiveness ofthe Finnish waste industry in relation to the identified inno-vative concepts and to see for which of these innovativeconcepts the companies have products and/or servicesavailable. This study shows that the Finnish waste industry
is especially competitive for the following innovative con-cepts• suction system, electronic scrap handling and recycling,
route planning and supervision as well as individual bill-ing systems
• but also for mechanical biological treatment and auto-mated sorting plants.
Finnish waste industry companies are supplying to thesemarkets turnkey solutions and/or equipment, measuring in-struments, ICT solutions, engineering services and compo-nents.
On the basis of these two factors, i.e. markets/competitionand competitiveness, the attractiveness of businesseswithin the Finnish waste industry was evaluated.
39
High
Medium
Low
High Medium Low
Competitiveness of the Finnish waste industry
●
●
supervision
Individual billingsystems
Route planning and
●
technologiesNew incineration
● Suction systems●
treatmentMechanical biological
●
● Optimization of grateincinerators***
New collection trucks**●
plantsAutomated sorting ●
handling and recyclingElectronic scrap
● Deposit automats forbottles/cans
* Chapter 4** including “separation of collection and transport”*** new plants with water cooled grates
see
Attractivenessof markets
Figure 6.1. Innovative concepts: Attractive businesses for the Finnish waste industry.
The employed method shows that the most attractive busi-nesses for the Finnish waste industry in the European mar-kets are
• suction systems, mechanical biological treatment andelectronic scrap handling/recycling.
The markets for
• deposit automats, automated sorting plants, route plan-ning and supervision as well as individual billing sys-tems (see Fig. 6.1).
have medium attractiveness.
In total, the Finnish waste industry already has an exportrate of 50%, i.e. half of the business is carried out in inter-
national markets. The results of the study show that theFinnish waste industry has attractive products available forthe growing markets for innovative concepts in Europe.Therefore, the potential exists to maintain and to optimizeFinland’s current position in international markets.
To avoid misunderstandings it has to be mentioned thatthese are results at industry level. The potential that existsfor individual companies in relation to the different innova-tive concepts has to be evaluated by each company. There-fore, it also might be the case that a market that is ranked asnot very attractive in this study is indeed very attractive foran individual company. However, the findings of this anal-ysis can serve as a basis for the development of product andmarket strategies of Finnish companies.
40
Technology Reviews from Tekes
41
147/2003 Innovative waste management products – European market survey. Christoph Genter. 40 p.
146/2003 Elektroniikan lämmönhallinta. Simo Keskinen. 8 s.
145/2003 Meriklusterikatsauksen englanninkielinen versio.
144/2003 Tracing Knowledge Flows in the Finnish Innovation System – A Study of US Patents Grantedto Finnish University Researchers. Martin Meyer, Tanja Siniläinen, Jan Timm Utecht,Olle Persson, Jianzhong Hong. 36 p.
143/2003 Paikannus mobiilipalveluissa ja sovelluksissa. Antti Rainio. 75 s.
142/2003 Innovaatio investointina. Osa 1. Rahoitusteoreettinen näkökulma Tekesin vaikuttavuuteen.Mika Vaihekoski, Seppo Leminen, Joonas Pekkanen, Jussi Tiilikka
141/2003 Suomen bioteollisuuden bioprosessitekniset tarpeet
140/2003 Suomen meriklusteri. Mikko Viitanen, Tapio Karvonen, Johanna Vaiste, Hannu Hernesniemi. 190 s.
139/2003 Innovaatioita metsästämässä – media valinkauhassa. Ulf Lindqvist, Timo Siivonen,Caj Södergård. 44 s.
138/2003 Finland’s Wireless Valley: Domestic Politics, Globalizing Industry. Dan Steinbock.
137/2003 Kohti kansainvälistä arvoverkottunutta rakentamista - Linjaukset rakennusklusterin teknologia-ohjelman kansainvälistymiselle. Towards Value Networks in Construction - Outlining Inter-natioalization for the Building Cluster Technology Program. Tapio Koivu, Hans Björnsson.
136/2003 Verkostotalouden uudet sovellukset – Aihealueen tulevaisuuden suuntauksia ja kehittämis-tarpeita. Klaus Oesch, Anssi Varesmaa, Tero Nummenpää, Petri Vuorimaa. 78 s.
135/2003 Uuden sukupolven teknologiaohjelmia etsimässä.
134/2003 Insights into services and innovation in the knowledge-intensive economy. Dr Jari Kuusisto,Dr Martin Meyer. 62 p.
133/2002 Independent living market in Germany, UK, Italy, Belgium and the Netherlands. ChristineGrumbach, Finpro Germany, Merja Heikelä and Timothy Skilton, Finpro UK, Anneli Okkonen,Finpro Italy, Katja Haukipuro, Finpro Belgium, and Ritva Huisman, Finpro UK-Benelux. 199 p.
132/2002 Technological Trends and Needs in Food Diagnostics. Gabriela von Blankenfeld-Enkvist,Malin Brännback. 33 p.
131/2002 Elintarviketeollisuuden teknologiaennakointi ja tutkimuksen arviointi. Mari Hjelt, Totti Könnölä,Päivi Luoma. 130 s.
130/2002 Lääkevalvonta bioteknisessä tuotekehityksessä. Outi Nieminen, Katrina Nordström. 35 s.
129/2002 Bioinformatiikka Suomessa. Katri Ylönen, Erja Heikkinen, Marjo Uusikylä. 43 s.
128/2002 Arktinen teknologia suomalaisten yritysten liiketoimintastrategioissa. 63 s.
127/2002 US Fitness Industry Market Overview and Entry Strategies. Val Arthur Kratzman. 73 p.
126/2002 Particle technologies in diagnostics. Harri Härmä. 29 p.
125/2002 Nucleic acid diagnostics markets – Unmet needs and product potentials. Harri Siitari. 27 p.
124/2002 Polttopuun pientuotannon ja -käytön kehitystarpeet. Satu Helynen, Heikki Oravainen. 26 s.
123/2002 US Corporate Wellness Study. 88 p.
Subscriptions: www.tekes.fi/english/publications


