48
Semi-Annual Report for AmPRS - Islamic Equity Fund 29 February 2020
Semi-Annual Report for
AmPRS - Islamic Equity Fund29 February 2020
AmPRS – Islamic Equity Fund
TRUST DIRECTORY
PRS Provider AmFunds Management Berhad
9th & 10th Floor, Bangunan AmBank Group 55 Jalan Raja Chulan 50200 Kuala Lumpur
Board of Directors Jeyaratnam A/L Tamotharam Pillai
Dato’ Mustafa Bin Mohd Nor Tai Terk Lin
Sum Leng Kuang Goh Wee Peng
Investment Committee Sum Leng Kuang
Tai Terk Lin Dato’ Mustafa Bin Mohd Nor
Zainal Abidin Bin Mohd Kassim Goh Wee Peng
Investment Manager AmIslamic Funds Management Sdn Bhd
Audit and Risk Management Committee Sum Leng Kuang
Tai Terk Lin Dato’ Mustafa Bin Mohd Nor
Trustee Deutsche Trustees Malaysia Berhad
Shariah Adviser Amanie Advisors Sdn Bhd
Auditors and Reporting Accountants Ernst & Young PLT
Taxation Adviser Deloitte Tax Services Sdn Bhd
AmPRS – Islamic Equity Fund
CONTENTS
1 PRS Provider’s Report
10 Condensed Statement of Financial Position
11 Condensed Statement of Comprehensive Income
12 Condensed Statement of Changes in Equity
13 Condensed Statement of Cash Flows
14 Notes to the Condensed Financial Statements
41 Statement by the PRS Provider
42 Scheme Trustee’s Report
43 Report of the Shariah Adviser to the Members
44 Directory
1
PRS PROVIDER’S REPORT Dear Members, We are pleased to present you the PRS Provider’s report and the unaudited accounts of AmPRS – Islamic Equity Fund (“Fund”) for the financial period from 1 September 2019 to 29 February 2020. Salient Information of the Fund
Name
AmPRS – Islamic Equity Fund (“Fund”)
Category/Type
Equity (Islamic) / Growth
Objective AmPRS – Islamic Equity Fund aims to provide Long Term capital growth by investing primarily in Shariah Compliant equities and/or equity-related securities. Note: Any material change to the investment objective of the Fund would require Members’ approval.
Performance Benchmark
40% FTSE Bursa Malaysia Emas Shariah Index
30% MSCI AC Asia Pacific Islamic ex Japan Index
30% Quantshop Medium* GII Index (obtainable from www.aminvest.com)
Note: *Medium means the duration is between three (3) years to seven (7) years.
Source: FTSE International Limited ("FTSE") © FTSE 2020. "FTSE®" is a trade mark of the London Stock Exchange Group companies and is used by FTSE International Limited under licence. "BURSA MALAYSIA" is a trade mark of Bursa Malaysia Berhad ("BURSA MALAYSIA"). All intellectual property rights in the index values and constituent list vests in FTSE and BURSA MALAYSIA. Neither FTSE nor its licensors accept any liability for any errors or omissions in the FTSE indices and / or FTSE ratings or underlying data. No further distribution of FTSE Data is permitted without FTSE’s express written consent. Source: MSCI. The MSCI information may only be used for your internal use, may not be reproduced or redisseminated in any form and may not be used as a basis for or a component of any financial instruments or products or indices. None of the MSCI information is intended to constitute investment advice or a recommendation to make (or refrain from making) any kind of investment decision and may not be relied on as such. Historical data and analysis should not be taken as an indication or guarantee of any future performance analysis, forecast or prediction. The MSCI information is provided on an “as is” basis and the user of this information assumes the entire risk of any use made of this information. MSCI, each of its affiliates and each other person involved in or related to compiling, computing or creating any MSCI information (collectively, the “MSCI Parties”) expressly disclaims all warranties (including, without limitation, any warranties of originality, accuracy, completeness, timeliness, non-infringement, merchantability and fitness for a particular purpose) with respect to this information. Without limiting any of the foregoing, in no event shall any MSCI Party have any liability for any direct, indirect, special, incidental, punitive, consequential (including, without limitation, lost profits) or any other damages. (www.msci.com).
2
The blended returns are calculated by AmFunds Management Berhad using end of day index level values licensed from MSCI (“MSCI Data”). For the avoidance of doubt, MSCI is not the benchmark “administrator” for, or a “contributor”, “submitter” or “supervised contributor” to, the blended returns, and the MSCI Data is not considered a “contribution” or “submission” in relation to the blended returns, as those terms may be defined in any rules, laws, regulations, legislation or international standards. MSCI Data is provided “AS IS” without warranty or liability and no copying or distribution is permitted. MSCI does not make any representation regarding the advisability of any investment or strategy and does not sponsor, promote, issue, sell or otherwise recommend or endorse any investment or strategy, including any financial products or strategies based on, tracking or otherwise utilizing any MSCI Data, models, analytics or other materials or information. Note: Blended return refers to returns from blending the end of day index level values of: (i) one or more MSCI Index(es); and (ii) one or more non MSCI index (es).
Income Distribution Policy
Subject to availability of income, distribution (if any) is incidental. Note: Income distribution (if any) will be in the forms of units.
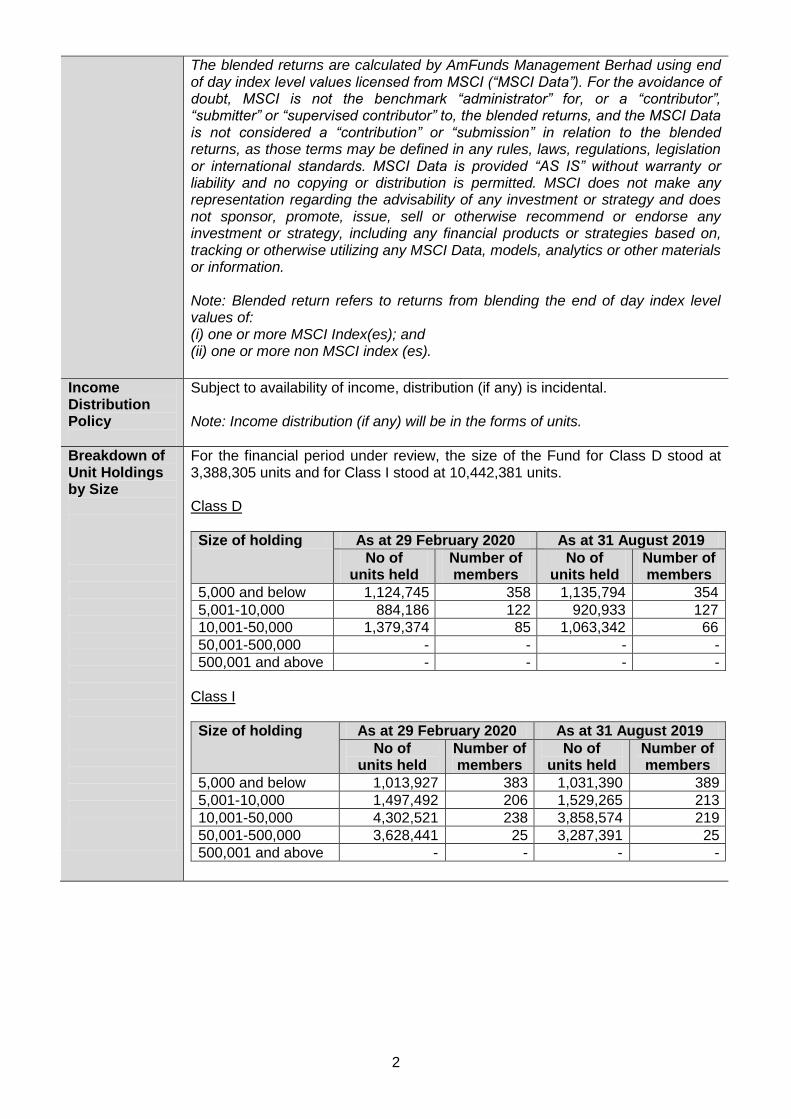
Breakdown of Unit Holdings by Size
For the financial period under review, the size of the Fund for Class D stood at 3,388,305 units and for Class I stood at 10,442,381 units. Class D
Size of holding As at 29 February 2020 As at 31 August 2019
No of units held
Number of members
No of units held
Number of members
5,000 and below 1,124,745 358 1,135,794 354
5,001-10,000 884,186 122 920,933 127
10,001-50,000 1,379,374 85 1,063,342 66
50,001-500,000 - - - -
500,001 and above - - - -
Class I
Size of holding As at 29 February 2020 As at 31 August 2019
No of units held
Number of members
No of units held
Number of members
5,000 and below 1,013,927 383 1,031,390 389
5,001-10,000 1,497,492 206 1,529,265 213
10,001-50,000 4,302,521 238 3,858,574 219
50,001-500,000 3,628,441 25 3,287,391 25
500,001 and above - - - -
3
Fund Performance Data
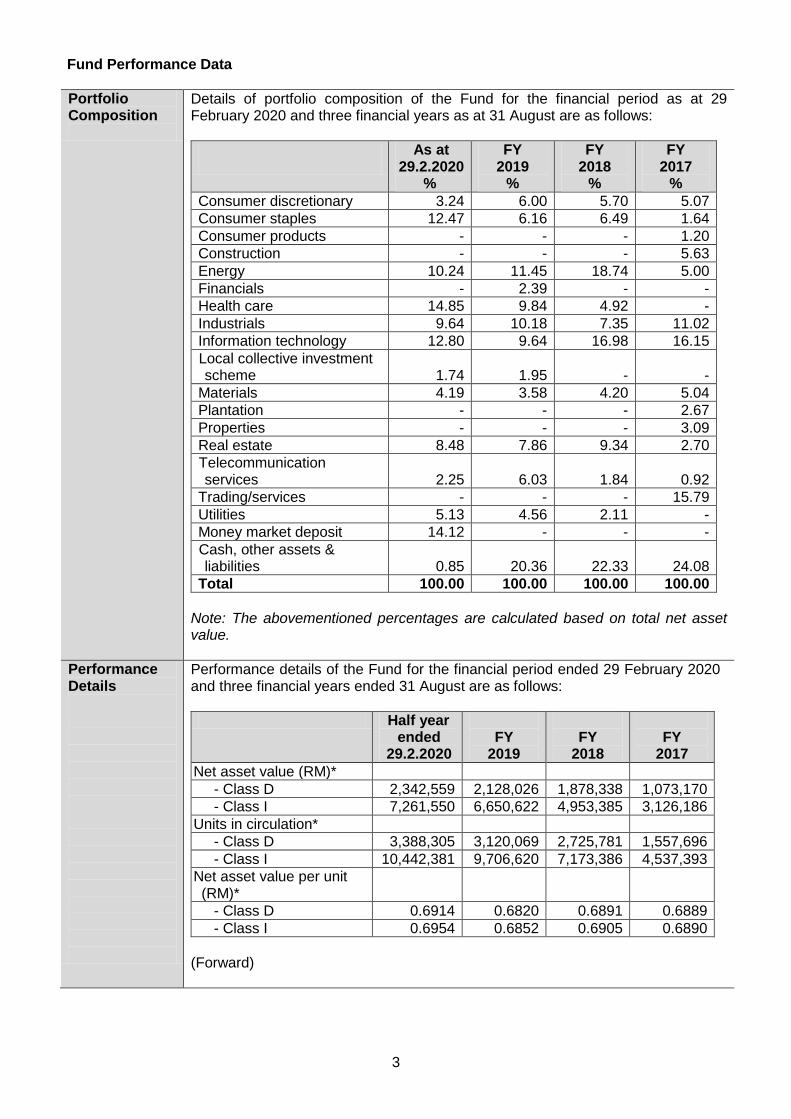
Portfolio Composition
Details of portfolio composition of the Fund for the financial period as at 29 February 2020 and three financial years as at 31 August are as follows:
As at 29.2.2020
%
FY 2019
%
FY 2018
%
FY 2017
%
Consumer discretionary 3.24 6.00 5.70 5.07
Consumer staples 12.47 6.16 6.49 1.64
Consumer products - - - 1.20
Construction - - - 5.63
Energy 10.24 11.45 18.74 5.00
Financials - 2.39 - -
Health care 14.85 9.84 4.92 -
Industrials 9.64 10.18 7.35 11.02
Information technology 12.80 9.64 16.98 16.15
Local collective investment scheme 1.74 1.95 - -
Materials 4.19 3.58 4.20 5.04
Plantation - - - 2.67
Properties - - - 3.09
Real estate 8.48 7.86 9.34 2.70
Telecommunication services
2.25
6.03
1.84
0.92
Trading/services - - - 15.79
Utilities 5.13 4.56 2.11 -
Money market deposit 14.12 - - -
Cash, other assets & liabilities
0.85
20.36
22.33
24.08
Total 100.00 100.00 100.00 100.00
Note: The abovementioned percentages are calculated based on total net asset value.
Performance Details
Performance details of the Fund for the financial period ended 29 February 2020 and three financial years ended 31 August are as follows:
Half year ended
29.2.2020
FY
2019
FY
2018
FY
2017
Net asset value (RM)*
- Class D 2,342,559 2,128,026 1,878,338 1,073,170
- Class I 7,261,550 6,650,622 4,953,385 3,126,186
Units in circulation*
- Class D 3,388,305 3,120,069 2,725,781 1,557,696
- Class I 10,442,381 9,706,620 7,173,386 4,537,393
Net asset value per unit (RM)*
- Class D 0.6914 0.6820 0.6891 0.6889
- Class I 0.6954 0.6852 0.6905 0.6890
(Forward)
4
Half year ended
29.2.2020
FY
2019
FY
2018
FY
2017
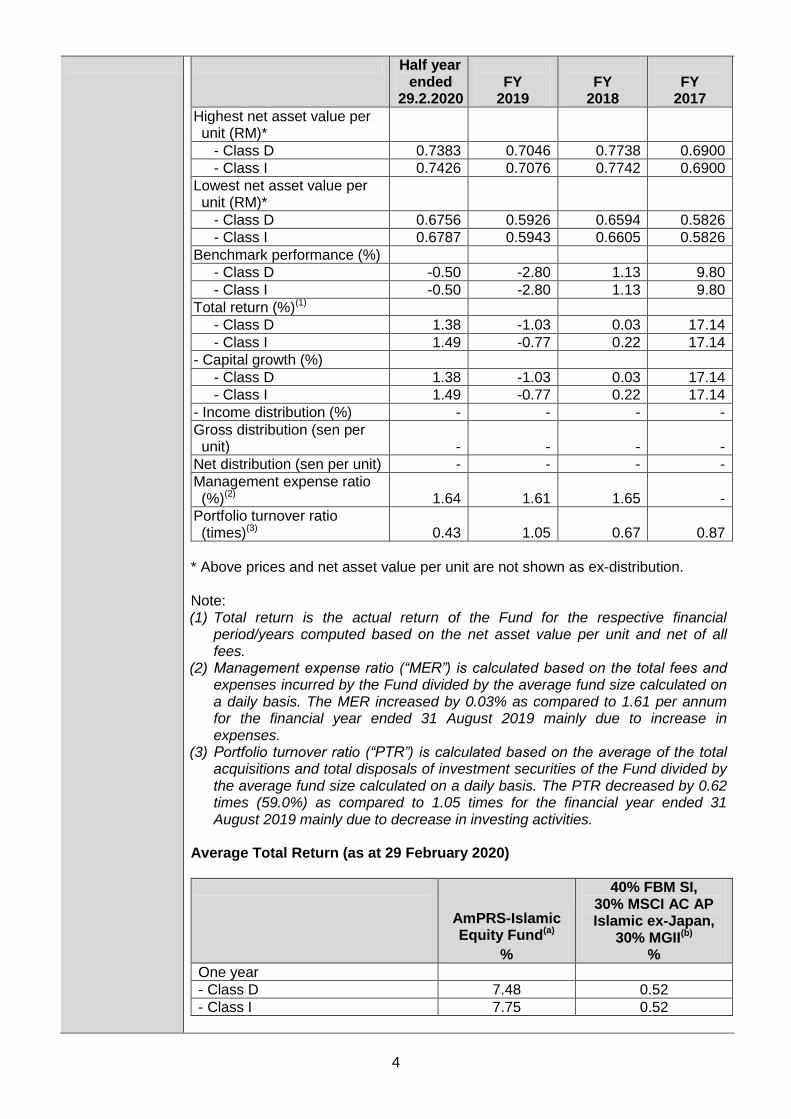
Highest net asset value per unit (RM)*
- Class D 0.7383 0.7046 0.7738 0.6900
- Class I 0.7426 0.7076 0.7742 0.6900
Lowest net asset value per unit (RM)*
- Class D 0.6756 0.5926 0.6594 0.5826
- Class I 0.6787 0.5943 0.6605 0.5826
Benchmark performance (%)
- Class D -0.50 -2.80 1.13 9.80
- Class I -0.50 -2.80 1.13 9.80
Total return (%)(1)
- Class D 1.38 -1.03 0.03 17.14
- Class I 1.49 -0.77 0.22 17.14
- Capital growth (%)
- Class D 1.38 -1.03 0.03 17.14
- Class I 1.49 -0.77 0.22 17.14
- Income distribution (%) - - - -
Gross distribution (sen per unit)
-
-
-
-
Net distribution (sen per unit) - - - -
Management expense ratio (%)(2)
1.64
1.61
1.65
-
Portfolio turnover ratio (times)(3)
0.43
1.05
0.67
0.87
* Above prices and net asset value per unit are not shown as ex-distribution. Note: (1) Total return is the actual return of the Fund for the respective financial
period/years computed based on the net asset value per unit and net of all fees.
(2) Management expense ratio (“MER”) is calculated based on the total fees and expenses incurred by the Fund divided by the average fund size calculated on a daily basis. The MER increased by 0.03% as compared to 1.61 per annum for the financial year ended 31 August 2019 mainly due to increase in expenses.
(3) Portfolio turnover ratio (“PTR”) is calculated based on the average of the total acquisitions and total disposals of investment securities of the Fund divided by the average fund size calculated on a daily basis. The PTR decreased by 0.62 times (59.0%) as compared to 1.05 times for the financial year ended 31 August 2019 mainly due to decrease in investing activities.
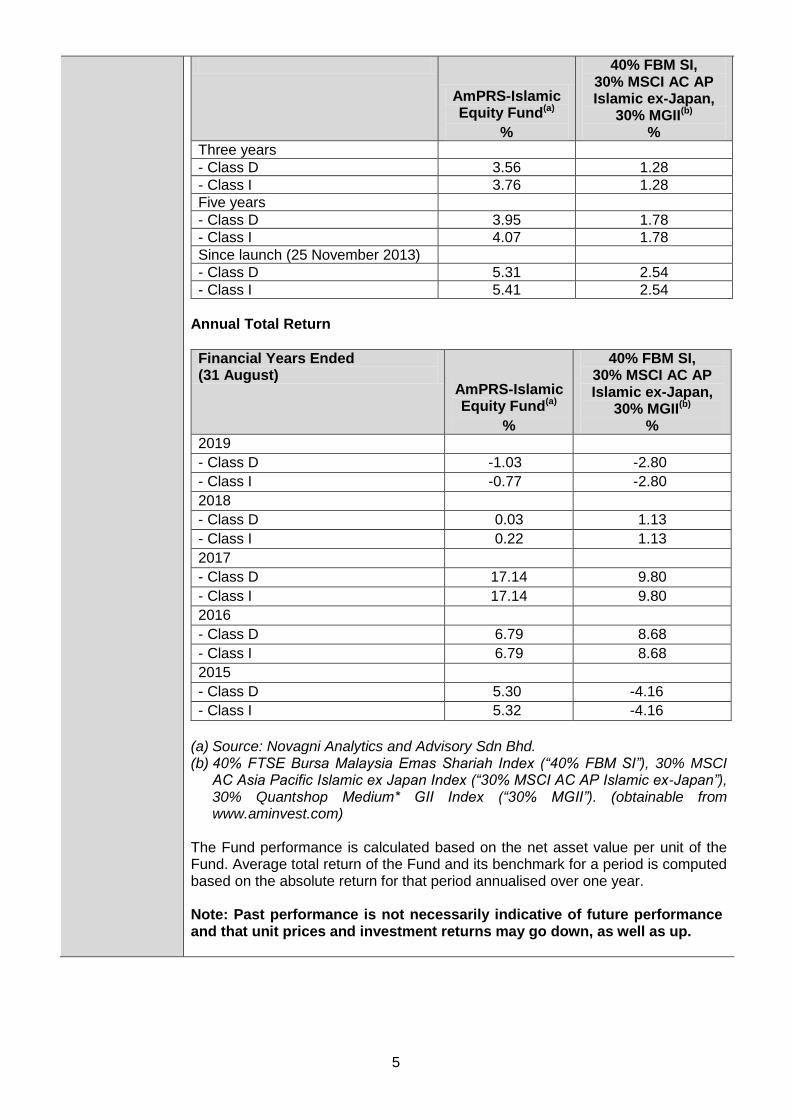
Average Total Return (as at 29 February 2020)
AmPRS-Islamic Equity Fund(a)
%
40% FBM SI, 30% MSCI AC AP Islamic ex-Japan,
30% MGII(b)
%
One year
- Class D 7.48 0.52
- Class I 7.75 0.52
5
AmPRS-Islamic Equity Fund(a)
%
40% FBM SI, 30% MSCI AC AP Islamic ex-Japan,
30% MGII(b)
%
Three years
- Class D 3.56 1.28
- Class I 3.76 1.28
Five years
- Class D 3.95 1.78
- Class I 4.07 1.78
Since launch (25 November 2013)
- Class D 5.31 2.54
- Class I 5.41 2.54
Annual Total Return
Financial Years Ended (31 August)
AmPRS-Islamic Equity Fund(a)
%
40% FBM SI, 30% MSCI AC AP Islamic ex-Japan,
30% MGII(b)
%
2019
- Class D -1.03 -2.80
- Class I -0.77 -2.80
2018
- Class D 0.03 1.13
- Class I 0.22 1.13
2017
- Class D 17.14 9.80
- Class I 17.14 9.80
2016
- Class D 6.79 8.68
- Class I 6.79 8.68
2015
- Class D 5.30 -4.16
- Class I 5.32 -4.16
(a) Source: Novagni Analytics and Advisory Sdn Bhd. (b) 40% FTSE Bursa Malaysia Emas Shariah Index (“40% FBM SI”), 30% MSCI
AC Asia Pacific Islamic ex Japan Index (“30% MSCI AC AP Islamic ex-Japan”), 30% Quantshop Medium* GII Index (“30% MGII”). (obtainable from www.aminvest.com)
The Fund performance is calculated based on the net asset value per unit of the Fund. Average total return of the Fund and its benchmark for a period is computed based on the absolute return for that period annualised over one year. Note: Past performance is not necessarily indicative of future performance and that unit prices and investment returns may go down, as well as up.
6
Fund Performance
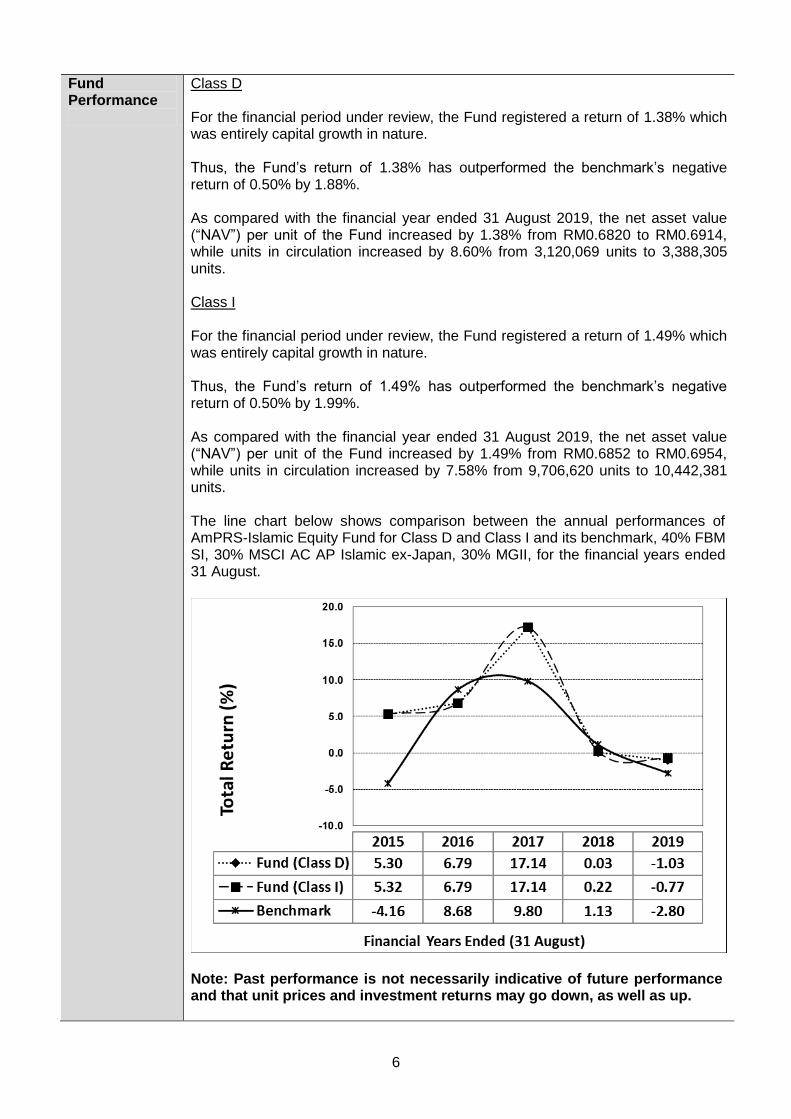
Class D For the financial period under review, the Fund registered a return of 1.38% which was entirely capital growth in nature. Thus, the Fund’s return of 1.38% has outperformed the benchmark’s negative return of 0.50% by 1.88%. As compared with the financial year ended 31 August 2019, the net asset value (“NAV”) per unit of the Fund increased by 1.38% from RM0.6820 to RM0.6914, while units in circulation increased by 8.60% from 3,120,069 units to 3,388,305 units. Class I For the financial period under review, the Fund registered a return of 1.49% which was entirely capital growth in nature. Thus, the Fund’s return of 1.49% has outperformed the benchmark’s negative return of 0.50% by 1.99%. As compared with the financial year ended 31 August 2019, the net asset value (“NAV”) per unit of the Fund increased by 1.49% from RM0.6852 to RM0.6954, while units in circulation increased by 7.58% from 9,706,620 units to 10,442,381 units. The line chart below shows comparison between the annual performances of AmPRS-Islamic Equity Fund for Class D and Class I and its benchmark, 40% FBM SI, 30% MSCI AC AP Islamic ex-Japan, 30% MGII, for the financial years ended 31 August.
Note: Past performance is not necessarily indicative of future performance and that unit prices and investment returns may go down, as well as up.
7
Strategies and Policies Employed
For the financial period under review, the Fund invested its assets into a well-diversified portfolio comprising Shariah Compliant equities, Sukuk and Shariah Compliant money market instruments, Shariah Compliant REITs and Islamic Liquid Assets.
The Shariah Compliant securities that the Fund invests in will be traded and/or listed in the following countries, which includes but not limited to Australia, Hong Kong, Malaysia, New Zealand, Singapore, South Korea, Taiwan and Thailand. Foreign investments (if any) will be limited to 50% of the Fund’s NAV.
In order to achieve the investment objective, the investment manager may opt to invest in the Shariah Compliant securities either directly or via collective investment schemes (“CIS”) of AmFunds Management Berhad (“AFM”) or other CIS such as ETF that comply with Shariah Principles.
The Fund may also use Shariah Compliant hedging instruments for the purpose of hedging (subject to PRS Guidelines) if it is deemed necessary to do so.
Portfolio Structure
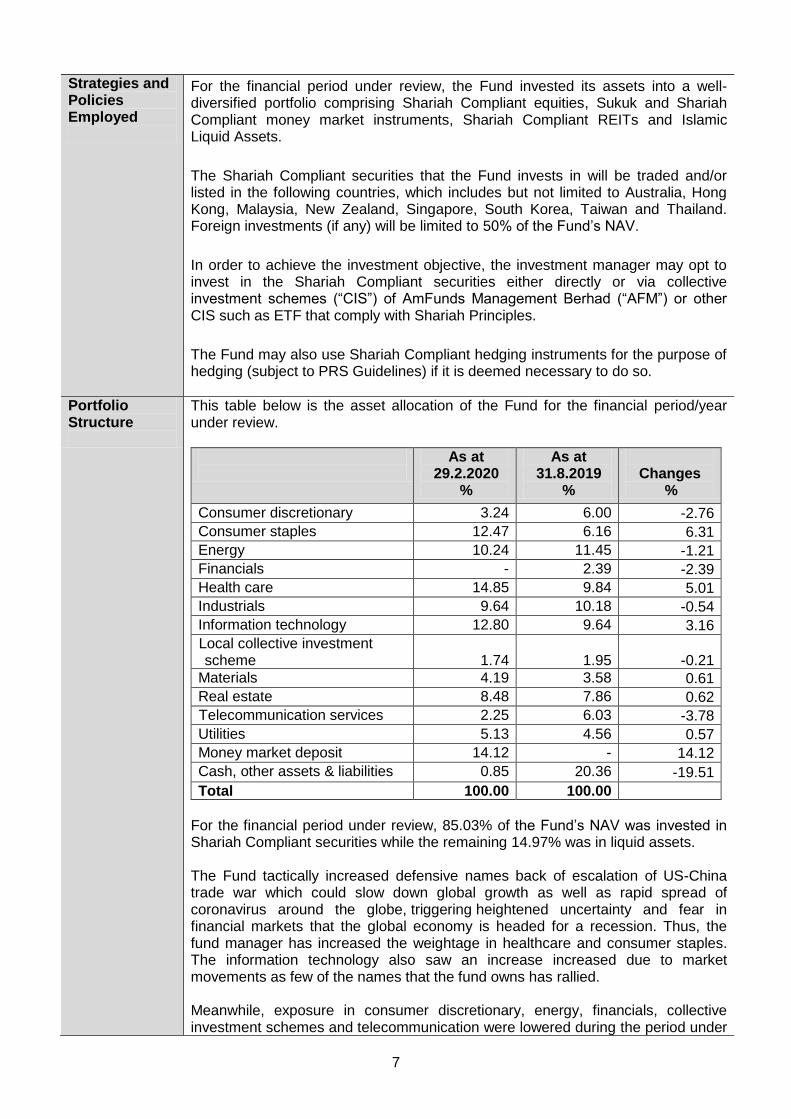
This table below is the asset allocation of the Fund for the financial period/year under review.
As at 29.2.2020
%
As at 31.8.2019
%
Changes
%
Consumer discretionary 3.24 6.00 -2.76
Consumer staples 12.47 6.16 6.31
Energy 10.24 11.45 -1.21
Financials - 2.39 -2.39
Health care 14.85 9.84 5.01
Industrials 9.64 10.18 -0.54
Information technology 12.80 9.64 3.16
Local collective investment scheme 1.74 1.95 -0.21
Materials 4.19 3.58 0.61
Real estate 8.48 7.86 0.62
Telecommunication services 2.25 6.03 -3.78
Utilities 5.13 4.56 0.57
Money market deposit 14.12 - 14.12
Cash, other assets & liabilities 0.85 20.36 -19.51
Total 100.00 100.00
For the financial period under review, 85.03% of the Fund’s NAV was invested in Shariah Compliant securities while the remaining 14.97% was in liquid assets. The Fund tactically increased defensive names back of escalation of US-China trade war which could slow down global growth as well as rapid spread of coronavirus around the globe, triggering heightened uncertainty and fear in financial markets that the global economy is headed for a recession. Thus, the fund manager has increased the weightage in healthcare and consumer staples. The information technology also saw an increase increased due to market movements as few of the names that the fund owns has rallied. Meanwhile, exposure in consumer discretionary, energy, financials, collective investment schemes and telecommunication were lowered during the period under
8
review. Although the telecommunications sector has historically been defensive, competition has increased over the years which prompted the fund manager to reduce position within that space.
Cross Trades
There were no cross trades undertaken during the financial period under review.
Distribution/ Unit splits
There was no income distribution and unit split declared for the financial period under review.
State of Affairs
There has been neither significant change to the state of affairs of the Fund nor any circumstances that materially affect any interests of the members during the financial period under review.
Rebates and Soft Commission
Soft commissions received from brokers/dealers are retained by the PRS Provider only if the goods and services provided are in the form of research services that assist in the decision-making process relating to the Fund’s investments. During the financial period under review, the PRS Provider had received on behalf of the Fund, soft commissions as allowed under regulatory requirements to carry out investment management functions for the Fund. These soft commissions received by the PRS Provider are deemed to be beneficial to the members of the Fund.
Market Review
Asia markets started the period under review with an unexpected announcement by United States (US) imposing tariffs on Chinese imports that were not yet subject to tariffs, triggering a sell-off in the equity market in August. The selling was further aggravated by the unexpected devaluation in China’s yuan, which raised fears that the US-China trade dispute could escalate into a full-scale currency war. However, Asia market recovered from the bottom, as US and China reaching an agreement on the phase one trade deal in the month of December, reducing uncertainty in the market.
Moving into 2020, equity market went into turbulence in the first two months on sharply declining oil prices combined with the rapid spread of coronavirus around the globe, triggering heightened uncertainty and fear in financial markets that the global economy is headed for a recession.
During the period under review, the North Asia did well, given the higher sensitivity towards global economy. Taiwan was the best performing market, with a return of 6.35%, followed by Hong Kong of 1.58%. Meanwhile, Thailand was the worst performing market with a -19.00% return, attributed to stronger Thai Baht which hurt its export and tourism sectors.
Market Outlook
The COVID-19 is still far from reaching its peak (if the experts’ prediction of the infection curve is correct) and is rapidly spreading that could lead to a global complete lockdown. This has continued to dampen the short-term outlook of the global economy significantly. Equities market has turned highly volatile due to the likelihood of significant negative impact on corporate earnings leading to credit default events. Although the governments and global central banks have been proactive in introducing extensive policies, those could only serve to cushion the economic downturn if the outbreak worsens.
At the same time, the Malaysian government has unveiled a MYR250b economic stimulus package to mitigate the economic downturn caused by the COVID-19 outbreak. The unprecedented Movement Control Order (MCO) in many countries (total lockdown in some cases) would moderate the economic activities significantly, and the earnings pressure is not limited to local corporates only but global businesses as well. Due to the wide economic impact, we believe the
9
economic recovery would take a longer period. During this highly uncertain period, we would continue to maintain our defensive strategy. We expect market volatility to persist in the near term until we see a peak in the number of new cases and clarity on corporate earnings downgrades. As such, we continue to focus on high quality company that generates strong cash flow and net cash position to weather through this tough period.
Additional Information
The following information was updated:
1. Seohan Soo resigned as a Non-Independent, Non-Executive Director for AmFunds Management Berhad and AmIslamic Funds Management Sdn Bhd with effect from 1st January 2020.
Kuala Lumpur, Malaysia AmFunds Management Berhad 27 April 2020
AmPRS - Islamic Equity Fund
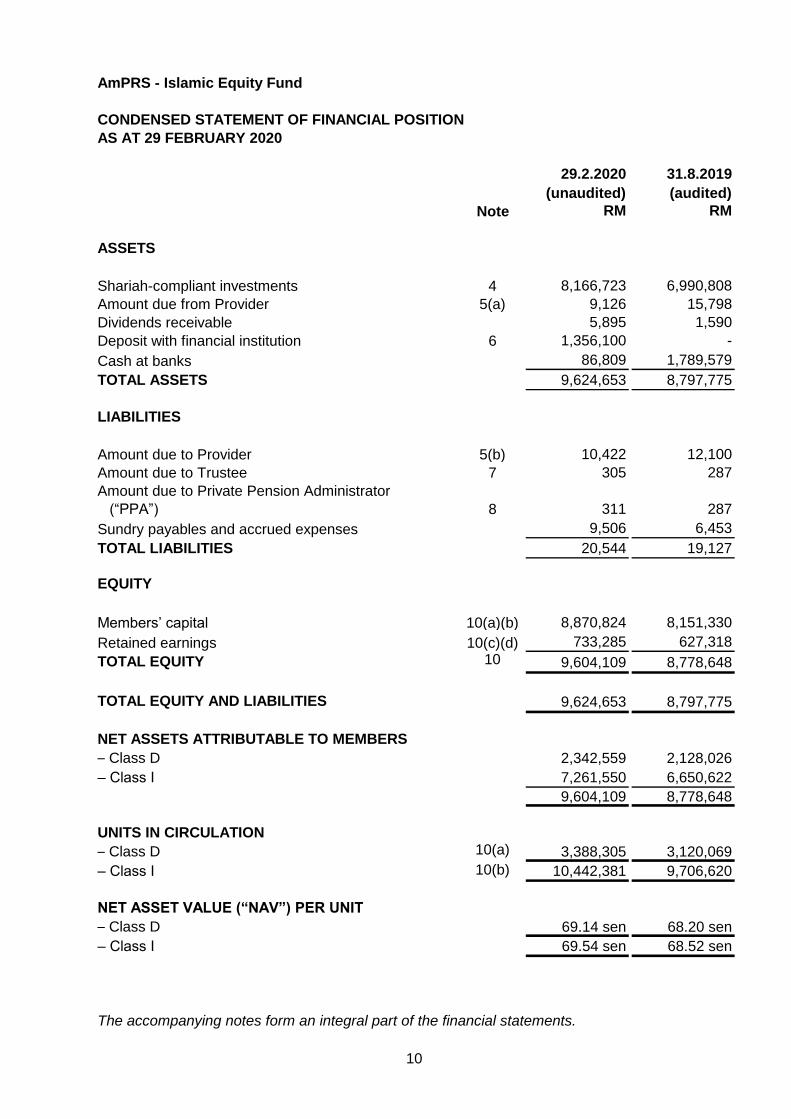
CONDENSED STATEMENT OF FINANCIAL POSITION
AS AT 29 FEBRUARY 2020
29.2.2020 31.8.2019
(unaudited) (audited)
Note RM RM
ASSETS
Shariah-compliant investments 4 8,166,723 6,990,808
Amount due from Provider 5(a) 9,126 15,798
Dividends receivable 5,895 1,590
Deposit with financial institution 6 1,356,100 -
Cash at banks 86,809 1,789,579
TOTAL ASSETS 9,624,653 8,797,775
LIABILITIES
Amount due to Provider 5(b) 10,422 12,100
Amount due to Trustee 7 305 287
Amount due to Private Pension Administrator
(“PPA”) 8 311 287
Sundry payables and accrued expenses 9,506 6,453
TOTAL LIABILITIES 20,544 19,127
EQUITY
Members’ capital 10(a)(b) 8,870,824 8,151,330
Retained earnings 10(c)(d) 733,285 627,318
TOTAL EQUITY 10 9,604,109 8,778,648
TOTAL EQUITY AND LIABILITIES 9,624,653 8,797,775
NET ASSETS ATTRIBUTABLE TO MEMBERS
– Class D 2,342,559 2,128,026
– Class I 7,261,550 6,650,622
9,604,109 8,778,648
UNITS IN CIRCULATION
– Class D 10(a) 3,388,305 3,120,069
– Class I 10(b) 10,442,381 9,706,620
NET ASSET VALUE (“NAV”) PER UNIT
– Class D 69.14 sen 68.20 sen
– Class I 69.54 sen 68.52 sen
The accompanying notes form an integral part of the financial statements.
10
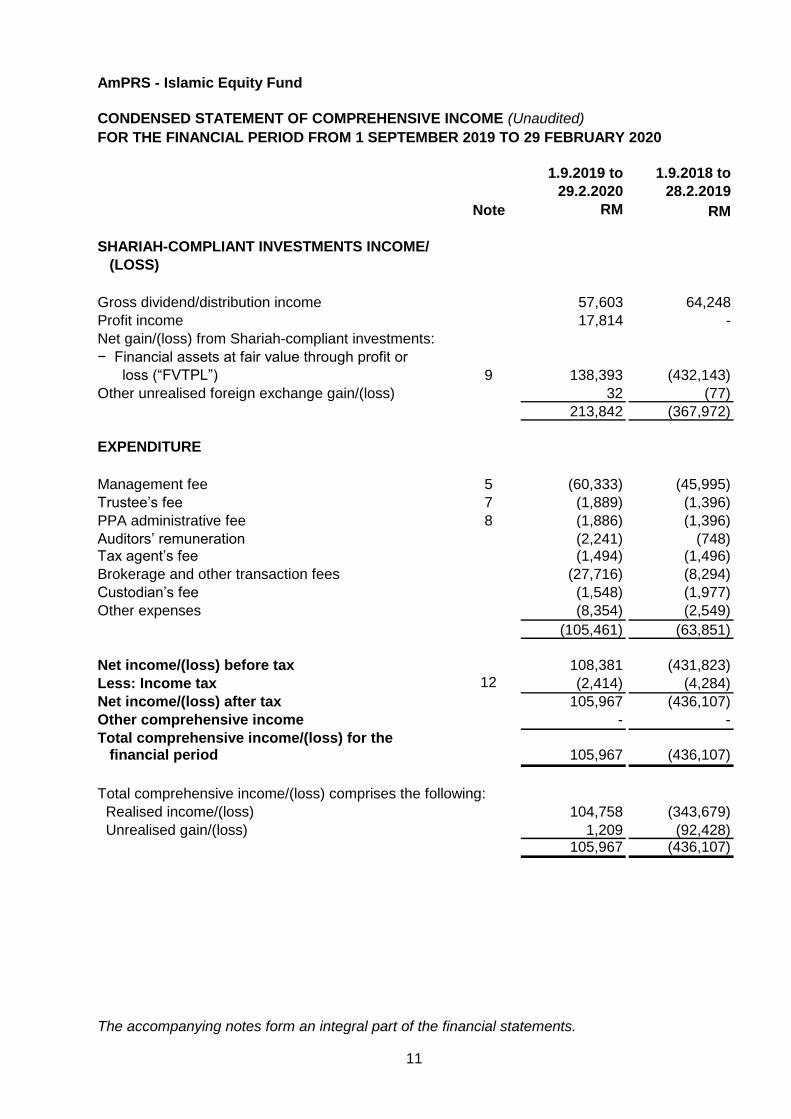
AmPRS - Islamic Equity Fund
CONDENSED STATEMENT OF COMPREHENSIVE INCOME (Unaudited)
FOR THE FINANCIAL PERIOD FROM 1 SEPTEMBER 2019 TO 29 FEBRUARY 2020
1.9.2019 to 1.9.2018 to
29.2.2020 28.2.2019
Note RM RM
SHARIAH-COMPLIANT INVESTMENTS INCOME/
(LOSS)
Gross dividend/distribution income 57,603 64,248
Profit income 17,814 -
Net gain/(loss) from Shariah-compliant investments:
− Financial assets at fair value through profit or
loss (“FVTPL”) 9 138,393 (432,143)
Other unrealised foreign exchange gain/(loss) 32 (77)
213,842 (367,972)
EXPENDITURE
Management fee 5 (60,333) (45,995)
Trustee’s fee 7 (1,889) (1,396)
PPA administrative fee 8 (1,886) (1,396)
Auditors’ remuneration (2,241) (748)Tax agent’s fee (1,494) (1,496)
Brokerage and other transaction fees (27,716) (8,294)
Custodian’s fee (1,548) (1,977)
Other expenses (8,354) (2,549)
(105,461) (63,851)
Net income/(loss) before tax 108,381 (431,823)
Less: Income tax 12 (2,414) (4,284)
Net income/(loss) after tax 105,967 (436,107)
Other comprehensive income - -
Total comprehensive income/(loss) for thefinancial period 105,967 (436,107)
Total comprehensive income/(loss) comprises the following:
Realised income/(loss) 104,758 (343,679)
Unrealised gain/(loss) 1,209 (92,428)105,967 (436,107)
The accompanying notes form an integral part of the financial statements.
11
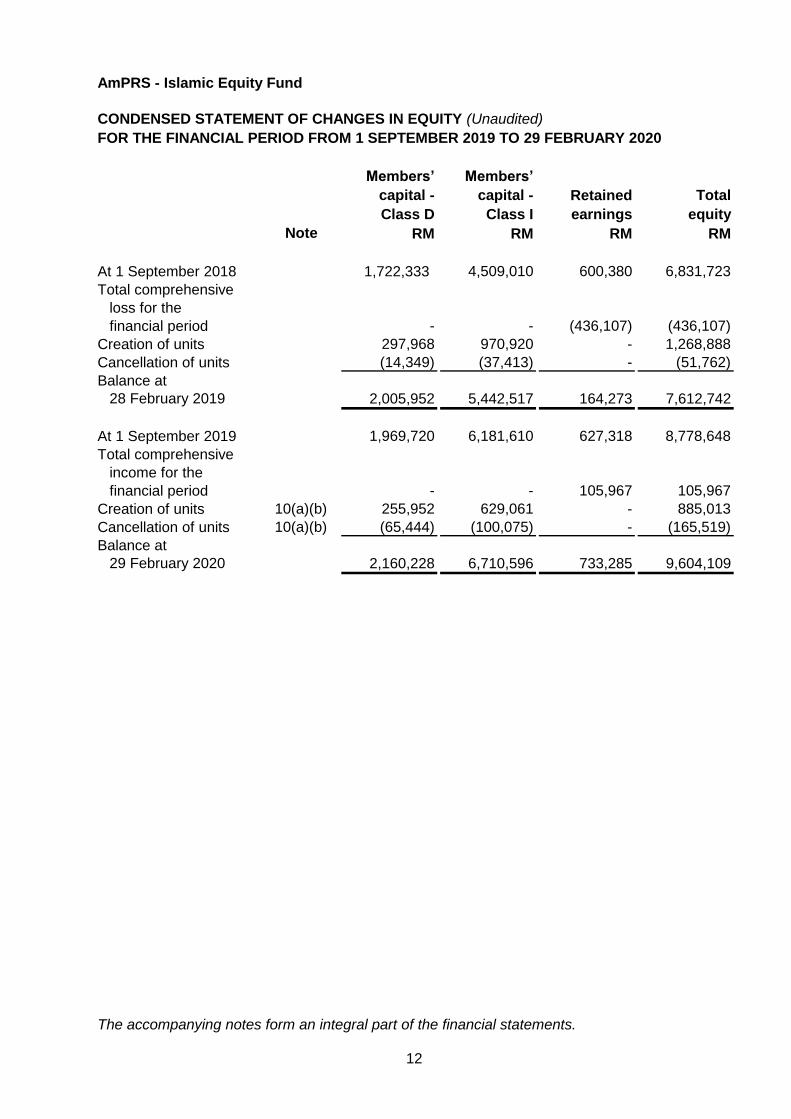
AmPRS - Islamic Equity Fund
CONDENSED STATEMENT OF CHANGES IN EQUITY (Unaudited)
FOR THE FINANCIAL PERIOD FROM 1 SEPTEMBER 2019 TO 29 FEBRUARY 2020
Members’ Members’
capital - capital - Retained Total
Class D Class I earnings equity
Note RM RM RM RM
At 1 September 2018 1,722,333 4,509,010 600,380 6,831,723
Total comprehensive
loss for the
financial period - - (436,107) (436,107)
Creation of units 297,968 970,920 - 1,268,888
Cancellation of units (14,349) (37,413) - (51,762)
Balance at
28 February 2019 2,005,952 5,442,517 164,273 7,612,742
At 1 September 2019 1,969,720 6,181,610 627,318 8,778,648
Total comprehensive
income for the
financial period - - 105,967 105,967
Creation of units 10(a)(b) 255,952 629,061 - 885,013
Cancellation of units 10(a)(b) (65,444) (100,075) - (165,519)
Balance at
29 February 2020 2,160,228 6,710,596 733,285 9,604,109
The accompanying notes form an integral part of the financial statements.
12
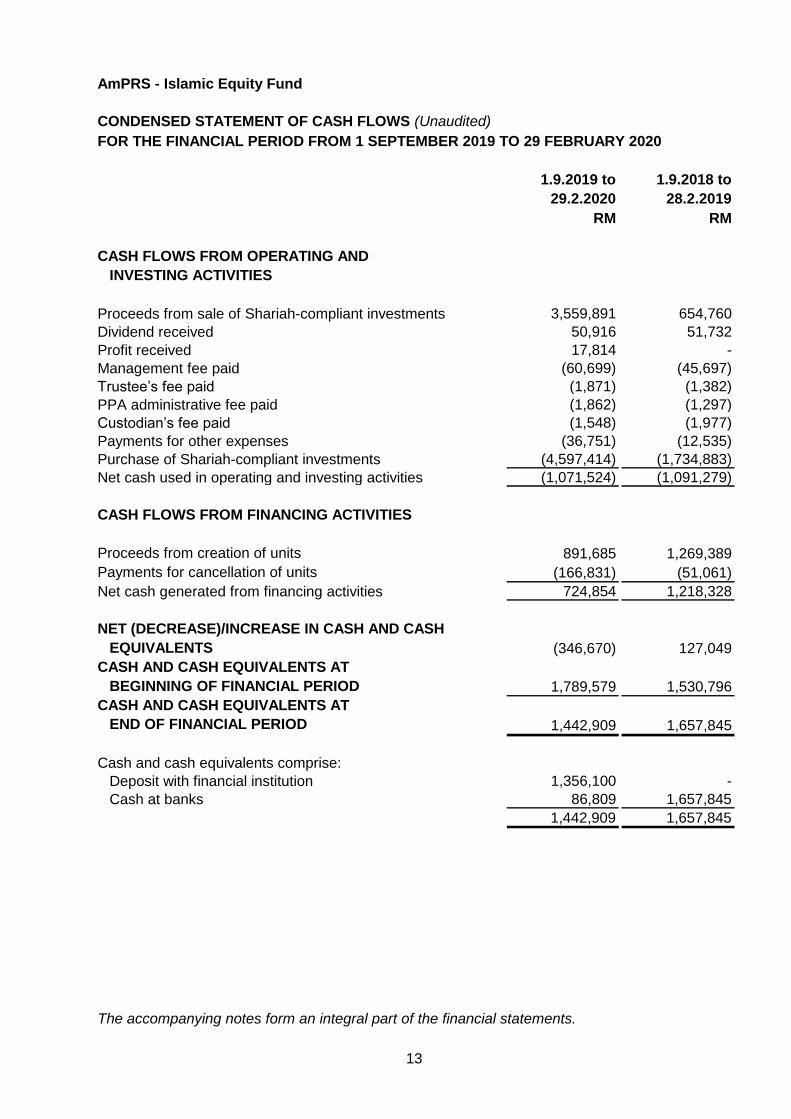
AmPRS - Islamic Equity Fund
CONDENSED STATEMENT OF CASH FLOWS (Unaudited)
FOR THE FINANCIAL PERIOD FROM 1 SEPTEMBER 2019 TO 29 FEBRUARY 2020
1.9.2019 to 1.9.2018 to
29.2.2020 28.2.2019
RM RM
CASH FLOWS FROM OPERATING AND
INVESTING ACTIVITIES
Proceeds from sale of Shariah-compliant investments 3,559,891 654,760
Dividend received 50,916 51,732
Profit received 17,814 -
Management fee paid (60,699) (45,697)
Trustee’s fee paid (1,871) (1,382)
PPA administrative fee paid (1,862) (1,297)
Custodian’s fee paid (1,548) (1,977)
Payments for other expenses (36,751) (12,535)
Purchase of Shariah-compliant investments (4,597,414) (1,734,883)
Net cash used in operating and investing activities (1,071,524) (1,091,279)
CASH FLOWS FROM FINANCING ACTIVITIES
Proceeds from creation of units 891,685 1,269,389
Payments for cancellation of units (166,831) (51,061)
Net cash generated from financing activities 724,854 1,218,328
NET (DECREASE)/INCREASE IN CASH AND CASH
EQUIVALENTS (346,670) 127,049
CASH AND CASH EQUIVALENTS AT
BEGINNING OF FINANCIAL PERIOD 1,789,579 1,530,796
CASH AND CASH EQUIVALENTS AT
END OF FINANCIAL PERIOD 1,442,909 1,657,845
Cash and cash equivalents comprise:
Deposit with financial institution 1,356,100 -
Cash at banks 86,809 1,657,845
1,442,909 1,657,845
The accompanying notes form an integral part of the financial statements.
13
AmPRS - Islamic Equity Fund
NOTES TO THE CONDENSED FINANCIAL STATEMENTSFOR THE FINANCIAL PERIOD FROM 1 SEPTEMBER 2019 TO 29 FEBRUARY 2020
1. GENERAL INFORMATION
2. BASIS OF PREPARATION OF FINANCIAL STATEMENTS
The financial statements of the Fund have been prepared on a historical cost basis, except
as otherwise stated in the accounting policies and comply with Malaysian Financial
Reporting Standards 134: Interim Financial Reporting (“MFRS 134”) as issued by the
Malaysian Accounting Standards Board (“MASB”) and Securities Commission Malaysia’s
Guidelines on Private Retirement Schemes in Malaysia.
Standards effective during the financial period
The adoption of MFRS which have been effective during the financial period did not have
any material financial impact to the financial statements.
Standards issued but not yet effective
The Fund will adopt the following MFRSs and Amendments to MFRSs when they become
effective in the respective financial periods and these MFRSs and Amendments to MFRSs
are not expected to have any material impact to the financial statements of the Fund upon
initial application.
AmPRS – Islamic Equity Fund (“the Fund”) was established pursuant to a Deed dated 4
December 2012 as amended by Deeds Supplemental thereto (“the Deed”), between
AmFunds Management Berhad as the PRS Provider (“the Provider”), Deutsche Trustees
Malaysia Berhad as the Trustee and all members.
The Fund aims to provide long term capital growth by investing primarily in Shariah-
compliant equities and/or equity-related securities. As provided in the Deed, the “accrual
period” or financial year shall end on 31 August and the units in the Fund were first offered
for sale on 25 November 2013.
The financial statements were authorised for issue by the Chief Executive Officer of the
Provider on 27 April 2020.
14
AmPRS - Islamic Equity Fund
2. BASIS OF PREPARATION OF FINANCIAL STATEMENTS (CONT’D.)
Effective for
financial periods
beginning on or after
3. SUMMARY OF SIGNIFICANT ACCOUNTING POLICIES
3.1 Income recognition
(i) Dividend/distribution income
(ii) Profit income
(iii) Gain or loss on disposal of investments
Contribution of Assets between an Investor and its
Associate or Joint Venture
Profit income on Islamic short-term deposits is recognised on an accrual basis
using the effective profit method.
Interest Rate Benchmark Reform
MFRS 17 Insurance Contracts 1 January 2021
Amendments to MFRS 10 and MFRS 128: Sale or Deferred
Amendments to MFRS 101 and MFRS 108 - Definition of 1 January 2020
Material
Amendments to MFRS 7, MFRS 9 and MFRS 139 - 1 January 2020
Standards issued but not yet effective (cont’d.)
Revised Conceptual Framework for Financial Reporting 1 January 2020
Amendments to MFRS 3 - Definition of a Business 1 January 2020
Income is recognised to the extent that it is probable that the economic benefits will
flow to the Fund and the income can be reliably measured. Income is measured at the
fair value of consideration received or receivable.
Dividend/distribution income is recognised when the Fund’s right to receive
payment is established.
On disposal of Shariah-compliant investments, the net realised gain or loss on
disposal is measured as the difference between the net disposal proceeds and
the carrying amount of the Shariah-compliant investments. The net realised gain
or loss is recognised in profit or loss.
15
AmPRS - Islamic Equity Fund
3. SUMMARY OF SIGNIFICANT ACCOUNTING POLICIES (CONT’D.)
3.2 Income tax
3.3 Functional and presentation currency
3.4 Foreign currency transactions
3.5 Statement of cash flows
The Fund adopts the direct method in the preparation of the statement of cash flows.
3.6 Distribution
3.7 Members’ capital
Current tax assets and liabilities are measured at the amount expected to be
recovered from or paid to the tax authorities. The tax rates and tax laws used to
compute the amount are those that are enacted or substantively enacted at the
reporting date.
Cash equivalents are short-term, highly liquid Shariah-compliant investments that are
readily convertible to cash with insignificant risk of changes in value.
Distributions are at the discretion of the Fund. A distribution to the Fund’s members is
accounted for as a deduction from realised income. A proposed distribution is
recognised as a liability in the period in which it is approved. Distribution is either
reinvested or paid in cash to the members on the income payment date. Reinvestment
of units is based on the NAV per unit on the income payment date, which is also the
time of creation.
The members’ capital of the Fund meets the definition of puttable instruments and is
classified as equity instruments under MFRS 132 Financial Instruments: Presentation
(“MFRS 132”).
Current taxes are recognised in profit or loss except to the extent that the tax relates to
items recognised outside profit or loss, either in other comprehensive income or
directly in equity.
Functional currency is the currency of the primary economic environment in which the
Fund operates that most faithfully represents the economic effects of the underlying
transactions. The functional currency of the Fund is Ringgit Malaysia (“RM”) which
reflects the currency in which the Fund competes for funds, issues and redeems units.
The Fund has also adopted RM as its presentation currency.
Transactions in currencies other than the Fund’s functional currency (foreign
currencies) are recorded in the functional currency using exchange rates prevailing at
the transaction dates. At each reporting date, foreign currency monetary items are
translated into RM at exchange rates ruling at the reporting date. All exchange gains or
losses are recognised in profit or loss.
16
AmPRS - Islamic Equity Fund
3. SUMMARY OF SIGNIFICANT ACCOUNTING POLICIES (CONT’D.)
3.8 Financial assets – initial recognition and measurement
(i) Initial recognition
(ii) Initial measurement
(iii) “Day 1” profit or loss
3.9 Financial assets – classification and subsequent measurement
3.10 Financial assets under MFRS 9
(i) Classification and measurement
The Fund subsequently measures its Shariah-compliant investments in equity
investments and collective investment schemes (“CIS”) at FVTPL.
Dividends/distributions earned whilst holding the Shariah-compliant investments is
recognised in profit or loss when the right to the payment has been established. Gains
and losses on the Shariah-compliant investments, realised and unrealised, are
included in profit or loss.
The classification of financial assets depends on the Fund’s business model of
managing the financial assets in order to generate cash flows (“business model
test”) and the contractual cash flow characteristics of the financial instruments
(“SPPP test”). The business model test determines whether cash flows will result
from collecting contractual cash flows, selling the financial assets, or both and the
assessment is performed on a portfolio basis. The SPPP test determines whether
the contractual cash flows are solely for payments of principal and profit and the
assessment is performed on a financial instrument basis.
Financial assets and financial liabilities are recognised when the Fund becomes a
party to the contractual provisions of the instrument. Regular way purchases and
sales of financial assets are recognised using trade date accounting or settlement
date accounting. The method used is applied consistently for all purchases and
sales of financial assets that belong to the same category of financial assets.
All financial assets are recognised initially at fair value, in the case of financial
assets not recorded at FVTPL, transaction costs that are attributable to the
acquisition of the financial asset. All financial liabilities are recognised initially at
fair value and, in the case of financial liabilities not recorded at FVTPL, net of
directly attributable transaction costs.
At initial measurement, if the transaction price differs from the fair value, the Fund
immediately recognises the difference between the transaction price and fair
value (a “Day 1” profit or loss) in profit or loss provided that fair value is evidenced
by a quoted price in an active market for an identical asset or liability (i.e. Level 1
input) or based on a valuation technique that uses only data from observable
markets. In all other cases, the difference between the transaction price and
model value is recognised in profit or loss on a systematic and rational basis that
reflects the nature of the instrument over its tenure.
17
AmPRS - Islamic Equity Fund
3. SUMMARY OF SIGNIFICANT ACCOUNTING POLICIES (CONT’D.)
3.10 Financial assets under MFRS 9 (cont’d.)
(i) Classification and measurement (cont’d.)
The Fund may classify its financial assets under the following categories:
Financial assets at amortised cost
Financial assets at FVOCI
Financial assets at FVTPL
A financial asset is measured at amortised cost if it is held within a business
model whose objective is to hold financial assets in order to collect contractual
cash flows and its contractual terms give rise on specified dates to cash flows that
are solely payments of principal and profit on the principal amount outstanding.
The Fund includes in this category deposits with financial institution, cash at
banks, amounts due from brokers/financial institutions, amount due from the
Provider and other receivables.
A financial asset is measured at fair value through other comprehensive income
(“FVOCI”) if its business model is both to hold the asset to collect contractual
cash flows and to sell the financial asset. In addition, the contractual terms of the
financial assets give rise on specified dates to cash flows that are solely
payments of principal and profit on the outstanding principal.
These investments are initially recorded at fair value and transaction costs are
expensed in the profit or loss. Subsequent to initial recognition, these investments
are remeasured at fair value. All fair value adjustments are initially recognised
through OCI. Debt instruments at FVOCI are subject to impairment assessment.
Any financial assets that are not measured at amortised cost or FVOCI are
measured at FVTPL. Subsequent to initial recognition, financial assets at FVTPL
are measured at fair value. Changes in the fair value of those financial
instruments are recorded in “Net gain or loss on financial assets at FVTPL”. Profit
earned and distribution/dividend revenue elements of such instruments are
recorded separately in “Profit income” and “Distribution/dividend income”
respectively. Exchange differences on financial assets at FVTPL are not
recognised separately in profit or loss but are included in net gain or net loss on
changes in fair value of financial assets at FVTPL.
Instruments that qualify for amortised cost or FVOCI may be irrevocably
designated as FVTPL, if doing so eliminates or significantly reduces a
measurement or recognition inconsistency. Equity instruments are normally
measured at FVTPL, nevertheless, the Fund is allowed to irrevocably designate
equity instruments that are not held for trading as FVOCI, with no subsequent
reclassification of gains or losses to profit or loss.
18
AmPRS - Islamic Equity Fund
3. SUMMARY OF SIGNIFICANT ACCOUNTING POLICIES (CONT’D.)
3.11 Financial liabilities – classification and subsequent measurement
3.12 Derecognition of financial instruments
(i) Derecognition of financial asset
-
-
-
-
(ii) Derecognition of financial liability
3.13 Financial instruments – expected credit losses (“ECL”)
-
-
-
A financial asset (or, where applicable a part of a financial asset or part of a group
of similar financial assets) is derecognised when:
the rights to receive cash flows from the asset have expired, or
reasonable and supportable information that is available without undue cost or
effort at the reporting date about past events, current conditions and forecasts of
future economic conditions.
The ECL in respect of financial assets at amortised cost, if any, is recognised in profit
or loss.
Financial liabilities issued by the Fund are classified as financial liabilities at amortised
cost, where the substance of the contractual arrangement results in the Fund having
an obligation either to deliver cash or another financial asset to the holder. After initial
measurement, financial liabilities are subsequently measured at amortised cost using
the effective profit method. Amortised cost is calculated by taking into account any
discount or premium on acquisition and fees or costs that are an integral part of the
effective profit rate.
the Fund has transferred substantially all the risks and rewards of the
asset, or
the Fund has neither transferred nor retained substantially all the risks
and rewards of the asset, but has transferred control of the asset.
A financial liability is derecognised when the obligation under the liability is
discharged, cancelled or expired. Gains and losses are recognised in profit or
loss when the liabilities are recognised, and through the amortisation process.
The Fund assesses on a forward-looking basis the ECL associated with its financial
assets at amortised cost. The Fund recognises a loss allowance for such losses at
each reporting date. The measurement of ECL reflects:
an unbiased and probability-weighted amount that is determined by evaluating a
range of possible outcomes;
the time value of money; and
the Fund has transferred its rights to receive cash flows from the asset or has
assumed an obligation to pay the received cash flows in full without material
delay to a third party under a “pass-through” arrangement; and either:
19
AmPRS - Islamic Equity Fund
3. SUMMARY OF SIGNIFICANT ACCOUNTING POLICIES (CONT’D.)
3.13 Financial instruments – expected credit losses (“ECL”) (cont’d.)
3.14 Determination of fair value
3.15 Classification of realised and unrealised gains and losses
3.16 Significant accounting estimates and judgments
Financial assets together with the associated allowance are written off when it has
exhausted all practical recovery efforts and there is no realistic prospect of future
recovery. The Fund may also write-off financial assets that are still subject to
enforcement activity when there is no reasonable expectation of full recovery. If a write-
off is later recovered, the recovery is credited to profit or loss.
For Shariah-compliant investments in local quoted securities, fair value is determined
based on the closing price quoted on Bursa Malaysia Berhad. For Shariah-compliant
investments in foreign listed securities, which are quoted in the respective stock
exchanges, fair value will be determined based on the published market price quoted
by the respective stock exchanges at the end of each business day. For Shariah-
compliant investments in CIS, fair value is determined based on the closing NAV per
unit of the foreign CIS. Purchased cost is the quoted price that the Fund paid when
buying its investments. The difference between purchased cost and fair value is
treated as unrealised gain or loss and is recognised in profit or loss. Unrealised gains
or losses recognised in profit or loss are not distributable in nature.
Unrealised gains and losses comprise changes in the fair value of financial instruments
for the period and from reversal of prior period’s unrealised gains and losses for
financial instruments which were realised (i.e. sold, redeemed or matured) during the
reporting period.
Realised gains and losses on disposals of financial instruments classified at FVTPL
are calculated using the weighted average method. They represent the difference
between an instrument’s initial carrying amount and disposal amount.
The preparation of the Fund’s financial statements requires the Provider to make
judgments, estimates and assumptions that affect the reported amounts of revenues,
expenses, assets and liabilities, and the disclosure of contingent liabilities at the
reporting date. However, uncertainty about these assumptions and estimates could
result in outcomes that could require a material adjustment to the carrying amount of
the asset or liability in the future.
The Fund classifies its Shariah-compliant investments as financial assets at FVTPL as
the Fund may sell its Shariah-compliant investments in the short-term for profit-taking
or to meet members’ cancellation of units.
No major judgments have been made by the Provider in applying the Fund’s
accounting policies. There are no key assumptions concerning the future and other
key sources of estimation uncertainty at the reporting date, that have a significant risk
of causing a material adjustment to the carrying amounts of assets and liabilities within
the next financial period.
20
AmPRS - Islamic Equity Fund
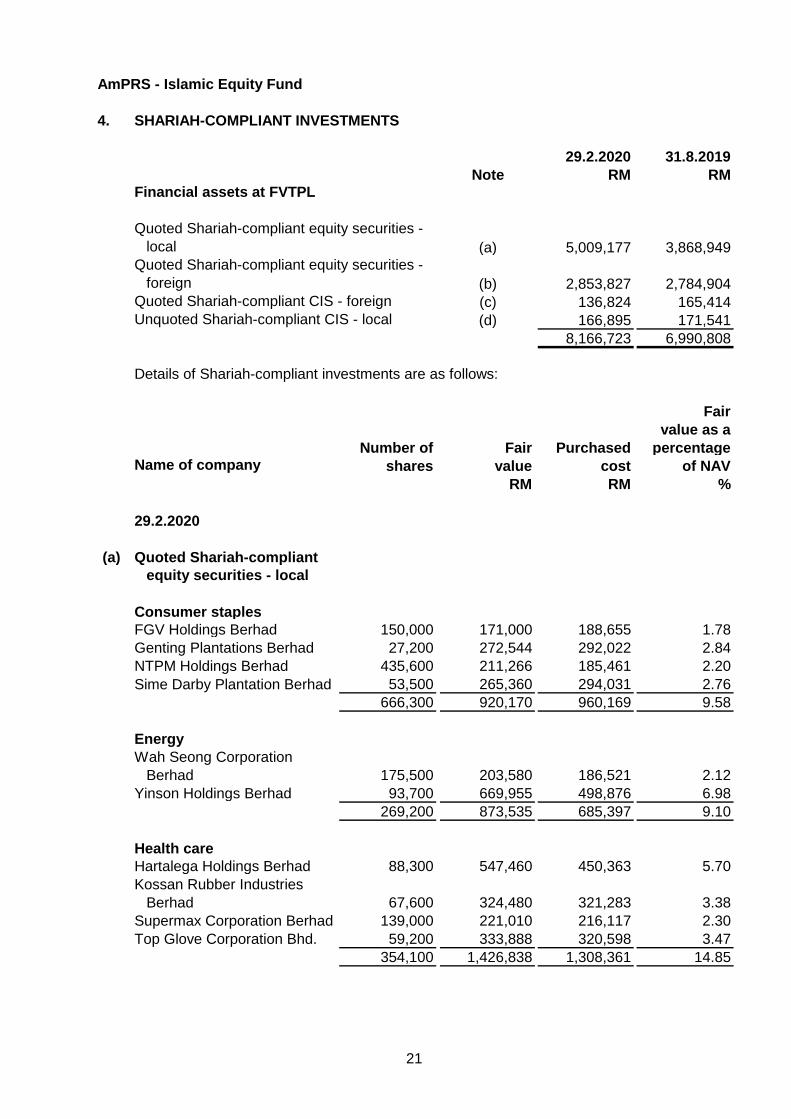
4. SHARIAH-COMPLIANT INVESTMENTS
29.2.2020 31.8.2019
Note RM RMFinancial assets at FVTPL
Quoted Shariah-compliant equity securities -
local (a) 5,009,177 3,868,949
Quoted Shariah-compliant equity securities -
foreign (b) 2,853,827 2,784,904
Quoted Shariah-compliant CIS - foreign (c) 136,824 165,414
Unquoted Shariah-compliant CIS - local (d) 166,895 171,541
8,166,723 6,990,808
Details of Shariah-compliant investments are as follows:
Fair
value as a
Number of Fair Purchased percentageName of company shares value cost of NAV
RM RM %
29.2.2020
(a) Quoted Shariah-compliant
equity securities - local
Consumer staples
FGV Holdings Berhad 150,000 171,000 188,655 1.78
Genting Plantations Berhad 27,200 272,544 292,022 2.84
NTPM Holdings Berhad 435,600 211,266 185,461 2.20
Sime Darby Plantation Berhad 53,500 265,360 294,031 2.76
666,300 920,170 960,169 9.58
Energy
Wah Seong Corporation
Berhad 175,500 203,580 186,521 2.12
Yinson Holdings Berhad 93,700 669,955 498,876 6.98
269,200 873,535 685,397 9.10
Health care
Hartalega Holdings Berhad 88,300 547,460 450,363 5.70
Kossan Rubber Industries
Berhad 67,600 324,480 321,283 3.38
Supermax Corporation Berhad 139,000 221,010 216,117 2.30
Top Glove Corporation Bhd. 59,200 333,888 320,598 3.47
354,100 1,426,838 1,308,361 14.85
21
AmPRS - Islamic Equity Fund
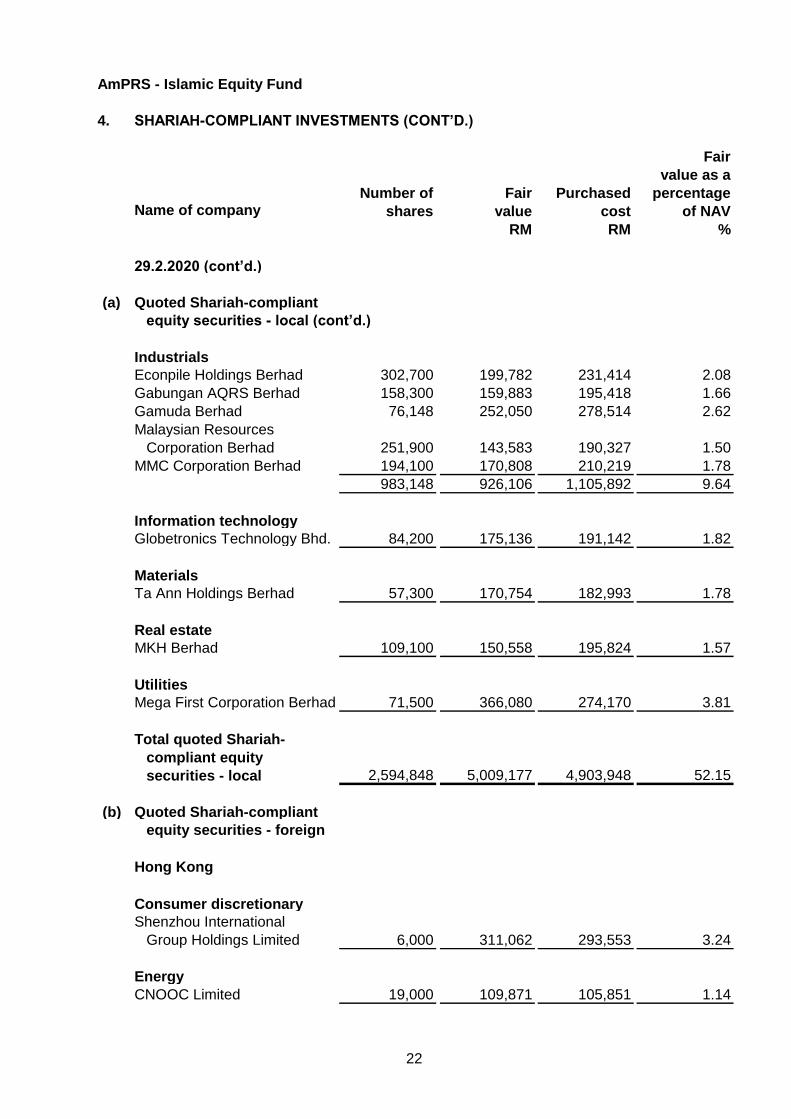
4. SHARIAH-COMPLIANT INVESTMENTS (CONT’D.)
Fair
value as a
Number of Fair Purchased percentageName of company shares value cost of NAV
RM RM %
29.2.2020 (cont’d.)
(a) Quoted Shariah-compliant
equity securities - local (cont’d.)
Industrials
Econpile Holdings Berhad 302,700 199,782 231,414 2.08
Gabungan AQRS Berhad 158,300 159,883 195,418 1.66
Gamuda Berhad 76,148 252,050 278,514 2.62
Malaysian Resources
Corporation Berhad 251,900 143,583 190,327 1.50
MMC Corporation Berhad 194,100 170,808 210,219 1.78
983,148 926,106 1,105,892 9.64
Information technology
Globetronics Technology Bhd. 84,200 175,136 191,142 1.82
Materials
Ta Ann Holdings Berhad 57,300 170,754 182,993 1.78
Real estate
MKH Berhad 109,100 150,558 195,824 1.57
Utilities
Mega First Corporation Berhad 71,500 366,080 274,170 3.81
Total quoted Shariah-
compliant equity
securities - local 2,594,848 5,009,177 4,903,948 52.15
(b) Quoted Shariah-compliant
equity securities - foreign
Hong Kong
Consumer discretionary
Shenzhou International
Group Holdings Limited 6,000 311,062 293,553 3.24
Energy
CNOOC Limited 19,000 109,871 105,851 1.14
22
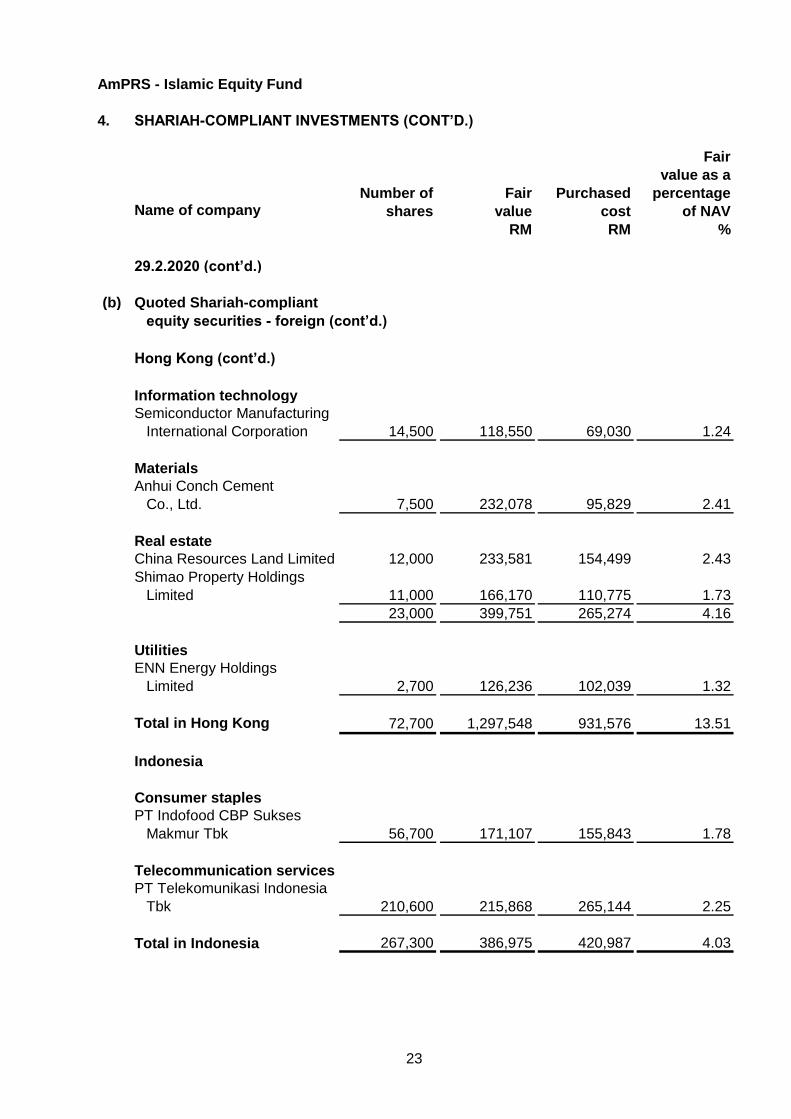
AmPRS - Islamic Equity Fund
4. SHARIAH-COMPLIANT INVESTMENTS (CONT’D.)
Fair
value as a
Number of Fair Purchased percentageName of company shares value cost of NAV
RM RM %
29.2.2020 (cont’d.)
(b) Quoted Shariah-compliant
equity securities - foreign (cont’d.)
Hong Kong (cont’d.)
Information technology
Semiconductor Manufacturing
International Corporation 14,500 118,550 69,030 1.24
Materials
Anhui Conch Cement
Co., Ltd. 7,500 232,078 95,829 2.41
Real estate
China Resources Land Limited 12,000 233,581 154,499 2.43
Shimao Property Holdings
Limited 11,000 166,170 110,775 1.73
23,000 399,751 265,274 4.16
Utilities
ENN Energy Holdings
Limited 2,700 126,236 102,039 1.32
Total in Hong Kong 72,700 1,297,548 931,576 13.51
Indonesia
Consumer staples
PT Indofood CBP Sukses
Makmur Tbk 56,700 171,107 155,843 1.78
Telecommunication services
PT Telekomunikasi Indonesia
Tbk 210,600 215,868 265,144 2.25
Total in Indonesia 267,300 386,975 420,987 4.03
23
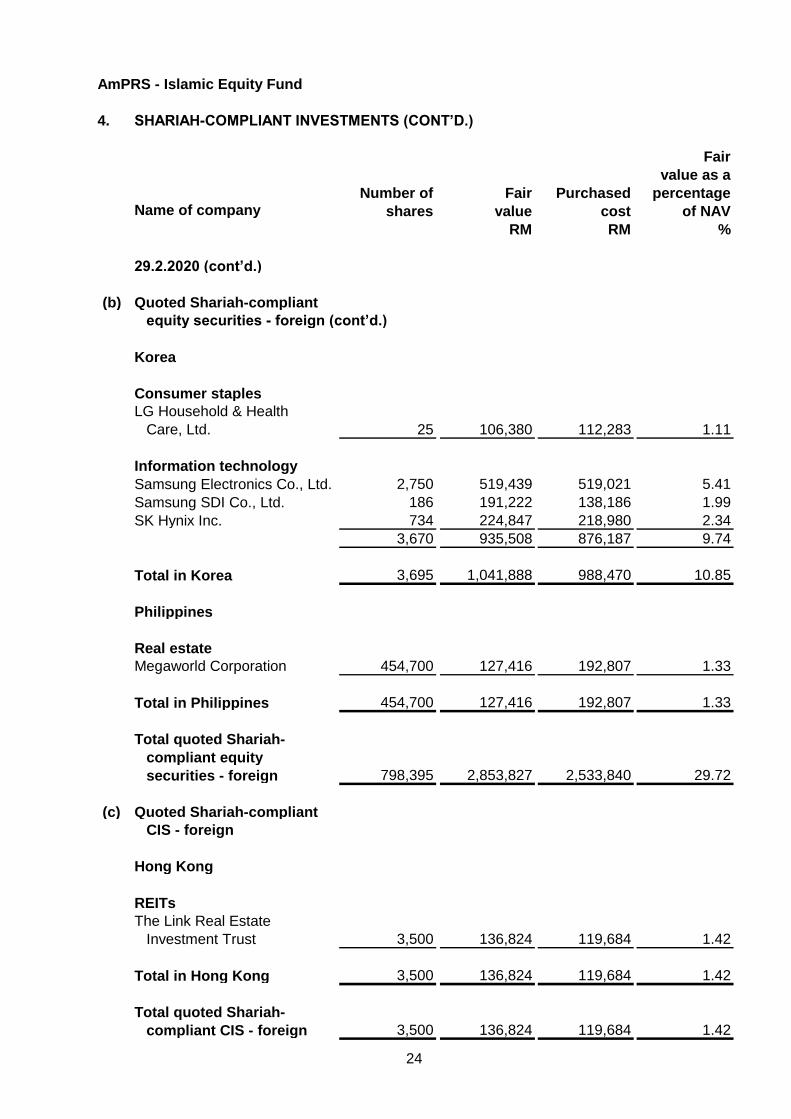
AmPRS - Islamic Equity Fund
4. SHARIAH-COMPLIANT INVESTMENTS (CONT’D.)
Fair
value as a
Number of Fair Purchased percentageName of company shares value cost of NAV
RM RM %
29.2.2020 (cont’d.)
(b) Quoted Shariah-compliant
equity securities - foreign (cont’d.)
Korea
Consumer staples
LG Household & Health
Care, Ltd. 25 106,380 112,283 1.11
Information technology
Samsung Electronics Co., Ltd. 2,750 519,439 519,021 5.41
Samsung SDI Co., Ltd. 186 191,222 138,186 1.99
SK Hynix Inc. 734 224,847 218,980 2.34
3,670 935,508 876,187 9.74
Total in Korea 3,695 1,041,888 988,470 10.85
Philippines
Real estate
Megaworld Corporation 454,700 127,416 192,807 1.33
Total in Philippines 454,700 127,416 192,807 1.33
Total quoted Shariah-
compliant equity
securities - foreign 798,395 2,853,827 2,533,840 29.72
(c) Quoted Shariah-compliant
CIS - foreign
Hong Kong
REITs
The Link Real Estate
Investment Trust 3,500 136,824 119,684 1.42
Total in Hong Kong 3,500 136,824 119,684 1.42
Total quoted Shariah-
compliant CIS - foreign 3,500 136,824 119,684 1.42
24
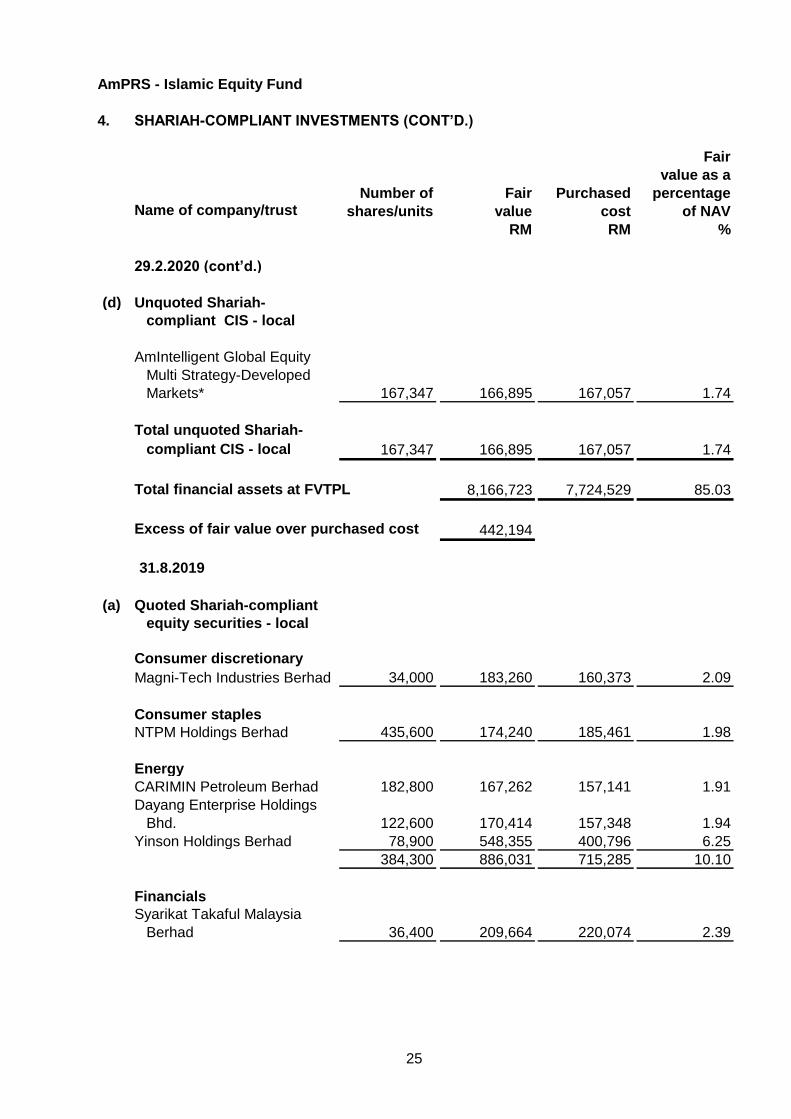
AmPRS - Islamic Equity Fund
4. SHARIAH-COMPLIANT INVESTMENTS (CONT’D.)
Fair
value as a
Number of Fair Purchased percentageName of company/trust shares/units value cost of NAV
RM RM %
29.2.2020 (cont’d.)
(d) Unquoted Shariah-
compliant CIS - local
AmIntelligent Global Equity
Multi Strategy-Developed
Markets* 167,347 166,895 167,057 1.74
Total unquoted Shariah-
compliant CIS - local 167,347 166,895 167,057 1.74
Total financial assets at FVTPL 8,166,723 7,724,529 85.03
Excess of fair value over purchased cost 442,194
31.8.2019
(a) Quoted Shariah-compliant
equity securities - local
Consumer discretionary
Magni-Tech Industries Berhad 34,000 183,260 160,373 2.09
Consumer staples
NTPM Holdings Berhad 435,600 174,240 185,461 1.98
Energy
CARIMIN Petroleum Berhad 182,800 167,262 157,141 1.91
Dayang Enterprise Holdings
Bhd. 122,600 170,414 157,348 1.94
Yinson Holdings Berhad 78,900 548,355 400,796 6.25
384,300 886,031 715,285 10.10
Financials
Syarikat Takaful Malaysia
Berhad 36,400 209,664 220,074 2.39
25
AmPRS - Islamic Equity Fund
4. SHARIAH-COMPLIANT INVESTMENTS (CONT’D.)
Fair
value as a
Number of Fair Purchased percentageName of company shares value cost of NAV
RM RM %
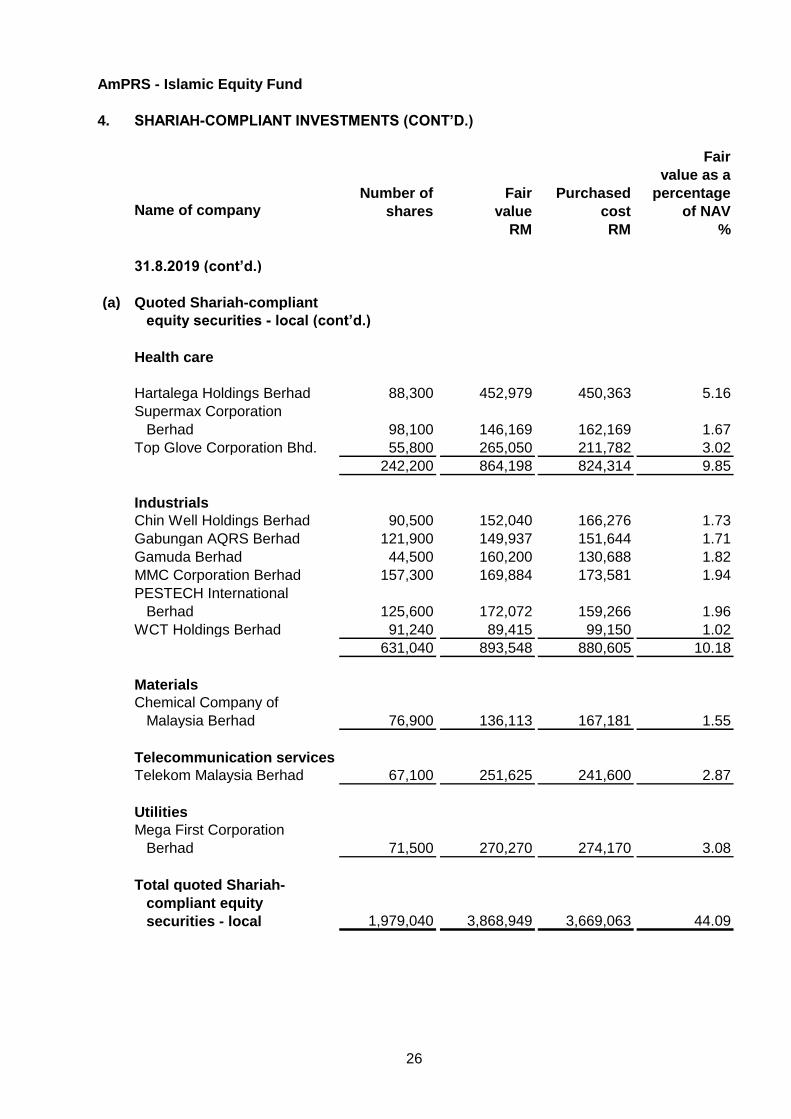
31.8.2019 (cont’d.)
(a) Quoted Shariah-compliant
equity securities - local (cont’d.)
Health care
Hartalega Holdings Berhad 88,300 452,979 450,363 5.16
Supermax Corporation
Berhad 98,100 146,169 162,169 1.67
Top Glove Corporation Bhd. 55,800 265,050 211,782 3.02
242,200 864,198 824,314 9.85
Industrials
Chin Well Holdings Berhad 90,500 152,040 166,276 1.73
Gabungan AQRS Berhad 121,900 149,937 151,644 1.71
Gamuda Berhad 44,500 160,200 130,688 1.82
MMC Corporation Berhad 157,300 169,884 173,581 1.94
PESTECH International
Berhad 125,600 172,072 159,266 1.96
WCT Holdings Berhad 91,240 89,415 99,150 1.02
631,040 893,548 880,605 10.18
Materials
Chemical Company of
Malaysia Berhad 76,900 136,113 167,181 1.55
Telecommunication services
Telekom Malaysia Berhad 67,100 251,625 241,600 2.87
Utilities
Mega First Corporation
Berhad 71,500 270,270 274,170 3.08
Total quoted Shariah-
compliant equity
securities - local 1,979,040 3,868,949 3,669,063 44.09
26
AmPRS - Islamic Equity Fund
4. SHARIAH-COMPLIANT INVESTMENTS (CONT’D.)
Fair
value as a
Number of Fair Purchased percentageName of company shares value cost of NAV
RM RM %
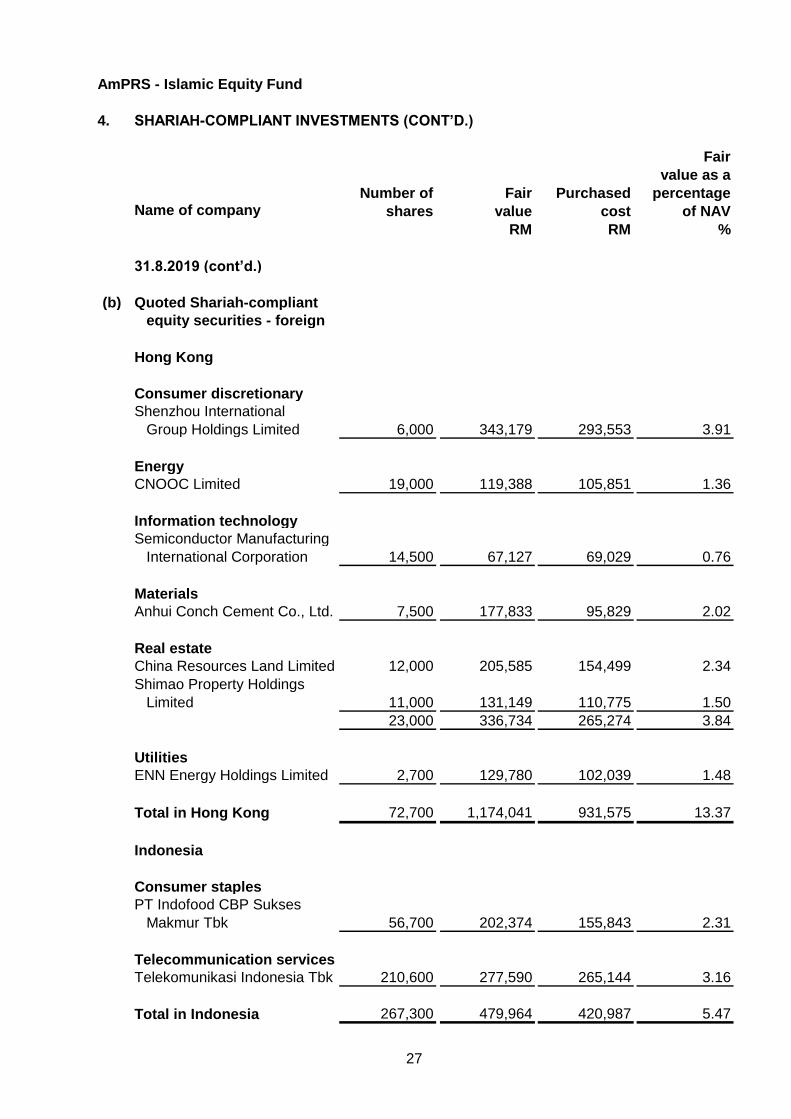
31.8.2019 (cont’d.)
(b) Quoted Shariah-compliant
equity securities - foreign
Hong Kong
Consumer discretionary
Shenzhou International
Group Holdings Limited 6,000 343,179 293,553 3.91
Energy
CNOOC Limited 19,000 119,388 105,851 1.36
Information technology
Semiconductor Manufacturing
International Corporation 14,500 67,127 69,029 0.76
Materials
Anhui Conch Cement Co., Ltd. 7,500 177,833 95,829 2.02
Real estate
China Resources Land Limited 12,000 205,585 154,499 2.34
Shimao Property Holdings
Limited 11,000 131,149 110,775 1.50
23,000 336,734 265,274 3.84
Utilities
ENN Energy Holdings Limited 2,700 129,780 102,039 1.48
Total in Hong Kong 72,700 1,174,041 931,575 13.37
Indonesia
Consumer staples
PT Indofood CBP Sukses
Makmur Tbk 56,700 202,374 155,843 2.31
Telecommunication services
Telekomunikasi Indonesia Tbk 210,600 277,590 265,144 3.16
Total in Indonesia 267,300 479,964 420,987 5.47
27
AmPRS - Islamic Equity Fund
4. SHARIAH-COMPLIANT INVESTMENTS (CONT’D.)
Fair
value as a
Number of Fair Purchased percentageName of company/trust shares/units value cost of NAV
RM RM %
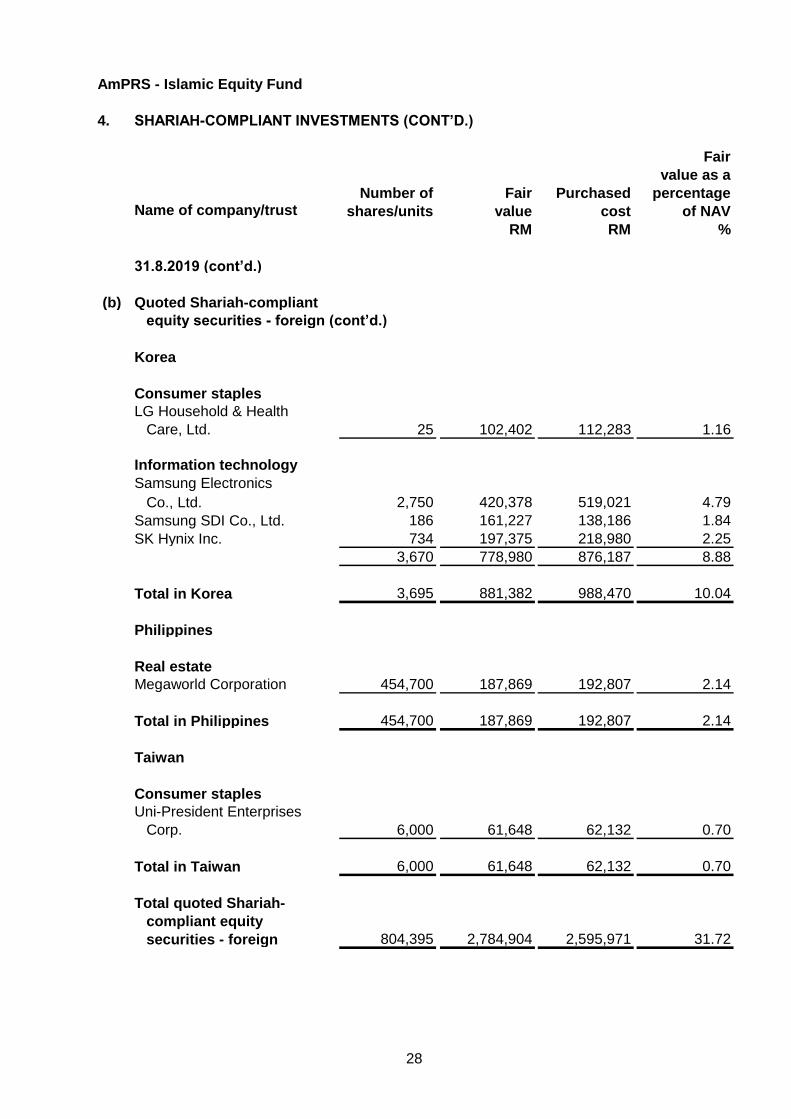
31.8.2019 (cont’d.)
(b) Quoted Shariah-compliant
equity securities - foreign (cont’d.)
Korea
Consumer staples
LG Household & Health
Care, Ltd. 25 102,402 112,283 1.16
Information technology
Samsung Electronics
Co., Ltd. 2,750 420,378 519,021 4.79
Samsung SDI Co., Ltd. 186 161,227 138,186 1.84
SK Hynix Inc. 734 197,375 218,980 2.25
3,670 778,980 876,187 8.88
Total in Korea 3,695 881,382 988,470 10.04
Philippines
Real estate
Megaworld Corporation 454,700 187,869 192,807 2.14
Total in Philippines 454,700 187,869 192,807 2.14
Taiwan
Consumer staples
Uni-President Enterprises
Corp. 6,000 61,648 62,132 0.70
Total in Taiwan 6,000 61,648 62,132 0.70
Total quoted Shariah-
compliant equity
securities - foreign 804,395 2,784,904 2,595,971 31.72
28
AmPRS - Islamic Equity Fund
4. SHARIAH-COMPLIANT INVESTMENTS (CONT’D.)
Fair
value as a
Number of Fair Purchased percentageName of company/trust shares/units value cost of NAV
RM RM %
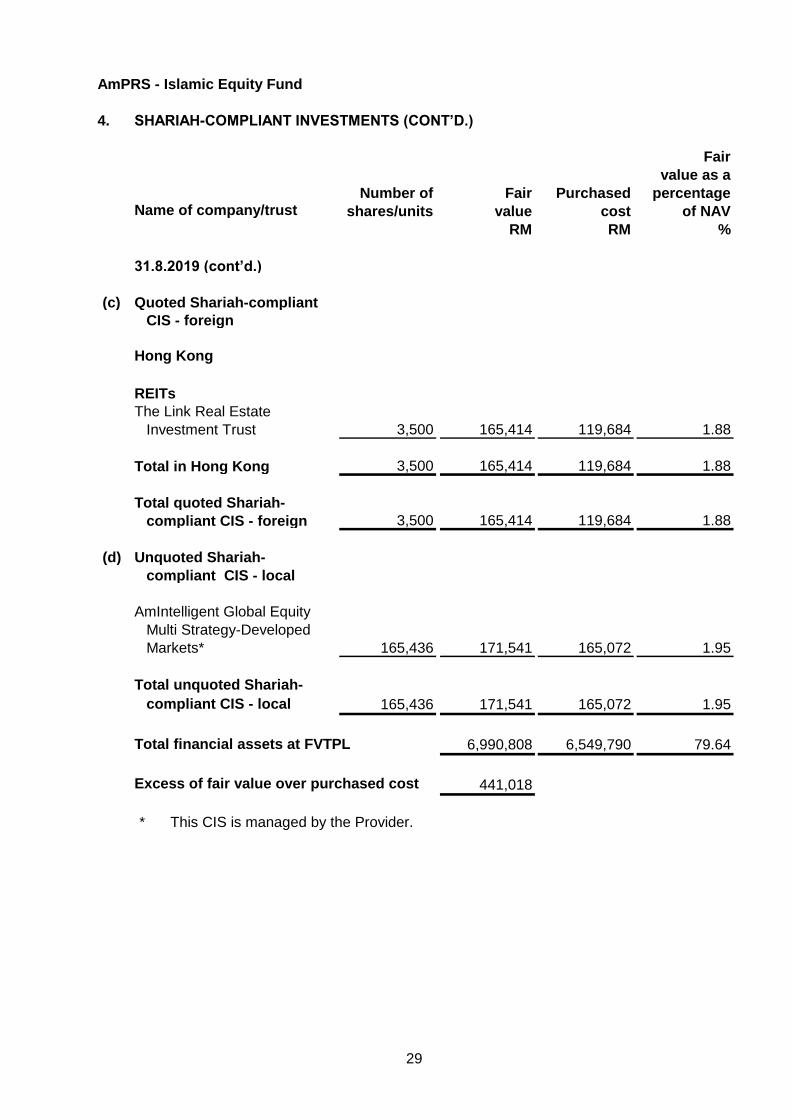
31.8.2019 (cont’d.)
(c) Quoted Shariah-compliant
CIS - foreign
Hong Kong
REITs
The Link Real Estate
Investment Trust 3,500 165,414 119,684 1.88
Total in Hong Kong 3,500 165,414 119,684 1.88
Total quoted Shariah-
compliant CIS - foreign 3,500 165,414 119,684 1.88
(d) Unquoted Shariah-
compliant CIS - local
AmIntelligent Global Equity
Multi Strategy-Developed
Markets* 165,436 171,541 165,072 1.95
Total unquoted Shariah-
compliant CIS - local 165,436 171,541 165,072 1.95
Total financial assets at FVTPL 6,990,808 6,549,790 79.64
Excess of fair value over purchased cost 441,018
* This CIS is managed by the Provider.
29
AmPRS - Islamic Equity Fund
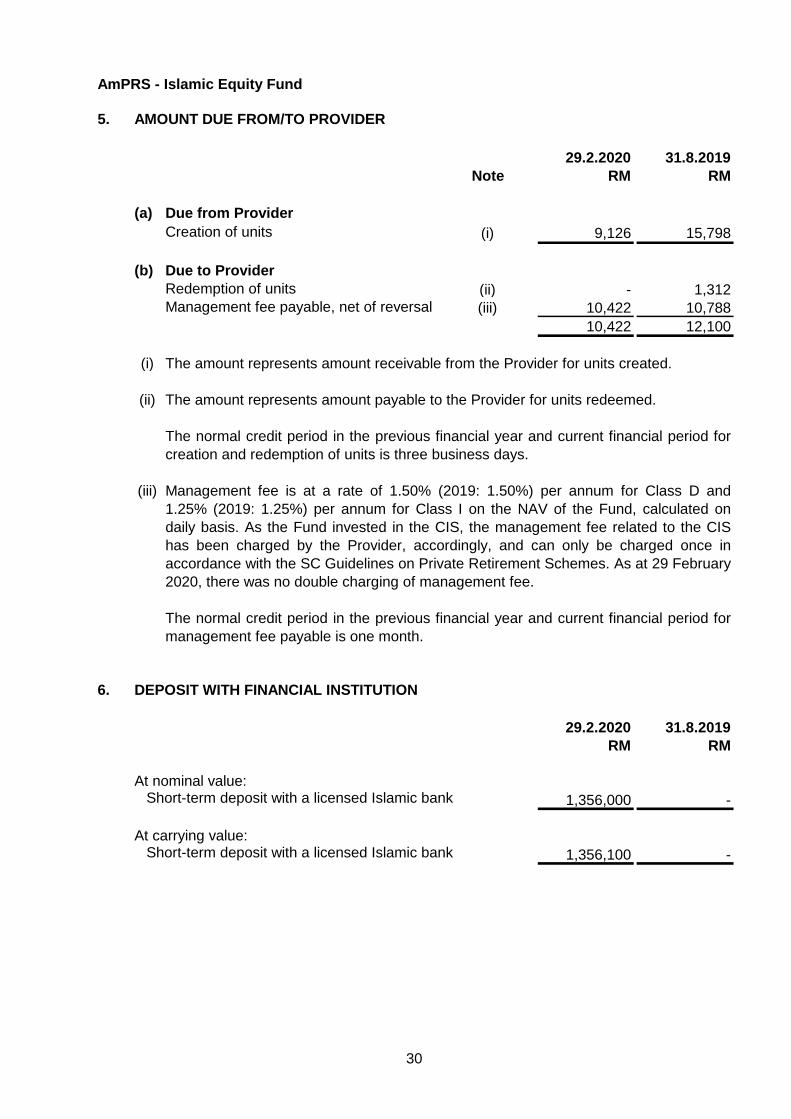
5. AMOUNT DUE FROM/TO PROVIDER
29.2.2020 31.8.2019
Note RM RM
(a) Due from Provider
Creation of units (i) 9,126 15,798
(b) Due to Provider
Redemption of units (ii) - 1,312
Management fee payable, net of reversal (iii) 10,422 10,788
10,422 12,100
(i)
(ii)
(iii)
6. DEPOSIT WITH FINANCIAL INSTITUTION
29.2.2020 31.8.2019
RM RM
At nominal value:Short-term deposit with a licensed Islamic bank 1,356,000 -
At carrying value:Short-term deposit with a licensed Islamic bank 1,356,100 -
The normal credit period in the previous financial year and current financial period for
creation and redemption of units is three business days.
Management fee is at a rate of 1.50% (2019: 1.50%) per annum for Class D and
1.25% (2019: 1.25%) per annum for Class I on the NAV of the Fund, calculated on
daily basis. As the Fund invested in the CIS, the management fee related to the CIS
has been charged by the Provider, accordingly, and can only be charged once in
accordance with the SC Guidelines on Private Retirement Schemes. As at 29 February
2020, there was no double charging of management fee.
The normal credit period in the previous financial year and current financial period for
management fee payable is one month.
The amount represents amount receivable from the Provider for units created.
The amount represents amount payable to the Provider for units redeemed.
30
AmPRS - Islamic Equity Fund
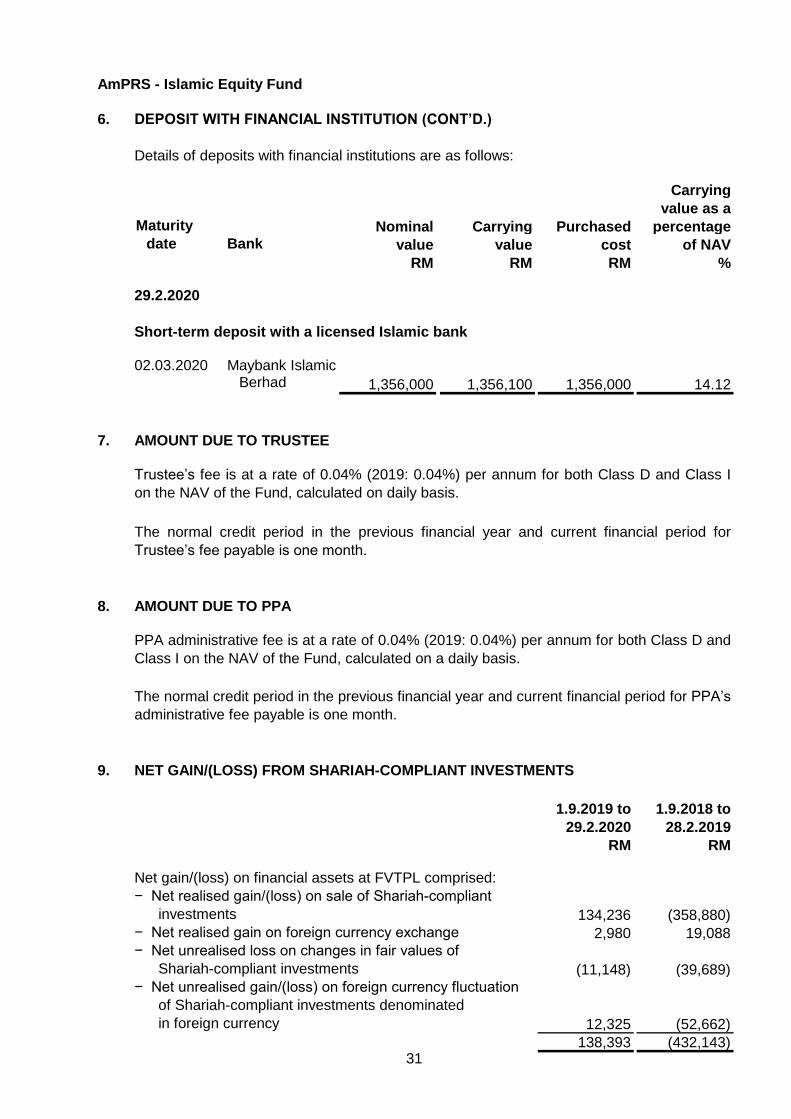
6. DEPOSIT WITH FINANCIAL INSTITUTION (CONT’D.)
Details of deposits with financial institutions are as follows:
Carrying
value as a
Nominal Carrying Purchased percentage date Bank value value cost of NAV
RM RM RM %
29.2.2020
Short-term deposit with a licensed Islamic bank
02.03.2020 Maybank IslamicBerhad 1,356,000 1,356,100 1,356,000 14.12
7. AMOUNT DUE TO TRUSTEE
8. AMOUNT DUE TO PPA
9. NET GAIN/(LOSS) FROM SHARIAH-COMPLIANT INVESTMENTS
1.9.2019 to 1.9.2018 to
29.2.2020 28.2.2019
RM RM
Net gain/(loss) on financial assets at FVTPL comprised:
− Net realised gain/(loss) on sale of Shariah-compliant
investments 134,236 (358,880)
− Net realised gain on foreign currency exchange 2,980 19,088
− Net unrealised loss on changes in fair values of
Shariah-compliant investments (11,148) (39,689)
− Net unrealised gain/(loss) on foreign currency fluctuation
of Shariah-compliant investments denominated
in foreign currency 12,325 (52,662)
138,393 (432,143)
PPA administrative fee is at a rate of 0.04% (2019: 0.04%) per annum for both Class D and
Class I on the NAV of the Fund, calculated on a daily basis.
The normal credit period in the previous financial year and current financial period for
Trustee’s fee payable is one month.
Maturity
Trustee’s fee is at a rate of 0.04% (2019: 0.04%) per annum for both Class D and Class I
on the NAV of the Fund, calculated on daily basis.
The normal credit period in the previous financial year and current financial period for PPA’s
administrative fee payable is one month.
31
AmPRS - Islamic Equity Fund
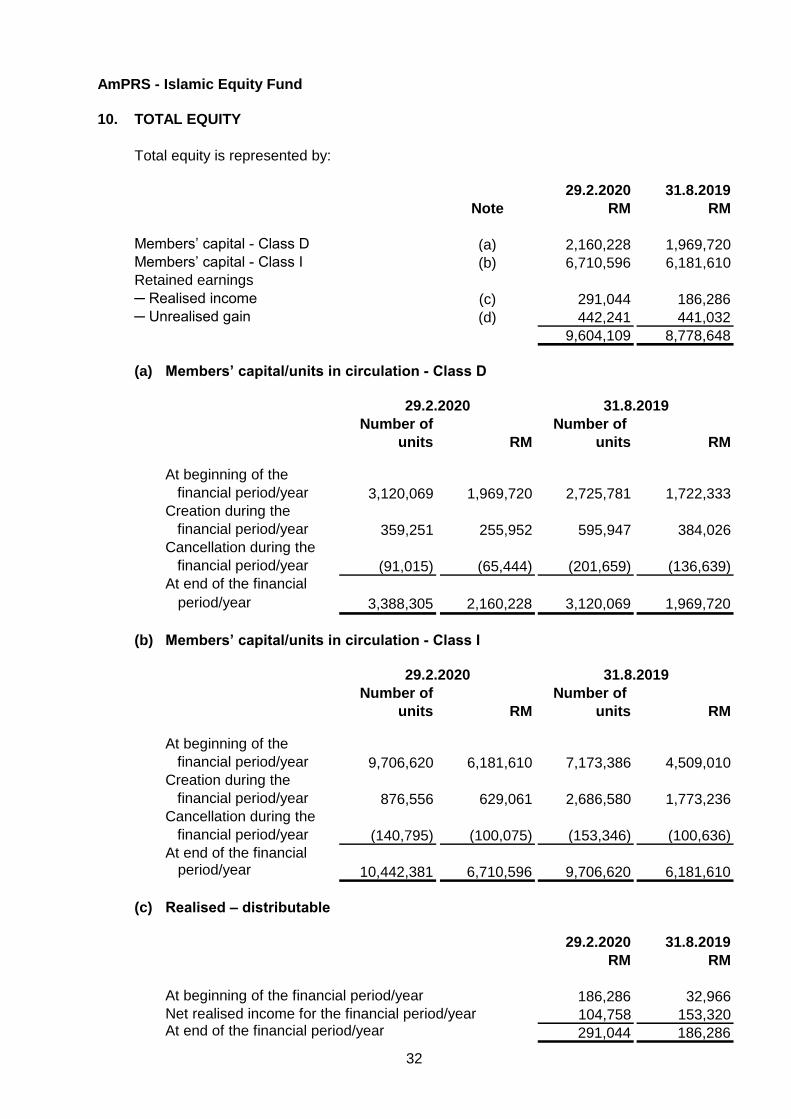
10. TOTAL EQUITY
Total equity is represented by:
29.2.2020 31.8.2019
Note RM RM
Members’ capital - Class D (a) 2,160,228 1,969,720
Members’ capital - Class I (b) 6,710,596 6,181,610
Retained earnings
─ Realised income (c) 291,044 186,286
─ Unrealised gain (d) 442,241 441,032
9,604,109 8,778,648
(a)
29.2.2020 31.8.2019
Number of Number of
units RM units RM
At beginning of the
financial period/year 3,120,069 1,969,720 2,725,781 1,722,333
Creation during the
financial period/year 359,251 255,952 595,947 384,026
Cancellation during the
financial period/year (91,015) (65,444) (201,659) (136,639)
At end of the financial
period/year 3,388,305 2,160,228 3,120,069 1,969,720
(b)
29.2.2020 31.8.2019
Number of Number of
units RM units RM
At beginning of the
financial period/year 9,706,620 6,181,610 7,173,386 4,509,010
Creation during the
financial period/year 876,556 629,061 2,686,580 1,773,236
Cancellation during the
financial period/year (140,795) (100,075) (153,346) (100,636)
At end of the financial period/year 10,442,381 6,710,596 9,706,620 6,181,610
(c) Realised – distributable
29.2.2020 31.8.2019
RM RM
At beginning of the financial period/year 186,286 32,966
Net realised income for the financial period/year 104,758 153,320 At end of the financial period/year 291,044 186,286
Members’ capital/units in circulation - Class I
Members’ capital/units in circulation - Class D
32
AmPRS - Islamic Equity Fund
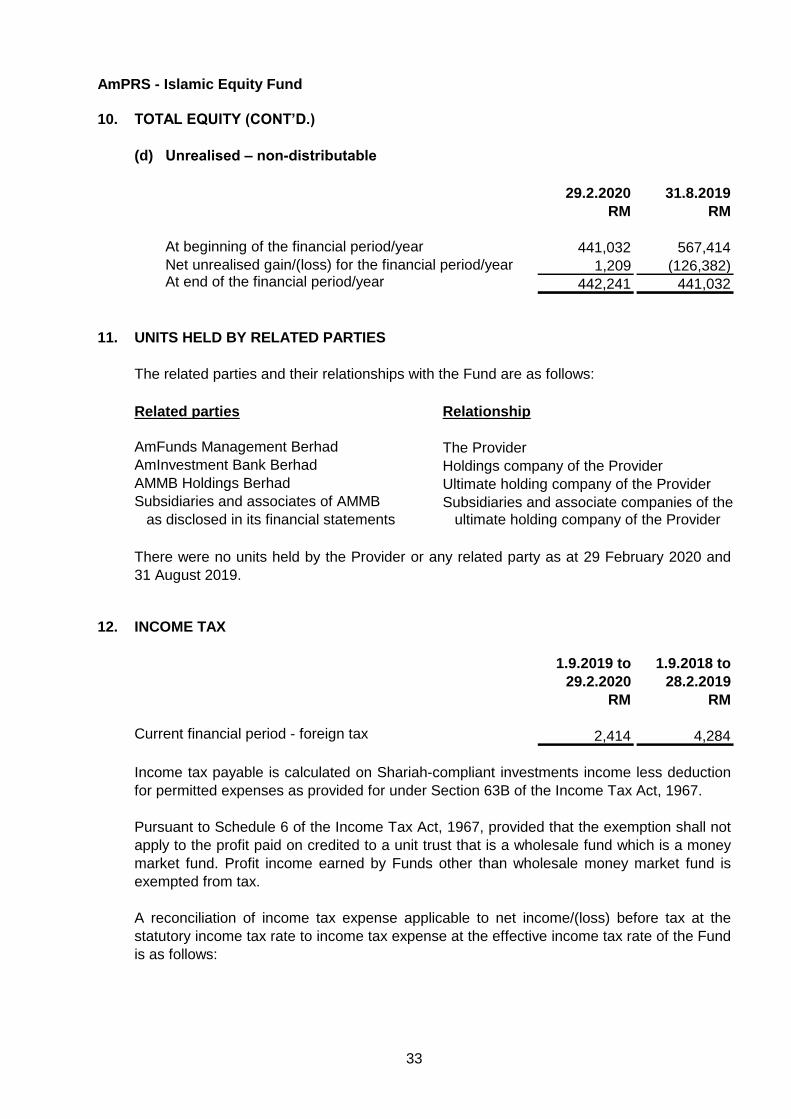
10. TOTAL EQUITY (CONT’D.)
(d) Unrealised – non-distributable
29.2.2020 31.8.2019
RM RM
At beginning of the financial period/year 441,032 567,414
Net unrealised gain/(loss) for the financial period/year 1,209 (126,382)At end of the financial period/year 442,241 441,032
11. UNITS HELD BY RELATED PARTIES
The related parties and their relationships with the Fund are as follows:
Related parties Relationship
AmFunds Management Berhad The Provider
AmInvestment Bank Berhad Holdings company of the Provider
AMMB Holdings Berhad Ultimate holding company of the Provider
Subsidiaries and associates of AMMB Subsidiaries and associate companies of the
as disclosed in its financial statements ultimate holding company of the Provider
12. INCOME TAX
1.9.2019 to 1.9.2018 to
29.2.2020 28.2.2019
RM RM
Current financial period - foreign tax 2,414 4,284
Pursuant to Schedule 6 of the Income Tax Act, 1967, provided that the exemption shall not
apply to the profit paid on credited to a unit trust that is a wholesale fund which is a money
market fund. Profit income earned by Funds other than wholesale money market fund is
exempted from tax.
Income tax payable is calculated on Shariah-compliant investments income less deduction
for permitted expenses as provided for under Section 63B of the Income Tax Act, 1967.
There were no units held by the Provider or any related party as at 29 February 2020 and
31 August 2019.
A reconciliation of income tax expense applicable to net income/(loss) before tax at the
statutory income tax rate to income tax expense at the effective income tax rate of the Fund
is as follows:
33
AmPRS - Islamic Equity Fund
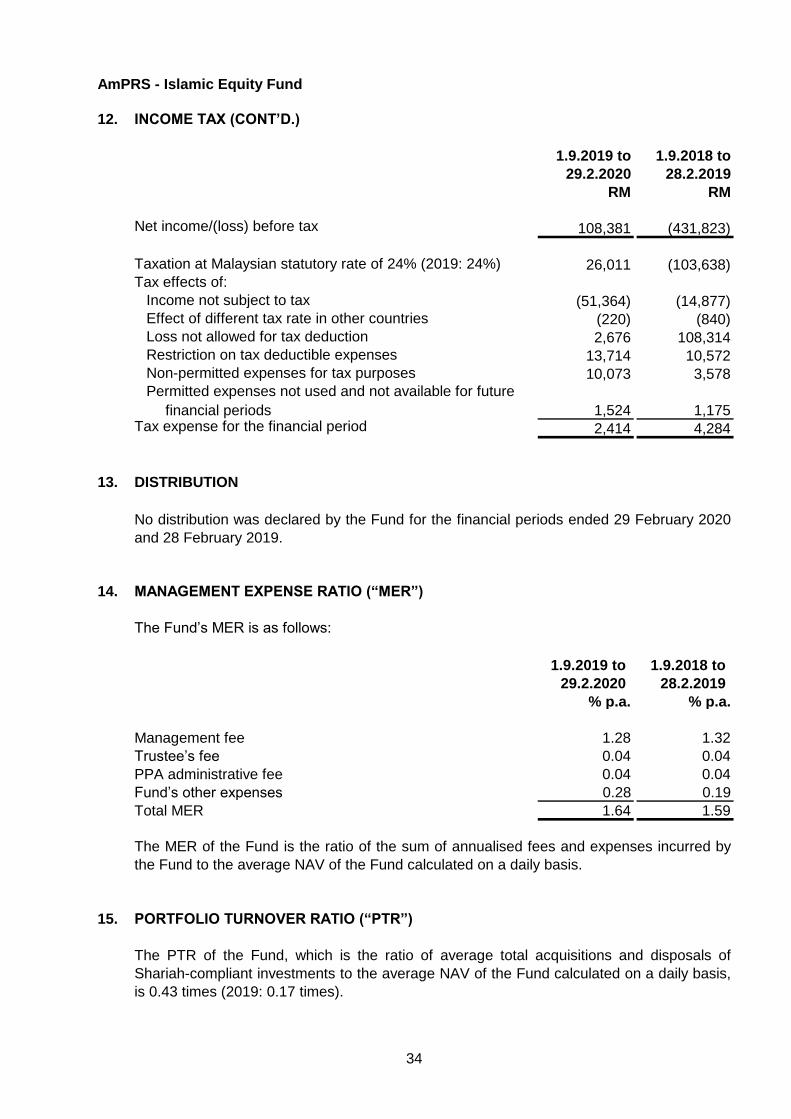
12. INCOME TAX (CONT’D.)
1.9.2019 to 1.9.2018 to
29.2.2020 28.2.2019
RM RM
Net income/(loss) before tax 108,381 (431,823)
Taxation at Malaysian statutory rate of 24% (2019: 24%) 26,011 (103,638)
Tax effects of:
Income not subject to tax (51,364) (14,877)
Effect of different tax rate in other countries (220) (840)
Loss not allowed for tax deduction 2,676 108,314
Restriction on tax deductible expenses 13,714 10,572
Non-permitted expenses for tax purposes 10,073 3,578
Permitted expenses not used and not available for future
1,524 1,175Tax expense for the financial period 2,414 4,284
13. DISTRIBUTION
14. MANAGEMENT EXPENSE RATIO (“MER”)
The Fund’s MER is as follows:
1.9.2019 to 1.9.2018 to
29.2.2020 28.2.2019
% p.a. % p.a.
Management fee 1.28 1.32
Trustee’s fee 0.04 0.04
PPA administrative fee 0.04 0.04
Fund’s other expenses 0.28 0.19
Total MER 1.64 1.59
15. PORTFOLIO TURNOVER RATIO (“PTR”)
No distribution was declared by the Fund for the financial periods ended 29 February 2020
and 28 February 2019.
The MER of the Fund is the ratio of the sum of annualised fees and expenses incurred by
the Fund to the average NAV of the Fund calculated on a daily basis.
The PTR of the Fund, which is the ratio of average total acquisitions and disposals of
Shariah-compliant investments to the average NAV of the Fund calculated on a daily basis,
is 0.43 times (2019: 0.17 times).
financial periods
34
AmPRS - Islamic Equity Fund
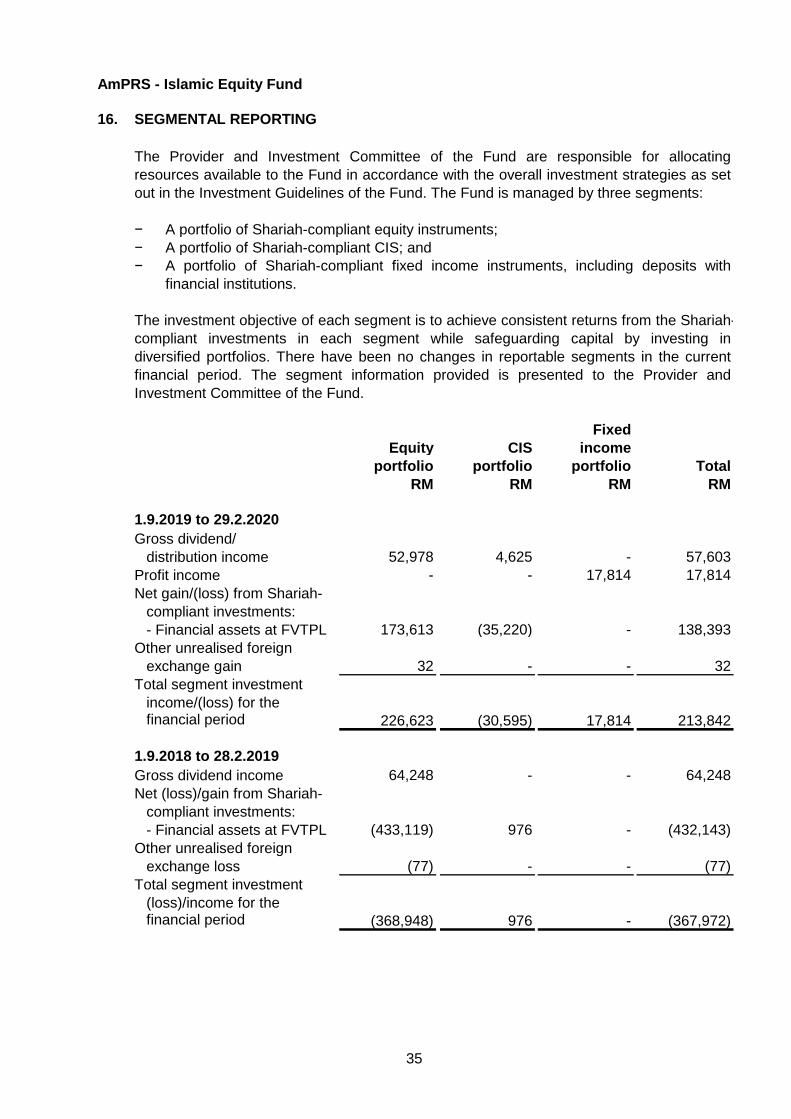
16. SEGMENTAL REPORTING
− A portfolio of Shariah-compliant equity instruments;
− A portfolio of Shariah-compliant CIS; and
−
Fixed
Equity CIS income
portfolio portfolio portfolio Total
RM RM RM RM
1.9.2019 to 29.2.2020
Gross dividend/
distribution income 52,978 4,625 - 57,603
Profit income - - 17,814 17,814
Net gain/(loss) from Shariah-
compliant investments:
- Financial assets at FVTPL 173,613 (35,220) - 138,393
Other unrealised foreign
exchange gain 32 - - 32
Total segment investment
income/(loss) for thefinancial period 226,623 (30,595) 17,814 213,842
1.9.2018 to 28.2.2019
Gross dividend income 64,248 - - 64,248
Net (loss)/gain from Shariah-
compliant investments:
- Financial assets at FVTPL (433,119) 976 - (432,143)
Other unrealised foreign
exchange loss (77) - - (77)
Total segment investment
(loss)/income for the financial period (368,948) 976 - (367,972)
The Provider and Investment Committee of the Fund are responsible for allocating
resources available to the Fund in accordance with the overall investment strategies as set
out in the Investment Guidelines of the Fund. The Fund is managed by three segments:
The investment objective of each segment is to achieve consistent returns from the Shariah-
compliant investments in each segment while safeguarding capital by investing in
diversified portfolios. There have been no changes in reportable segments in the current
financial period. The segment information provided is presented to the Provider and
Investment Committee of the Fund.
A portfolio of Shariah-compliant fixed income instruments, including deposits with
financial institutions.
35
AmPRS - Islamic Equity Fund
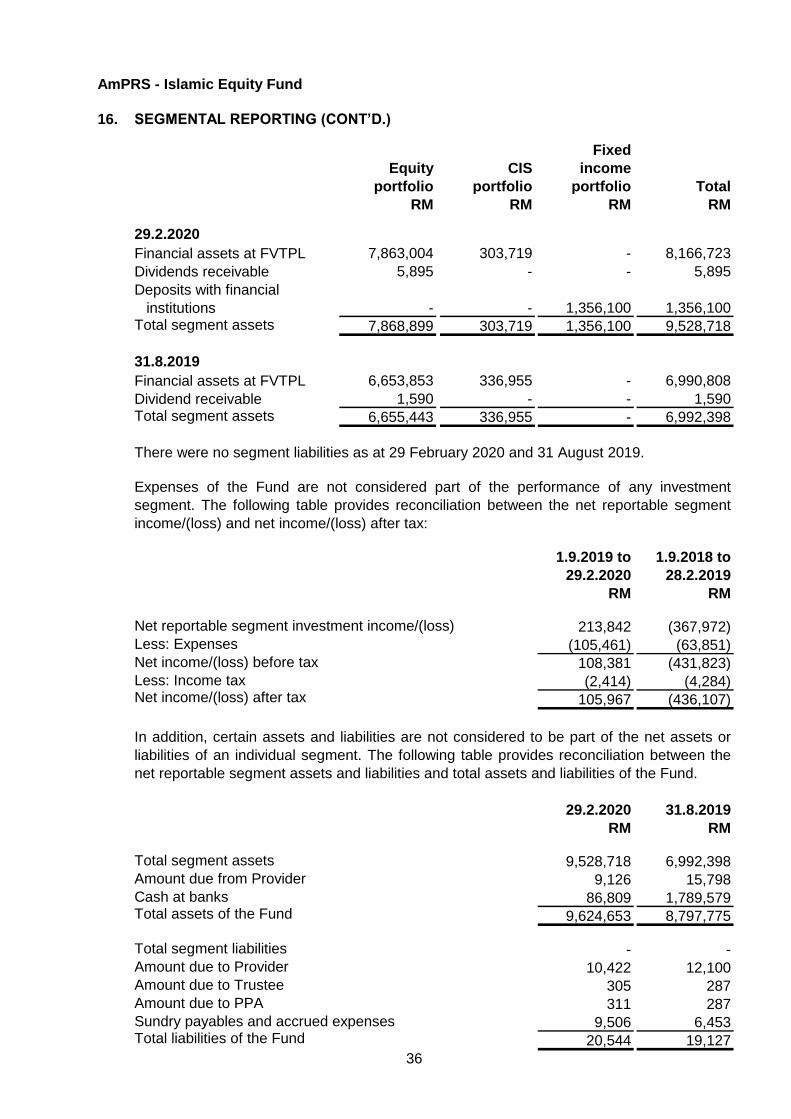
16. SEGMENTAL REPORTING (CONT’D.)
Fixed
Equity CIS income
portfolio portfolio portfolio Total
RM RM RM RM
29.2.2020
Financial assets at FVTPL 7,863,004 303,719 - 8,166,723
Dividends receivable 5,895 - - 5,895
Deposits with financial
institutions - - 1,356,100 1,356,100 Total segment assets 7,868,899 303,719 1,356,100 9,528,718
31.8.2019
Financial assets at FVTPL 6,653,853 336,955 - 6,990,808
Dividend receivable 1,590 - - 1,590 Total segment assets 6,655,443 336,955 - 6,992,398
There were no segment liabilities as at 29 February 2020 and 31 August 2019.
1.9.2019 to 1.9.2018 to
29.2.2020 28.2.2019
RM RM
Net reportable segment investment income/(loss) 213,842 (367,972)
Less: Expenses (105,461) (63,851)
Net income/(loss) before tax 108,381 (431,823)
Less: Income tax (2,414) (4,284)Net income/(loss) after tax 105,967 (436,107)
29.2.2020 31.8.2019
RM RM
Total segment assets 9,528,718 6,992,398
Amount due from Provider 9,126 15,798
Cash at banks 86,809 1,789,579 Total assets of the Fund 9,624,653 8,797,775
Total segment liabilities - -
Amount due to Provider 10,422 12,100
Amount due to Trustee 305 287
Amount due to PPA 311 287
Sundry payables and accrued expenses 9,506 6,453 Total liabilities of the Fund 20,544 19,127
Expenses of the Fund are not considered part of the performance of any investment
segment. The following table provides reconciliation between the net reportable segment
income/(loss) and net income/(loss) after tax:
In addition, certain assets and liabilities are not considered to be part of the net assets or
liabilities of an individual segment. The following table provides reconciliation between the
net reportable segment assets and liabilities and total assets and liabilities of the Fund.
36
AmPRS - Islamic Equity Fund
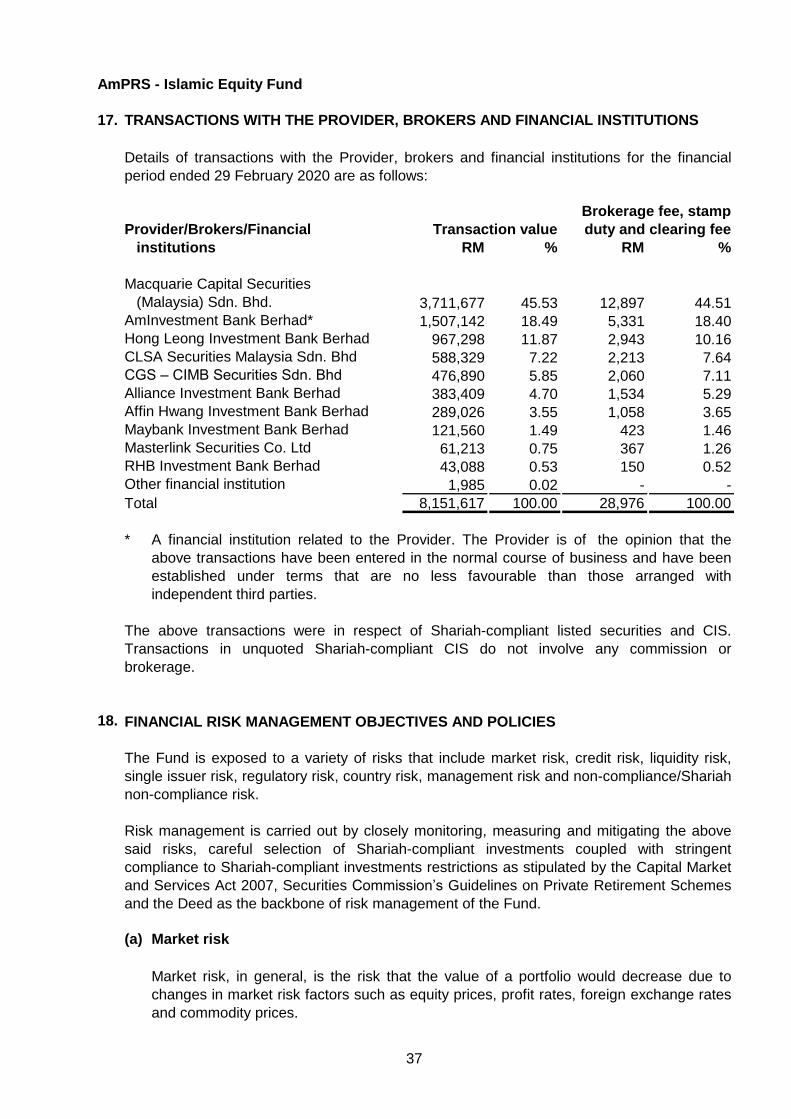
17. TRANSACTIONS WITH THE PROVIDER, BROKERS AND FINANCIAL INSTITUTIONS
Brokerage fee, stamp
Provider/Brokers/Financial Transaction value duty and clearing fee
institutions RM % RM %
Macquarie Capital Securities
(Malaysia) Sdn. Bhd. 3,711,677 45.53 12,897 44.51
AmInvestment Bank Berhad* 1,507,142 18.49 5,331 18.40
Hong Leong Investment Bank Berhad 967,298 11.87 2,943 10.16
CLSA Securities Malaysia Sdn. Bhd 588,329 7.22 2,213 7.64
CGS – CIMB Securities Sdn. Bhd 476,890 5.85 2,060 7.11
Alliance Investment Bank Berhad 383,409 4.70 1,534 5.29
Affin Hwang Investment Bank Berhad 289,026 3.55 1,058 3.65
Maybank Investment Bank Berhad 121,560 1.49 423 1.46
Masterlink Securities Co. Ltd 61,213 0.75 367 1.26
RHB Investment Bank Berhad 43,088 0.53 150 0.52
Other financial institution 1,985 0.02 - -
Total 8,151,617 100.00 28,976 100.00
*
18. FINANCIAL RISK MANAGEMENT OBJECTIVES AND POLICIES
(a) Market risk
Details of transactions with the Provider, brokers and financial institutions for the financial
period ended 29 February 2020 are as follows:
Risk management is carried out by closely monitoring, measuring and mitigating the above
said risks, careful selection of Shariah-compliant investments coupled with stringent
compliance to Shariah-compliant investments restrictions as stipulated by the Capital Market
and Services Act 2007, Securities Commission’s Guidelines on Private Retirement Schemes
and the Deed as the backbone of risk management of the Fund.
The Fund is exposed to a variety of risks that include market risk, credit risk, liquidity risk,
single issuer risk, regulatory risk, country risk, management risk and non-compliance/Shariah
non-compliance risk.
Market risk, in general, is the risk that the value of a portfolio would decrease due to
changes in market risk factors such as equity prices, profit rates, foreign exchange rates
and commodity prices.
A financial institution related to the Provider. The Provider is of the opinion that the
above transactions have been entered in the normal course of business and have been
established under terms that are no less favourable than those arranged with
independent third parties.
The above transactions were in respect of Shariah-compliant listed securities and CIS.
Transactions in unquoted Shariah-compliant CIS do not involve any commission or
brokerage.
37
AmPRS - Islamic Equity Fund
18. FINANCIAL RISK MANAGEMENT OBJECTIVES AND POLICIES (CONT’D.)
(a) Market risk (cont’d.)
(i) Price risk
(ii) Profit rate risk
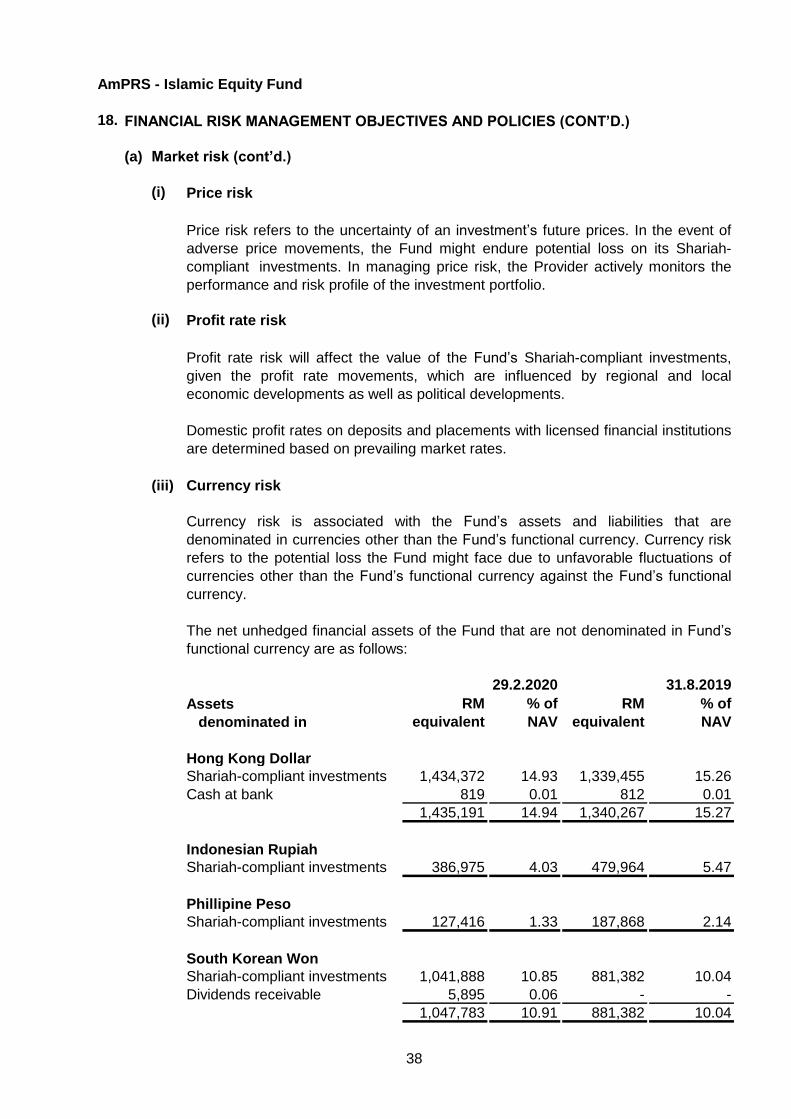
(iii) Currency risk
Assets RM % of RM % of
denominated in equivalent NAV equivalent NAV
Hong Kong Dollar
Shariah-compliant investments 1,434,372 14.93 1,339,455 15.26
Cash at bank 819 0.01 812 0.01
1,435,191 14.94 1,340,267 15.27
Indonesian Rupiah
Shariah-compliant investments 386,975 4.03 479,964 5.47
Phillipine Peso
Shariah-compliant investments 127,416 1.33 187,868 2.14
South Korean Won
Shariah-compliant investments 1,041,888 10.85 881,382 10.04
Dividends receivable 5,895 0.06 - -
1,047,783 10.91 881,382 10.04
The net unhedged financial assets of the Fund that are not denominated in Fund’s
functional currency are as follows:
31.8.201929.2.2020
Price risk refers to the uncertainty of an investment’s future prices. In the event of
adverse price movements, the Fund might endure potential loss on its Shariah-
compliant investments. In managing price risk, the Provider actively monitors the
performance and risk profile of the investment portfolio.
Profit rate risk will affect the value of the Fund’s Shariah-compliant investments,
given the profit rate movements, which are influenced by regional and local
economic developments as well as political developments.
Domestic profit rates on deposits and placements with licensed financial institutions
are determined based on prevailing market rates.
Currency risk is associated with the Fund’s assets and liabilities that are
denominated in currencies other than the Fund’s functional currency. Currency risk
refers to the potential loss the Fund might face due to unfavorable fluctuations of
currencies other than the Fund’s functional currency against the Fund’s functional
currency.
38
AmPRS - Islamic Equity Fund
18. FINANCIAL RISK MANAGEMENT OBJECTIVES AND POLICIES (CONT’D.)
(a) Market risk (cont’d.)
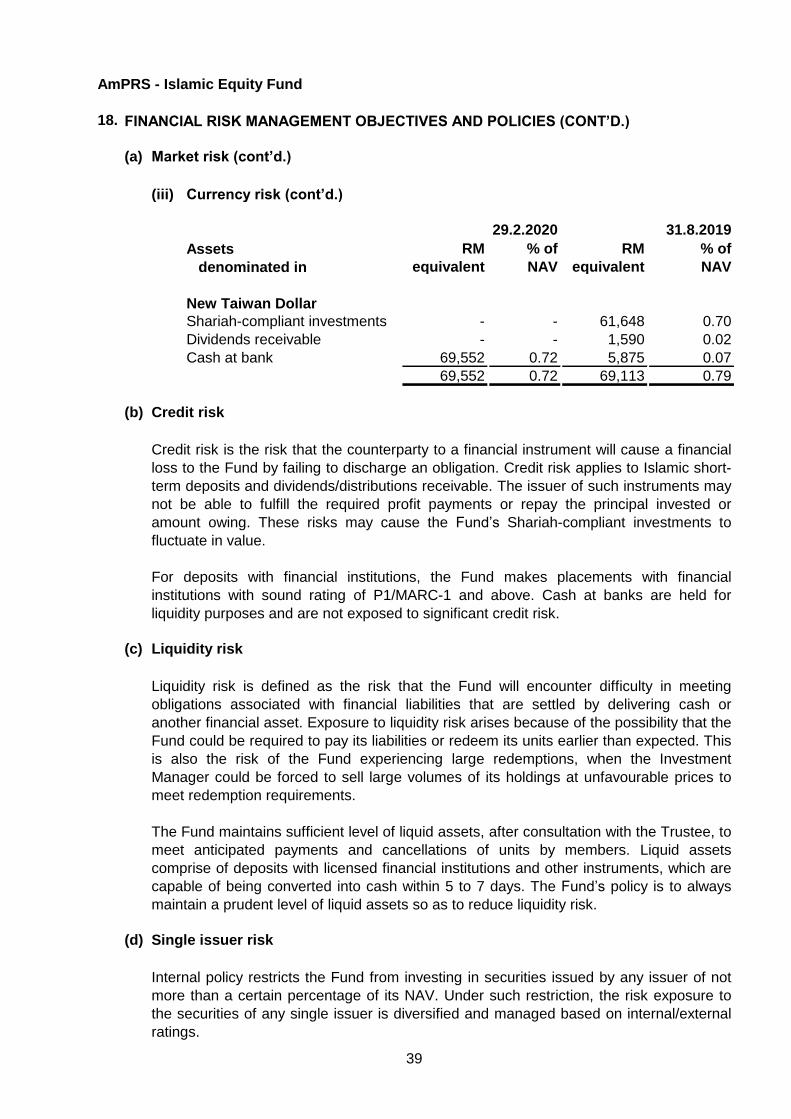
(iii) Currency risk (cont’d.)
Assets RM % of RM % of
denominated in equivalent NAV equivalent NAV
New Taiwan Dollar
Shariah-compliant investments - - 61,648 0.70
Dividends receivable - - 1,590 0.02
Cash at bank 69,552 0.72 5,875 0.07
69,552 0.72 69,113 0.79
(b) Credit risk
(c) Liquidity risk
(d) Single issuer risk
29.2.2020 31.8.2019
Internal policy restricts the Fund from investing in securities issued by any issuer of not
more than a certain percentage of its NAV. Under such restriction, the risk exposure to
the securities of any single issuer is diversified and managed based on internal/external
ratings.
Credit risk is the risk that the counterparty to a financial instrument will cause a financial
loss to the Fund by failing to discharge an obligation. Credit risk applies to Islamic short-
term deposits and dividends/distributions receivable. The issuer of such instruments may
not be able to fulfill the required profit payments or repay the principal invested or
amount owing. These risks may cause the Fund’s Shariah-compliant investments to
fluctuate in value.
Liquidity risk is defined as the risk that the Fund will encounter difficulty in meeting
obligations associated with financial liabilities that are settled by delivering cash or
another financial asset. Exposure to liquidity risk arises because of the possibility that the
Fund could be required to pay its liabilities or redeem its units earlier than expected. This
is also the risk of the Fund experiencing large redemptions, when the Investment
Manager could be forced to sell large volumes of its holdings at unfavourable prices to
meet redemption requirements.
The Fund maintains sufficient level of liquid assets, after consultation with the Trustee, to
meet anticipated payments and cancellations of units by members. Liquid assets
comprise of deposits with licensed financial institutions and other instruments, which are
capable of being converted into cash within 5 to 7 days. The Fund’s policy is to always
maintain a prudent level of liquid assets so as to reduce liquidity risk.
For deposits with financial institutions, the Fund makes placements with financial
institutions with sound rating of P1/MARC-1 and above. Cash at banks are held for
liquidity purposes and are not exposed to significant credit risk.
39
AmPRS - Islamic Equity Fund
18. FINANCIAL RISK MANAGEMENT OBJECTIVES AND POLICIES (CONT’D.)
(e) Regulatory risk
(f) Country risk
(g) Management risk
(h) Non-compliance/Shariah non-compliance risk
Any changes in national policies and regulations may have effects on the capital market
and the NAV of the Fund.
Poor management of the Fund may cause considerable losses to the Fund that in turn
may affect the NAV of the Fund.
This is the risk of the Provider, the Trustee or the Fund not complying with internal
policies, the Deed of the Fund, securities law or guidelines issued by the regulators. In
the case of an Islamic Fund, this includes the risk of the Fund not conforming to Shariah
Investment Guidelines. Non-compliance risk may adversely affect the Shariah-compliant
investments of the Fund when the Fund is forced to rectify the non-compliance.
The risk of price fluctuation in foreign securities may arise due to political, financial and
economic events in foreign countries. If this occurs, there is a possibility that the NAV of
the Fund may be adversely affected.
40
AmPRS - Islamic Equity Fund
STATEMENT BY THE PROVIDER
For and on behalf of the Provider
GOH WEE PENG
Chief Executive Officer
Kuala Lumpur, Malaysia
27 April 2020
I, Goh Wee Peng, for and on behalf of the Provider, AmFunds Management Berhad, for AmPRS -
Islamic Equity Fund (the “Fund”) do hereby state that in the opinion of the Provider, the
accompanying condensed statement of financial position, condensed statement of
comprehensive income, condensed statement of changes in equity, condensed statement of
cash flows and the accompanying notes are drawn up in accordance with Malaysian Financial
Reporting Standards so as to give a true and fair view of the financial position of the Fund as at
29 February 2020 and the comprehensive income, the changes in equity and cash flows of the
Fund for the half year then ended.
AmFunds Management Berhad
41
TRUSTEE’S REPORT
TO THE MEMBERS OF AMPRS - ISLAMIC EQUITY FUND
(a)
(b)
(c)
We have acted as Trustee for AmPRS - Islamic Equity Fund (the “Fund”) for the financial period
from 1 September 2019 to 29 February 2020. To the best of our knowledge, for the financial
period under review, AmFunds Management Berhad (the “PRS Provider”) has operated and
managed the Fund in accordance with the following:-
Ng Hon Leong
Head, Trustee Operations
27 April 2020
Kuala Lumpur
limitations imposed on the investment powers of the PRS Provider under the Deed(s), the
Securities Commission’s Guidelines on Private Retirement Schemes, the Capital Markets
and Services Act 2007 and other applicable laws;
valuation and pricing for the Fund is carried out in accordance with the Deed(s) of the Fund
and any regulatory requirements; and
creation and cancellation of units for the Fund are carried out in accordance with the
Deed(s) of the Fund and any regulatory requirements.
For Deutsche Trustees Malaysia Berhad
Richard Lim Hock Seng
Chief Executive Officer
42
43
REPORT OF THE SHARIAH ADVISER TO THE MEMBERS of AmPRS – Islamic Equity Fund For The Financial Period from 1 September 2019 to 29 February 2020 We have acted as the Shariah Adviser of AmPRS – Islamic Equity Fund. Our responsibility is to
ensure that the procedures and processes employed by AmIslamic Funds Management Sdn Bhd and
that the provisions of the Deed in respect of the AmPRS dated 4 December 2012 and its
supplemental deeds (if any) are in accordance with Shariah principles.
In our opinion, AmIslamic Funds Management Sdn Bhd has managed and administered AmPRS –
Islamic Equity Fund in accordance with Shariah principles and complied with applicable guidelines,
ruling or decision issued by the Securities Commission (SC) pertaining to Shariah matters. We
confirm that the investment portfolio of the Fund comprises securities and/or instruments which have
been classified as Shariah compliant by the Shariah Advisory Council (SAC) of the SC and/or
Shariah Advisory Council (SAC) of Bank Negara Malaysia (BNM), where applicable. For securities
and/or instruments which are not classified as Shariah-compliant by the SAC of the SC and/or SAC
of BNM, we have determined that such securities and/or instruments are in accordance with Shariah
principles and have complied with the applicable Shariah guidelines.
For Amanie Advisors Sdn Bhd
………………………………………….. Datuk Dr Mohd Daud Bakar Executive Chairman 27 April 2020
44
Distributors
For enquiries about this Scheme and any other funds offered by the PRS Provider Please call 2032 2888 between 8.45 a.m. to 5.45 p.m. (Monday-Thursday)
Friday 8.45 a.m. to 5.00 p.m.
DIRECTORY Head Office 9th & 10th Floor, Bangunan AmBank Group
55, Jalan Raja Chulan, 50200 Kuala Lumpur Tel: (03) 2032 2888 Facsimile: (03) 2031 5210 Email: [email protected]
Postal Address AmFunds Management Berhad
P.O Box 13611, 50816 Kuala Lumpur
For more details on the list of distributors, please contact the PRS Provider.