Field results and conceptual understanding of gas flow (crystalline rock) FORGE Report D4.20 – VER.1 Name Organisation Signature Date Compiled Lucie Hausmannová Jana Hubálovská Dana Nádherná Jan Smutek Jiří Svoboda CEG CTU May 2013 Verified Jaroslav Pacovský CEG CTU May 2013 Approved RP Shaw BGS 15 th December 2013 Keywords Gas Conductivity, Permeability, Hydraulic Conductivity, Rock Mass, Gas Injection Tests, Crystalline Rock Bibliographical reference Svoboda, J; Smutek J. 2013. Final Report (WP 4.2.3) - Field results and conceptual understanding of gas flow (crystalline rock) . FORGE Report D4.20: 99pp. Euratom 7 th Framework Programme Project: FORGE
Transcript
Field results and conceptual understanding of gas flow
(crystalline rock)
FORGE Report D4.20 – VER.1
Name Organisation Signature Date
Compiled
Lucie Hausmannová
Jana Hubálovská
Dana Nádherná
Jan Smutek
Jiří Svoboda
CEG CTU May 2013
Verified Jaroslav Pacovský CEG CTU May 2013
Approved RP Shaw BGS
15th December 2013
Keywords Gas Conductivity, Permeability, Hydraulic Conductivity, Rock Mass, Gas Injection Tests, Crystalline Rock
Bibliographical reference
Svoboda, J; Smutek J. 2013. Final Report (WP 4.2.3) - Field results and conceptual understanding of gas flow (crystalline rock) . FORGE Report D4.20: 99pp.
Euratom 7th Framework Programme Project: FORGE
FORGE Report: D4.20 – Ver.1
i
Fate of repository gases (FORGE)
The multiple barrier concept forms the cornerstone of all the schemes envisaged for the underground disposal of radioactive waste. The concept proposes a series of barriers, both engineered and natural, to be positioned between the waste and the surface. The realisation of this concept is the primary objective of all the various disposal programmes put forward to date and will involve a process beginning with site appraisal and characterisation followed by the design of the repository itself and ending with construction and commissioning. However, the eventual performance of the repository as a whole (waste, barriers, engineering disturbed zone, host rock) and, in particular, gas transport have still not been thoroughly examined. Issues relating to a full understanding of basic processes and which still need to be fully investigated include: dilational versus visco-capillary flow mechanisms; the long-term integrity of the seals, in particular gas flow along contact zones; the role of the EDZ as a conduit for preferential flow and laboratory to field up-scaling. Understanding gas generation and migration is thus vital when considering the quantitative assessment of repositories and forms the focus for research in the integrated, multi-disciplinary project described herein. The FORGE project is a pan-European project with links to international radioactive waste management organisations, regulators and academia, specifically designed to tackle the key research issues associated with the generation and movement of repository gases. The long-term performance of bentonite buffers, plastic clays, indurated mudrocks and crystalline formations are of particular importance. Further experimental data is
required to reduce the uncertainty relating to the quantitative treatment of gases in performance assessment. FORGE will address these issues through a series of laboratory and field-scale experiments, including the development of new up-scaling methods which will allow the optimisation of concepts through detailed scenario analysis. FORGE partners are committed to training and CPD through the provision of a broad portfolio of training opportunities and initiatives which form a significant part of the project. Further details on the FORGE project and its results can be accessed at www.FORGEproject.org. Contact details:
Ing. Jiří Svoboda, Ph.D.
Centre of Experimental Geotechnics (Faculty of Civil Engineering, Faculty of Civil Engineering)
Fig. 18 - Dependence of intrinsic permeability on injection pressure .... 29
Fig. 19 - Dependence of intrinsic permeability on flow rate .................. 29
Fig. 20 - Dependence of injection pressure on flow rate ........................ 30
Fig. 21 - Results of double packer gas injection tests ............................. 31
Fig. 22 - Example of a migration test ....................................................... 33
Fig. 23 - Example of a migration test - beginning of injection ................ 33
Fig. 24 - Dependence of intrinsic permeability on injection pressure (gas and water injection tests) ................................................................................................. 34
Fig. 25 - Dependence of intrinsic permeability (water injection tests) on injection pressure 35
Fig. 26 - Dependence of intrinsic permeability (gas CFIT tests) on injection pressure 36
Fig. 27 - Dependence of intrinsic permeability (gas CHIT tests) on injection pressure 37
Fig. 29 – Mokrsko-west map – locations of detectable air outflow ....... 38
Summary This report forms a contribution to Work Package 4 of the FORGE project. One of a number of deep RAW repository construction concepts considers crystalline structures as the host rock environment. The main objective of the research was to study the behaviour of such rock environments with respect to gas transport. Large-scale gas injection measurements were carried out as part of the project the aim of which was to study the behaviour of both the excavation damaged/disturbed zone (EDZ) and the undisturbed rock environment of crystalline rock formations. The Josef Underground Laboratory was used for in-situ testing. The various phenomena, which will be important with regard to the final design of repositories, were studied employing gas injection test techniques using both single and double packer equipment.
The project schedule involved the performance of a large number of tests at various pressure levels and flow rates and in different parts of the rock mass. The tests enabled the study of the differences between the EDZ and the undisturbed rock mass as well as that of pathway dilation processes and associated ir/reversibility. The research consisted of three stages: site characterisation, pilot testing and main field testing. The objective of the pilot testing stage was to verify the characteristics of the rock mass in-situ, to test and confirm the instrumentation to be employed and to finalise the design of the testing methodology.
The method used for main field testing consisted of the gradual deepening of a borehole drilled into the granodiorite rock area of the Josef facility and the measurement of gas permeability using specially-designed gas injection methods. More than 40 long-term series of tests were performed in the vertical borehole, each test consisting of several subtests made up of the Constant Head Injection Test - CHIT, Constant Flow Injection test - CFIT and Pressure Drop Test - PDT. In the final stage of the project a series of migration tests were performed consisting of the observation of pressure in a monitoring borehole.
The tests performed revealed a significant difference in terms of gas permeability between the EDZ and the undisturbed rock mass and the results have helped to increase the level of understanding of how gas flow performs in the EDZ. An investigation of the influence of the effect of pressure on gas permeability was also performed in order to study the process of the opening and closing of fractures (pathway dilation). An increase in gas permeability following the opening of pathways was observed during testing with the double packer but not during single packer testing in more distant undamaged sections of the rock mass even when the injection pressure exceeded the primary stress level. These results suggest that fracture opening takes place only following localised gas injection and not where the gas flow takes place over an extensive area of the rock mass. The results also proved that maximum permeability, observed during periods of maximum pathway opening, corresponds to average permeability at a particular depth in the rock mass.
A very extensive benchmark database for use in mathematical modelling was obtained from the project. The data covers a significant number of regimes and ranges which will help to further improve and validate mathematical models concerned with gas flow in fractured crystalline rock.
FORGE Report: D4.20 – Ver.1
5
Introduction This report forms a contribution to Work Package 4 of the FORGE project. The CEG’s role in the FORGE-WP4 project was to study the behaviour of crystalline rock formations in the environment of deep RAW repositories. The Josef Underground Laboratory was used for the purposes of testing which consisted of large-scale gas injection measurement. The aim of the project was to study the behaviour of both the excavation damaged/disturbed zone (EDZ) and the undisturbed rock environment of the crystalline rock host formation. Phenomena important with respect to the design of RAW repositories were studied using gas injection test techniques employing both single and double packer equipment.
FORGE Report: D4.20 – Ver.1
6
1. Description of the experiments The research focused on two main areas the first of which was to study the differences between the EDZ and the undisturbed host rock and the second to study pathway dilation processes. In order to obtain experimental data for the study of these processes a series of tests was conducted at the Josef Underground Laboratory. The testing methodology was based on the large-scale in-situ gas injection technique the principle of which is to inject compressed air into boreholes which have been sealed using the packer system and the subsequent monitoring of the behaviour of the injected air. A mobile measuring device was designed especially for this purpose.
The research consisted of three stages: site characterisation, pilot testing and main field testing. During the site characterisation stage a total of four sites, with differing geological conditions, were selected for pilot testing purposes. A detailed geological description of the sites was carried out and a horizontal borehole was drilled at each location at which pilot gas injection testing was subsequently conducted. The objective of the pilot testing stage was to verify the characteristics of the rock mass in-situ, to test and confirm the instrumentation setup and to finalise the design of the testing methodology.
Based on the results of these initial tests and according to a decision taken at the Brussels WP2 meeting an additional vertical borehole was then drilled into the granodiorite rock area of the Josef facility for the purposes of taking field measurements. The method used for the research consisted of the gradual deepening of this borehole and the measurement of gas permeability using gas injection methods. The testing procedure primarily consisted of the performance of a large number of tests of various types involving the measurement of pressure levels in different borehole sections (at every stage of borehole deepening) and their subsequent evaluation. A parallel observation borehole was drilled in the final stage of the project since it was thought that drilling in the earlier stages of the experiment might negatively impact initial measurements (it could have caused the interconnection of joint systems and thus altered flow patterns within the rock mass). Therefore in order to mitigate such risks this borehole was drilled as late as possible. However, the drilling of this borehole was considered important in terms of migration testing and a series of migration tests was performed therein as the final part of the field investigation stage all of which provided very important data for the understanding of gas flow in fractured rock.
1.1. SITE CHARACTERISATION The Josef facility is an underground laboratory complex created by means of the reconstruction of the former Josef exploratory gold mine galleries. The underground complex consists of the main exploration gallery which is connected to the two main sections (Celina and Mokrsko). Both sections consist of a number of drifts (galleries) with a cross-section of around 15m2 which can be used for in-situ experiments. Celina and the eastern part of Mokrsko are situated in tuffs and vulcanites of the Jilovske belt. Most of the western section of Mokrsko lies in granodiorite rock of the Central Bohemian Pluton. The overlying rock thickness ranges from between 90m and 150m and most of the galleries are unlined.
The area was mapped in detail during the conducting of exploratory work in the 1980s. The objective of the exploration was to come up with an estimate of the gold reserves in the area. The gold mineralisation zones are made up of a network of steep parallel veins and veinlets.
FORGE Report: D4.20 – Ver.1
7
Therefore mapping also focused on the documentation of tectonic features and the mining maps include information on discontinuities (joints). The rock environment is characterised by a high level of jointing and, in the vertical direction, is traversed by venous rocks. In addition to natural jointing, the rock massif was disturbed in areas surrounding the open underground spaces as a result of construction work. The technology employed during construction and exploration consisted of drilling and blasting which led to the formation of an extensive EDZ. Detailed geological mapping was carried out as part of the project at those locations selected for gas injection testing (Svoboda and Smutek, 2010). Detailed geological investigation included the study of rock petrography, hydrogeology and tectonic characteristics. Rock mass classification systems were also employed in order to assess the quality of the rock mass.
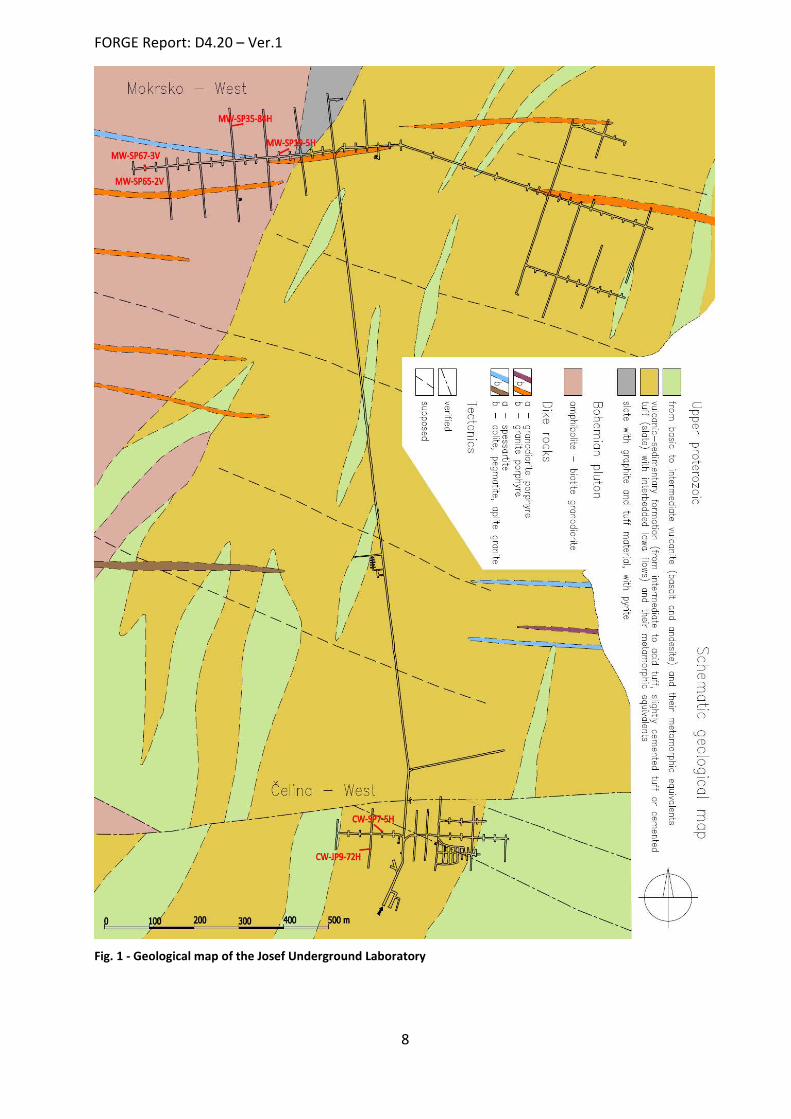
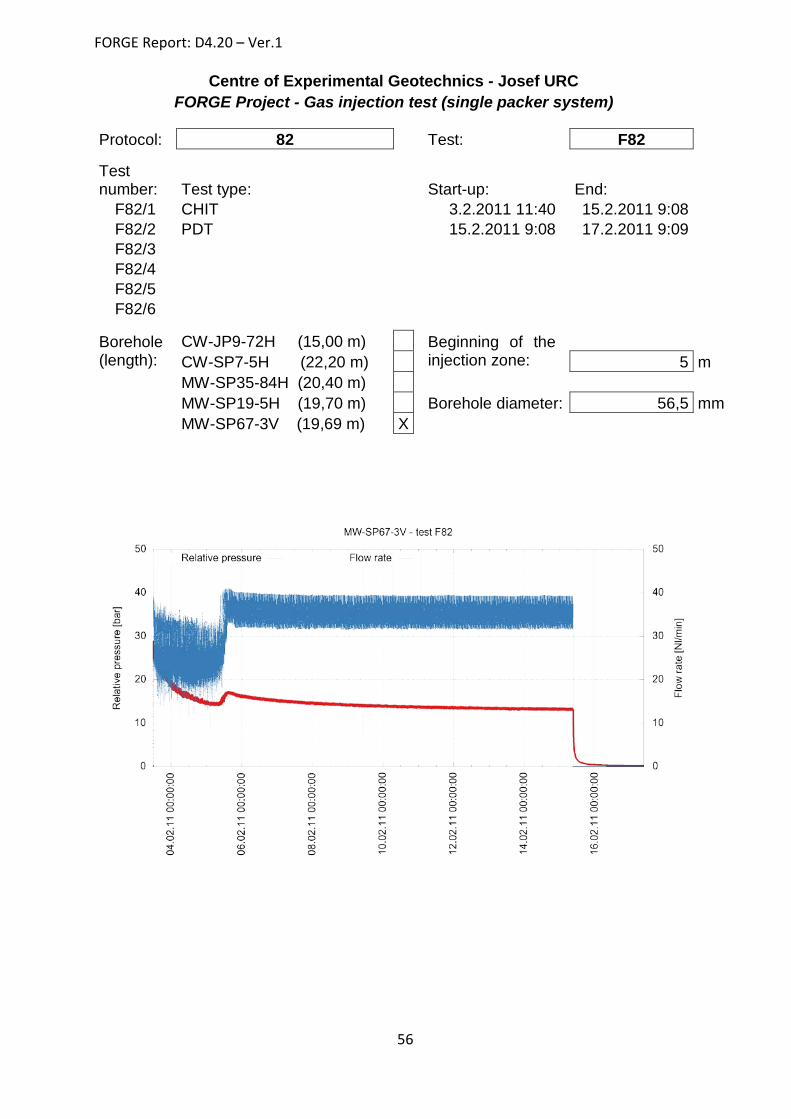
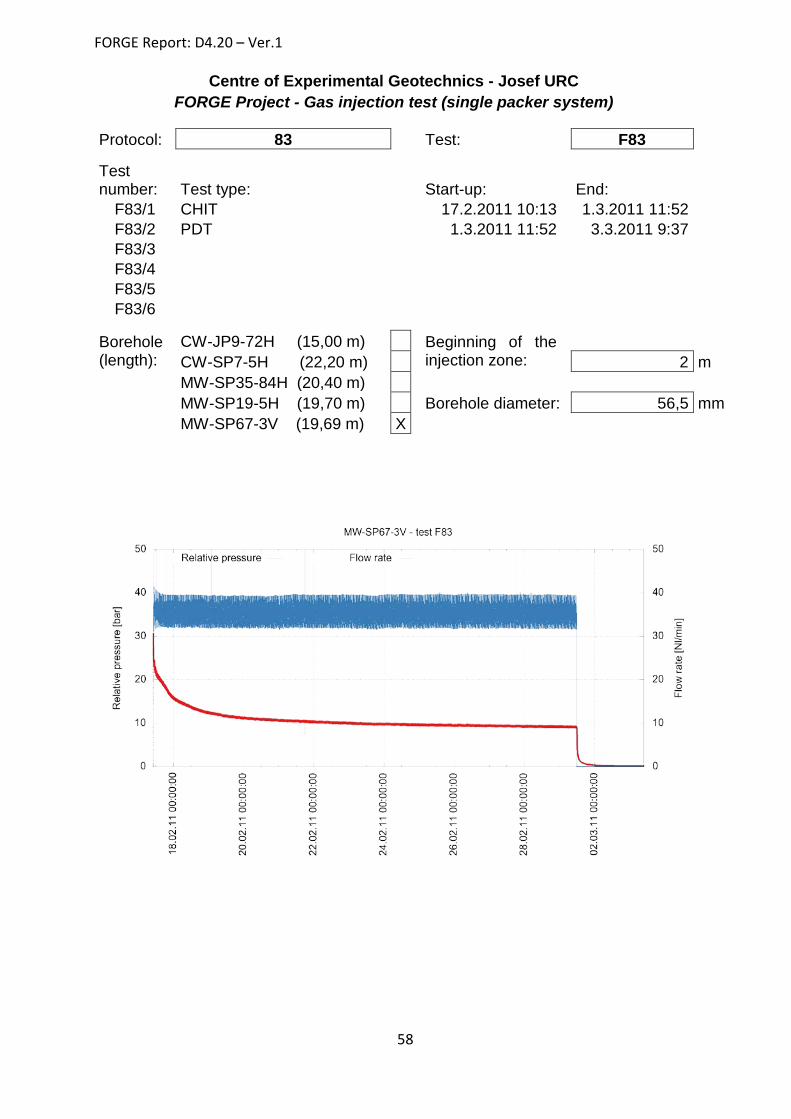
Horizontal boreholes, with a diameter of 57mm, were drilled at each of the four locations for the purpose of pilot testing (CW-JP9-72H, CW-SP7-5H, MW-SP35-84H, MW-SP19-5H). The length of the boreholes ranged between fifteen and twenty-two meters. In the second phase a new site was selected in the Mokrsko-West area in granitic rock (Svoboda and Smutek, 2011). A vertical borehole (MW-SP67-3V) also with a diameter of 57mm directed beneath the water table was drilled at this site. The local water table is at the level of the bottom of the tunnel; the gallery serves for the drainage of underground water. In the first phase the borehole was sunk to a depth of 19.69m, following the conducting of pressure tests it was extended to a depth of 30.10m and in the final stage to 40.50m. In the last phase of the project a vertical borehole (MW-SP65-2V) was drilled in the opposite drift for the purposes of migration testing. The position of all the test boreholes can be seen in the geological map in Fig. 1.
The petrography of the Mokrsko-West area is relatively monotonous i.e. grey and green-grey biotitic-amphibolic granodiorite (Sázava type - Upper Devonian) with fine to intermediate crystallisation. The host rock is traversed by a nearly vertical (steep) system of quartz (calcite, barite) veins. The height of the overburden (MW-SP67 drift) is approximately 100m, therefore, based on the known material characteristics of the rock, the primary stress level in the parts of the rock mass unaffected by excavation was estimated at between 2.5 and 3.0MPa.
FORGE Report: D4.20 – Ver.1
8
Fig. 1 - Geological map of the Josef Underground Laboratory
FORGE Report: D4.20 – Ver.1
9
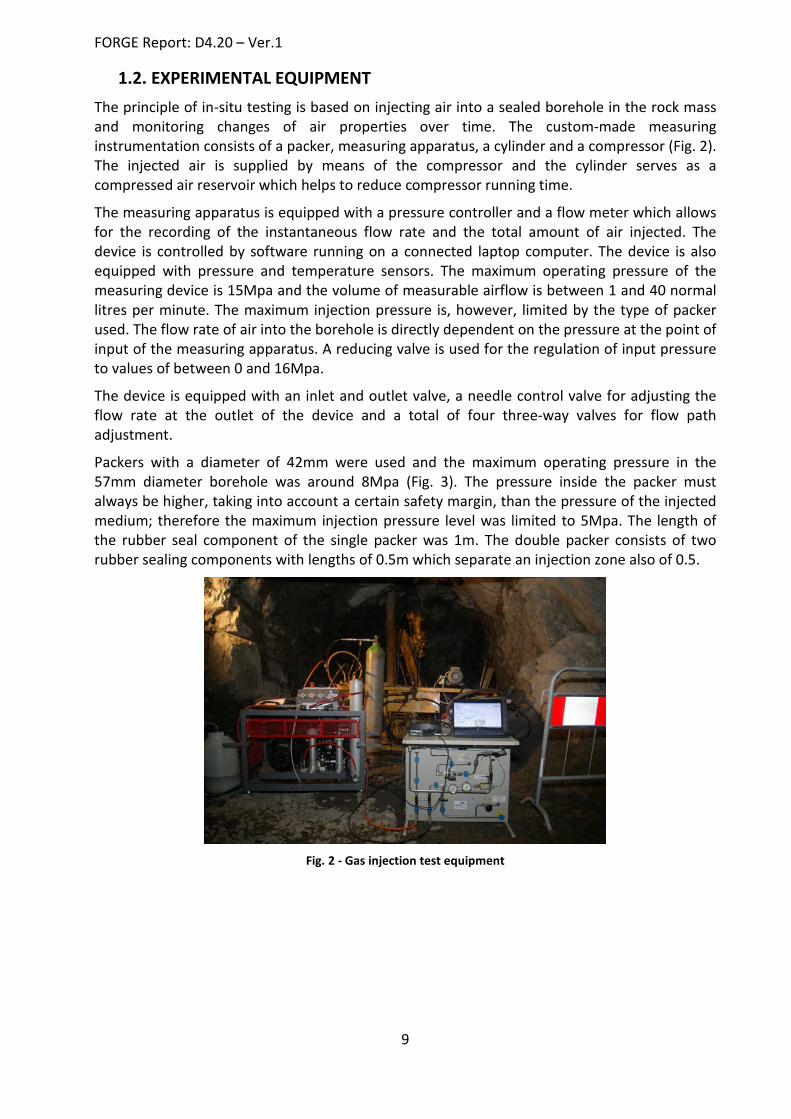
1.2. EXPERIMENTAL EQUIPMENT The principle of in-situ testing is based on injecting air into a sealed borehole in the rock mass and monitoring changes of air properties over time. The custom-made measuring instrumentation consists of a packer, measuring apparatus, a cylinder and a compressor (Fig. 2). The injected air is supplied by means of the compressor and the cylinder serves as a compressed air reservoir which helps to reduce compressor running time.
The measuring apparatus is equipped with a pressure controller and a flow meter which allows for the recording of the instantaneous flow rate and the total amount of air injected. The device is controlled by software running on a connected laptop computer. The device is also equipped with pressure and temperature sensors. The maximum operating pressure of the measuring device is 15Mpa and the volume of measurable airflow is between 1 and 40 normal litres per minute. The maximum injection pressure is, however, limited by the type of packer used. The flow rate of air into the borehole is directly dependent on the pressure at the point of input of the measuring apparatus. A reducing valve is used for the regulation of input pressure to values of between 0 and 16Mpa.
The device is equipped with an inlet and outlet valve, a needle control valve for adjusting the flow rate at the outlet of the device and a total of four three-way valves for flow path adjustment.
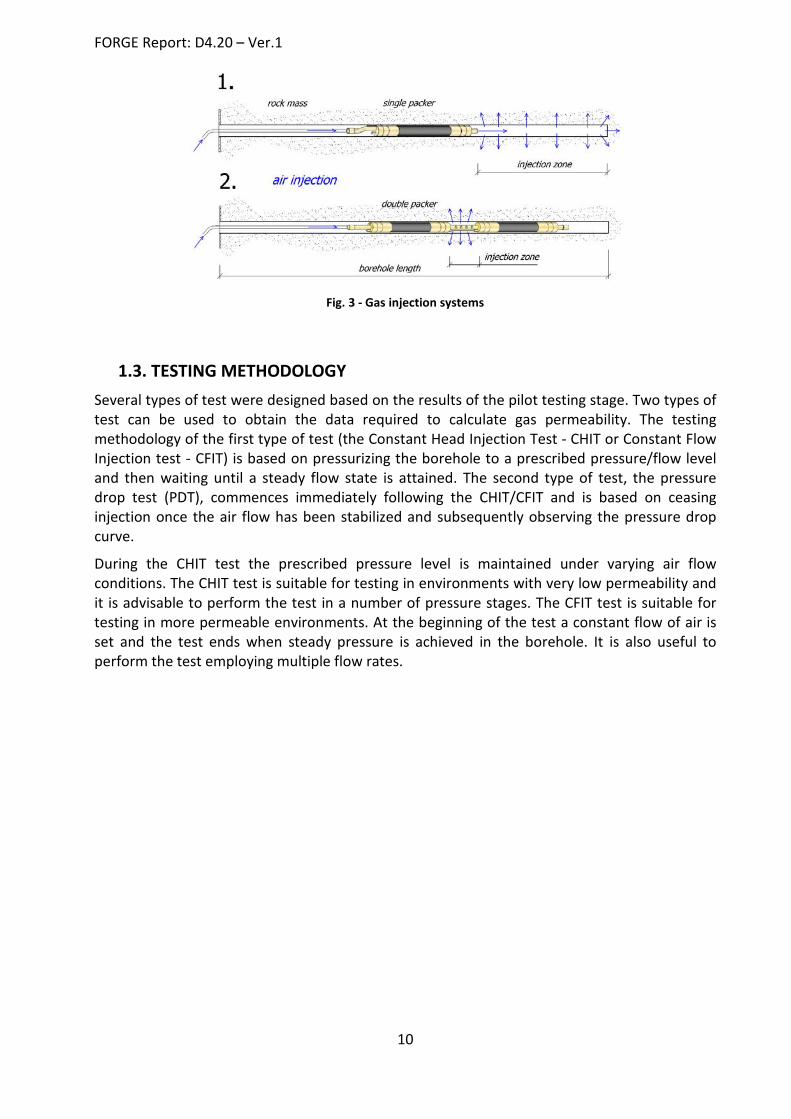
Packers with a diameter of 42mm were used and the maximum operating pressure in the 57mm diameter borehole was around 8Mpa (Fig. 3). The pressure inside the packer must always be higher, taking into account a certain safety margin, than the pressure of the injected medium; therefore the maximum injection pressure level was limited to 5Mpa. The length of the rubber seal component of the single packer was 1m. The double packer consists of two rubber sealing components with lengths of 0.5m which separate an injection zone also of 0.5.
Fig. 2 - Gas injection test equipment
FORGE Report: D4.20 – Ver.1
10
Fig. 3 - Gas injection systems
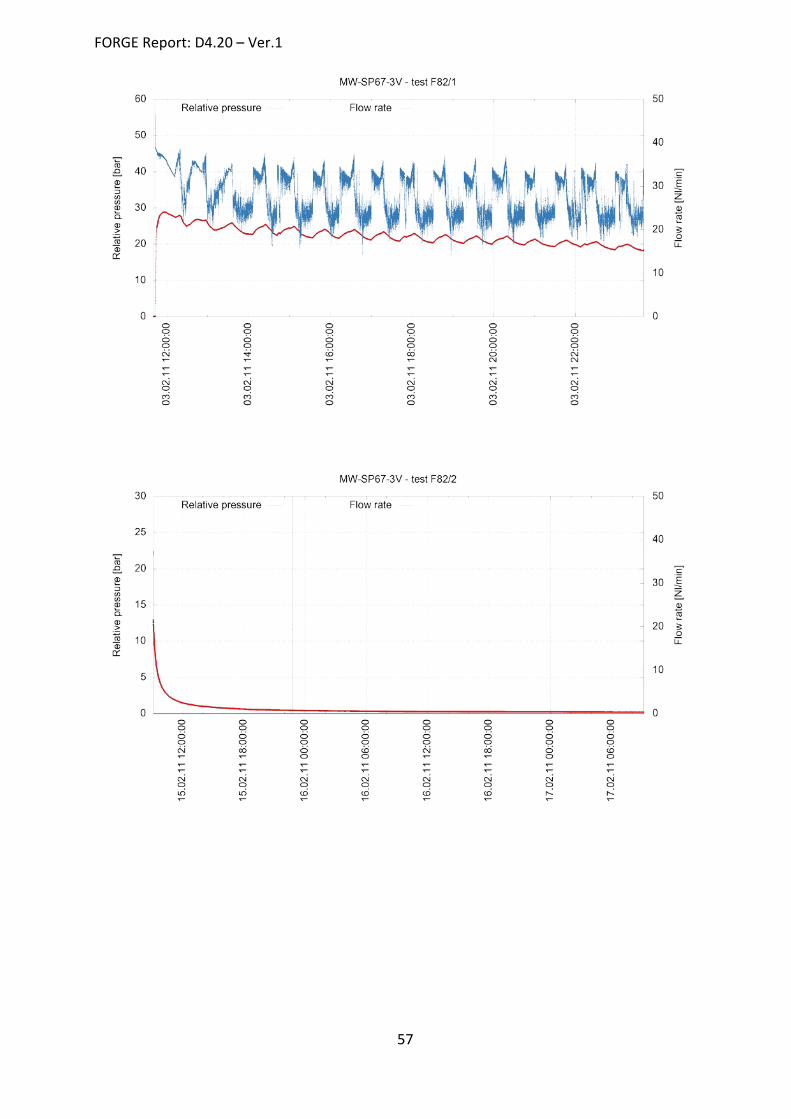
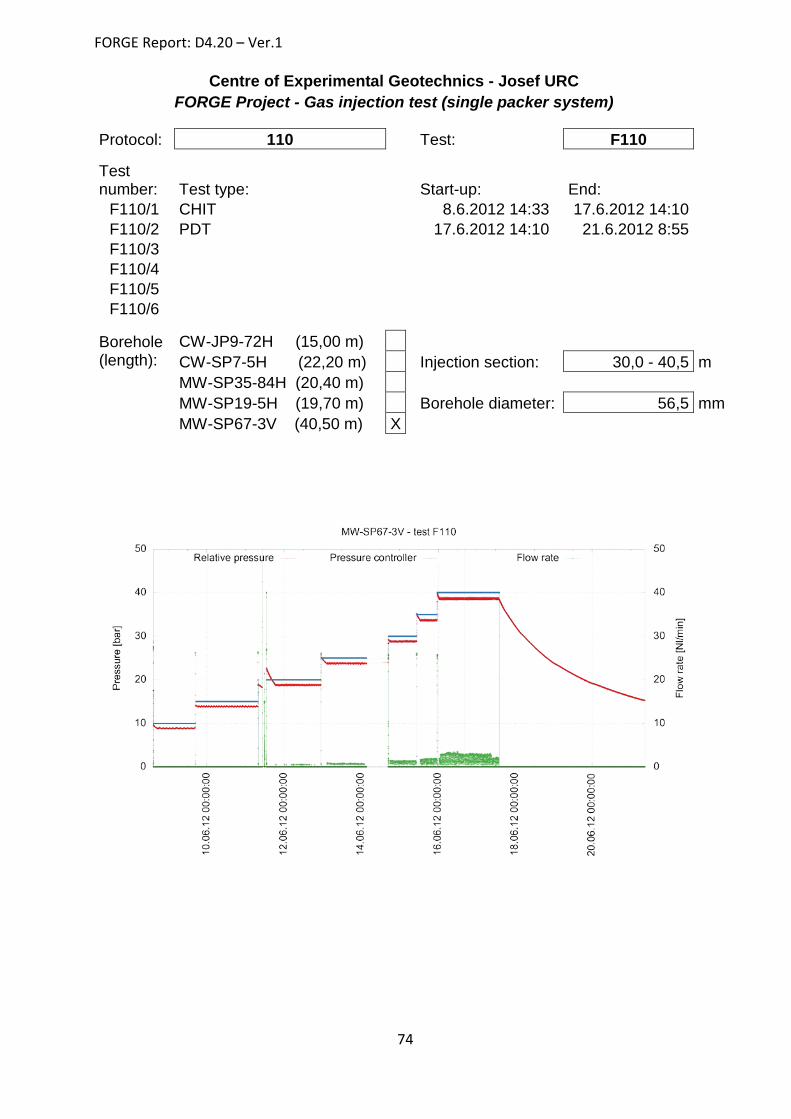
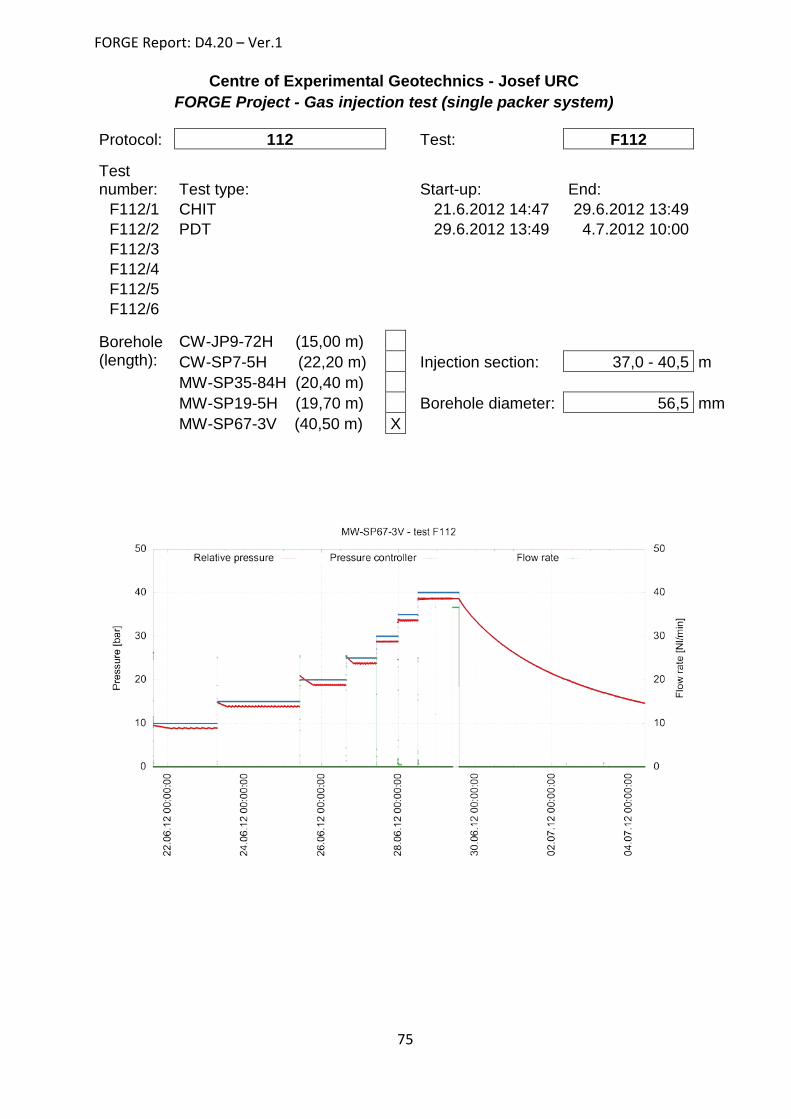
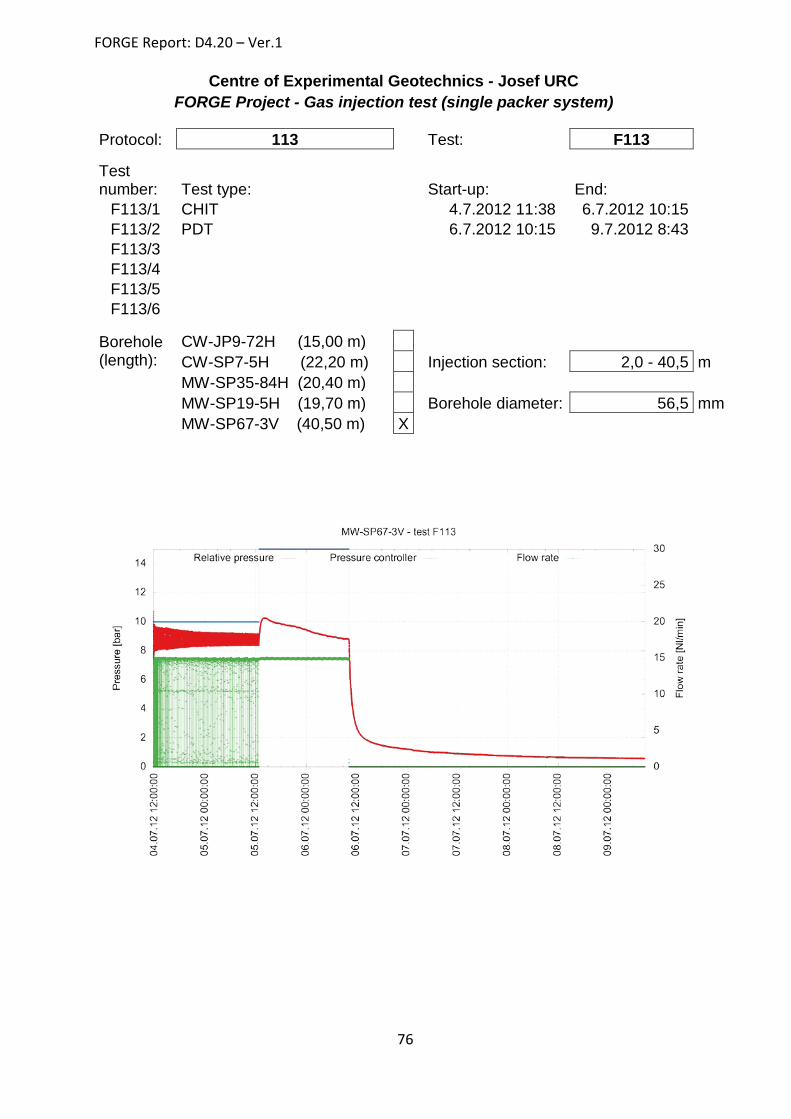
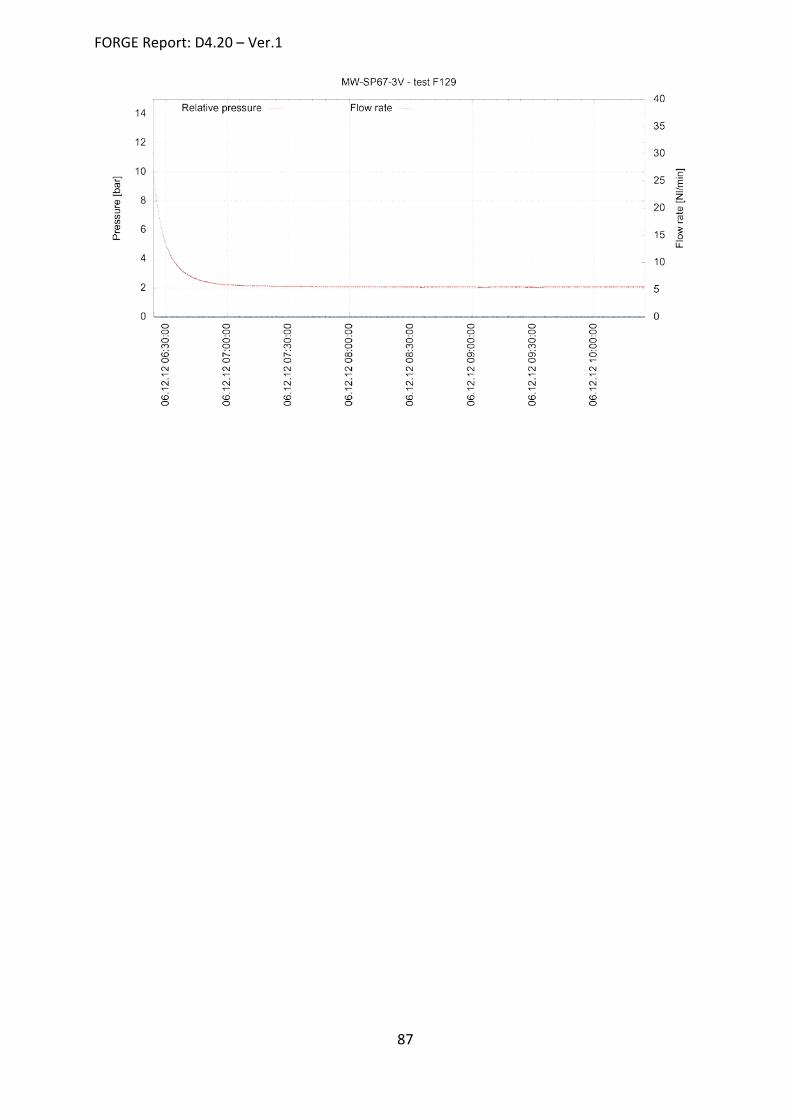
1.3. TESTING METHODOLOGY Several types of test were designed based on the results of the pilot testing stage. Two types of test can be used to obtain the data required to calculate gas permeability. The testing methodology of the first type of test (the Constant Head Injection Test - CHIT or Constant Flow Injection test - CFIT) is based on pressurizing the borehole to a prescribed pressure/flow level and then waiting until a steady flow state is attained. The second type of test, the pressure drop test (PDT), commences immediately following the CHIT/CFIT and is based on ceasing injection once the air flow has been stabilized and subsequently observing the pressure drop curve.
During the CHIT test the prescribed pressure level is maintained under varying air flow conditions. The CHIT test is suitable for testing in environments with very low permeability and it is advisable to perform the test in a number of pressure stages. The CFIT test is suitable for testing in more permeable environments. At the beginning of the test a constant flow of air is set and the test ends when steady pressure is achieved in the borehole. It is also useful to perform the test employing multiple flow rates.
FORGE Report: D4.20 – Ver.1
11
2. Test objectives and expectations The research focused on the understanding of gas flow in a repository-type environment. Several areas were investigated the first of which was to study the differences between gas flow in the EDZ and that in the undisturbed host rock and to study pathway dilation processes. Reversibility and repeating processes were investigated among several other phenomena.
The permeability of the rock is greater and the associated sealing functions less effective within the disturbed/damaged rock environment of the EDZ than elsewhere in the rock mass. Therefore it was considered important to study permeability within the EDZ as well as the more distant intact host rock. Since it was expected that there would be an extensive EDZ in the vicinity of the borehole openings, it was also expected that gas permeability would decrease with distance from the gallery. Therefore, in order to confirm the hypothesis, a testing method was employed which involved the gradual deepening of a vertical borehole. The borehole was gradually extended and the gas permeability of individual sections of the borehole measured using pressure test techniques.
The typical behaviour of crystalline rocks containing discontinuity networks of various origins involves the opening of preferential pathways (pathway dilation) following the injection of any media. Once injection pressure exceeds the corresponding primary stress level, existing fractures are opened further and new fractures created which typically leads to a local increase in rock permeability. One of the objectives of the experiment was to verify the expectation that higher injection pressure levels lead to the opening of preferential pathways allowing the escape of gas which, in turn, leads to an increase in gas permeability. A series of gas injection tests was performed at various pressure levels in order to examine the trend of increasing permeability with increasing gas pressure. Testing was conducted at various pressure levels both above and below the expected rock mass primary stress value and employing a range of injected air flow rates.
Pathway stability was studied using primarily data obtained by the performance of repeated tests at different pressure/flow levels in the same borehole and injection sections. The visual observation of gas outflow from the fracture system into the galleries was used as supplementary information. The aim was to verify whether new pathways in the rock mass form, whether such processes are reversible and the pathways stable and whether this behaviour varies with regard to the EDZ.
FORGE Report: D4.20 – Ver.1
12
3. Test history Initially a series of pilot tests was performed in order to verify the characteristics of the rock mass in-situ, to test the overall setup of the apparatus and to finalise the design and provide for the debugging of the testing methodology. Various types of tests, both short- and long-term, were performed on different injection sections in a total of four boreholes. Baseline permeability measurements of the rock in the vicinity of the injection boreholes were obtained by means of the constant head injection test, pressure drop test and the measurement of outflow. Information on these tests can be found in FORGE progress report 4.14 (Svoboda and Smutek, 2011).
Following pilot testing in the horizontal boreholes, detailed testing was performed in the vertical borehole in the granodiorite rock environment of the Mokrsko area. The tests were necessarily of a long-term nature since it took a considerable period of time to stabilize injected air flow conditions. Long-term testing lasted from several days to a number of weeks.
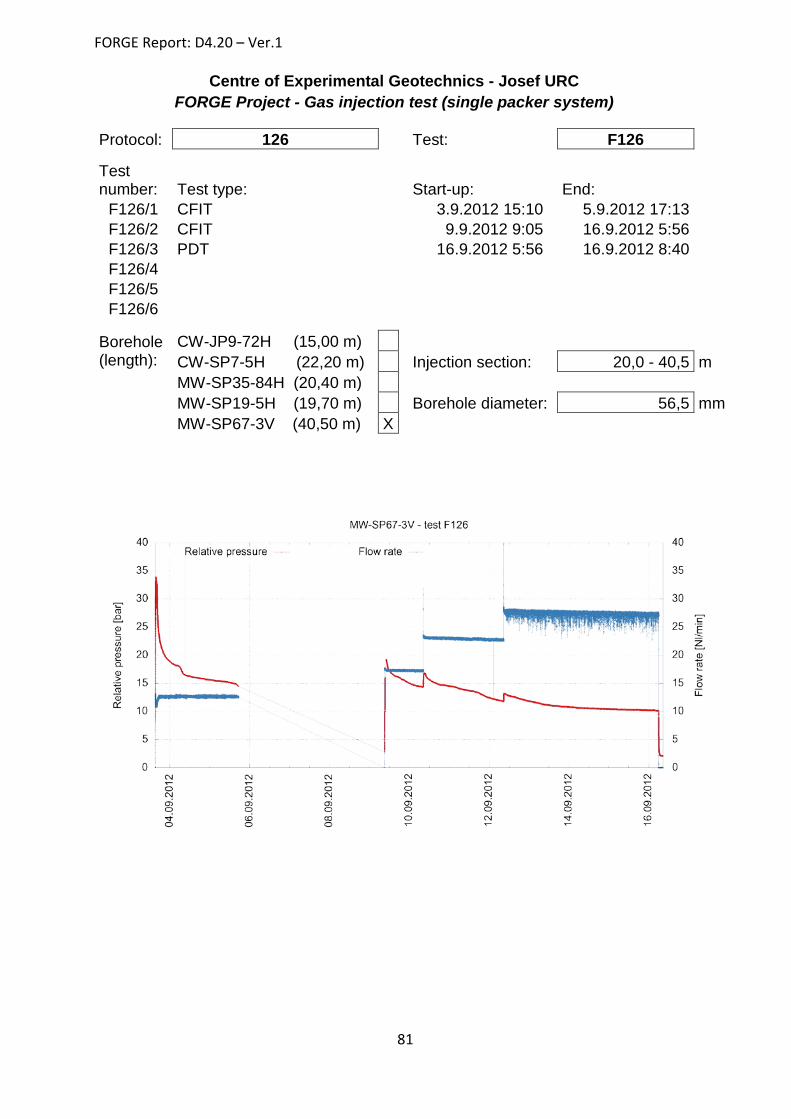
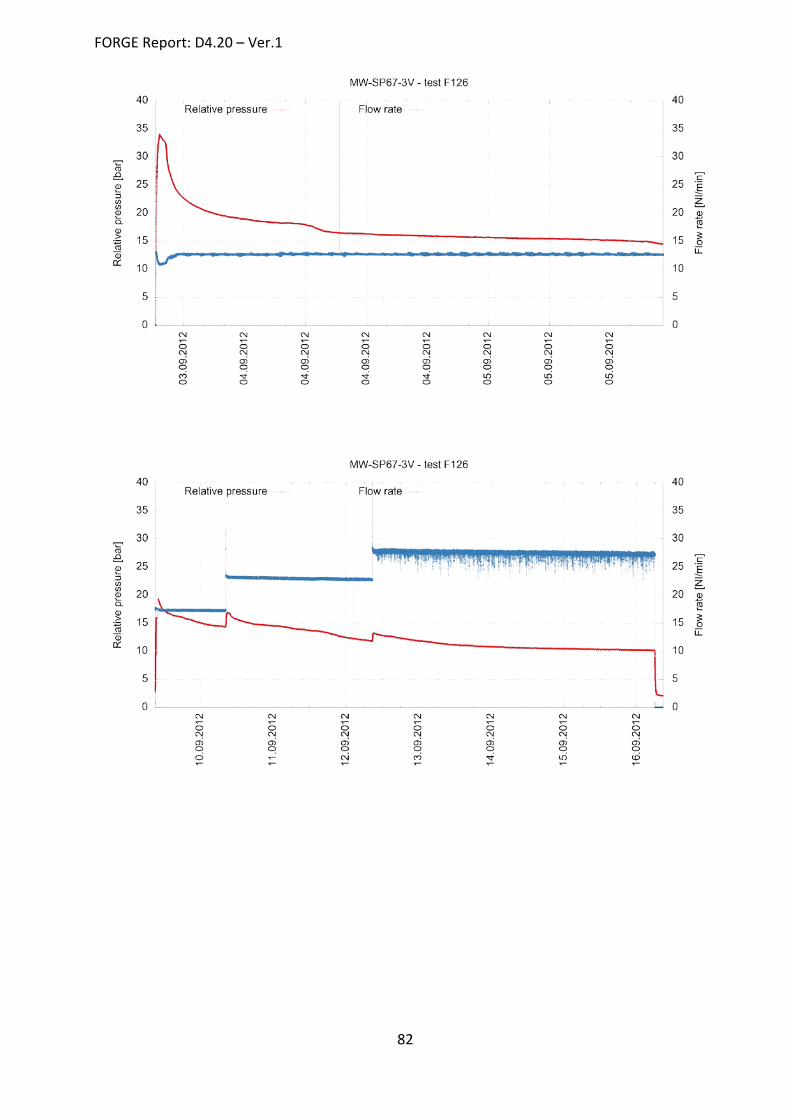
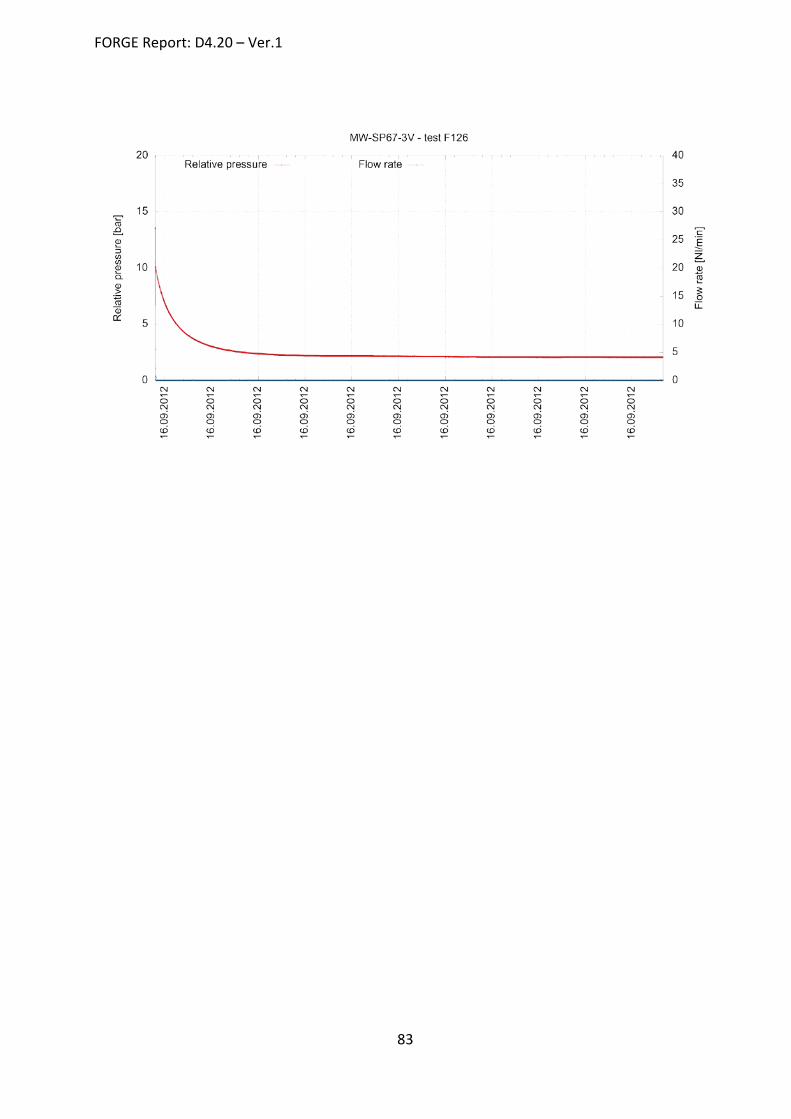
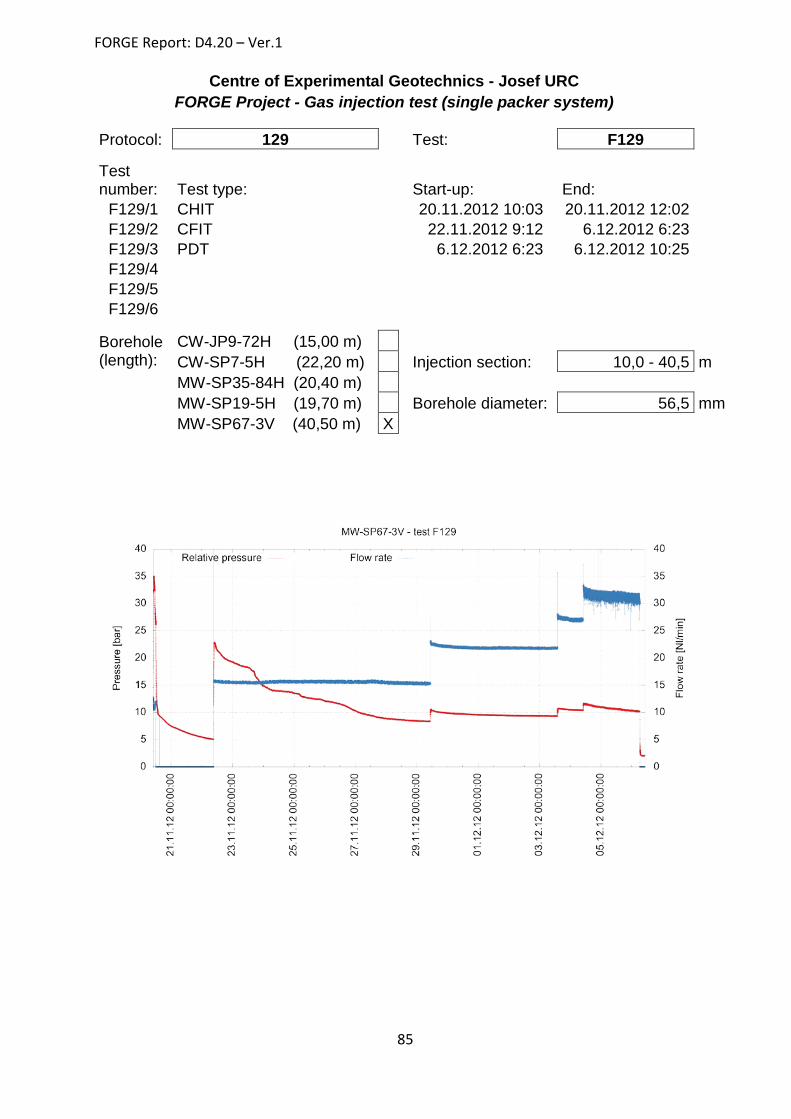
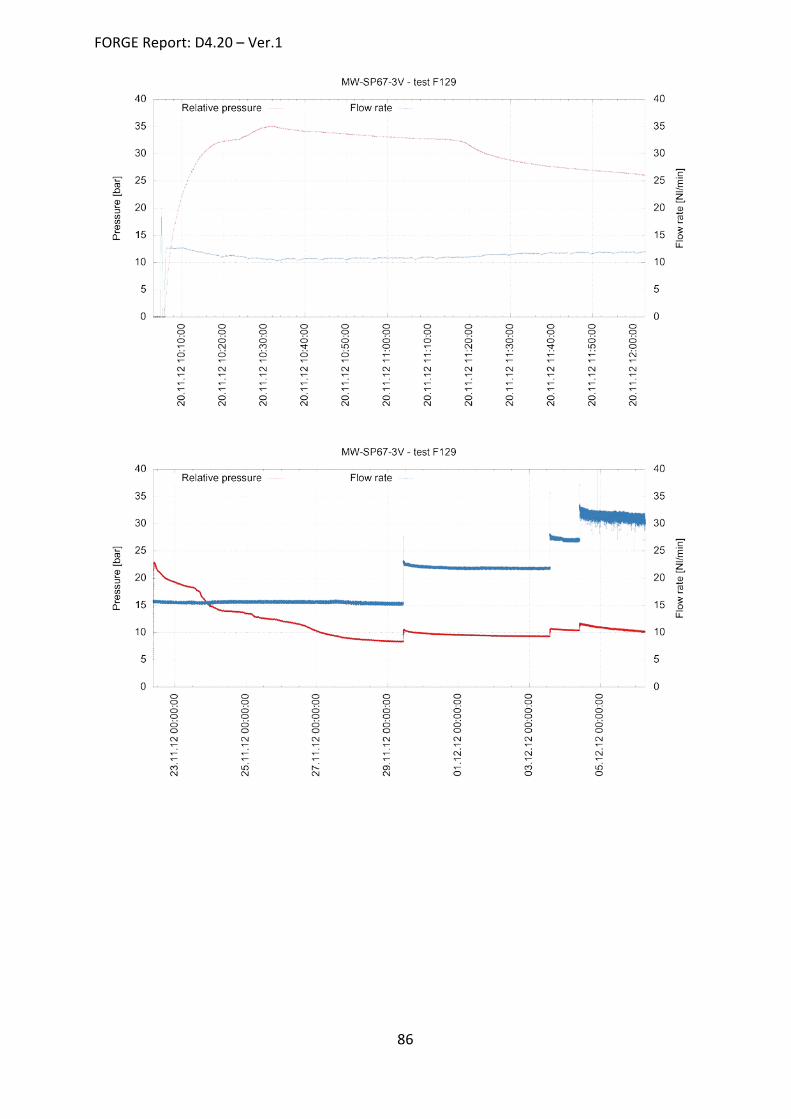
The main field testing consisted of a series of single packer injection tests in the gradually extended MW-SP67-3V borehole. A total of 48 subtests (Constant Head Injection Test - CHIT, Constant Flow Injection test - CFIT and Pressure Drop Test - PDT) were performed. Furthermore, a series of double packer tests (CHIT) in a total of three selected borehole sections were carried out. At the very end of the project a series of migration tests consisting of a total of 8 subtests (CFIT and PDT tests) were performed.
3.1. SINGLE PACKER INJECTION TESTS More than 40 long-term test series (each test consisting of several subtests at distinct injection pressure levels) were performed in the MW-SP-67-3V borehole. The levels of permeability of individual sections of the borehole were measured by placing the packer in different positions within the borehole (usually in 2.5m steps).
Multiple pressure levels and flow rates were used during the gas injection stage. It was possible to set the flow rate value within a range of between 0 and 40Nl/min (normal litres per minute). In addition, various flow rates were used in a number of borehole sections in order to study changes in permeability.
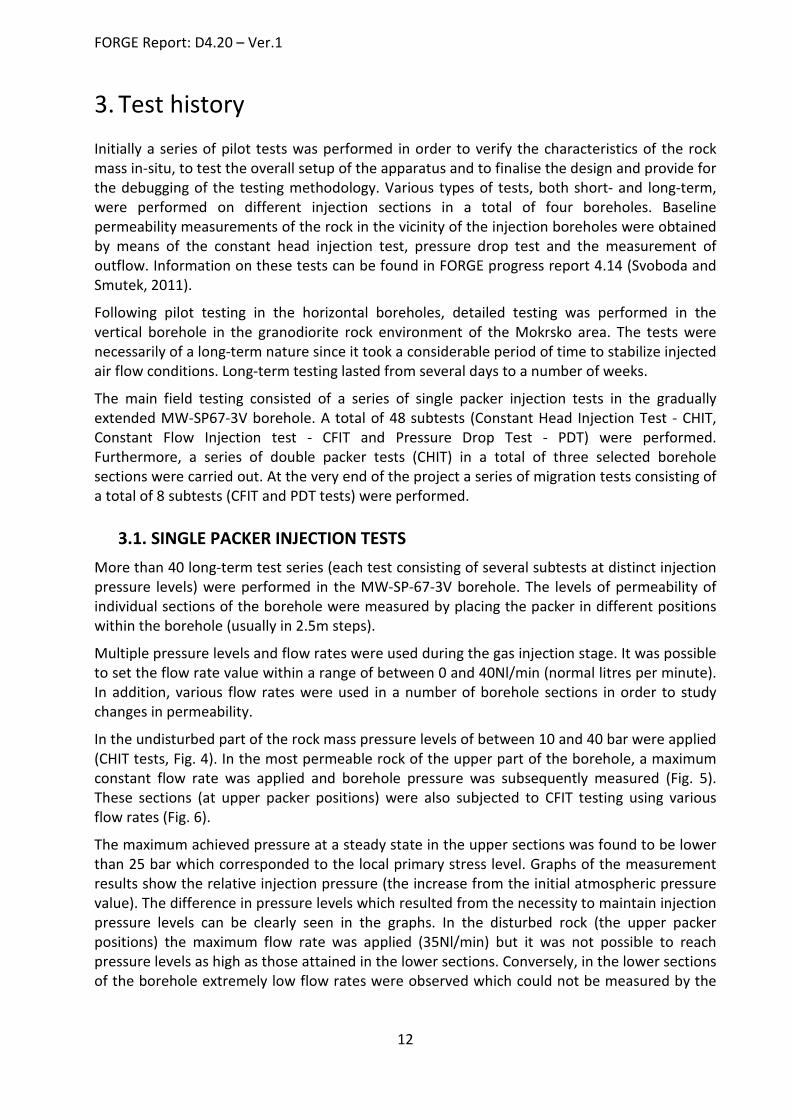
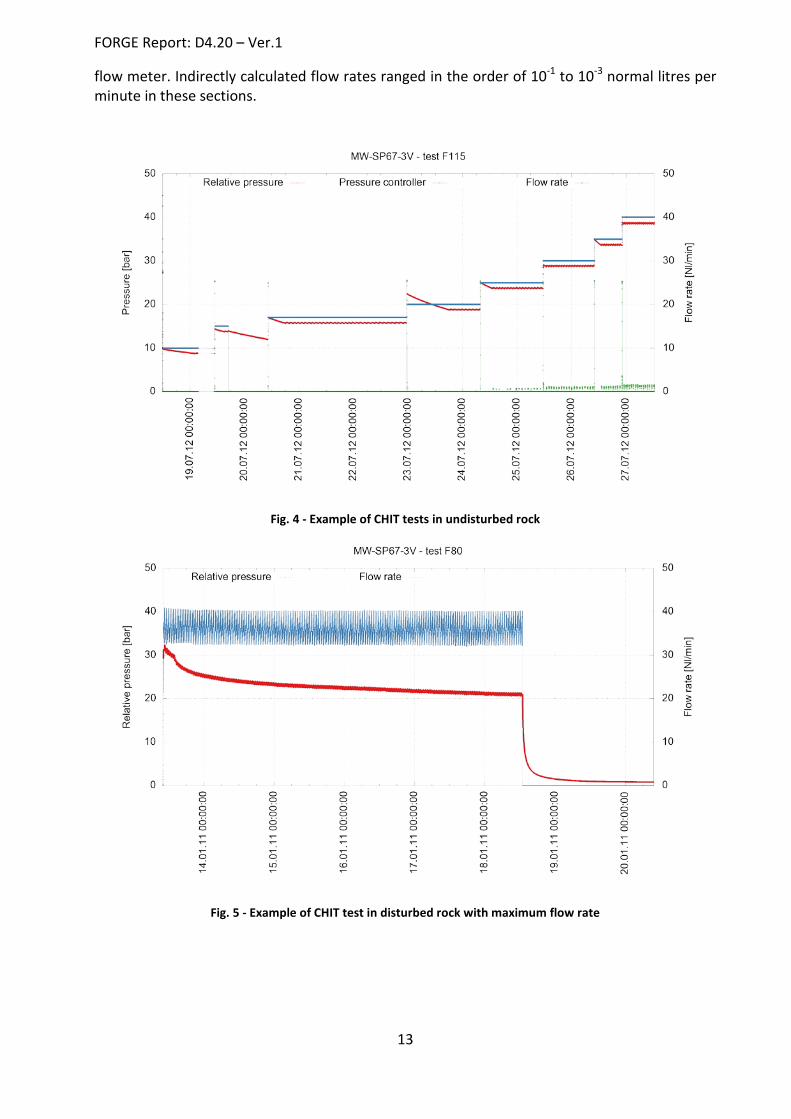
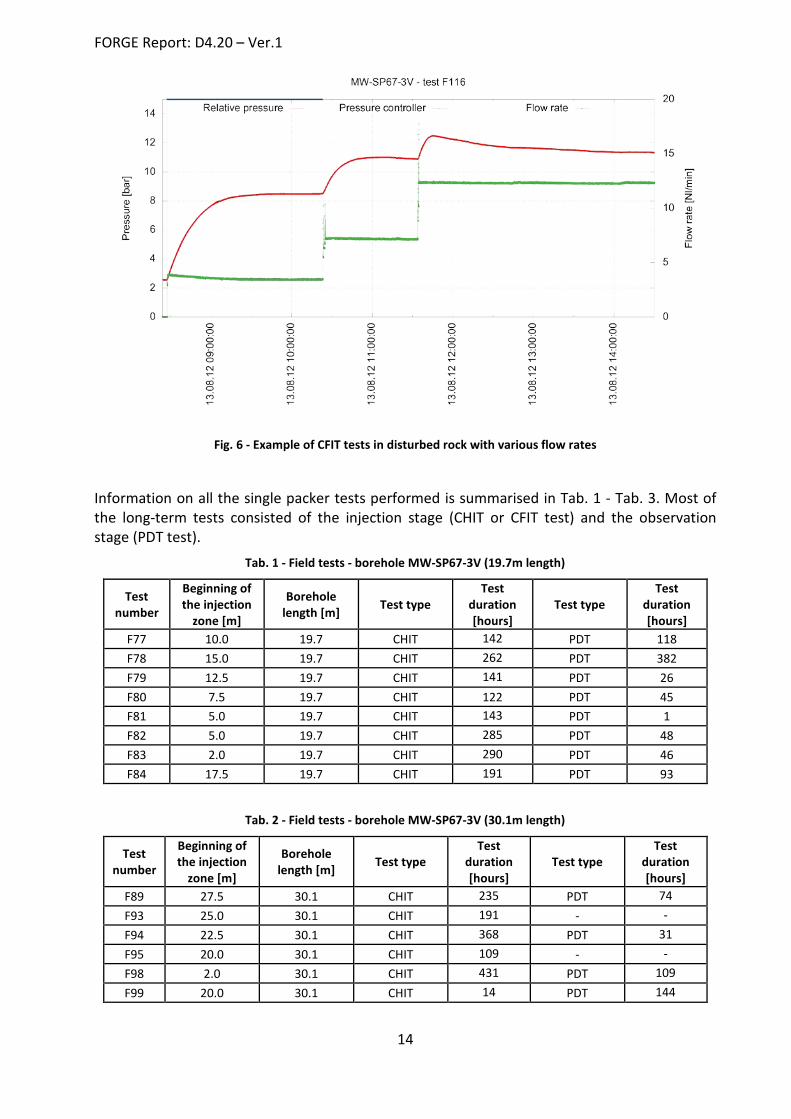
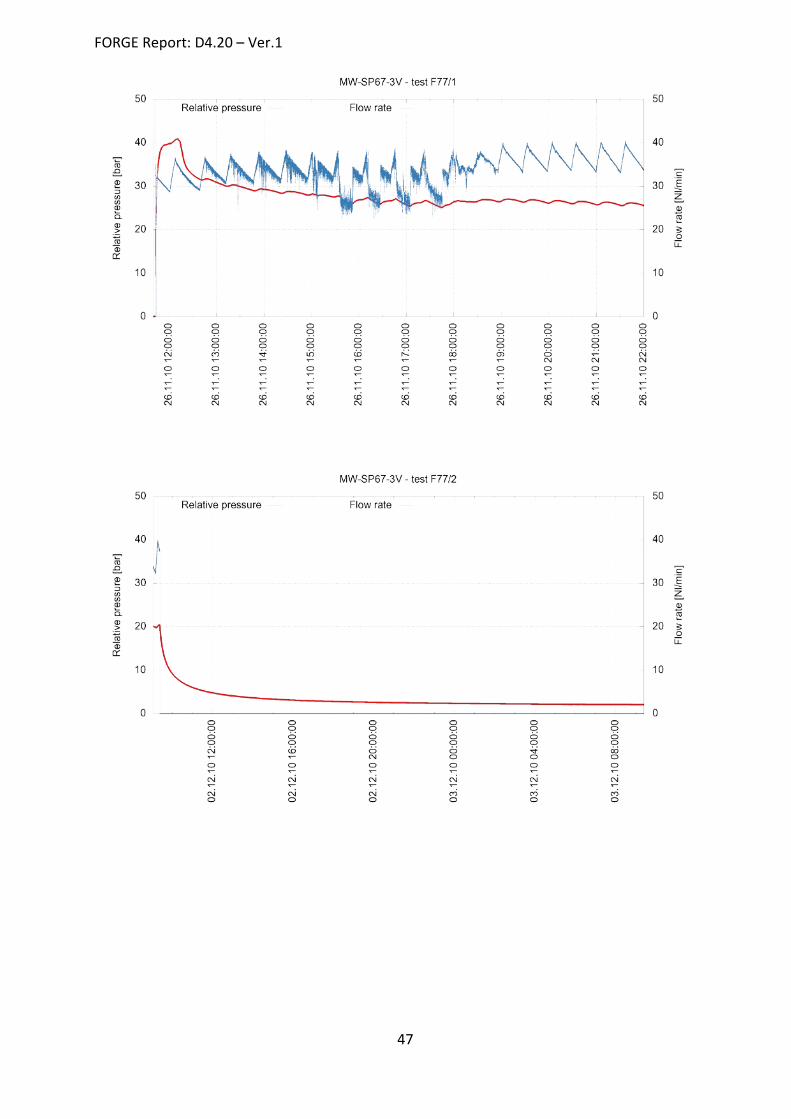
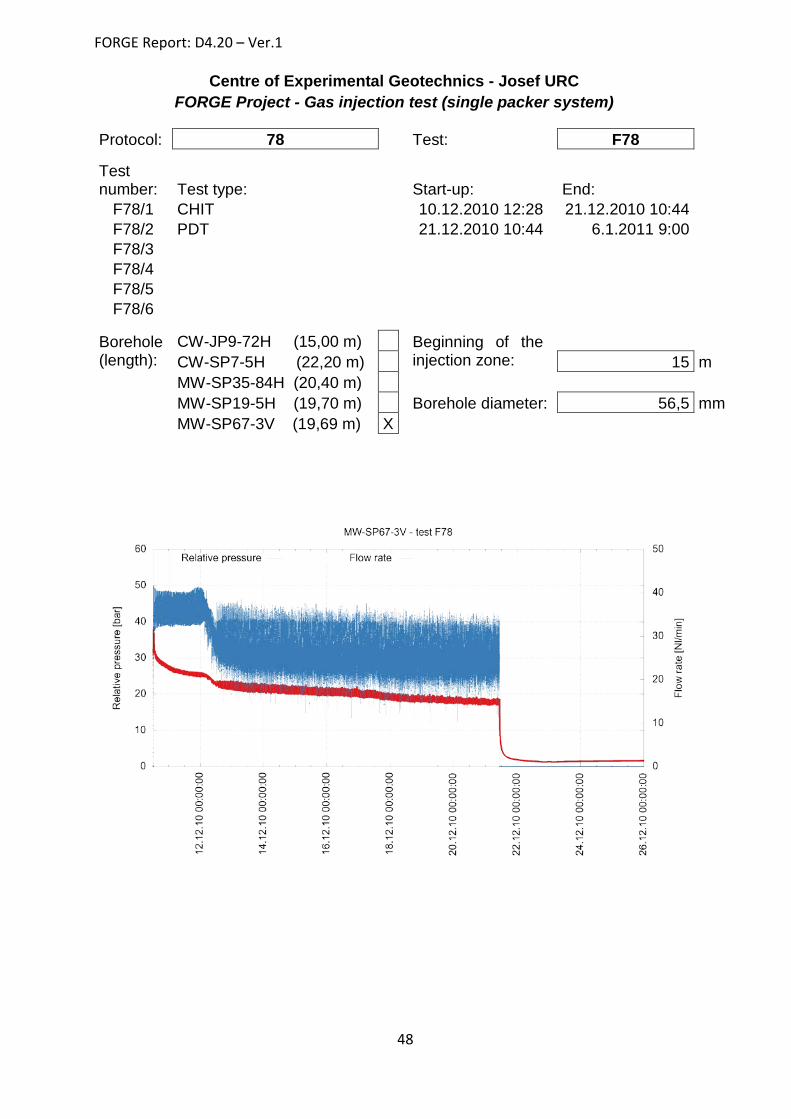
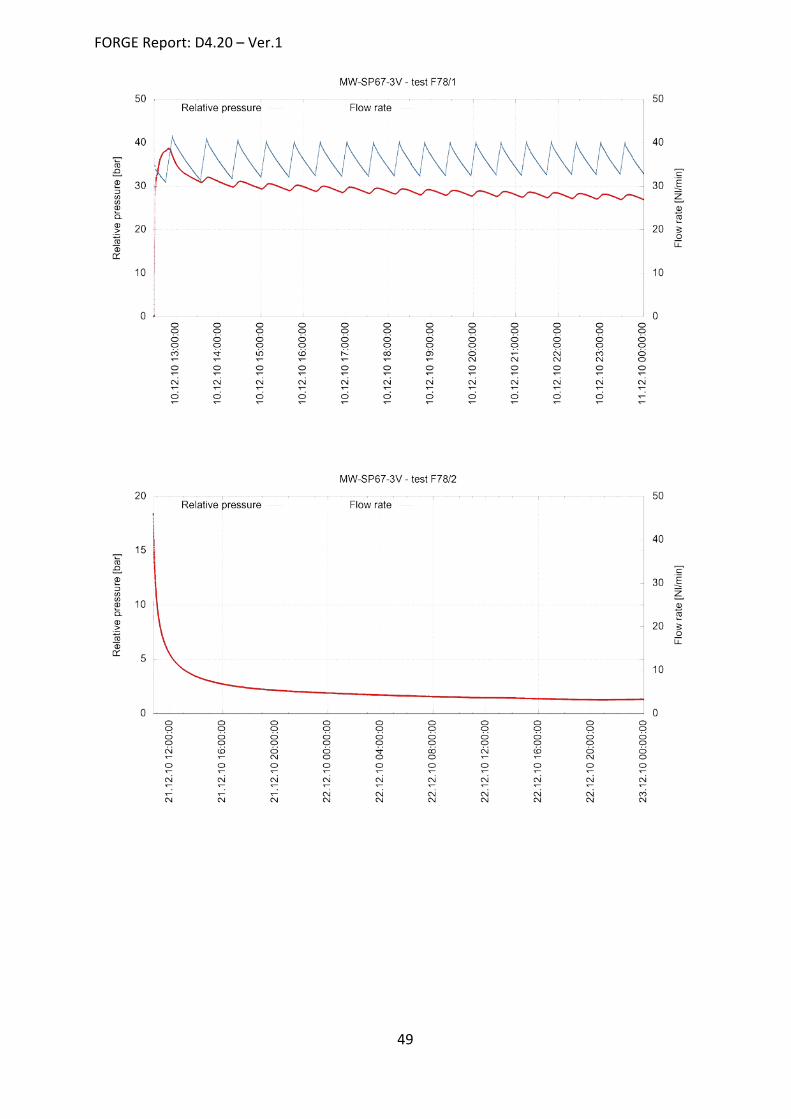
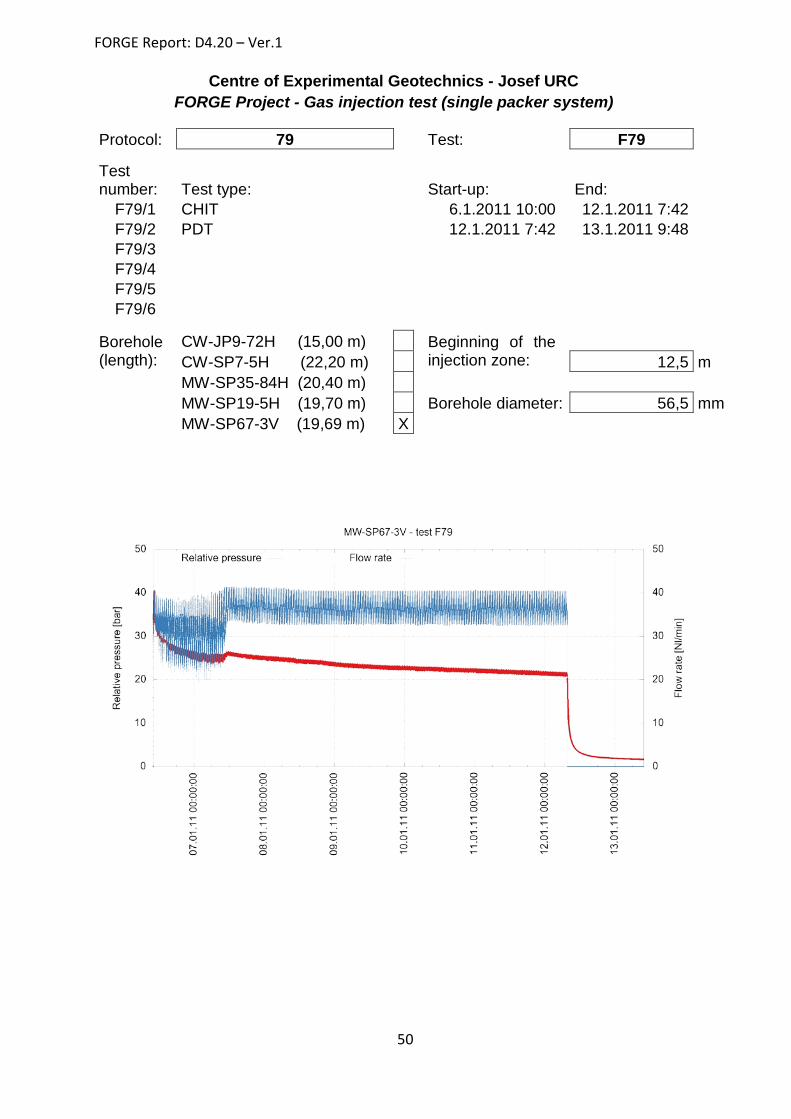
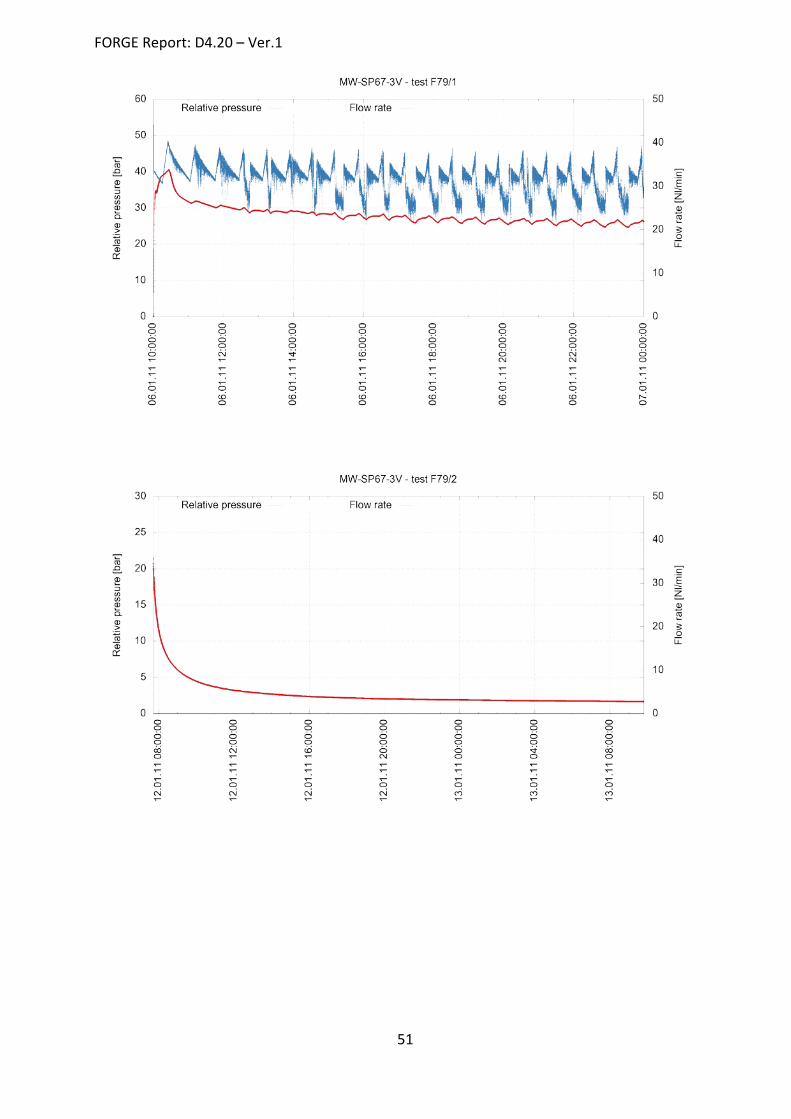
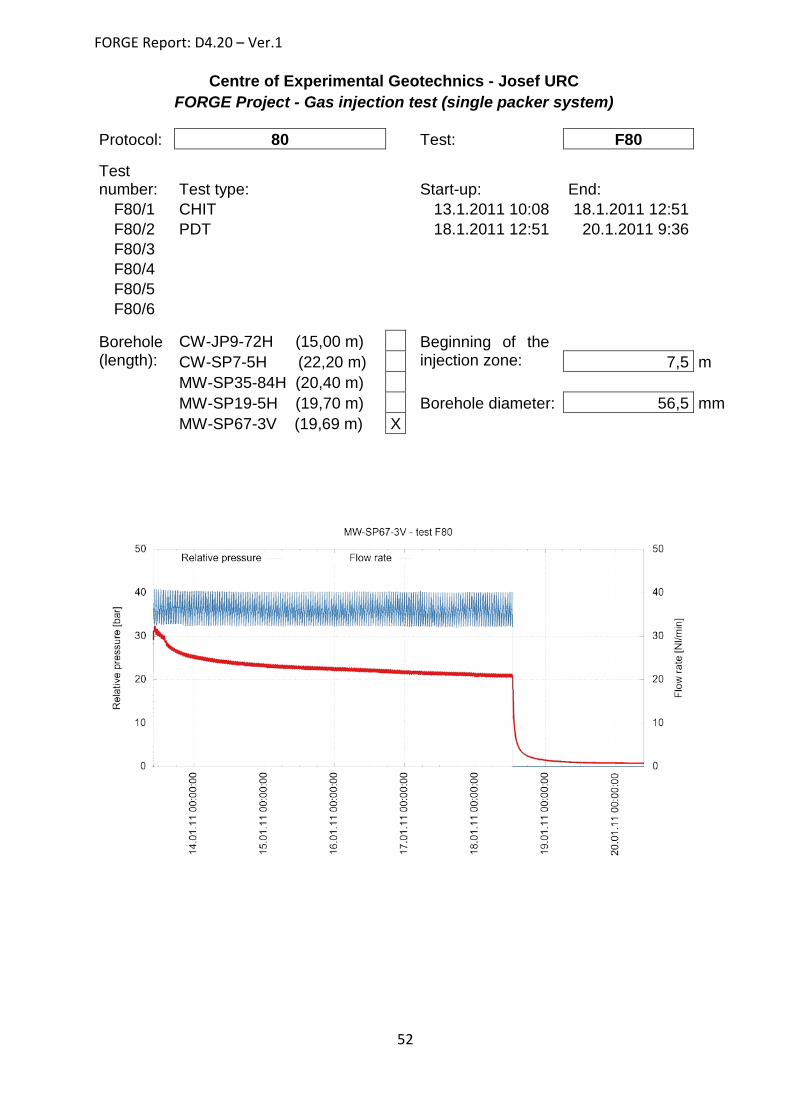
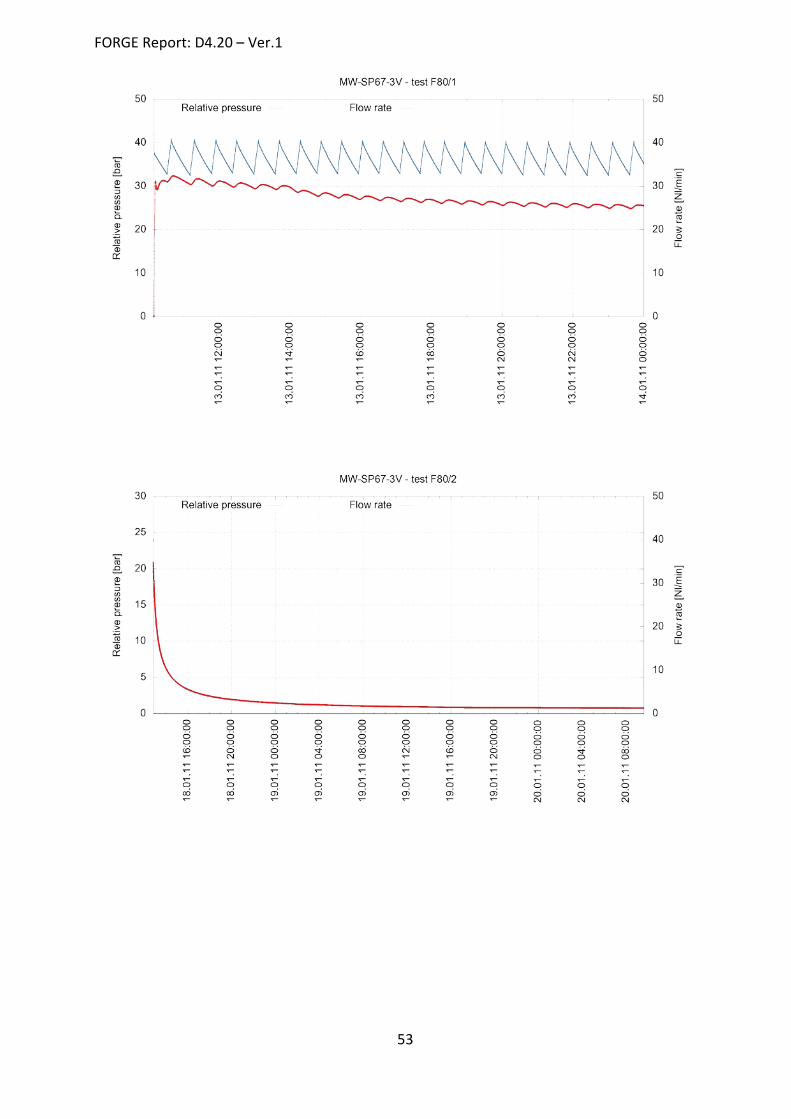
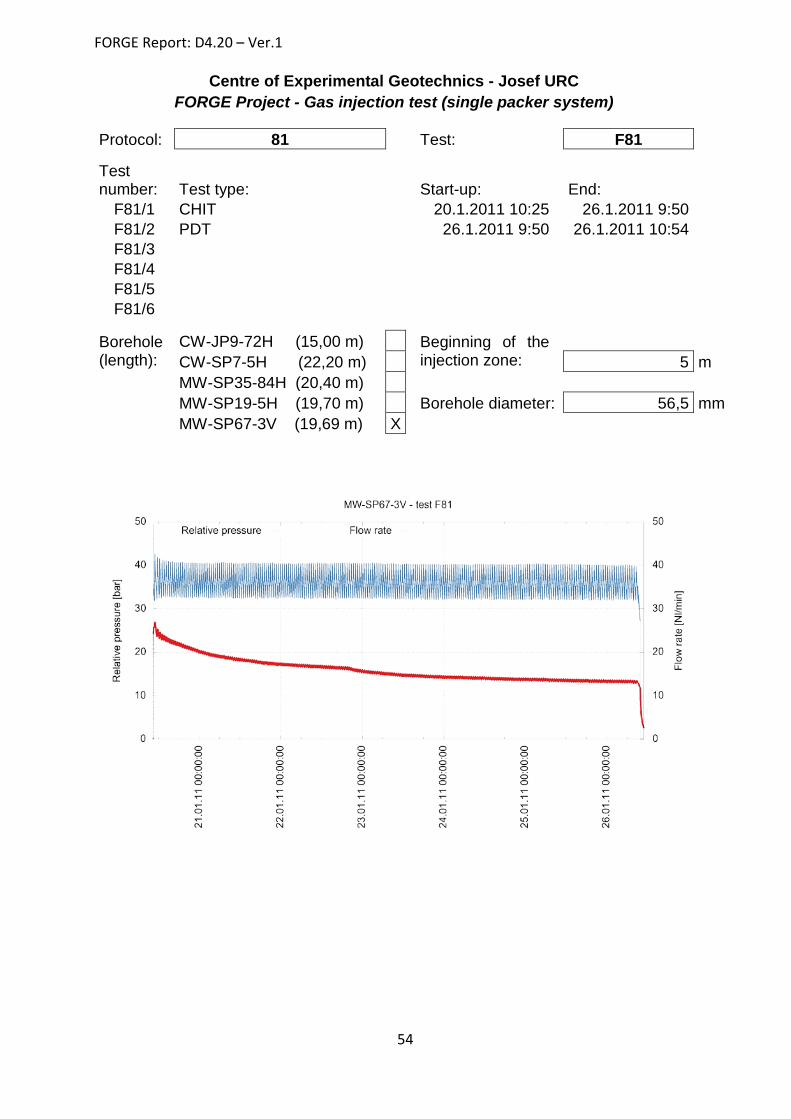
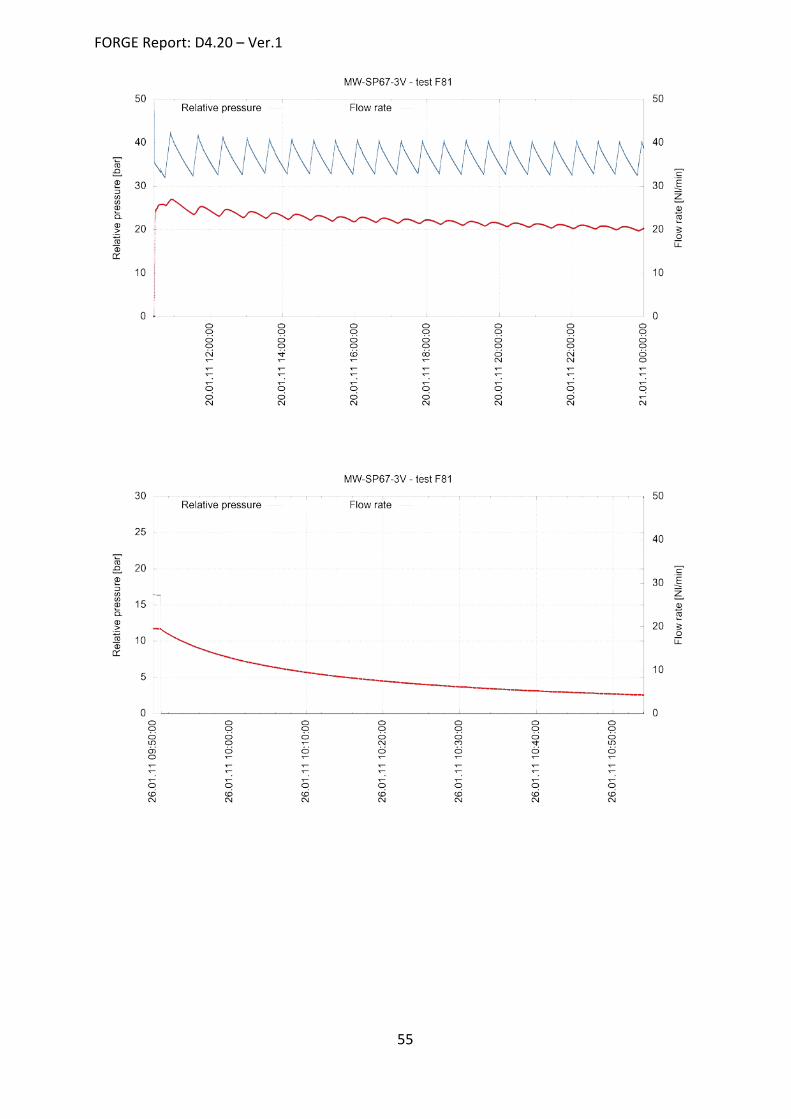
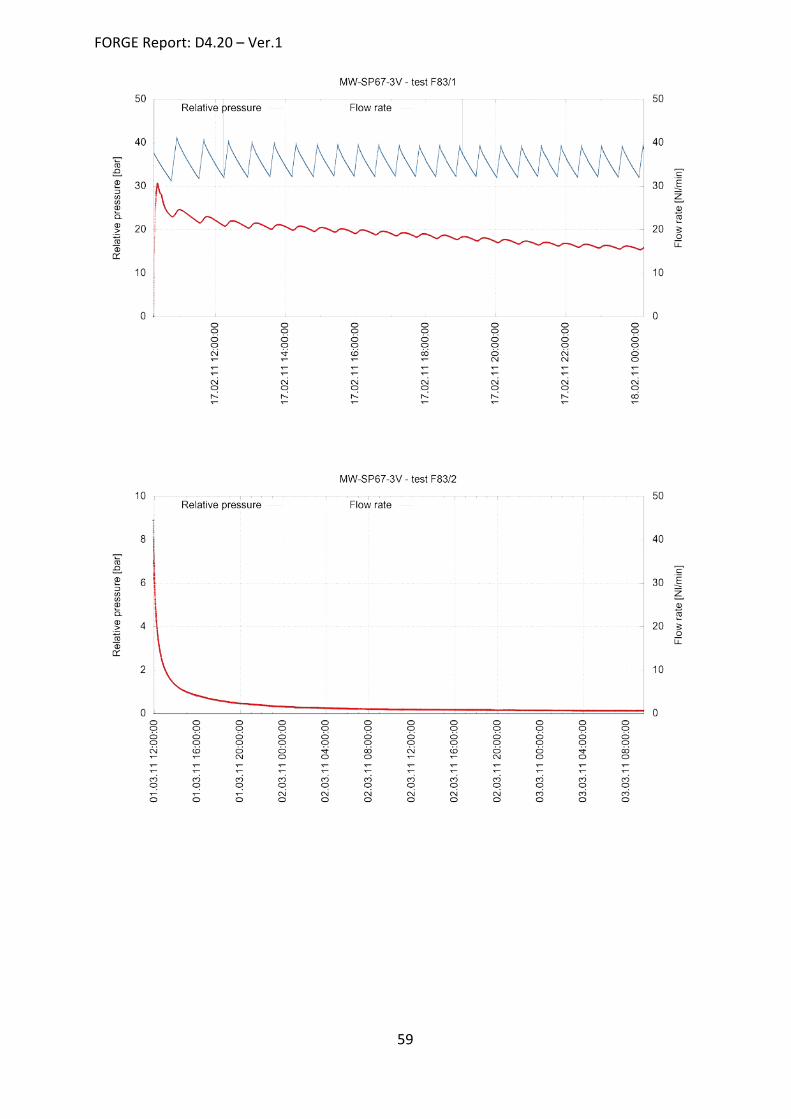
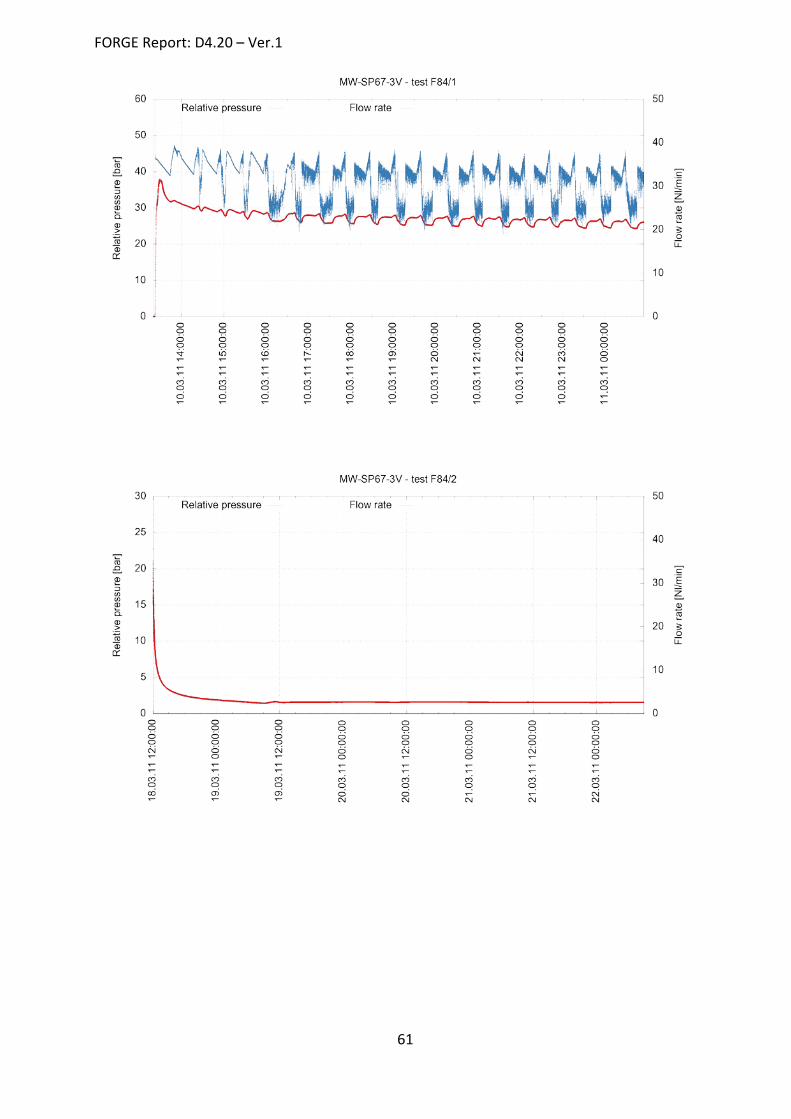
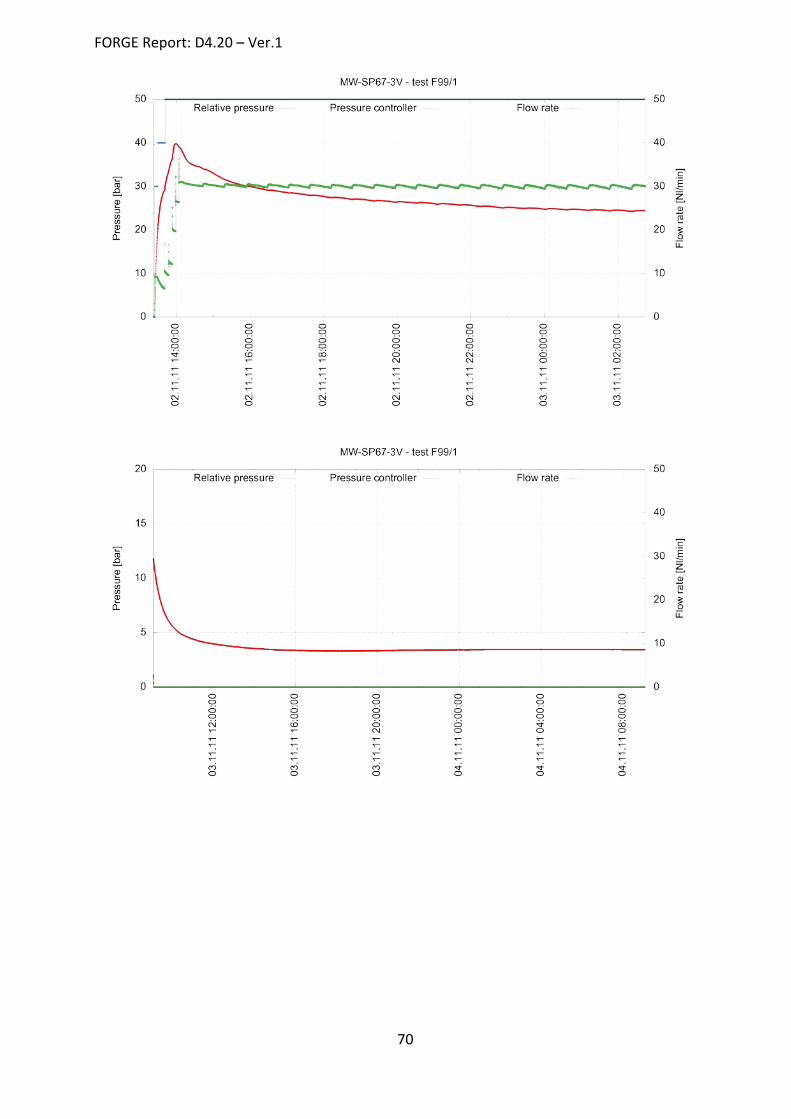
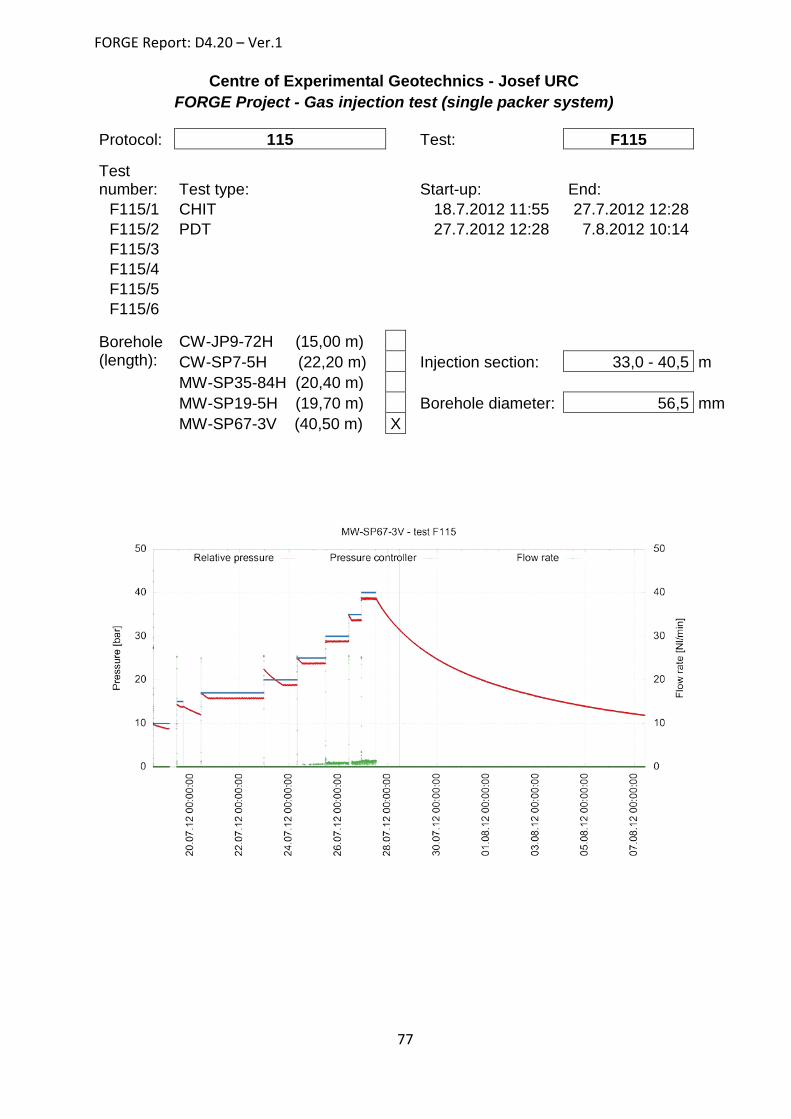
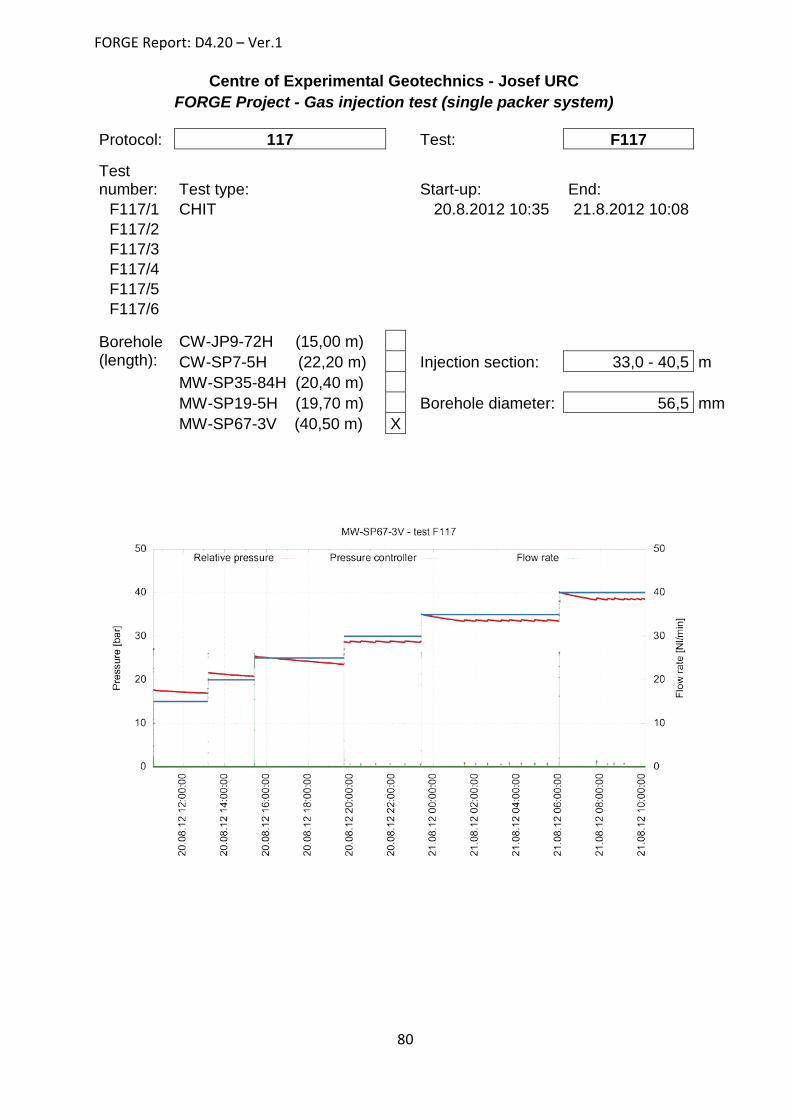
In the undisturbed part of the rock mass pressure levels of between 10 and 40 bar were applied (CHIT tests, Fig. 4). In the most permeable rock of the upper part of the borehole, a maximum constant flow rate was applied and borehole pressure was subsequently measured (Fig. 5). These sections (at upper packer positions) were also subjected to CFIT testing using various flow rates (Fig. 6).
The maximum achieved pressure at a steady state in the upper sections was found to be lower than 25 bar which corresponded to the local primary stress level. Graphs of the measurement results show the relative injection pressure (the increase from the initial atmospheric pressure value). The difference in pressure levels which resulted from the necessity to maintain injection pressure levels can be clearly seen in the graphs. In the disturbed rock (the upper packer positions) the maximum flow rate was applied (35Nl/min) but it was not possible to reach pressure levels as high as those attained in the lower sections. Conversely, in the lower sections of the borehole extremely low flow rates were observed which could not be measured by the
FORGE Report: D4.20 – Ver.1
13
flow meter. Indirectly calculated flow rates ranged in the order of 10-1 to 10-3 normal litres per minute in these sections.
Fig. 4 - Example of CHIT tests in undisturbed rock
Fig. 5 - Example of CHIT test in disturbed rock with maximum flow rate
FORGE Report: D4.20 – Ver.1
14
Fig. 6 - Example of CFIT tests in disturbed rock with various flow rates
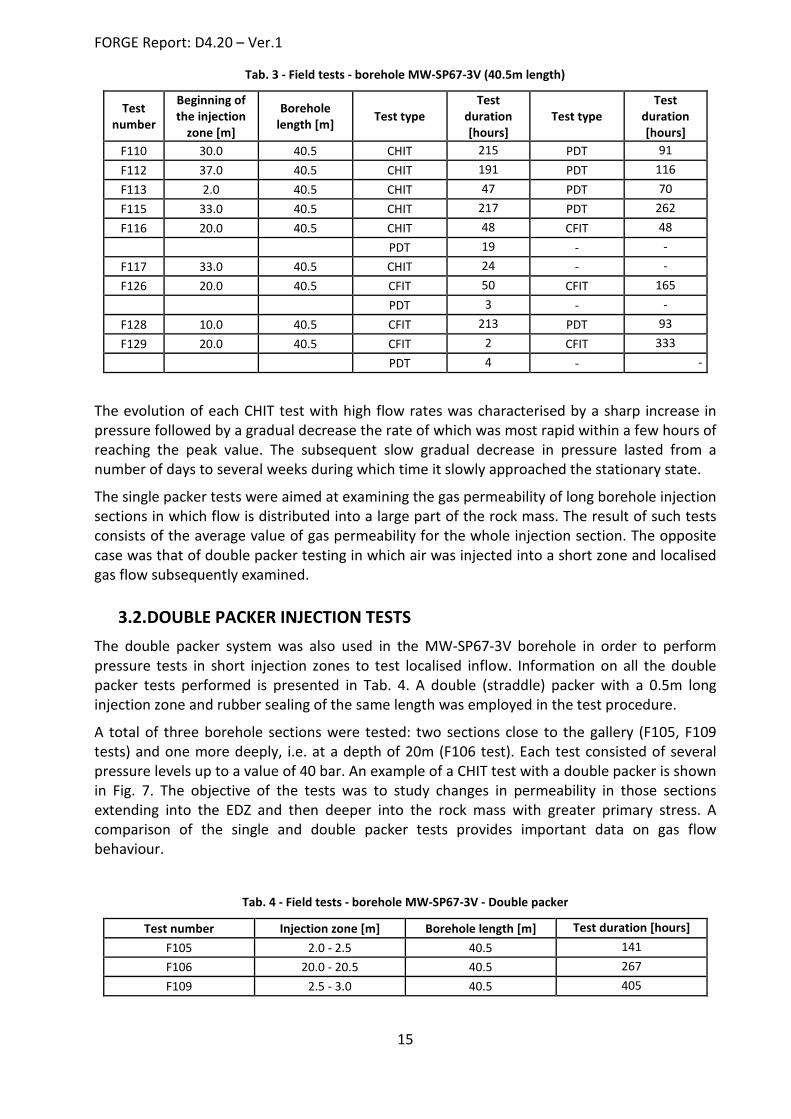
Information on all the single packer tests performed is summarised in Tab. 1 - Tab. 3. Most of the long-term tests consisted of the injection stage (CHIT or CFIT test) and the observation stage (PDT test).
Tab. 1 - Field tests - borehole MW-SP67-3V (19.7m length)
The evolution of each CHIT test with high flow rates was characterised by a sharp increase in pressure followed by a gradual decrease the rate of which was most rapid within a few hours of reaching the peak value. The subsequent slow gradual decrease in pressure lasted from a number of days to several weeks during which time it slowly approached the stationary state.
The single packer tests were aimed at examining the gas permeability of long borehole injection sections in which flow is distributed into a large part of the rock mass. The result of such tests consists of the average value of gas permeability for the whole injection section. The opposite case was that of double packer testing in which air was injected into a short zone and localised gas flow subsequently examined.
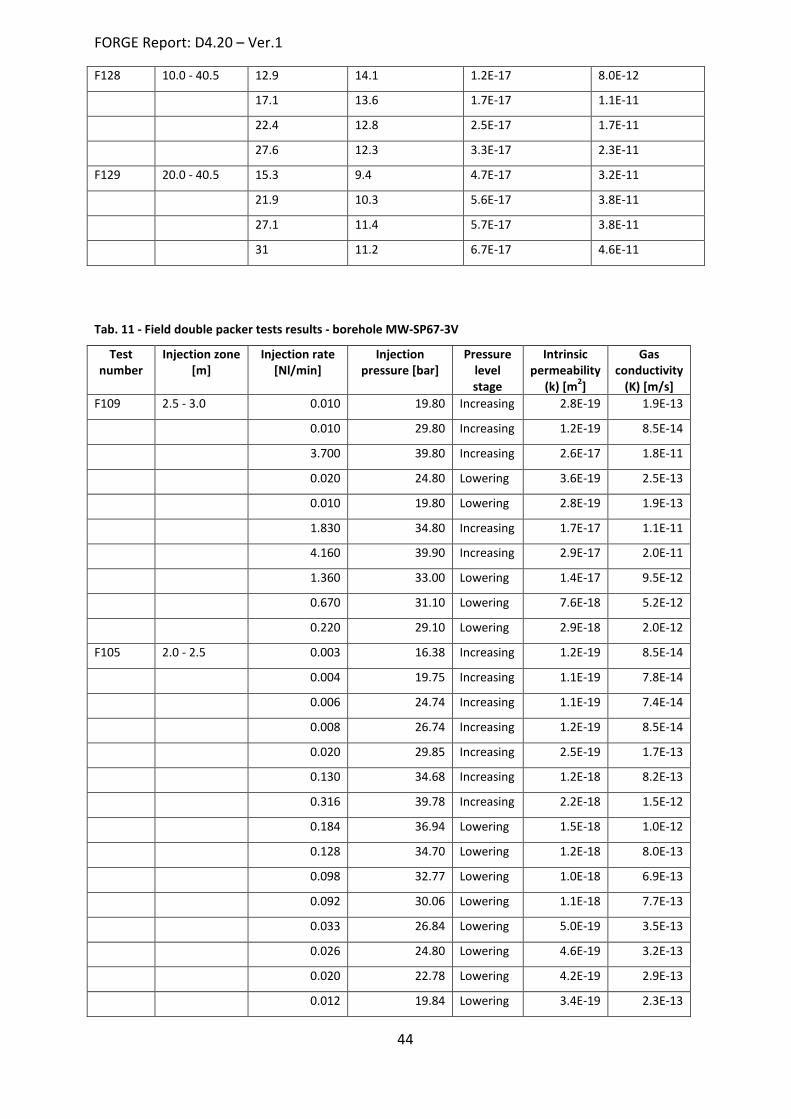
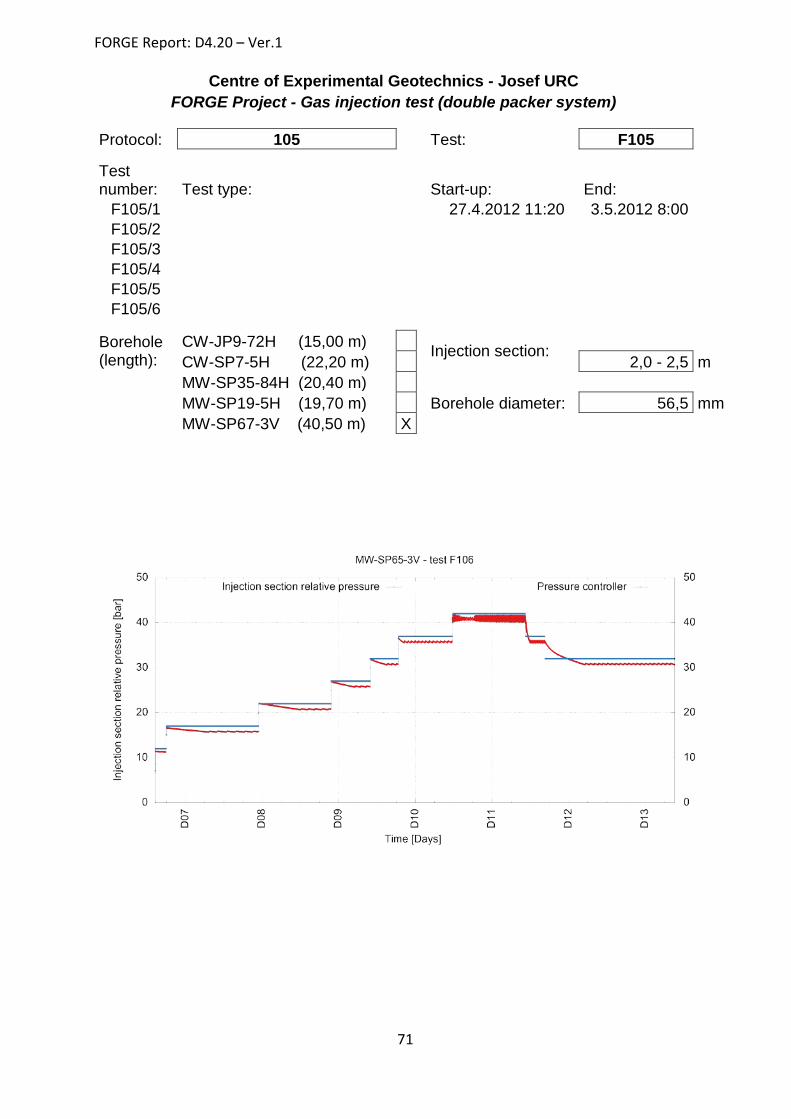
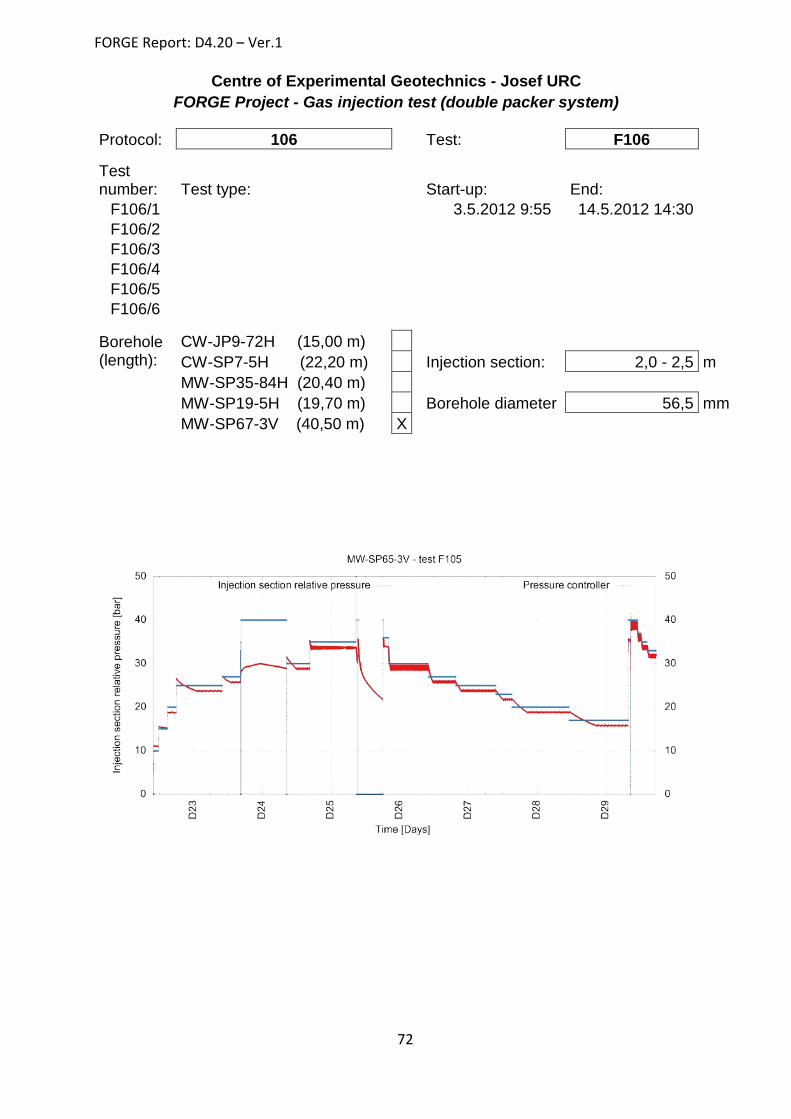
3.2.DOUBLE PACKER INJECTION TESTS The double packer system was also used in the MW-SP67-3V borehole in order to perform pressure tests in short injection zones to test localised inflow. Information on all the double packer tests performed is presented in Tab. 4. A double (straddle) packer with a 0.5m long injection zone and rubber sealing of the same length was employed in the test procedure.
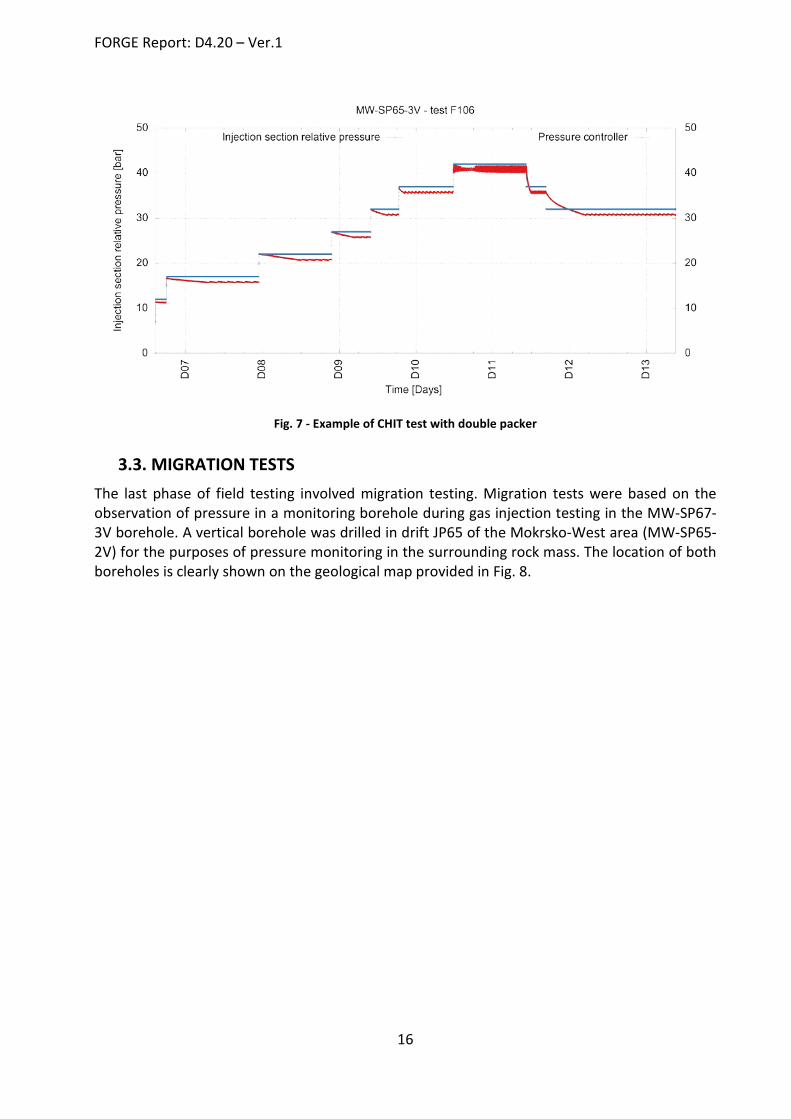
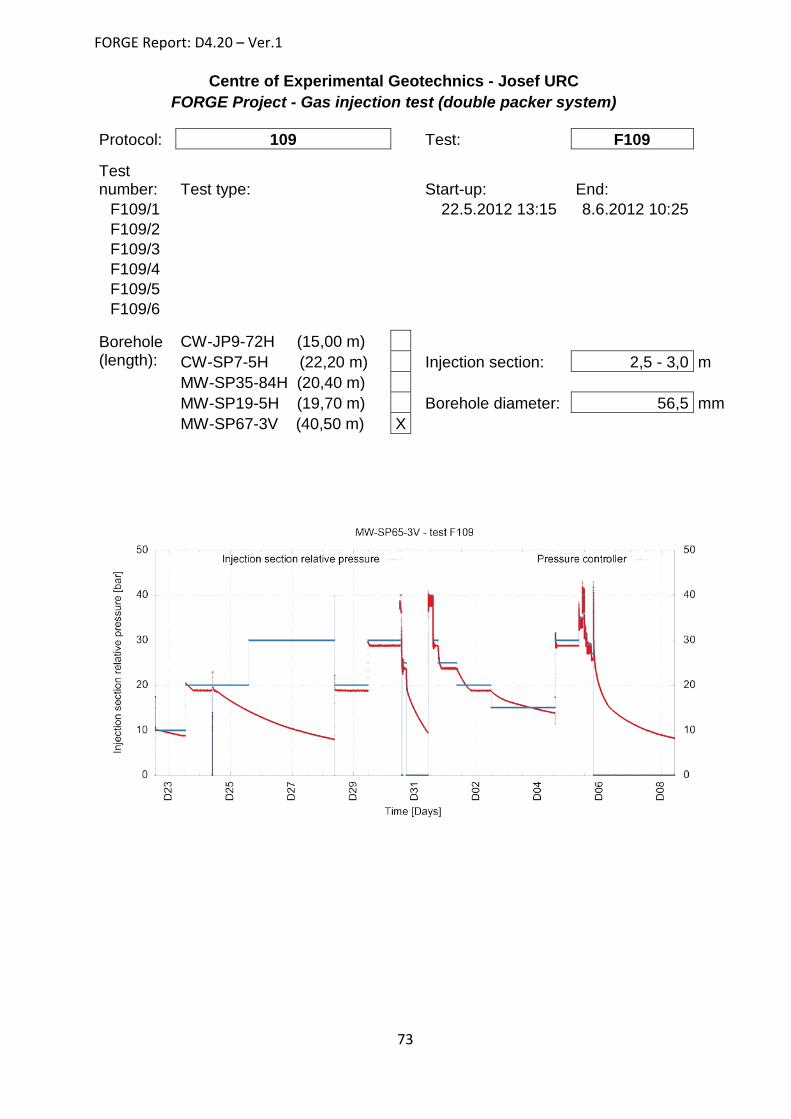
A total of three borehole sections were tested: two sections close to the gallery (F105, F109 tests) and one more deeply, i.e. at a depth of 20m (F106 test). Each test consisted of several pressure levels up to a value of 40 bar. An example of a CHIT test with a double packer is shown in Fig. 7. The objective of the tests was to study changes in permeability in those sections extending into the EDZ and then deeper into the rock mass with greater primary stress. A comparison of the single and double packer tests provides important data on gas flow behaviour.
Test number Injection zone [m] Borehole length [m] Test duration [hours] F105 2.0 - 2.5 40.5 141 F106 20.0 - 20.5 40.5 267 F109 2.5 - 3.0 40.5 405
FORGE Report: D4.20 – Ver.1
16
Fig. 7 - Example of CHIT test with double packer
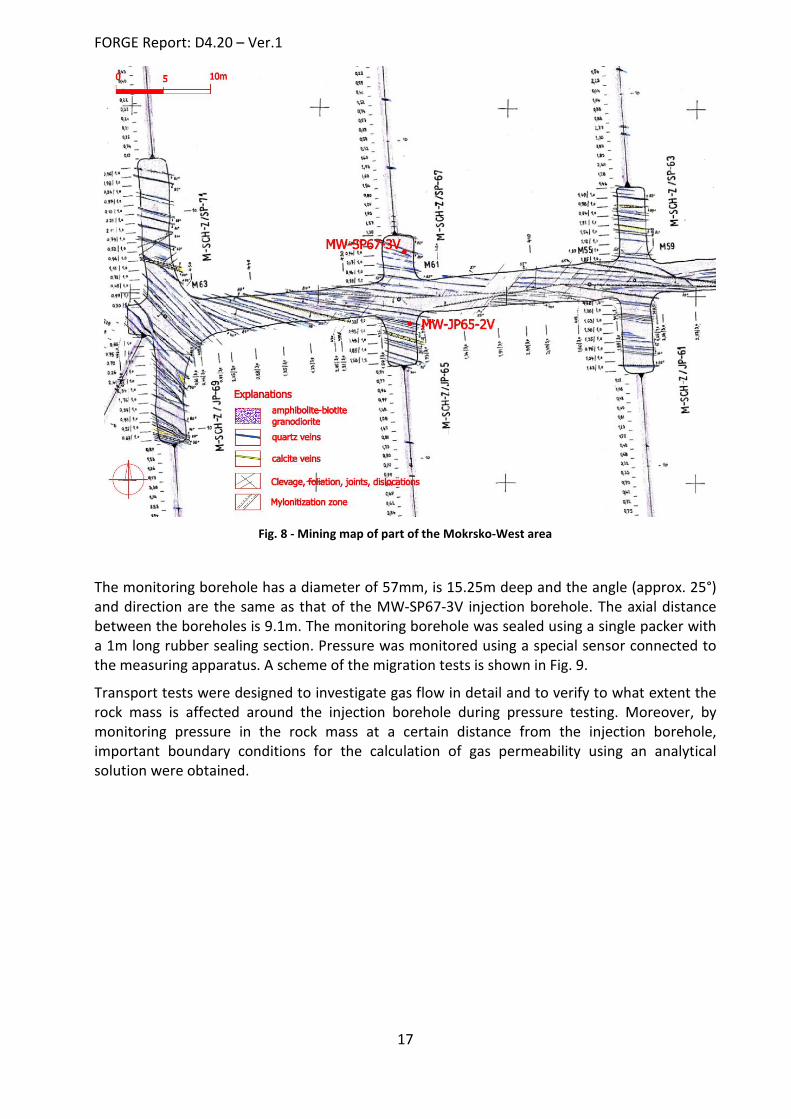
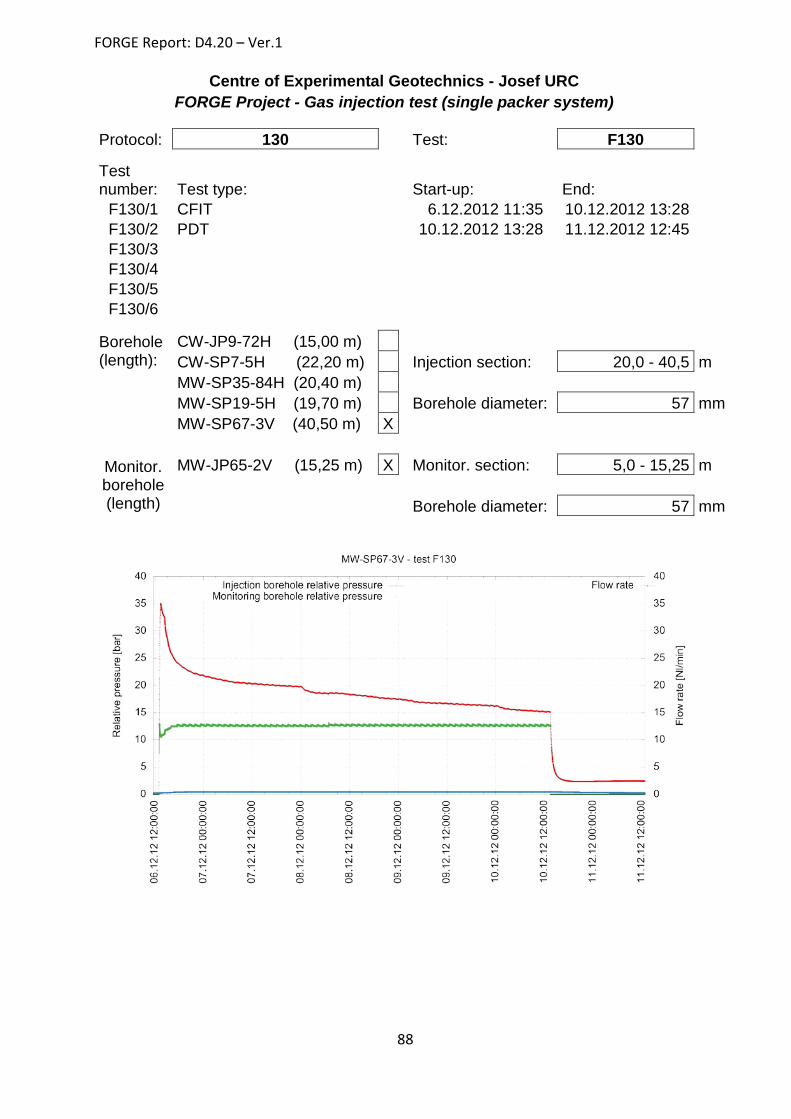
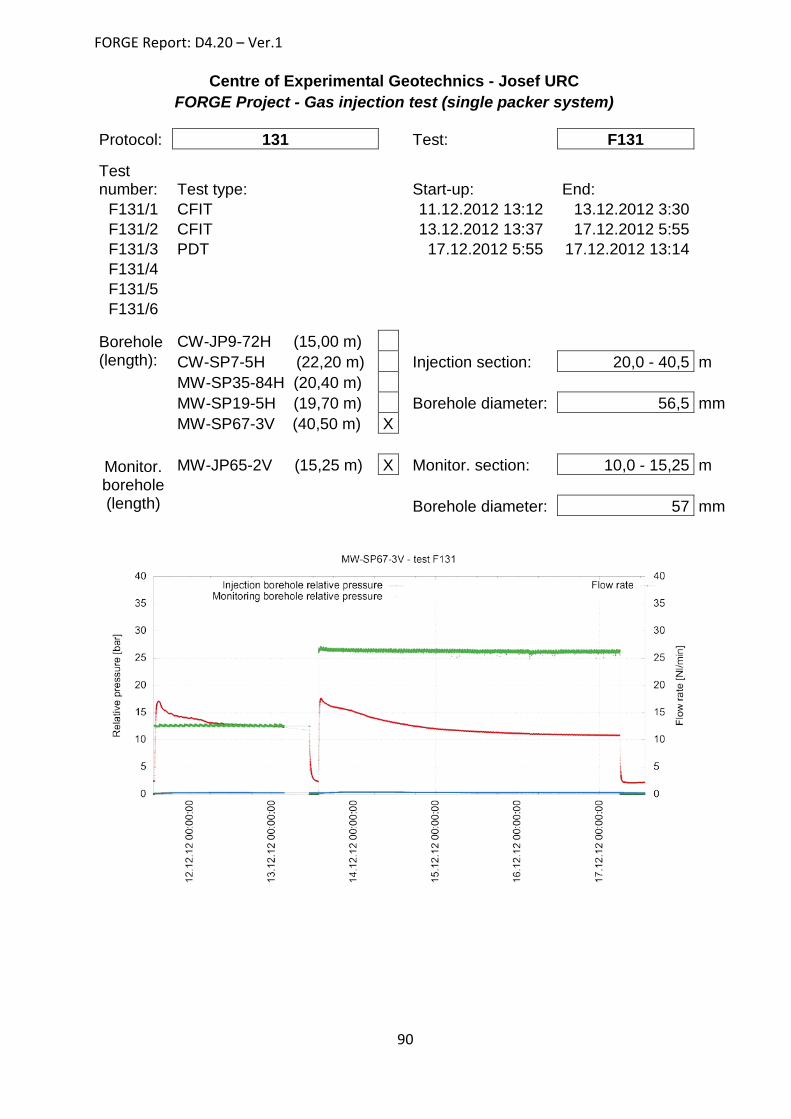
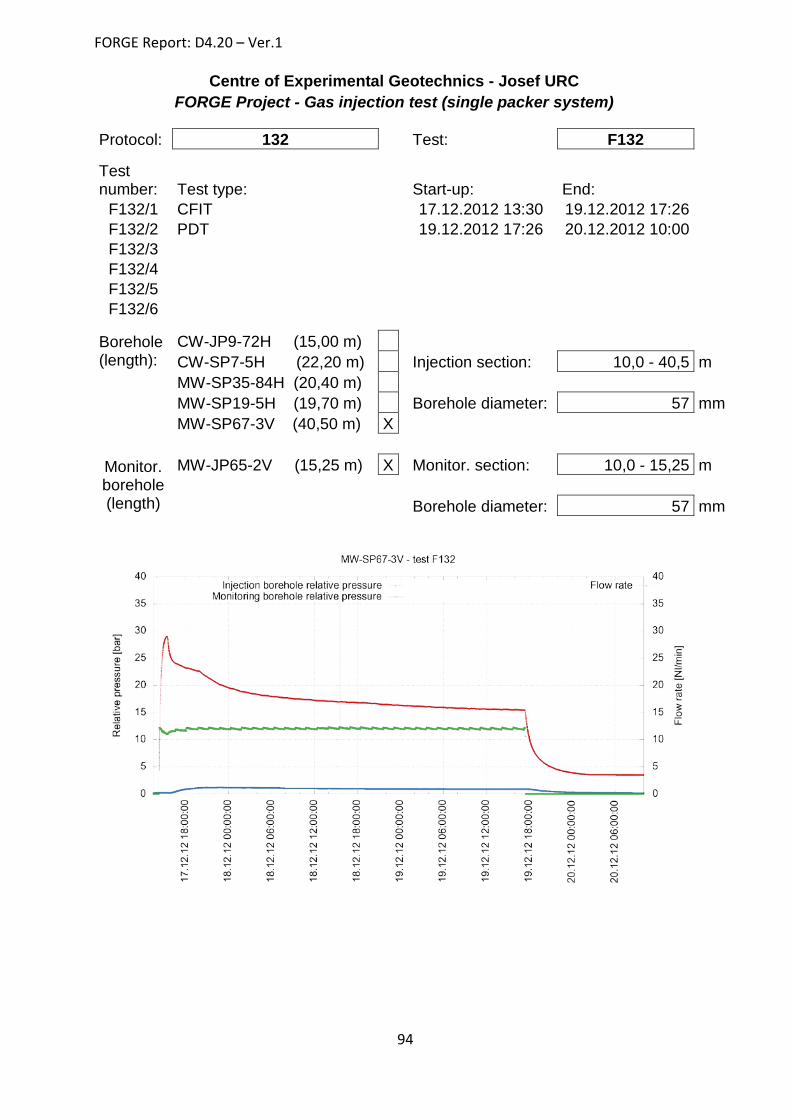
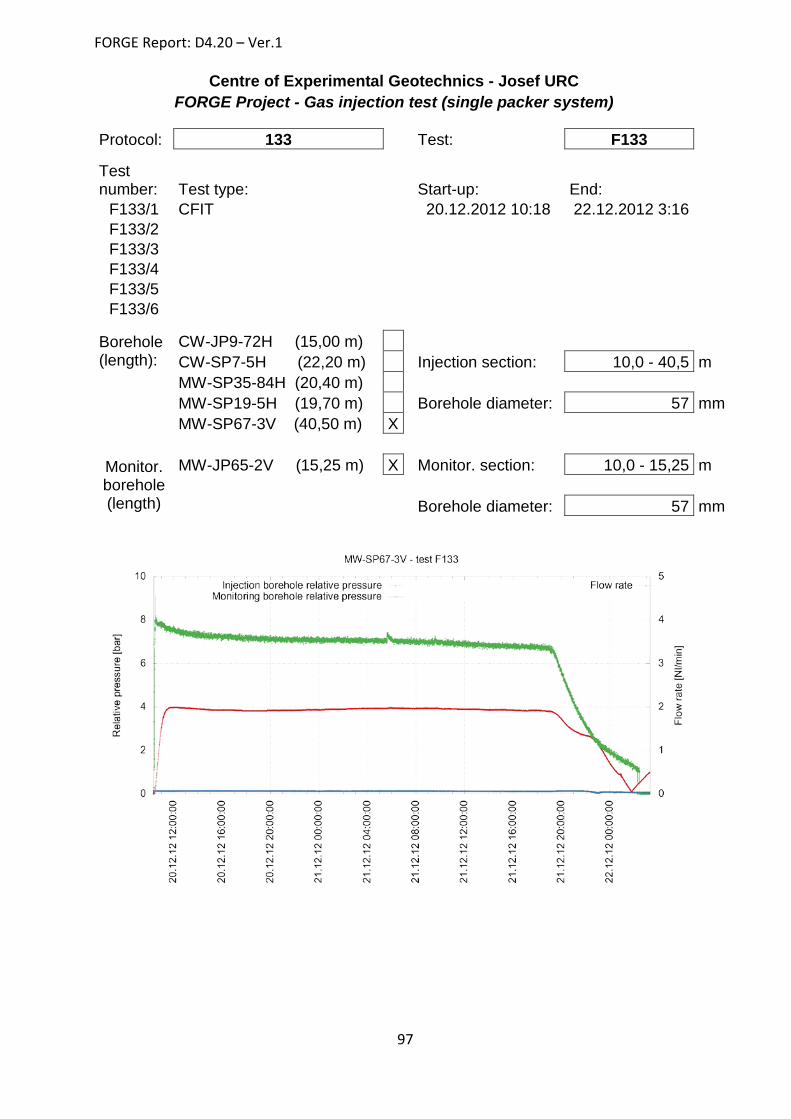
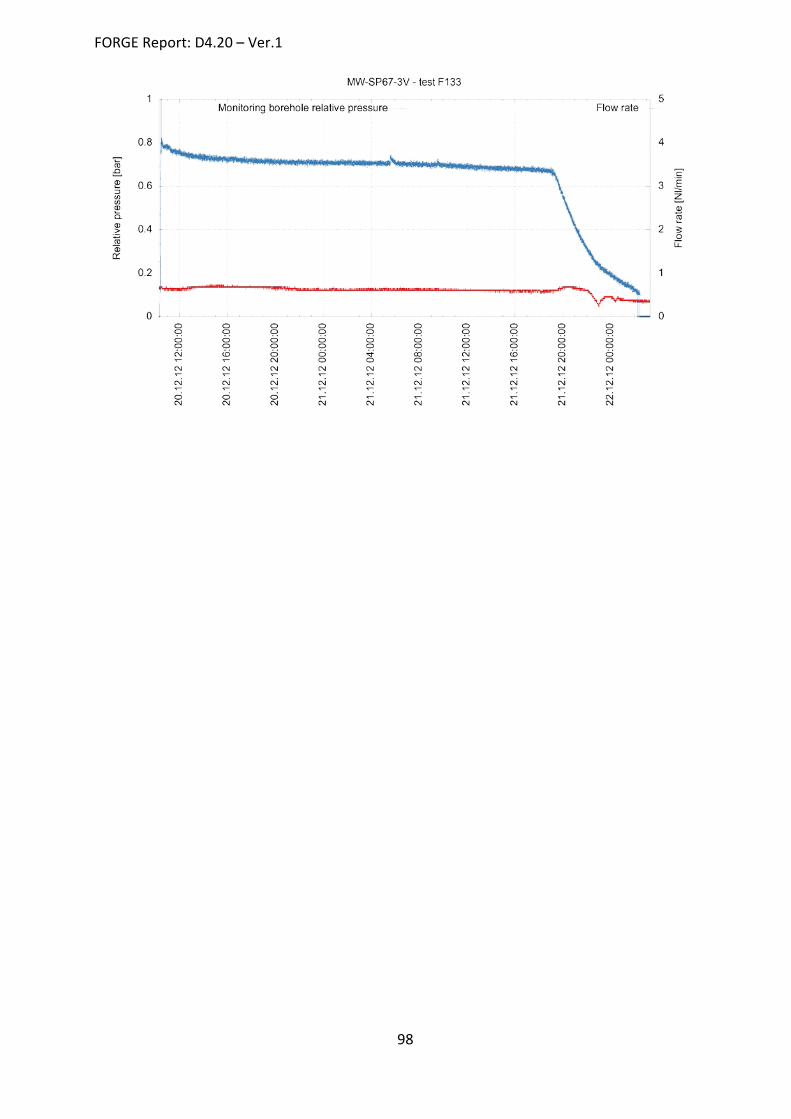
3.3. MIGRATION TESTS The last phase of field testing involved migration testing. Migration tests were based on the observation of pressure in a monitoring borehole during gas injection testing in the MW-SP67-3V borehole. A vertical borehole was drilled in drift JP65 of the Mokrsko-West area (MW-SP65-2V) for the purposes of pressure monitoring in the surrounding rock mass. The location of both boreholes is clearly shown on the geological map provided in Fig. 8.
FORGE Report: D4.20 – Ver.1
17
Fig. 8 - Mining map of part of the Mokrsko-West area
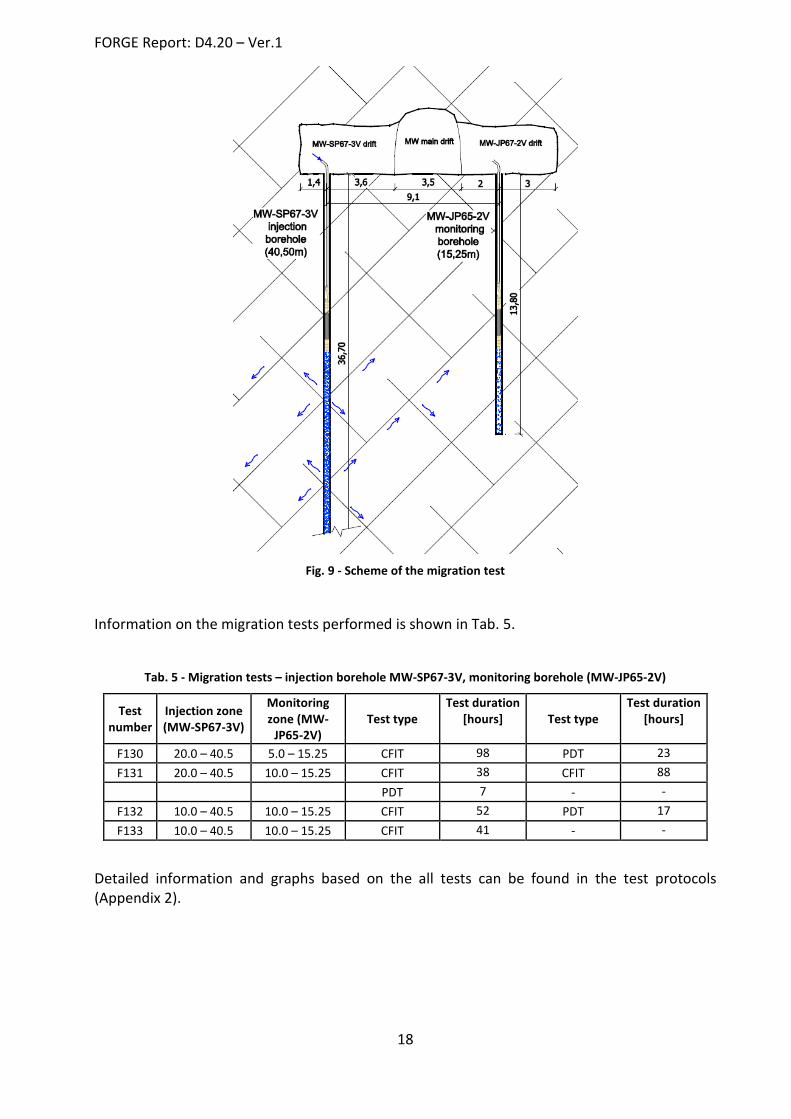
The monitoring borehole has a diameter of 57mm, is 15.25m deep and the angle (approx. 25°) and direction are the same as that of the MW-SP67-3V injection borehole. The axial distance between the boreholes is 9.1m. The monitoring borehole was sealed using a single packer with a 1m long rubber sealing section. Pressure was monitored using a special sensor connected to the measuring apparatus. A scheme of the migration tests is shown in Fig. 9.
Transport tests were designed to investigate gas flow in detail and to verify to what extent the rock mass is affected around the injection borehole during pressure testing. Moreover, by monitoring pressure in the rock mass at a certain distance from the injection borehole, important boundary conditions for the calculation of gas permeability using an analytical solution were obtained.
FORGE Report: D4.20 – Ver.1
18
Fig. 9 - Scheme of the migration test
Information on the migration tests performed is shown in Tab. 5.
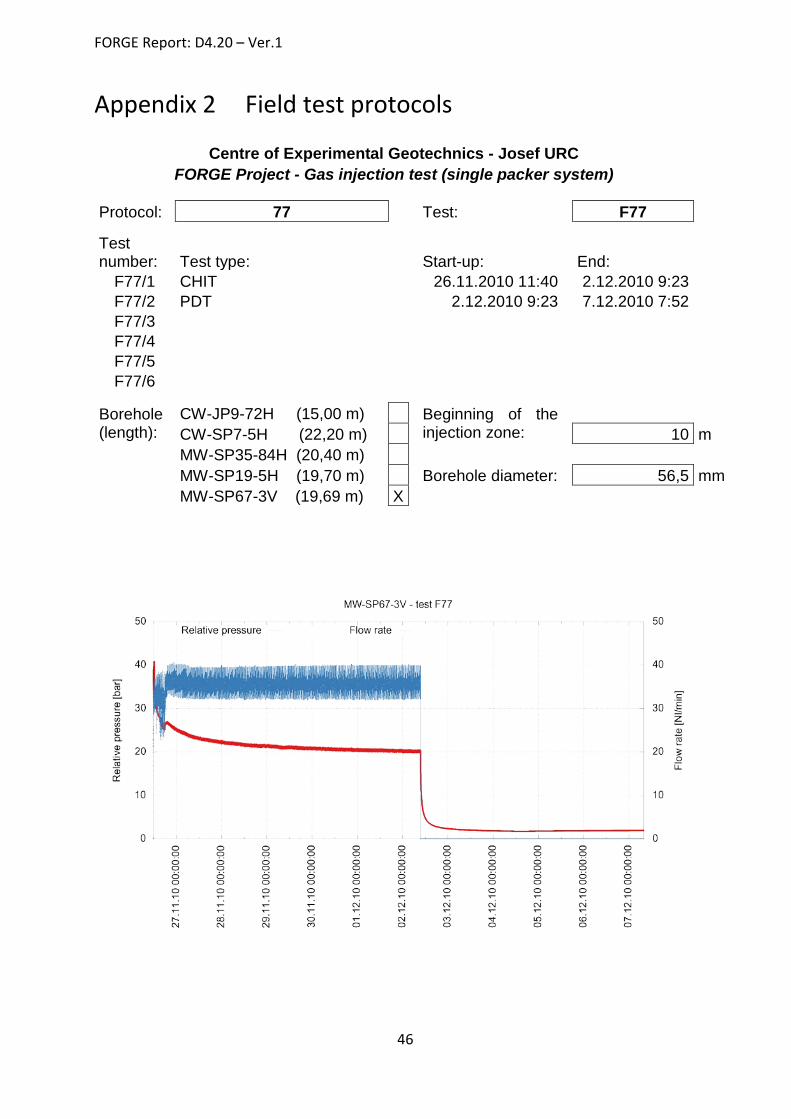
Detailed information and graphs based on the all tests can be found in the test protocols (Appendix 2).
FORGE Report: D4.20 – Ver.1
19
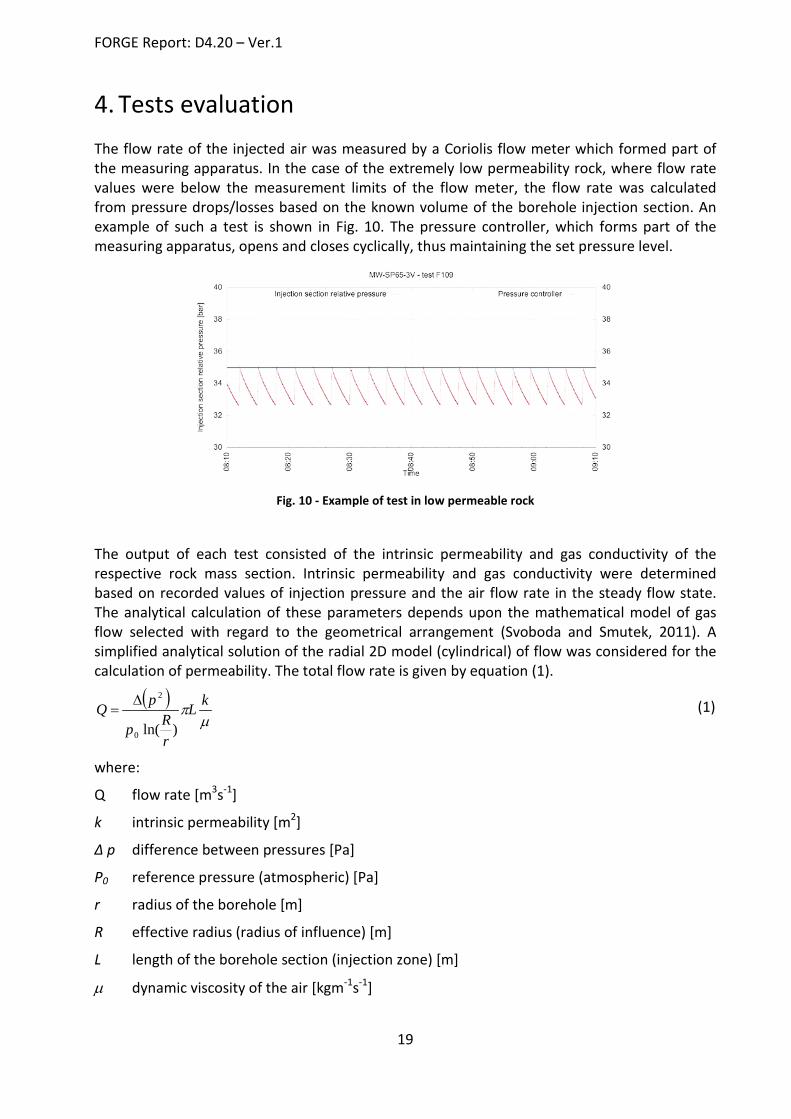
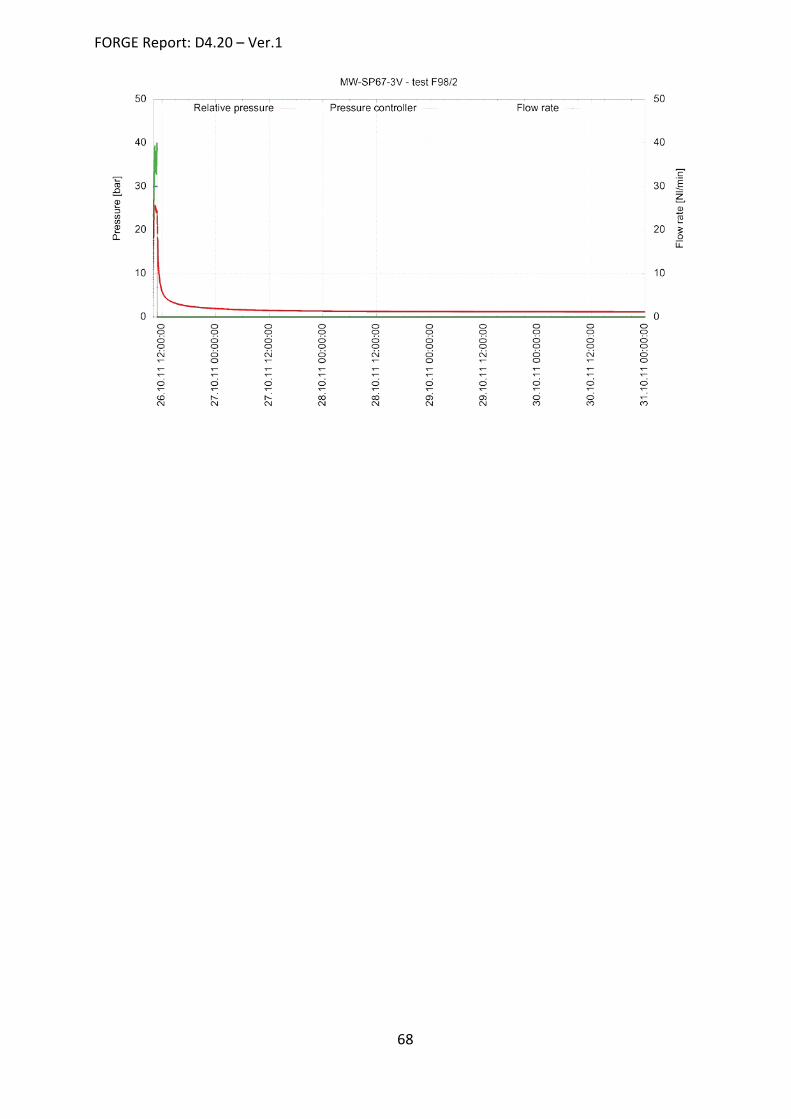
4. Tests evaluation The flow rate of the injected air was measured by a Coriolis flow meter which formed part of the measuring apparatus. In the case of the extremely low permeability rock, where flow rate values were below the measurement limits of the flow meter, the flow rate was calculated from pressure drops/losses based on the known volume of the borehole injection section. An example of such a test is shown in Fig. 10. The pressure controller, which forms part of the measuring apparatus, opens and closes cyclically, thus maintaining the set pressure level.
Fig. 10 - Example of test in low permeable rock
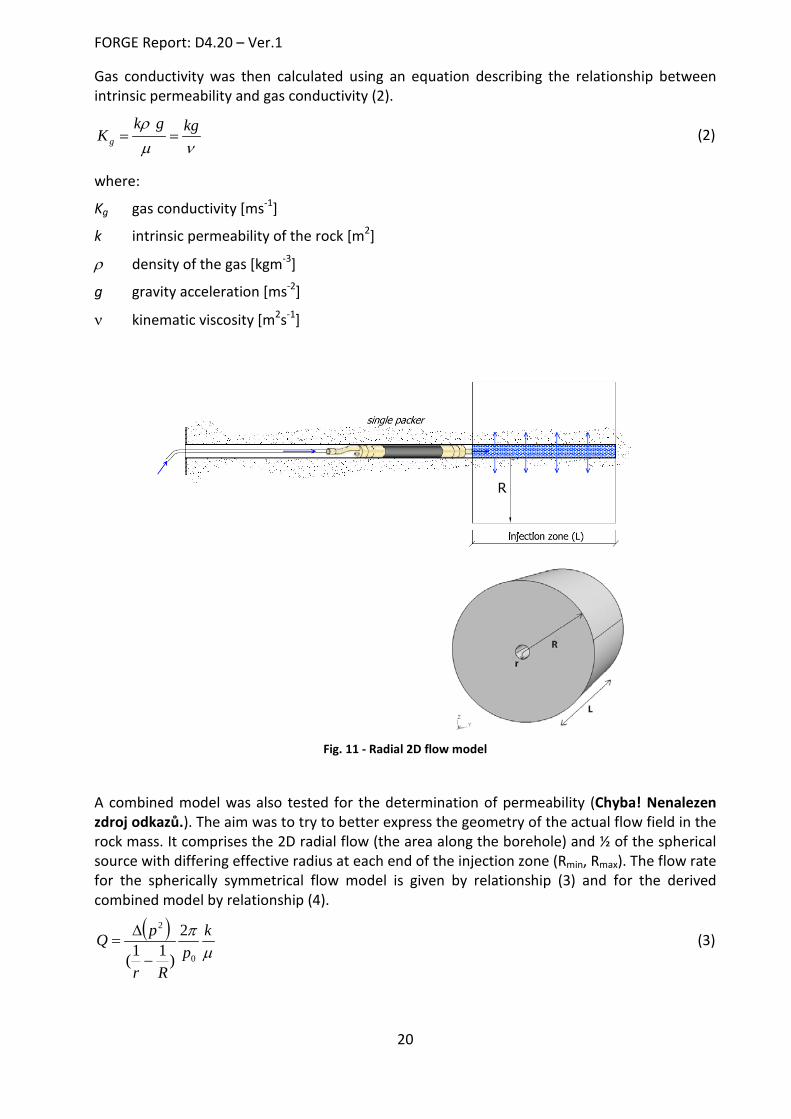
The output of each test consisted of the intrinsic permeability and gas conductivity of the respective rock mass section. Intrinsic permeability and gas conductivity were determined based on recorded values of injection pressure and the air flow rate in the steady flow state. The analytical calculation of these parameters depends upon the mathematical model of gas flow selected with regard to the geometrical arrangement (Svoboda and Smutek, 2011). A simplified analytical solution of the radial 2D model (cylindrical) of flow was considered for the calculation of permeability. The total flow rate is given by equation (1).
( )µ
π kL
rRp
pQ)ln(0
2∆= (1)
where:
Q flow rate [m3s-1]
k intrinsic permeability [m2]
Δ p difference between pressures [Pa]
P0 reference pressure (atmospheric) [Pa]
r radius of the borehole [m]
R effective radius (radius of influence) [m]
L length of the borehole section (injection zone) [m]
µ dynamic viscosity of the air [kgm-1s-1]
FORGE Report: D4.20 – Ver.1
20
Gas conductivity was then calculated using an equation describing the relationship between intrinsic permeability and gas conductivity (2).
νµρ kggk
Kg == (2)
where:
Kg gas conductivity [ms-1]
k intrinsic permeability of the rock [m2]
ρ density of the gas [kgm-3]
g gravity acceleration [ms-2]
ν kinematic viscosity [m2s-1]
Fig. 11 - Radial 2D flow model
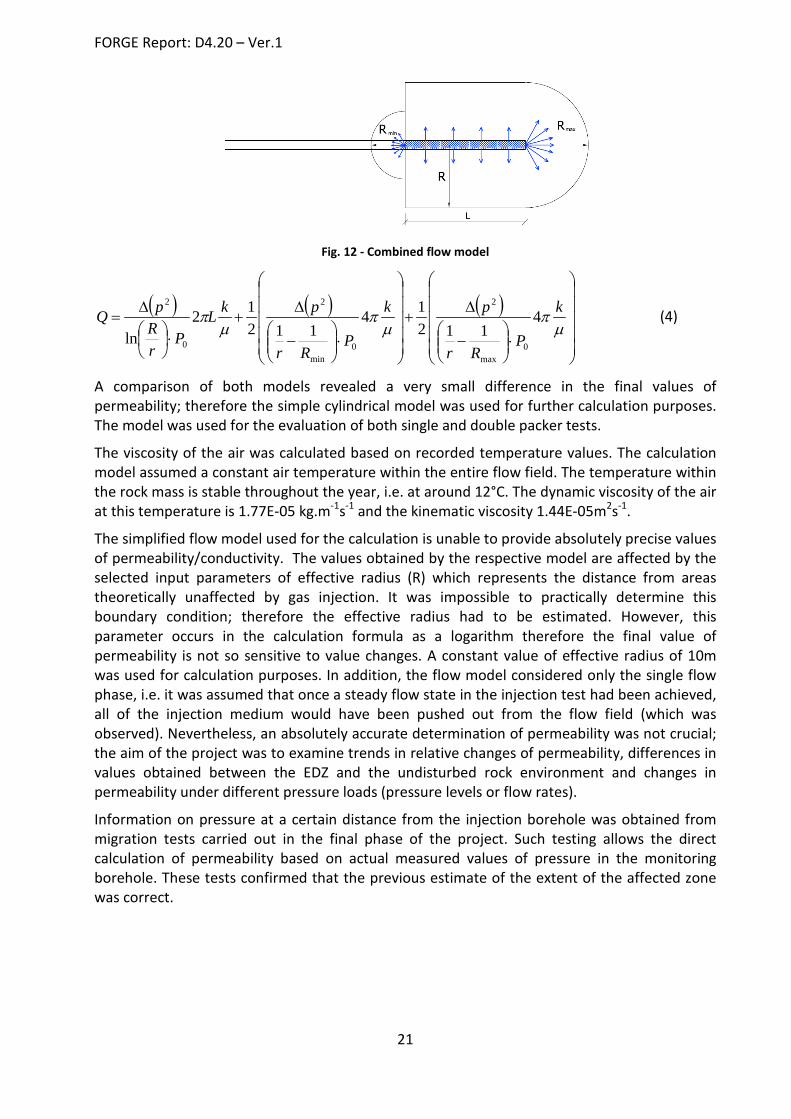
A combined model was also tested for the determination of permeability (Chyba! Nenalezen zdroj odkazů.). The aim was to try to better express the geometry of the actual flow field in the rock mass. It comprises the 2D radial flow (the area along the borehole) and ½ of the spherical source with differing effective radius at each end of the injection zone (Rmin, Rmax). The flow rate for the spherically symmetrical flow model is given by relationship (3) and for the derived combined model by relationship (4).
( )µ
π kp
Rr
pQ0
2 2
)11( −
∆= (3)
FORGE Report: D4.20 – Ver.1
21
Fig. 12 - Combined flow model
( ) ( ) ( )
⋅
−
∆+
⋅
−
∆+
⋅
∆
=µ
πµ
πµ
π k
PRr
pk
PRr
pkLP
rRpQ 4
11214
11212
ln0
max
2
0min
2
0
2
(4)
A comparison of both models revealed a very small difference in the final values of permeability; therefore the simple cylindrical model was used for further calculation purposes. The model was used for the evaluation of both single and double packer tests.
The viscosity of the air was calculated based on recorded temperature values. The calculation model assumed a constant air temperature within the entire flow field. The temperature within the rock mass is stable throughout the year, i.e. at around 12°C. The dynamic viscosity of the air at this temperature is 1.77E-05 kg.m-1s-1 and the kinematic viscosity 1.44E-05m2s-1.
The simplified flow model used for the calculation is unable to provide absolutely precise values of permeability/conductivity. The values obtained by the respective model are affected by the selected input parameters of effective radius (R) which represents the distance from areas theoretically unaffected by gas injection. It was impossible to practically determine this boundary condition; therefore the effective radius had to be estimated. However, this parameter occurs in the calculation formula as a logarithm therefore the final value of permeability is not so sensitive to value changes. A constant value of effective radius of 10m was used for calculation purposes. In addition, the flow model considered only the single flow phase, i.e. it was assumed that once a steady flow state in the injection test had been achieved, all of the injection medium would have been pushed out from the flow field (which was observed). Nevertheless, an absolutely accurate determination of permeability was not crucial; the aim of the project was to examine trends in relative changes of permeability, differences in values obtained between the EDZ and the undisturbed rock environment and changes in permeability under different pressure loads (pressure levels or flow rates).
Information on pressure at a certain distance from the injection borehole was obtained from migration tests carried out in the final phase of the project. Such testing allows the direct calculation of permeability based on actual measured values of pressure in the monitoring borehole. These tests confirmed that the previous estimate of the extent of the affected zone was correct.
FORGE Report: D4.20 – Ver.1
22
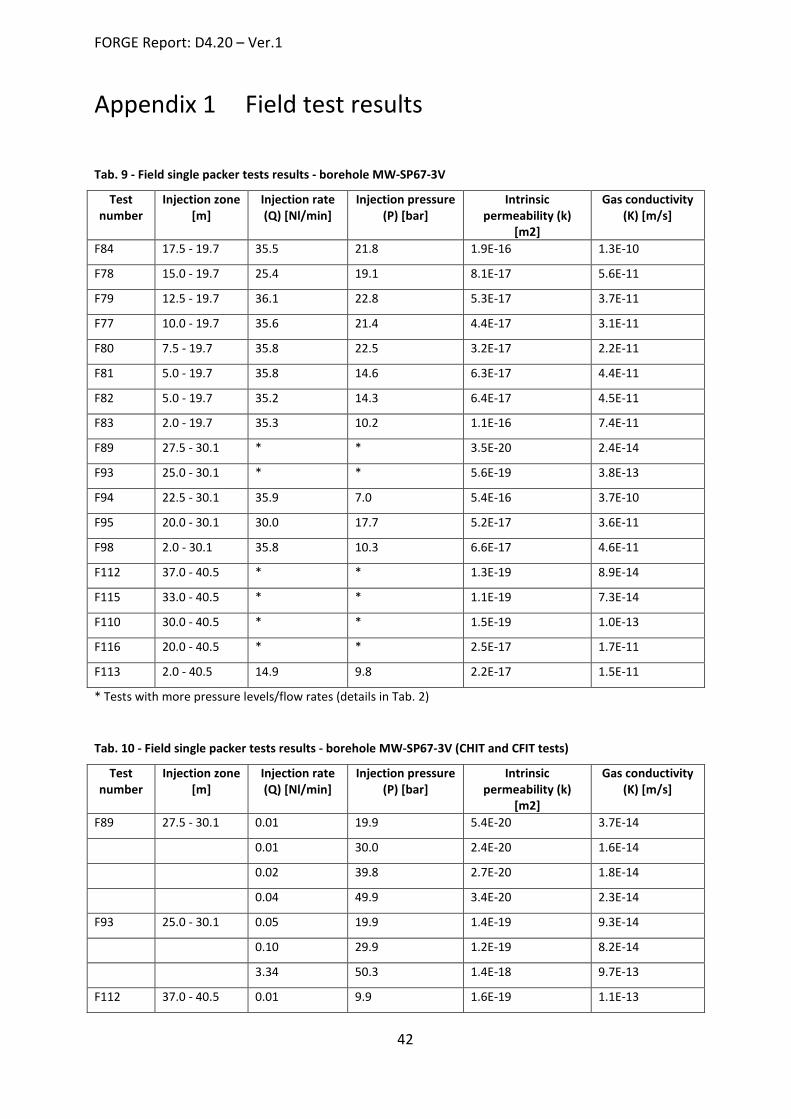
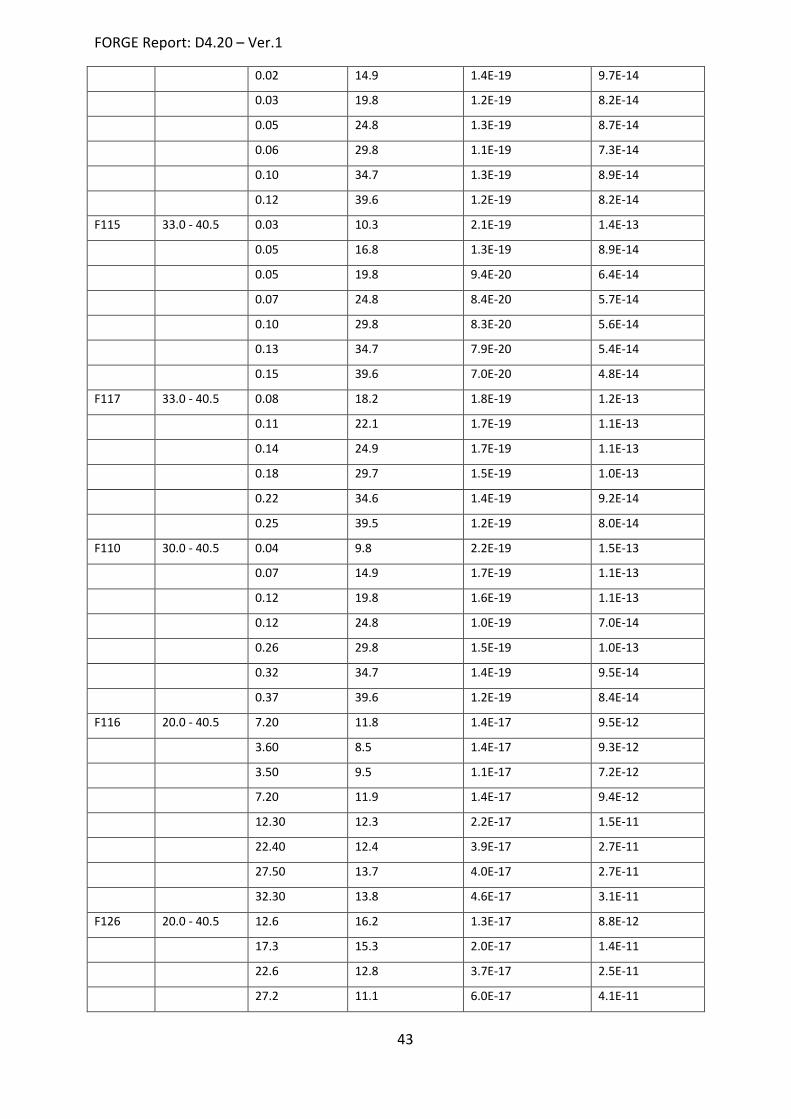
5. Field tests results Detailed information on all the tests performed can be found in tabular form in Appendix 1. The tables provide measured values of the injection rate and pressure during steady state flow conditions as well as calculated intrinsic permeability and gas conductivity.
5.1.SINGLE PACKER TESTS
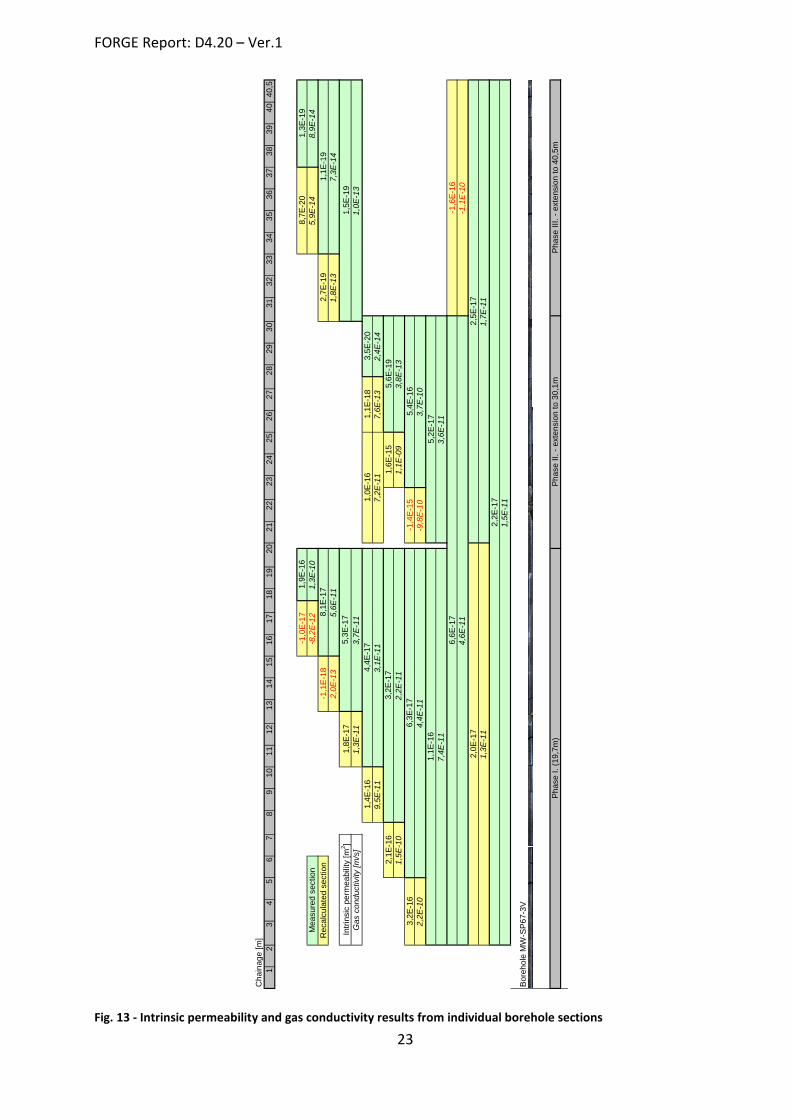
5.1.1. Permeability evolution with distance from the gallery The overall results obtained from the MW-SP67-3V borehole are shown in Fig. 13. The cells highlighted in green contain values of intrinsic permeability and gas conductivity (in italics) calculated from the measurement results. The values shown correspond to average values from all the tests performed in the same section (at all pressure levels and flow rates).
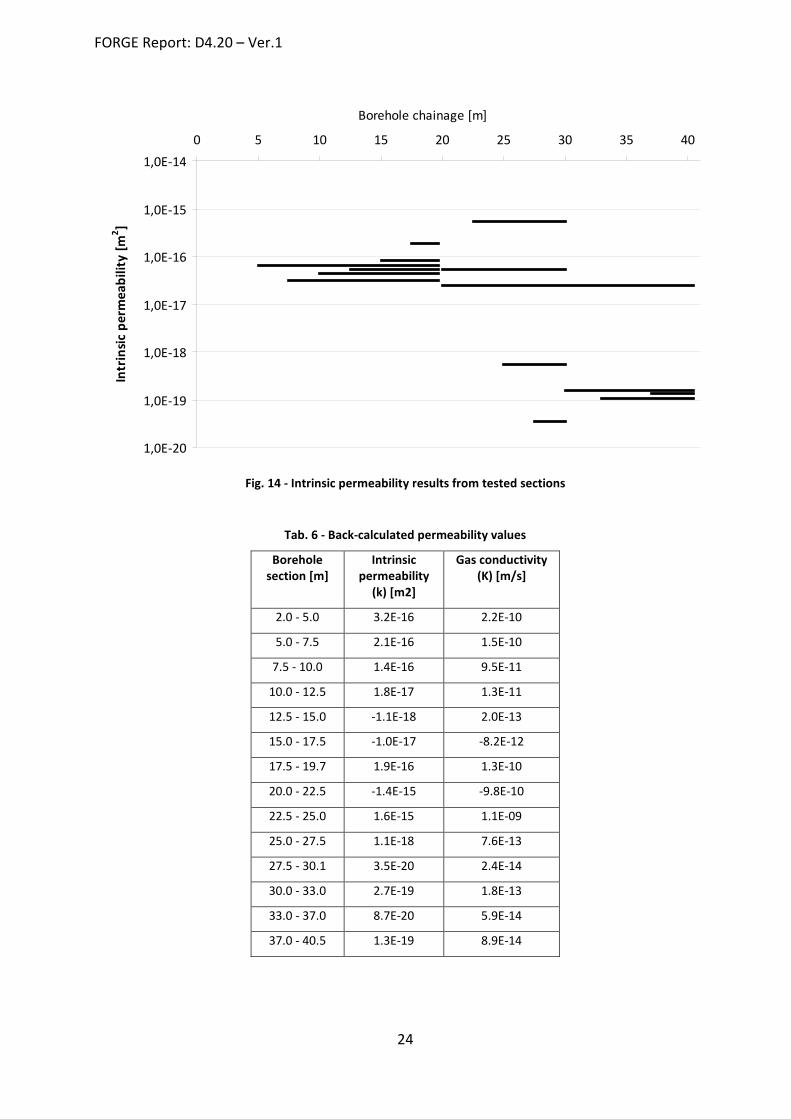
The yellow highlighted cells show values which were recalculated using the two adjacent measurement results. Surprisingly, in some cases a deeper section (with a shorter injection zone) displayed a lower level of obtained pressure with the same injection flow rate than the upper adjacent section (with a longer injection zone). In such cases the permeability of the shorter section was much higher. This was probably the result of injected air escaping back into the borehole through interconnected longitudinal joints (along the packer). In such adjacent sections it was not possible to back-calculate permeability (negative values were obtained). This can be seen clearly in Fig. 14 which shows the intrinsic permeability results from all the tested sections.
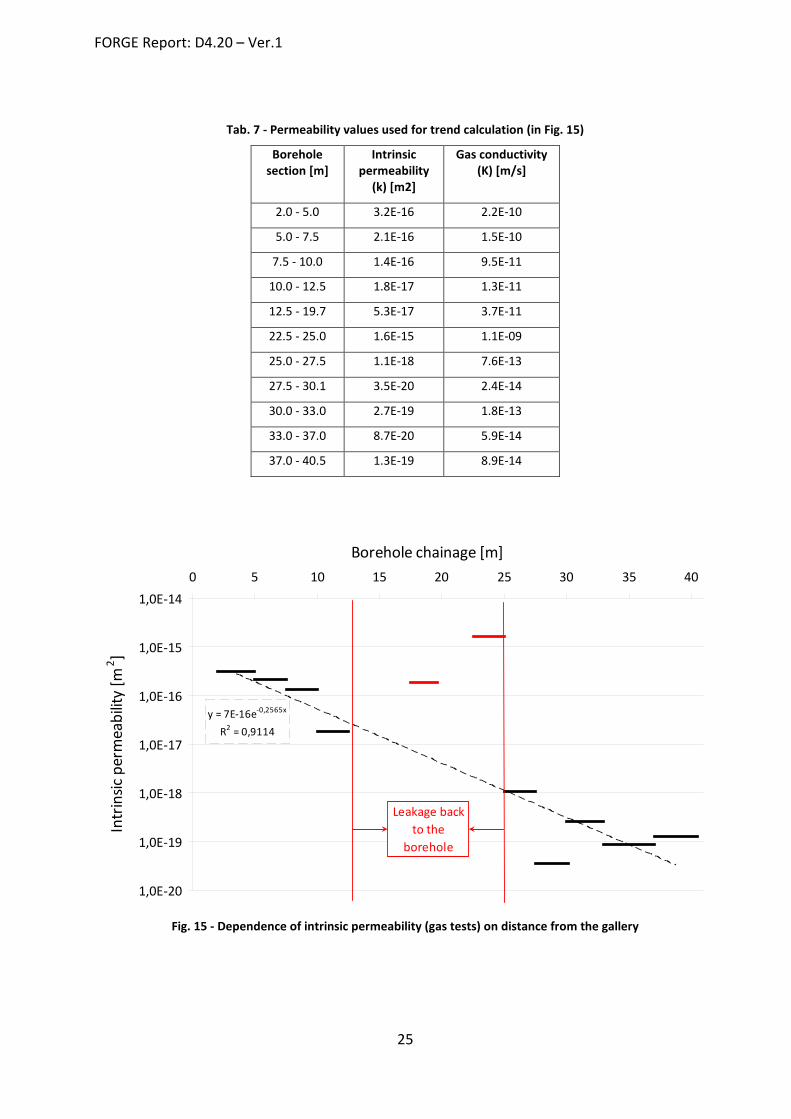
Back-calculated permeability values are shown in Tab. 6. Results from those sections where the leakage of air back into the borehole occurred were not used for further evaluation purposes. Recalculated permeability results are set out in Fig. 15 which shows the dependence of permeability on distance from the mouth of the borehole (the gallery). When the sections where leakage occurred were ignored, a relatively good trend reliability coefficient was obtained.
The results of tests performed with the packer in the upper positions (long injection zones) revealed that final permeability is in the order of between 10E-16 and 10E-17m2 and that deeper in the borehole, i.e. in undisturbed rock environments, values average approximately 10E-19m2.
FORGE Report: D4.20 – Ver.1
23
Cha
inag
e [m
]1
24
56
79
1011
1214
1516
1719
2122
2425
2627
2930
3233
3435
3637
3839
4040
,5
Bor
ehol
e M
W-S
P67
-3V
Intri
nsic
per
mea
bilit
y [m
2 ]G
as c
ondu
ctiv
ity [m
/s]
Pha
se II
I. - e
xten
sion
to 4
0,5m
Mea
sure
d se
ctio
nR
ecal
cula
ted
sect
ion
Pha
se I.
(19,
7m)
Pha
se II
. - e
xten
sion
to 3
0,1m
4,6E
-11
-1,1
E-1
0
1,3E
-11
1,7E
-11
1,1E
-16
5,2E
-17
6,6E
-17
-1,6
E-1
6
2,2E
-17
1,5E
-11
2,0E
-17
2,5E
-17
7,4E
-11
3,6E
-11
3,2E
-16
6,3E
-17
-1,4
E-1
55,
4E-1
62,
2E-1
04,
4E-1
1-9
,8E
-10
3,7E
-10
3,5E
-20
2,4E
-14
2,1E
-16
3,2E
-17
1,6E
-15
5,6E
-19
1,4E
-16
4,4E
-17
1,0E
-16
1,1E
-18
1,5E
-10
2,2E
-11
1,1E
-09
3,8E
-13
9,5E
-11
3,1E
-11
7,2E
-11
7,6E
-13
1,8E
-17
5,3E
-17
1,5E
-19
1,3E
-11
3,7E
-11
1,0E
-13
-1,1
E-1
88,
1E-1
72,
7E-1
91,
1E-1
92,
0E-1
35,
6E-1
11,
8E-1
37,
3E-1
4
5,9E
-14
8,9E
-14
8,7E
-20
1,3E
-19
-1,0
E-1
71,
9E-1
6-8
,2E
-12
1,3E
-10
2023
2831
38
1318
Fig. 13 - Intrinsic permeability and gas conductivity results from individual borehole sections
FORGE Report: D4.20 – Ver.1
24
1,0E-20
1,0E-19
1,0E-18
1,0E-17
1,0E-16
1,0E-15
1,0E-140 5 10 15 20 25 30 35 40
Borehole chainage [m]In
trin
sic p
erm
eabi
lity
[m2 ]
Fig. 14 - Intrinsic permeability results from tested sections
Tab. 6 - Back-calculated permeability values
Borehole section [m]
Intrinsic permeability
(k) [m2]
Gas conductivity (K) [m/s]
2.0 - 5.0 3.2E-16 2.2E-10
5.0 - 7.5 2.1E-16 1.5E-10
7.5 - 10.0 1.4E-16 9.5E-11
10.0 - 12.5 1.8E-17 1.3E-11
12.5 - 15.0 -1.1E-18 2.0E-13
15.0 - 17.5 -1.0E-17 -8.2E-12
17.5 - 19.7 1.9E-16 1.3E-10
20.0 - 22.5 -1.4E-15 -9.8E-10
22.5 - 25.0 1.6E-15 1.1E-09
25.0 - 27.5 1.1E-18 7.6E-13
27.5 - 30.1 3.5E-20 2.4E-14
30.0 - 33.0 2.7E-19 1.8E-13
33.0 - 37.0 8.7E-20 5.9E-14
37.0 - 40.5 1.3E-19 8.9E-14
FORGE Report: D4.20 – Ver.1
25
Tab. 7 - Permeability values used for trend calculation (in Fig. 15)
Borehole section [m]
Intrinsic permeability
(k) [m2]
Gas conductivity (K) [m/s]
2.0 - 5.0 3.2E-16 2.2E-10
5.0 - 7.5 2.1E-16 1.5E-10
7.5 - 10.0 1.4E-16 9.5E-11
10.0 - 12.5 1.8E-17 1.3E-11
12.5 - 19.7 5.3E-17 3.7E-11
22.5 - 25.0 1.6E-15 1.1E-09
25.0 - 27.5 1.1E-18 7.6E-13
27.5 - 30.1 3.5E-20 2.4E-14
30.0 - 33.0 2.7E-19 1.8E-13
33.0 - 37.0 8.7E-20 5.9E-14
37.0 - 40.5 1.3E-19 8.9E-14
y = 7E-16e-0,2565x
R2 = 0,9114
1,0E-20
1,0E-19
1,0E-18
1,0E-17
1,0E-16
1,0E-15
1,0E-140 5 10 15 20 25 30 35 40
Borehole chainage [m]
Intr
insic
per
mea
bilit
y [m
2 ]
Leakage back to the
borehole
Fig. 15 - Dependence of intrinsic permeability (gas tests) on distance from the gallery
FORGE Report: D4.20 – Ver.1
26
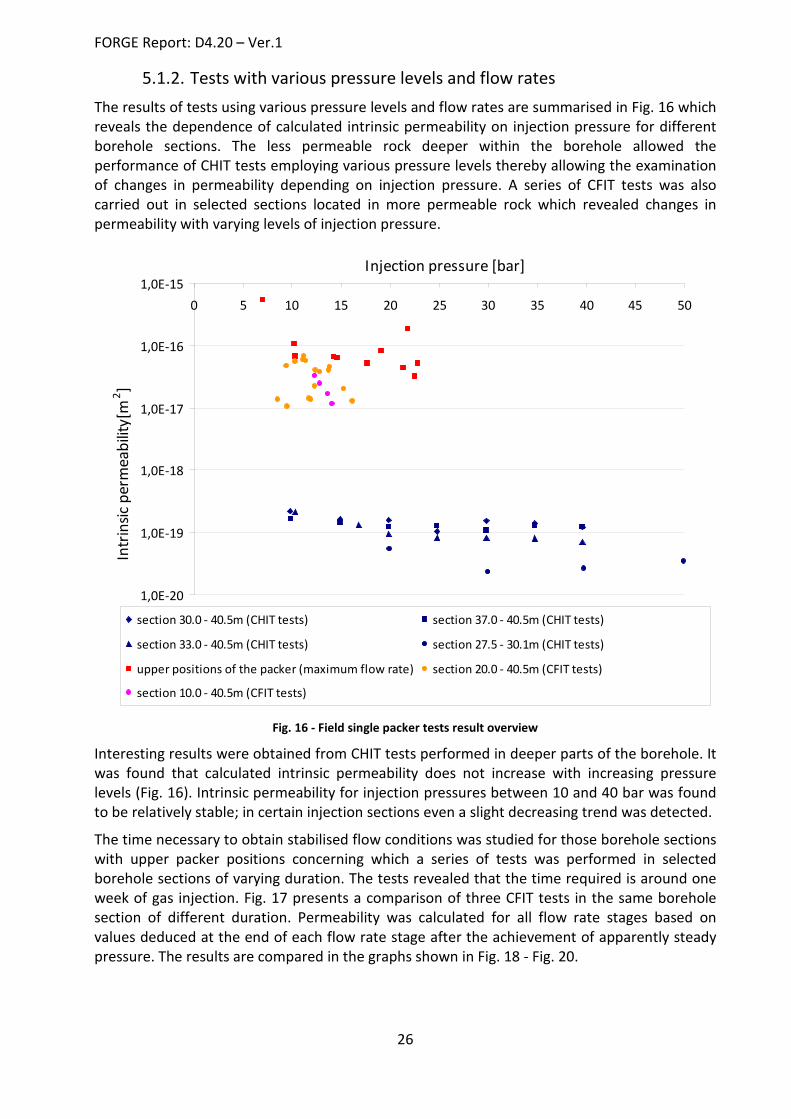
5.1.2. Tests with various pressure levels and flow rates The results of tests using various pressure levels and flow rates are summarised in Fig. 16 which reveals the dependence of calculated intrinsic permeability on injection pressure for different borehole sections. The less permeable rock deeper within the borehole allowed the performance of CHIT tests employing various pressure levels thereby allowing the examination of changes in permeability depending on injection pressure. A series of CFIT tests was also carried out in selected sections located in more permeable rock which revealed changes in permeability with varying levels of injection pressure.
upper positions of the packer (maximum flow rate) section 20.0 - 40.5m (CFIT tests)
section 10.0 - 40.5m (CFIT tests)
Fig. 16 - Field single packer tests result overview
Interesting results were obtained from CHIT tests performed in deeper parts of the borehole. It was found that calculated intrinsic permeability does not increase with increasing pressure levels (Fig. 16). Intrinsic permeability for injection pressures between 10 and 40 bar was found to be relatively stable; in certain injection sections even a slight decreasing trend was detected.
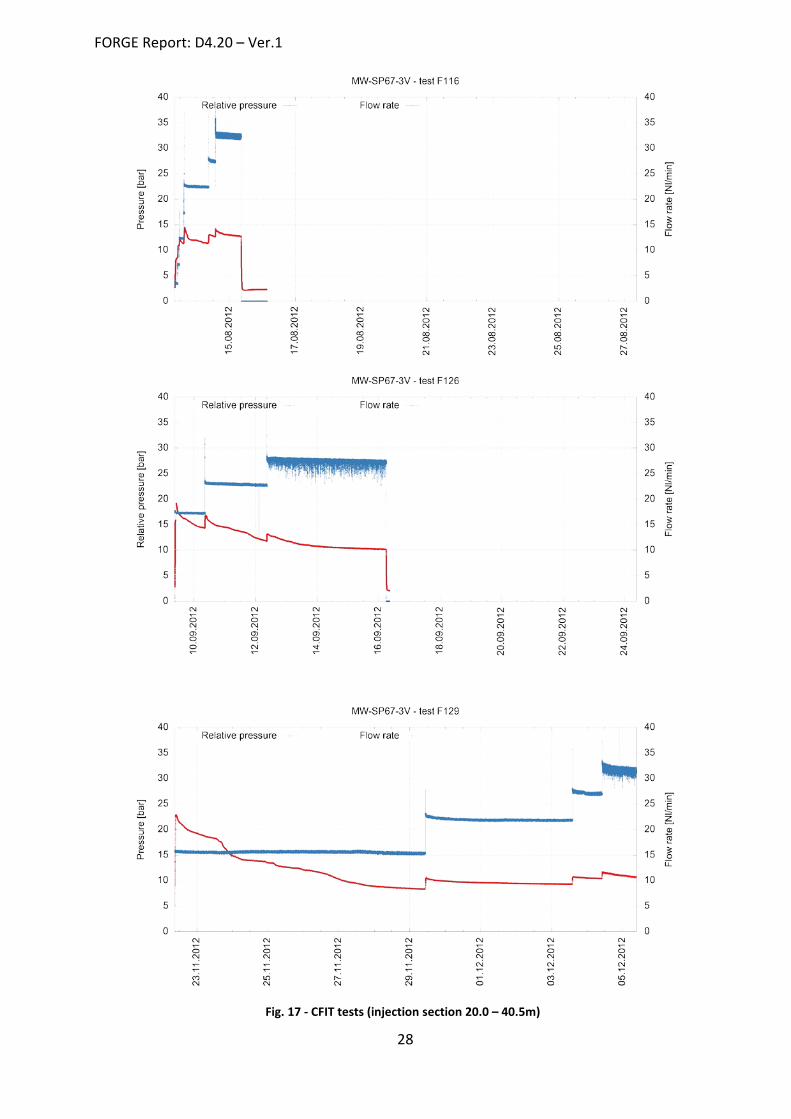
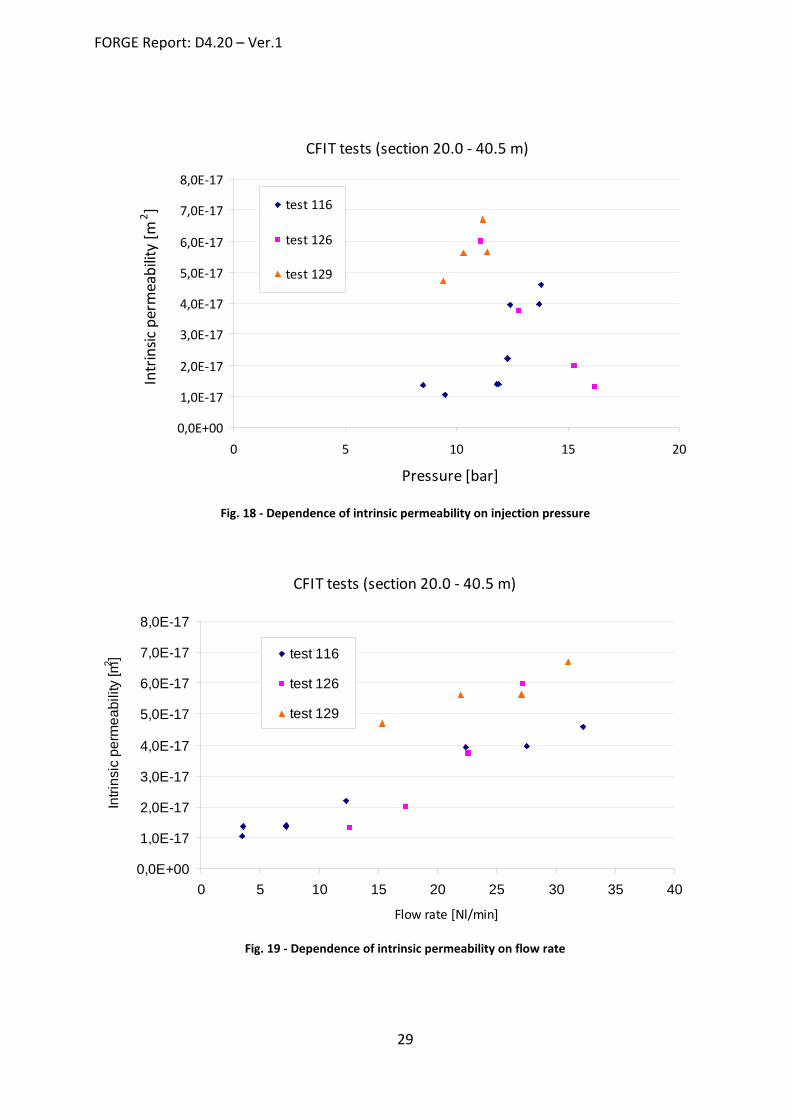
The time necessary to obtain stabilised flow conditions was studied for those borehole sections with upper packer positions concerning which a series of tests was performed in selected borehole sections of varying duration. The tests revealed that the time required is around one week of gas injection. Fig. 17 presents a comparison of three CFIT tests in the same borehole section of different duration. Permeability was calculated for all flow rate stages based on values deduced at the end of each flow rate stage after the achievement of apparently steady pressure. The results are compared in the graphs shown in Fig. 18 - Fig. 20.
FORGE Report: D4.20 – Ver.1
27
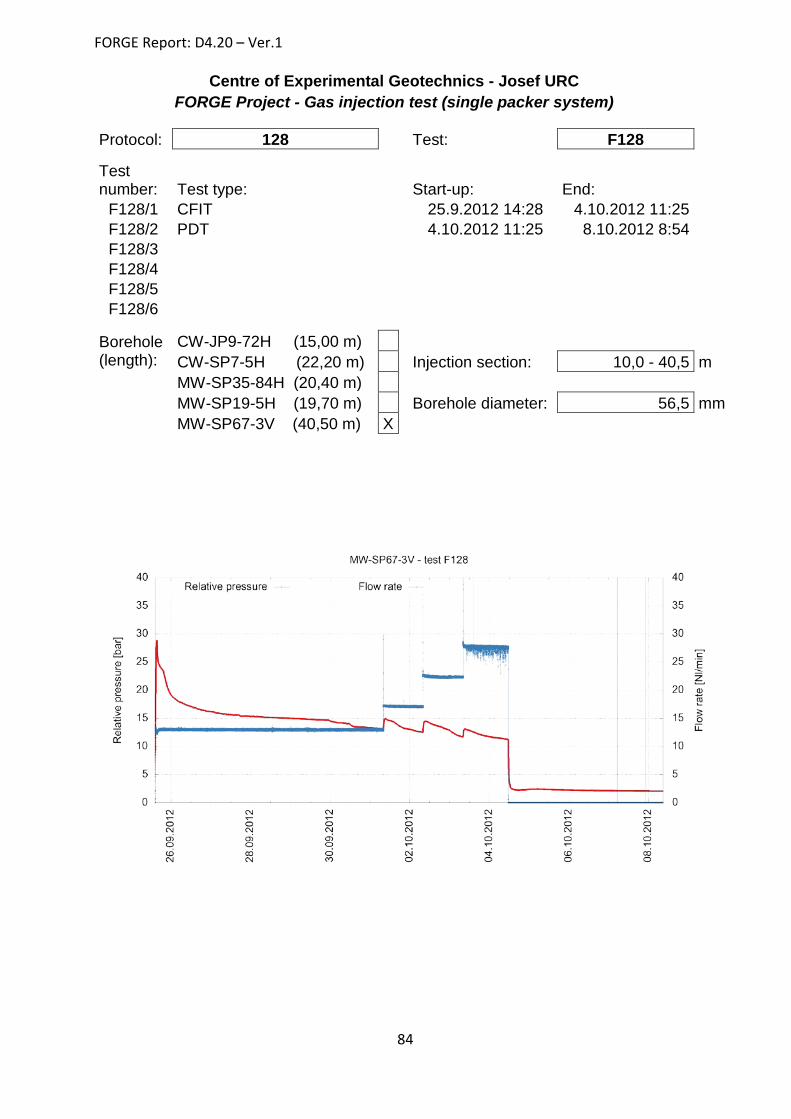
The whole series of increasing flow rate tests involved in test 116 was performed over a period of 2 days without waiting for the stabilisation of air flow conditions which always occurred after approximately 7 days of gas injection. Flow stabilisation was also not achieved in test F126 in which all the flow rate increases were performed within the stage of an overall pressure drop. During the final test, F129, which lasted two weeks, all the flow rate increases were implemented following borehole pressure stabilisation. The shortest (F116) and the longest test (F129) showed increasing permeability with increasing injection pressure (Fig. 17). Only test F126 showed the opposite trend. The dependence of intrinsic permeability on injection flow rate showed an upward trend in all the tests (Fig. 19).
Fig. 18 - Dependence of intrinsic permeability on injection pressure
CFIT tests (section 20.0 - 40.5 m)
0,0E+00
1,0E-17
2,0E-17
3,0E-17
4,0E-17
5,0E-17
6,0E-17
7,0E-17
8,0E-17
0 5 10 15 20 25 30 35 40
Flow rate [Nl/min]
Intri
nsic
per
mea
bilit
y [m
2 ] test 116
test 126
test 129
Fig. 19 - Dependence of intrinsic permeability on flow rate
FORGE Report: D4.20 – Ver.1
30
CFIT tests (section 20.0 - 40.5 m)
0
2
4
6
8
10
12
14
16
18
20
0 5 10 15 20 25 30 35 40
Flow rate [Nl/min]
Pres
sure
[bar
]
test 116
test 126
test 129
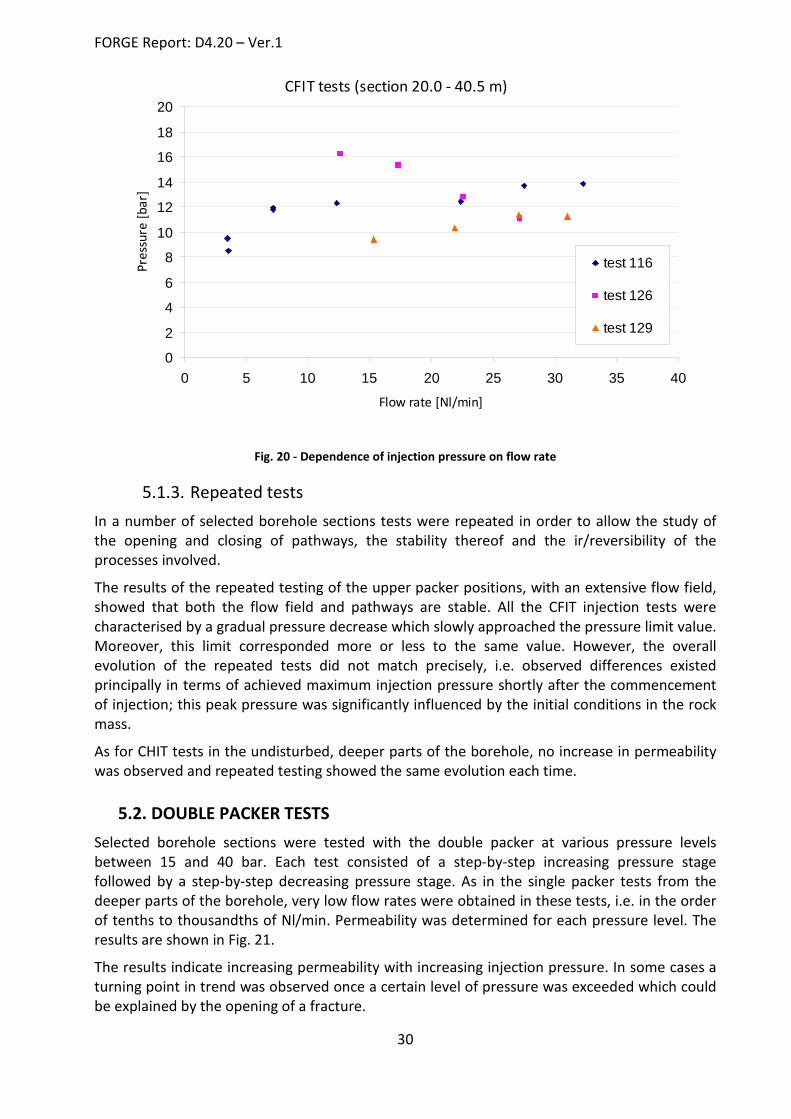
Fig. 20 - Dependence of injection pressure on flow rate
5.1.3. Repeated tests In a number of selected borehole sections tests were repeated in order to allow the study of the opening and closing of pathways, the stability thereof and the ir/reversibility of the processes involved.
The results of the repeated testing of the upper packer positions, with an extensive flow field, showed that both the flow field and pathways are stable. All the CFIT injection tests were characterised by a gradual pressure decrease which slowly approached the pressure limit value. Moreover, this limit corresponded more or less to the same value. However, the overall evolution of the repeated tests did not match precisely, i.e. observed differences existed principally in terms of achieved maximum injection pressure shortly after the commencement of injection; this peak pressure was significantly influenced by the initial conditions in the rock mass.
As for CHIT tests in the undisturbed, deeper parts of the borehole, no increase in permeability was observed and repeated testing showed the same evolution each time.
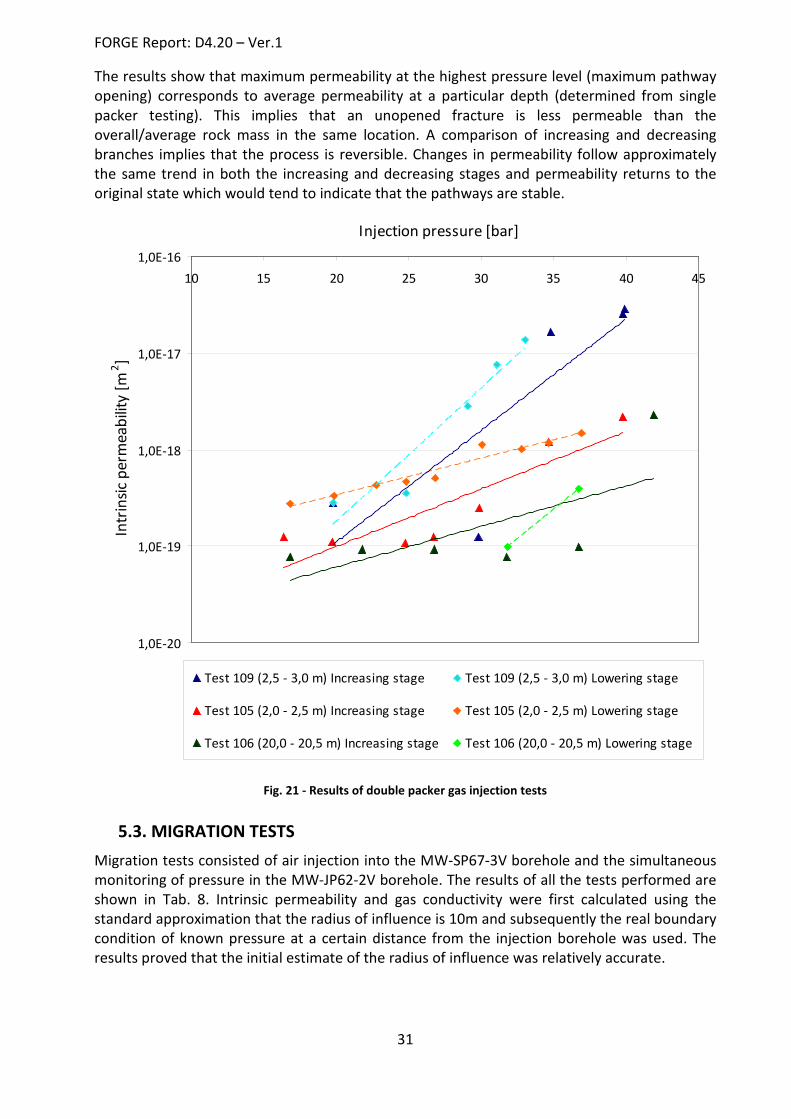
5.2. DOUBLE PACKER TESTS Selected borehole sections were tested with the double packer at various pressure levels between 15 and 40 bar. Each test consisted of a step-by-step increasing pressure stage followed by a step-by-step decreasing pressure stage. As in the single packer tests from the deeper parts of the borehole, very low flow rates were obtained in these tests, i.e. in the order of tenths to thousandths of Nl/min. Permeability was determined for each pressure level. The results are shown in Fig. 21.
The results indicate increasing permeability with increasing injection pressure. In some cases a turning point in trend was observed once a certain level of pressure was exceeded which could be explained by the opening of a fracture.
FORGE Report: D4.20 – Ver.1
31
The results show that maximum permeability at the highest pressure level (maximum pathway opening) corresponds to average permeability at a particular depth (determined from single packer testing). This implies that an unopened fracture is less permeable than the overall/average rock mass in the same location. A comparison of increasing and decreasing branches implies that the process is reversible. Changes in permeability follow approximately the same trend in both the increasing and decreasing stages and permeability returns to the original state which would tend to indicate that the pathways are stable.
1,0E-20
1,0E-19
1,0E-18
1,0E-17
1,0E-1610 15 20 25 30 35 40 45
Injection pressure [bar]
Intr
insic
per
mea
bilit
y [m
2 ]
Test 109 (2,5 - 3,0 m) Increasing stage Test 109 (2,5 - 3,0 m) Lowering stage
Test 105 (2,0 - 2,5 m) Increasing stage Test 105 (2,0 - 2,5 m) Lowering stage
Test 106 (20,0 - 20,5 m) Increasing stage Test 106 (20,0 - 20,5 m) Lowering stage
Fig. 21 - Results of double packer gas injection tests
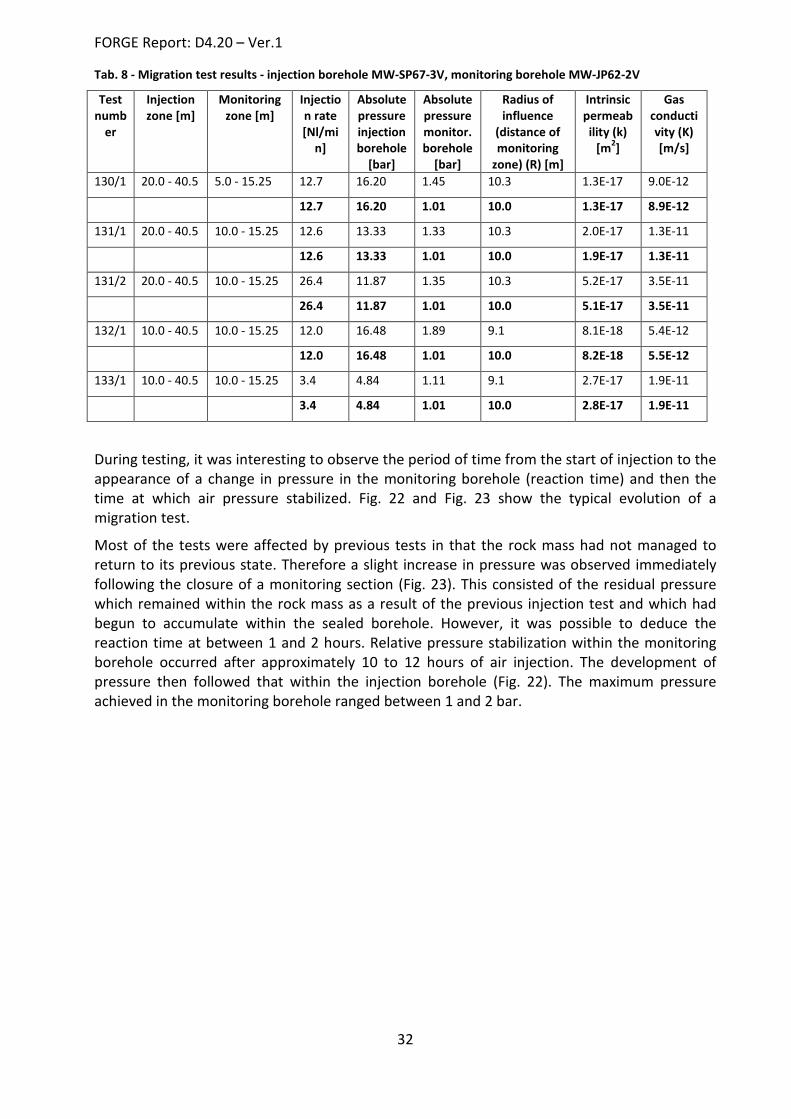
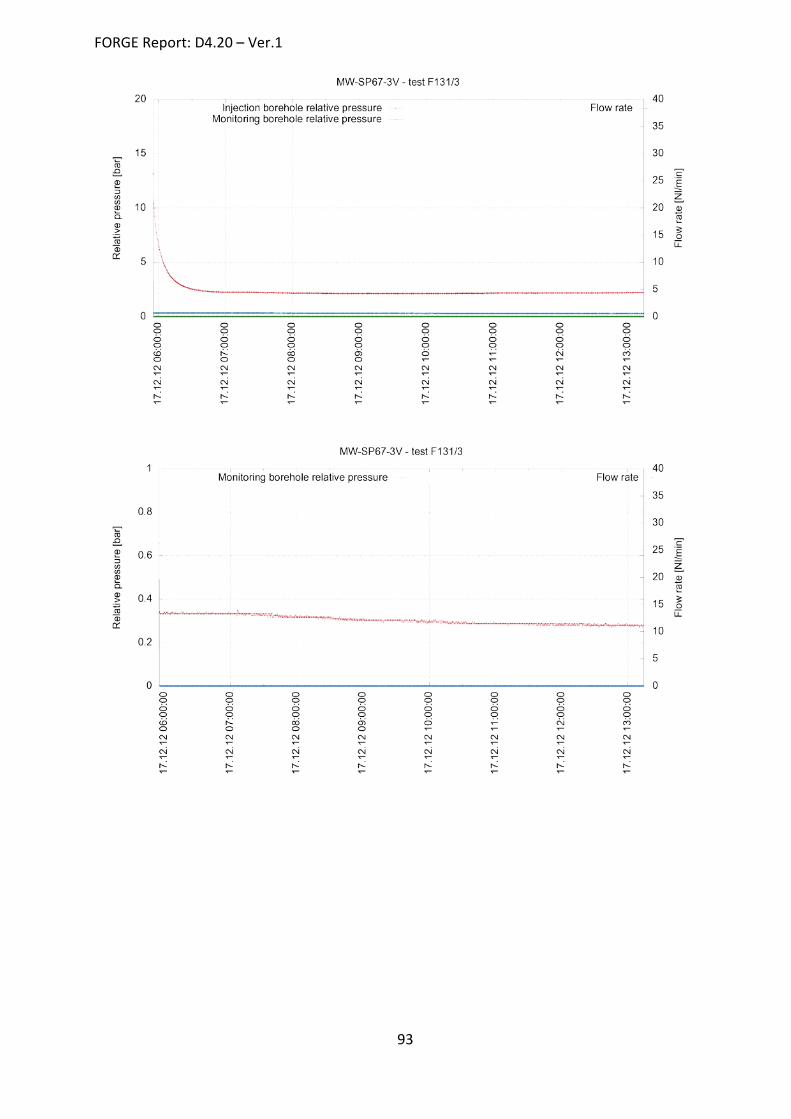
5.3. MIGRATION TESTS Migration tests consisted of air injection into the MW-SP67-3V borehole and the simultaneous monitoring of pressure in the MW-JP62-2V borehole. The results of all the tests performed are shown in Tab. 8. Intrinsic permeability and gas conductivity were first calculated using the standard approximation that the radius of influence is 10m and subsequently the real boundary condition of known pressure at a certain distance from the injection borehole was used. The results proved that the initial estimate of the radius of influence was relatively accurate.
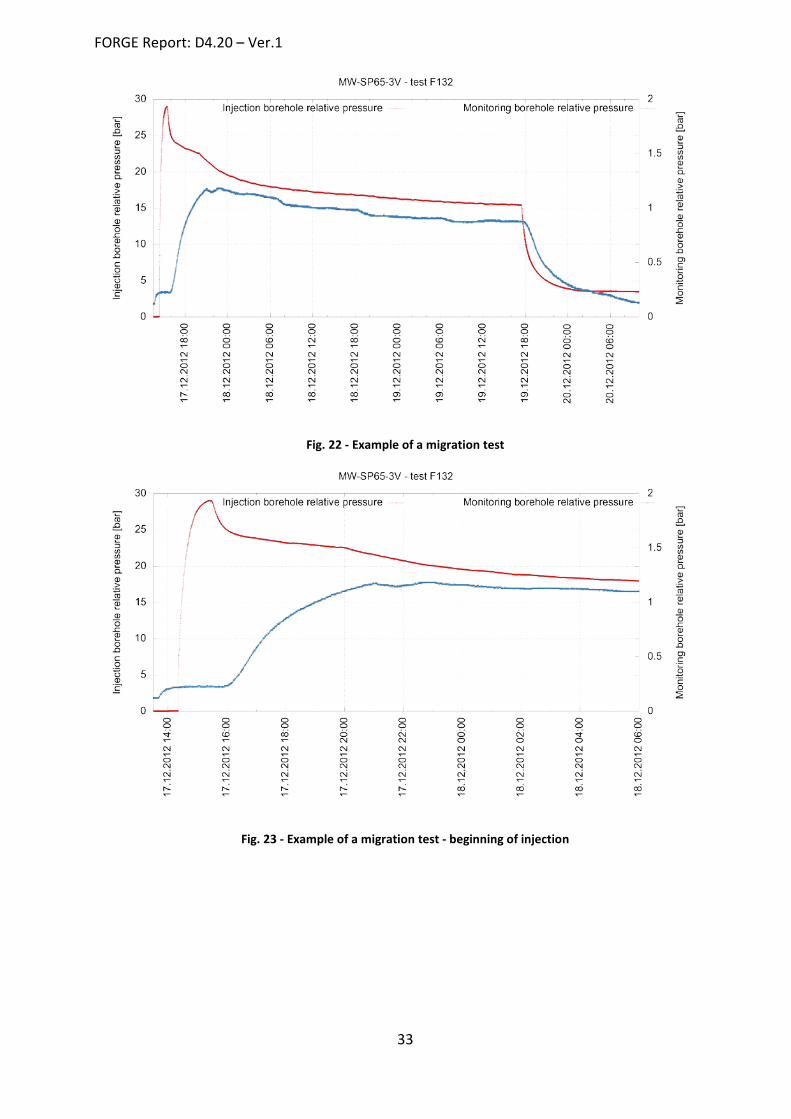
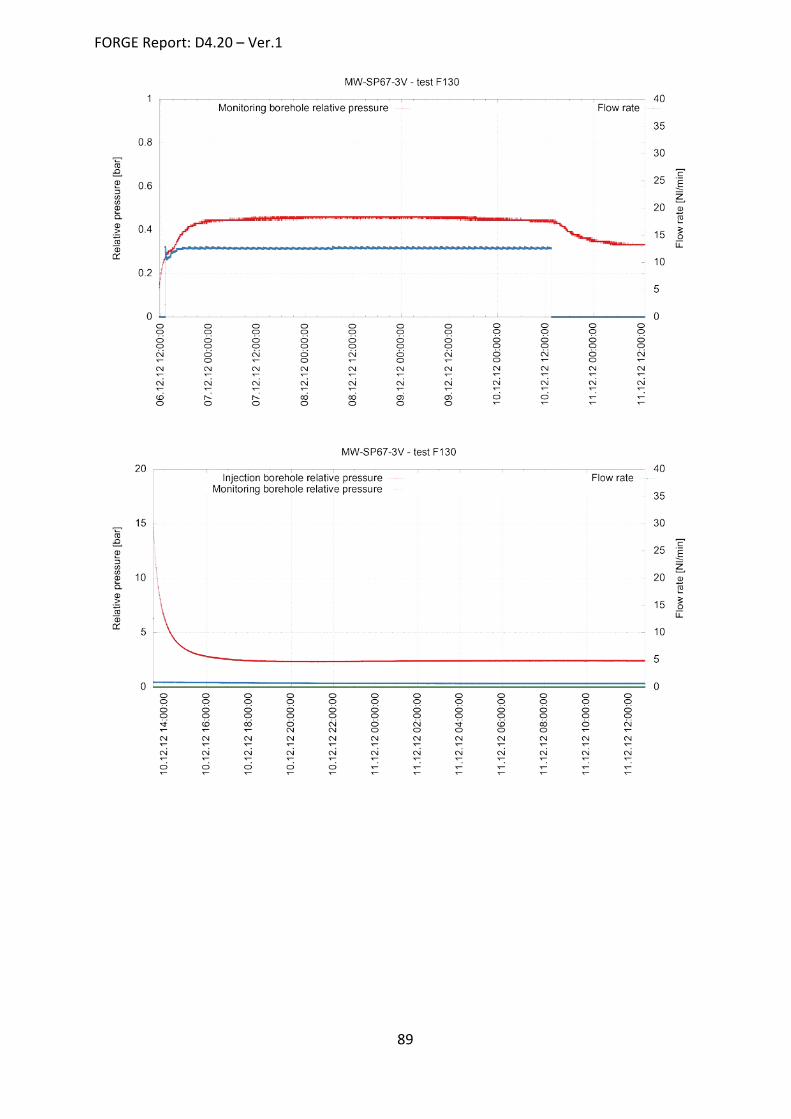
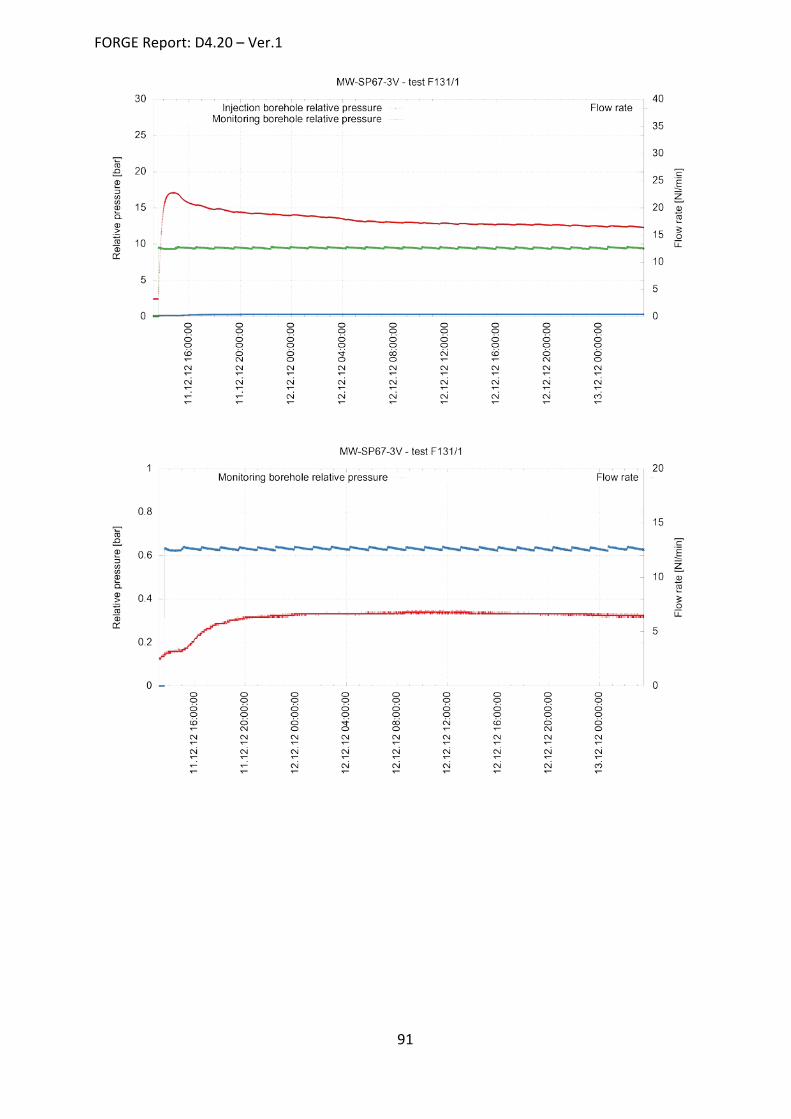
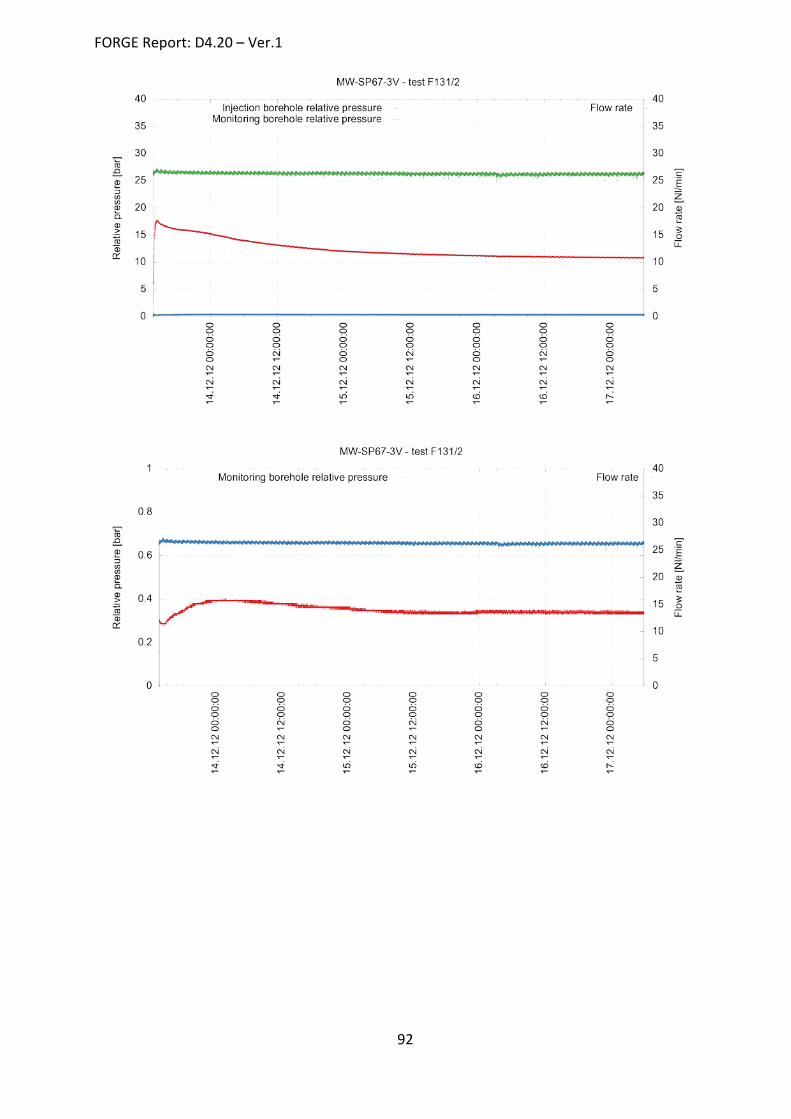
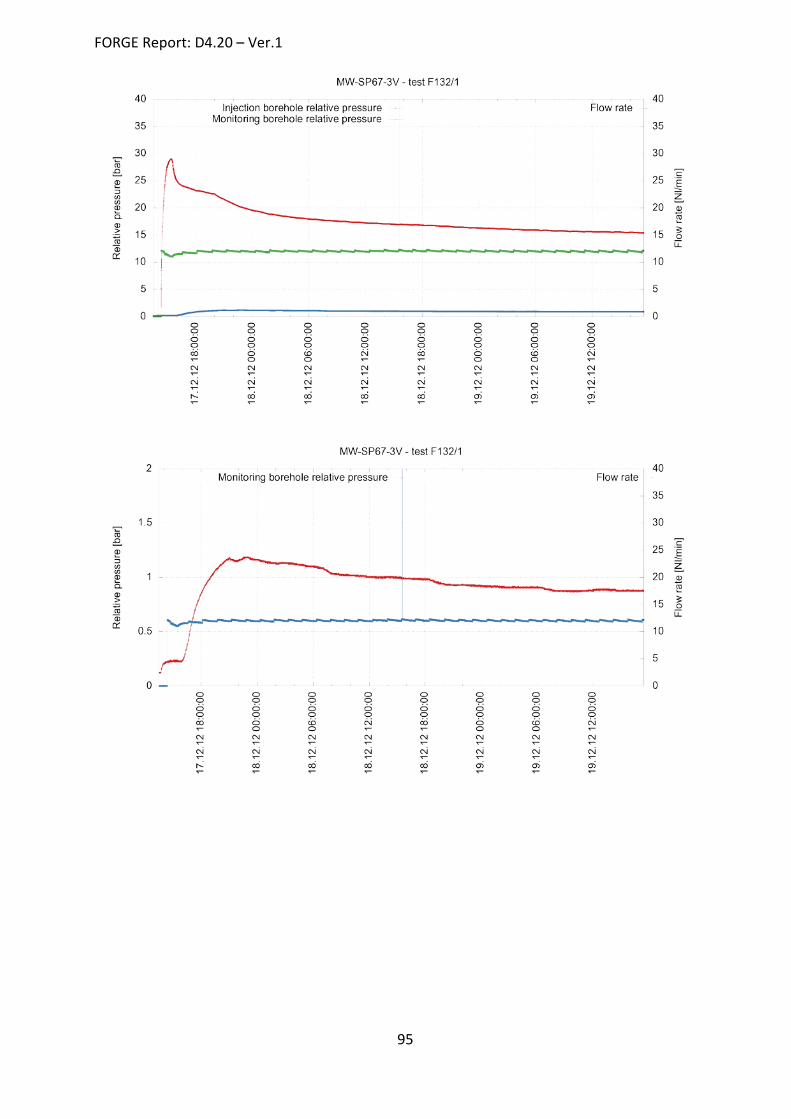
During testing, it was interesting to observe the period of time from the start of injection to the appearance of a change in pressure in the monitoring borehole (reaction time) and then the time at which air pressure stabilized. Fig. 22 and Fig. 23 show the typical evolution of a migration test.
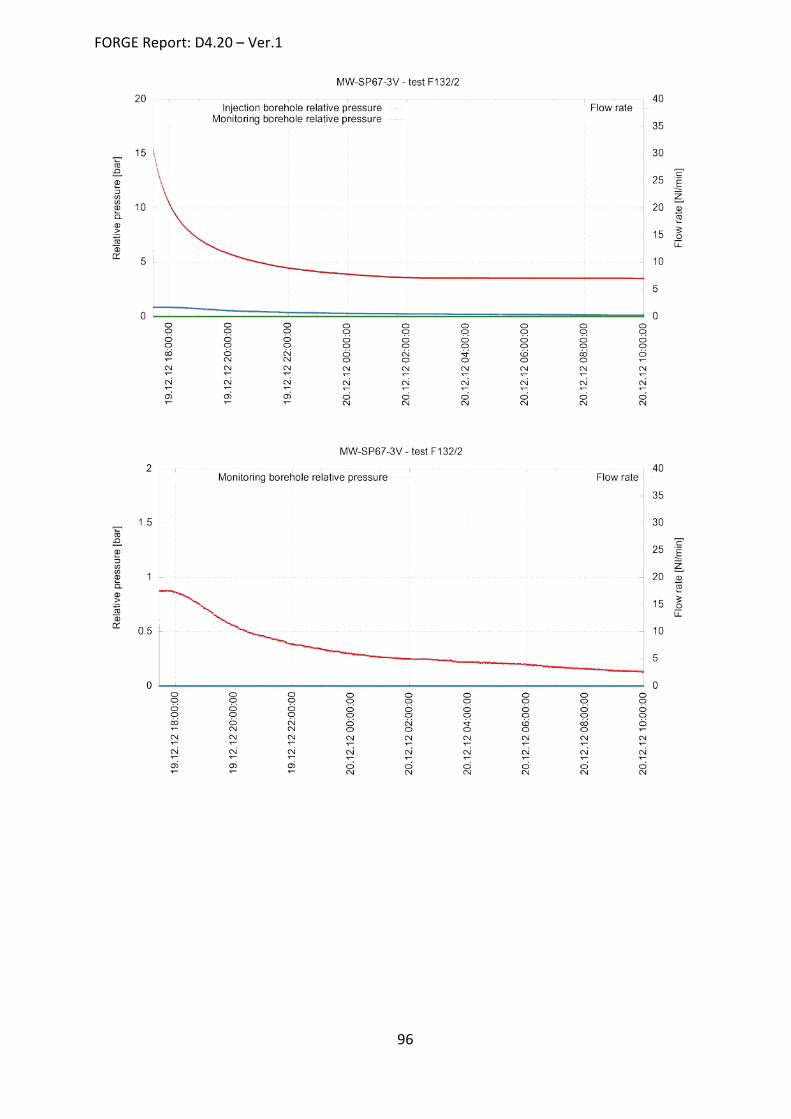
Most of the tests were affected by previous tests in that the rock mass had not managed to return to its previous state. Therefore a slight increase in pressure was observed immediately following the closure of a monitoring section (Fig. 23). This consisted of the residual pressure which remained within the rock mass as a result of the previous injection test and which had begun to accumulate within the sealed borehole. However, it was possible to deduce the reaction time at between 1 and 2 hours. Relative pressure stabilization within the monitoring borehole occurred after approximately 10 to 12 hours of air injection. The development of pressure then followed that within the injection borehole (Fig. 22). The maximum pressure achieved in the monitoring borehole ranged between 1 and 2 bar.
FORGE Report: D4.20 – Ver.1
33
Fig. 22 - Example of a migration test
Fig. 23 - Example of a migration test - beginning of injection
FORGE Report: D4.20 – Ver.1
34
6. Results summary and discussions
6.1.1. Differences in gas permeability between the EDZ and the undisturbed rock mass
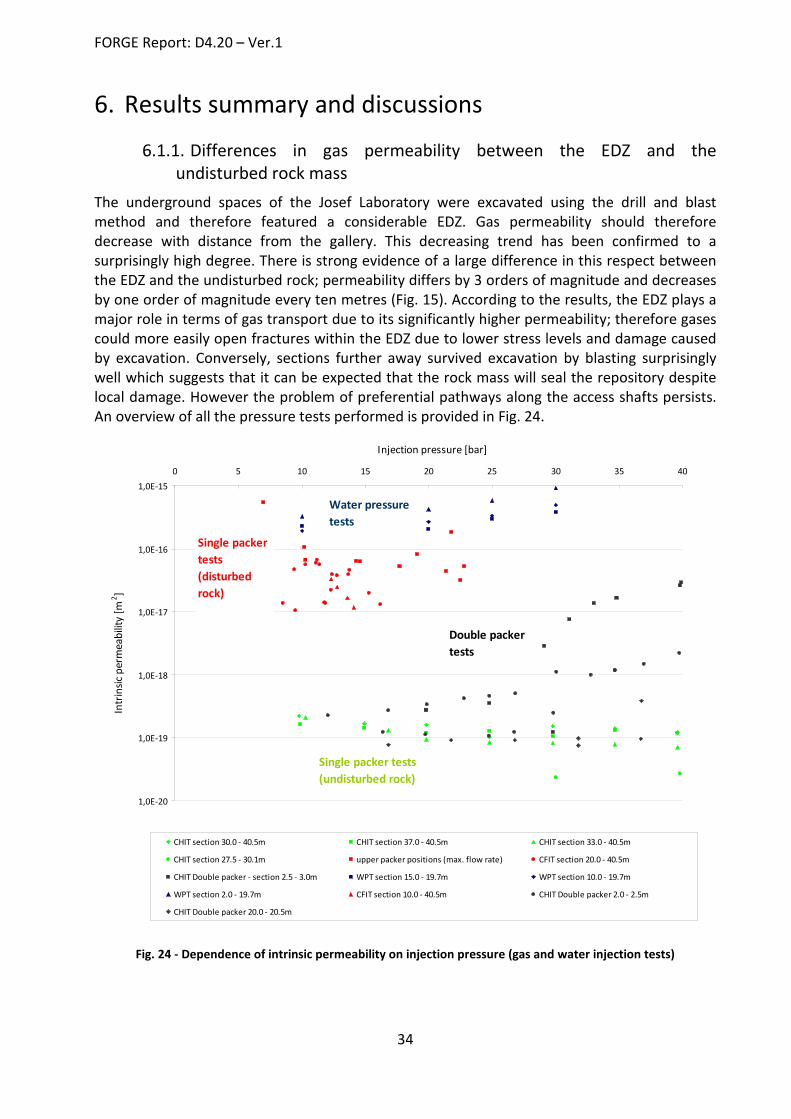
The underground spaces of the Josef Laboratory were excavated using the drill and blast method and therefore featured a considerable EDZ. Gas permeability should therefore decrease with distance from the gallery. This decreasing trend has been confirmed to a surprisingly high degree. There is strong evidence of a large difference in this respect between the EDZ and the undisturbed rock; permeability differs by 3 orders of magnitude and decreases by one order of magnitude every ten metres (Fig. 15). According to the results, the EDZ plays a major role in terms of gas transport due to its significantly higher permeability; therefore gases could more easily open fractures within the EDZ due to lower stress levels and damage caused by excavation. Conversely, sections further away survived excavation by blasting surprisingly well which suggests that it can be expected that the rock mass will seal the repository despite local damage. However the problem of preferential pathways along the access shafts persists. An overview of all the pressure tests performed is provided in Fig. 24.
Fig. 24 - Dependence of intrinsic permeability on injection pressure (gas and water injection tests)
FORGE Report: D4.20 – Ver.1
35
6.1.2. Pathway dilation Discontinuity systems in crystalline rock often differ in terms of origin. Joints can be caused by natural processes or can be artificially created as a result of the excavation method employed during the construction of underground facilities. When gas is injected at pressures exceeding the primary stress level it is likely to lead to the opening of existing fractures or the creation of new ones which will cause a local increase in rock permeability. Therefore it can be expected that higher injection pressure levels will lead to the opening of preferential pathways for the escape of gas which will, in turn, lead to an increase in gas permeability.
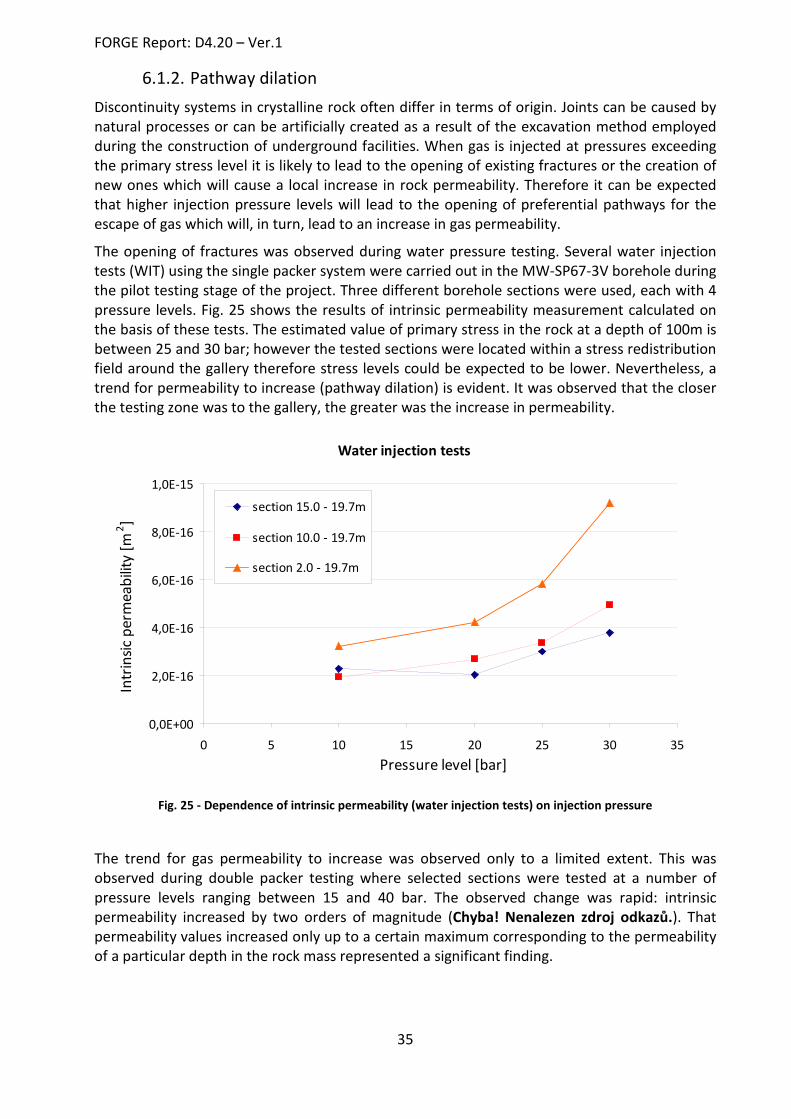
The opening of fractures was observed during water pressure testing. Several water injection tests (WIT) using the single packer system were carried out in the MW-SP67-3V borehole during the pilot testing stage of the project. Three different borehole sections were used, each with 4 pressure levels. Fig. 25 shows the results of intrinsic permeability measurement calculated on the basis of these tests. The estimated value of primary stress in the rock at a depth of 100m is between 25 and 30 bar; however the tested sections were located within a stress redistribution field around the gallery therefore stress levels could be expected to be lower. Nevertheless, a trend for permeability to increase (pathway dilation) is evident. It was observed that the closer the testing zone was to the gallery, the greater was the increase in permeability.
Water injection tests
0,0E+00
2,0E-16
4,0E-16
6,0E-16
8,0E-16
1,0E-15
0 5 10 15 20 25 30 35Pressure level [bar]
Intr
insic
per
mea
bilit
y [m
2 ]
section 15.0 - 19.7m
section 10.0 - 19.7m
section 2.0 - 19.7m
Fig. 25 - Dependence of intrinsic permeability (water injection tests) on injection pressure
The trend for gas permeability to increase was observed only to a limited extent. This was observed during double packer testing where selected sections were tested at a number of pressure levels ranging between 15 and 40 bar. The observed change was rapid: intrinsic permeability increased by two orders of magnitude (Chyba! Nenalezen zdroj odkazů.). That permeability values increased only up to a certain maximum corresponding to the permeability of a particular depth in the rock mass represented a significant finding.
FORGE Report: D4.20 – Ver.1
36
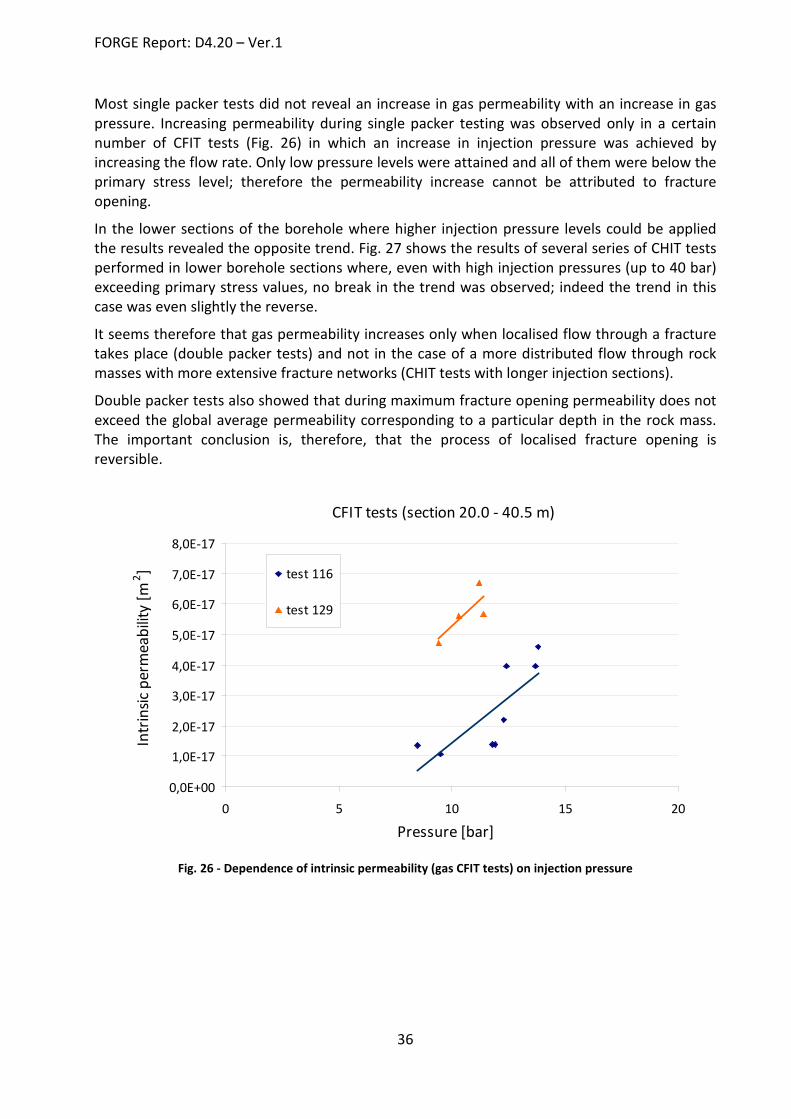
Most single packer tests did not reveal an increase in gas permeability with an increase in gas pressure. Increasing permeability during single packer testing was observed only in a certain number of CFIT tests (Fig. 26) in which an increase in injection pressure was achieved by increasing the flow rate. Only low pressure levels were attained and all of them were below the primary stress level; therefore the permeability increase cannot be attributed to fracture opening.
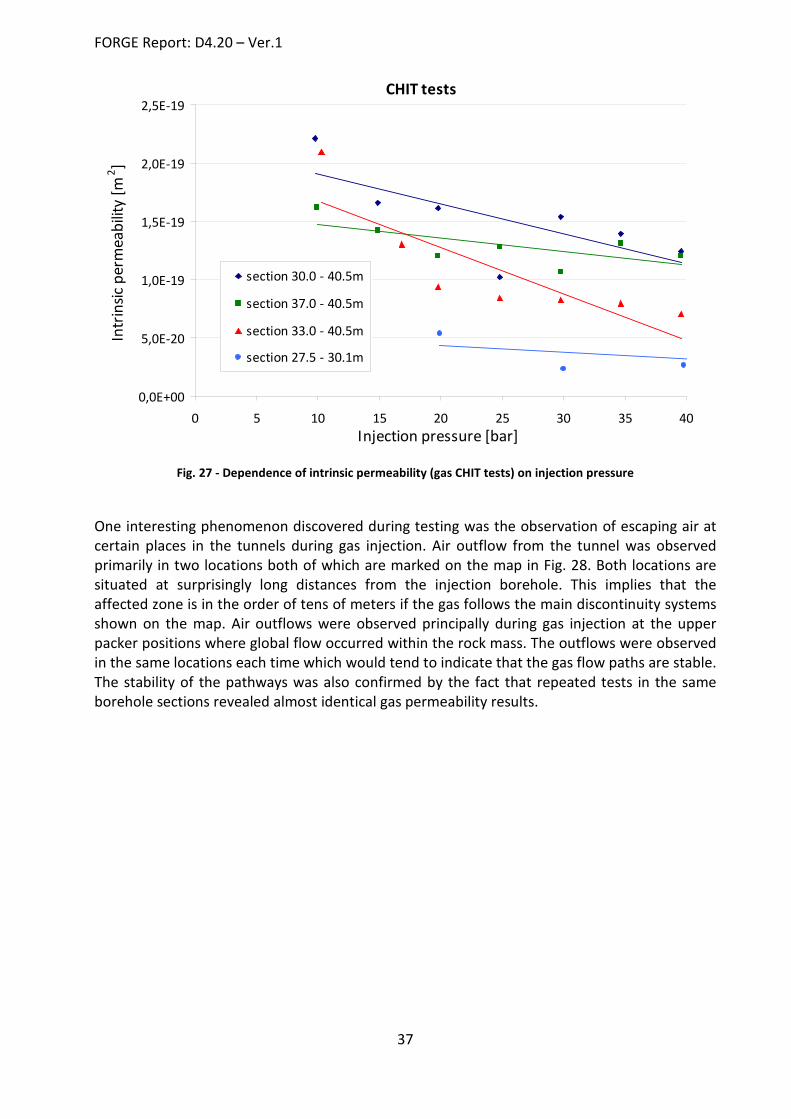
In the lower sections of the borehole where higher injection pressure levels could be applied the results revealed the opposite trend. Fig. 27 shows the results of several series of CHIT tests performed in lower borehole sections where, even with high injection pressures (up to 40 bar) exceeding primary stress values, no break in the trend was observed; indeed the trend in this case was even slightly the reverse.
It seems therefore that gas permeability increases only when localised flow through a fracture takes place (double packer tests) and not in the case of a more distributed flow through rock masses with more extensive fracture networks (CHIT tests with longer injection sections).
Double packer tests also showed that during maximum fracture opening permeability does not exceed the global average permeability corresponding to a particular depth in the rock mass. The important conclusion is, therefore, that the process of localised fracture opening is reversible.
CFIT tests (section 20.0 - 40.5 m)
0,0E+00
1,0E-17
2,0E-17
3,0E-17
4,0E-17
5,0E-17
6,0E-17
7,0E-17
8,0E-17
0 5 10 15 20
Pressure [bar]
Intr
insic
per
mea
bilit
y [m
2 ] test 116
test 129
Fig. 26 - Dependence of intrinsic permeability (gas CFIT tests) on injection pressure
FORGE Report: D4.20 – Ver.1
37
CHIT tests
0,0E+00
5,0E-20
1,0E-19
1,5E-19
2,0E-19
2,5E-19
0 5 10 15 20 25 30 35 40Injection pressure [bar]
Intr
insic
per
mea
bilit
y [m
2 ]
section 30.0 - 40.5m
section 37.0 - 40.5m
section 33.0 - 40.5m
section 27.5 - 30.1m
Fig. 27 - Dependence of intrinsic permeability (gas CHIT tests) on injection pressure
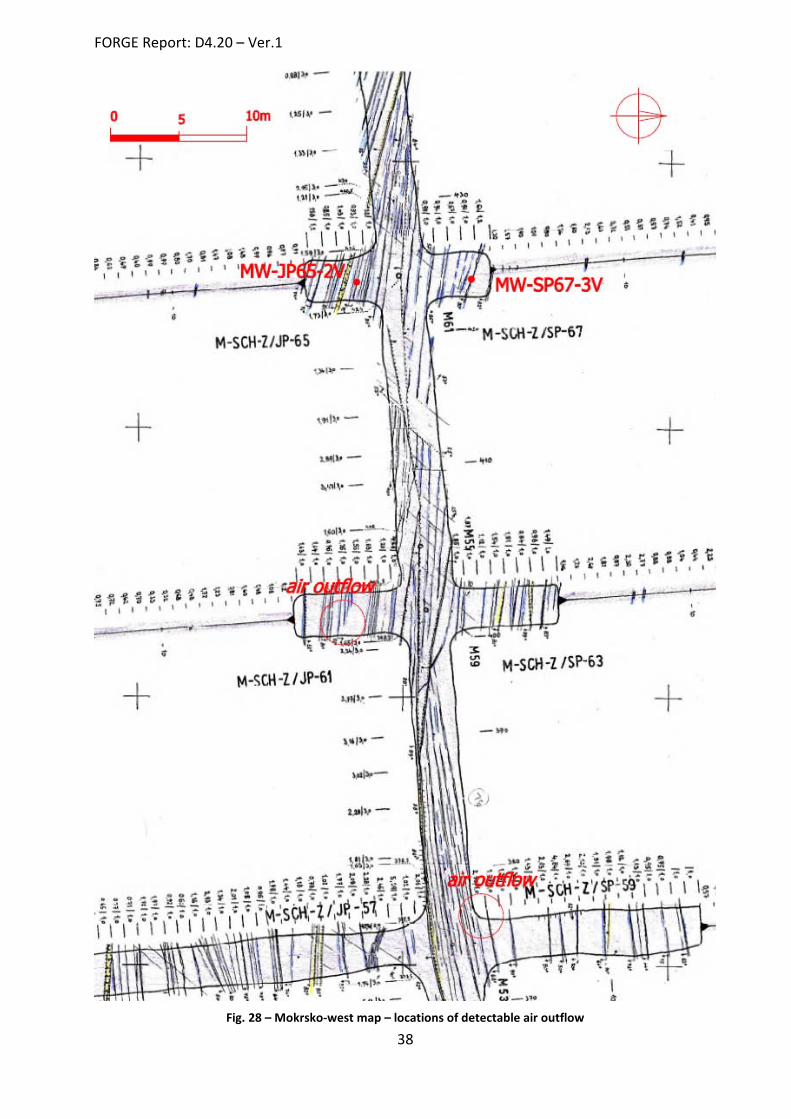
One interesting phenomenon discovered during testing was the observation of escaping air at certain places in the tunnels during gas injection. Air outflow from the tunnel was observed primarily in two locations both of which are marked on the map in Fig. 28. Both locations are situated at surprisingly long distances from the injection borehole. This implies that the affected zone is in the order of tens of meters if the gas follows the main discontinuity systems shown on the map. Air outflows were observed principally during gas injection at the upper packer positions where global flow occurred within the rock mass. The outflows were observed in the same locations each time which would tend to indicate that the gas flow paths are stable. The stability of the pathways was also confirmed by the fact that repeated tests in the same borehole sections revealed almost identical gas permeability results.
FORGE Report: D4.20 – Ver.1
38
Fig. 28 – Mokrsko-west map – locations of detectable air outflow
FORGE Report: D4.20 – Ver.1
39
7. Conclusions The project studied the difference between the gas permeability of disturbed and undisturbed crystalline rock. A decrease in gas permeability with distance from the gallery was confirmed based on measurements taken in the vertical borehole. Strong evidence was detected of a difference in this respect between the disturbed (EDZ) and undisturbed rock formations. An extensive EDZ was identified in the vicinity of the drifts which affected the gas permeability of the rock mass even up to distances of 20 metres. This EDZ was subsequently used for the study of gas transport.
EDZs in fractured crystalline rock had not previously been properly examined in terms of gas flow. A major contribution to the research existed in the fact that it was possible to examine gas flow in the EDZ in detail due to its large extent at the tested location. The results also contributed to a greater understanding of how gas flow within the EDZ works. A difference in gas permeability between the EDZ and the undisturbed rock environment of 3 orders of magnitude is very significant. It was always assumed that gas created in a repository would follow the EDZ. But following the conclusion of the project, it is now possible to say to what extent this will occur. The research allows the quantification of migration behaviour and provides a significant set of data for the future calibration of gas flow mathematical models of disturbed granitic rock environments.
The tests, which clearly demonstrate the greater level of permeability of the EDZ compared with the intact rock, highlight the importance of interfaces in crystalline host rock disposal concepts. This effect might well lead to significant problems in the repository in that the EDZ, working as a “collector” within the undisturbed (“impermeable”) host rock, could allow a concentration of gases in certain locations (the equivalent of a stratigraphic trap). Effective sealing around the access shafts/tunnels is crucial therefore so as to prevent the EDZ working as a conduit to the surface.
An investigation of the effect of pressure on gas permeability was also preformed one of the most important findings of which was that the process of opening and closing of fractures (pathway dilation) does not always behave according to general theory. The opening up of fractures observed during water pressure testing accompanied by an increase in permeability was observed only to a limited extent during gas injection testing.
An increase in permeability was observed in the single packer tests with various flow rates in long injection zones extending into the EDZ (upper packer positions) where, however, low pressure levels only were attained; all were below the primary stress level. Therefore such an increase in permeability could not be attributed to “classic” fracture opening. In the more distant undamaged sections of the rock mass even exceeding the primary stress level did not lead to an increase in gas permeability. Wherever gas flow takes place over an extended area in the rock mass the pathway dilation phenomenon is not evident. An increase in gas permeability was detected during double packer testing in short injection zones. The trend exhibited a turning point once it exceeded a certain level of pressure which could be explained by fracture opening. The results also proved that maximum permeability, during maximum pathway opening, corresponds to average permeability at a particular depth in the rock mass; this was determined from the single packer tests. These results suggest that fracture opening takes place only after localised gas injection. Repeated testing at various flow/pressure levels proved that the process is reversible.
FORGE Report: D4.20 – Ver.1
40
Repeated testing in the same testing zones revealed almost identical results and air outflow in different parts of the tunnel were observed repeatedly in the same locations. The tests performed therefore provided strong and significant evidence concerning the stability of flow paths and the reversibility of the processes involved.
Fractured crystalline rock masses are very complex systems which display correspondingly complicated behaviour. The tests showed the importance of long-term testing which was confirmed particularly following testing in long injection zones where distributed gas flow into extensive fracture networks occurred. The relative stabilisation of air flow conditions in this case occurred only after a minimum of one week following injection.
It is hoped that the results of this research will contribute to present knowledge of gas flow in disturbed granitic rock environments. Moreover, a very extensive benchmark database for mathematical modelling was obtained as a result of the research. The data covers a significant number of regimes and ranges which will help to further improve and validate mathematical models of gas flow in disturbed rock environments. This, in turn, will help to further reduce the level of uncertainty relating to the quantitative treatment of gases in terms of performance assessment.
FORGE Report: D4.20 – Ver.1
41
8. References SVOBODA, J, and SMUTEK, J. 2010. Field Installation and Rock Characterisation, FORGE Report D4.9. 35pp.
SVOBODA, J, and SMUTEK, J. 2011. Baseline Hydraulic Measurements (crystalline rocks), FORGE Report D4.14. 72pp.
FORGE Report: D4.20 – Ver.1
42
Appendix 1 Field test results Tab. 9 - Field single packer tests results - borehole MW-SP67-3V
Test number
Injection zone [m]
Injection rate (Q) [Nl/min]
Injection pressure (P) [bar]
Intrinsic permeability (k)
[m2]
Gas conductivity (K) [m/s]
F84 17.5 - 19.7 35.5 21.8 1.9E-16 1.3E-10
F78 15.0 - 19.7 25.4 19.1 8.1E-17 5.6E-11
F79 12.5 - 19.7 36.1 22.8 5.3E-17 3.7E-11
F77 10.0 - 19.7 35.6 21.4 4.4E-17 3.1E-11
F80 7.5 - 19.7 35.8 22.5 3.2E-17 2.2E-11
F81 5.0 - 19.7 35.8 14.6 6.3E-17 4.4E-11
F82 5.0 - 19.7 35.2 14.3 6.4E-17 4.5E-11
F83 2.0 - 19.7 35.3 10.2 1.1E-16 7.4E-11
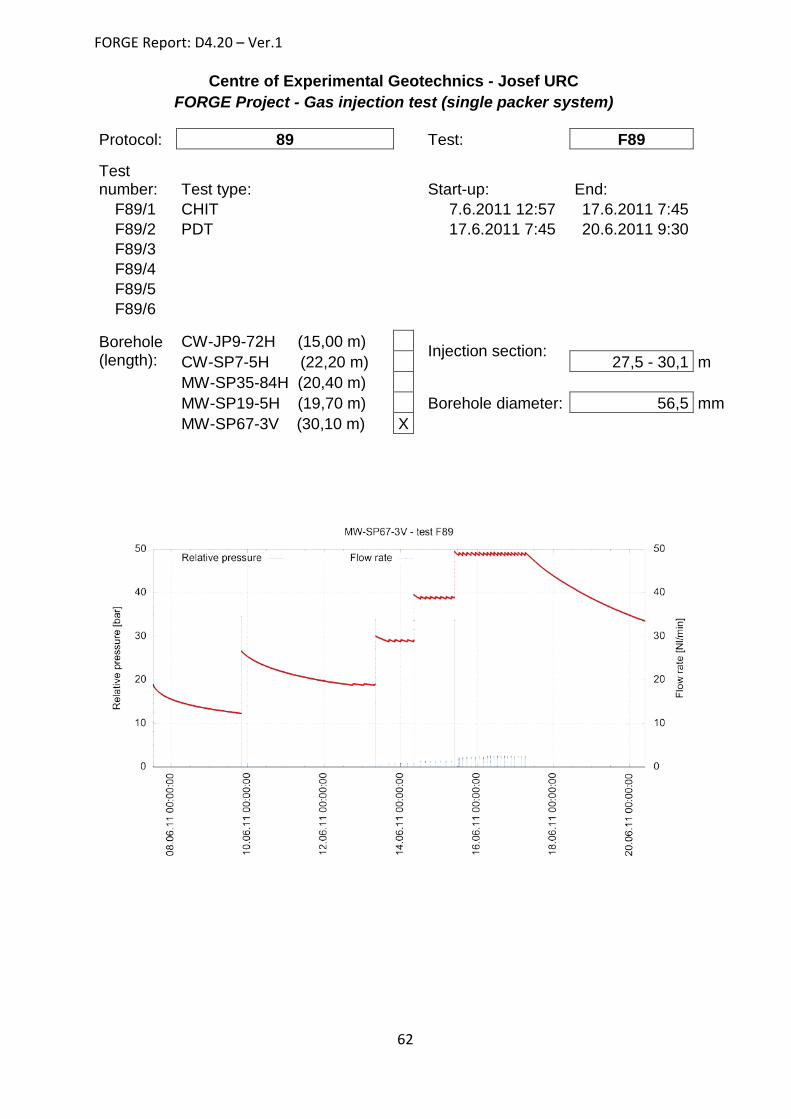
F89 27.5 - 30.1 * * 3.5E-20 2.4E-14
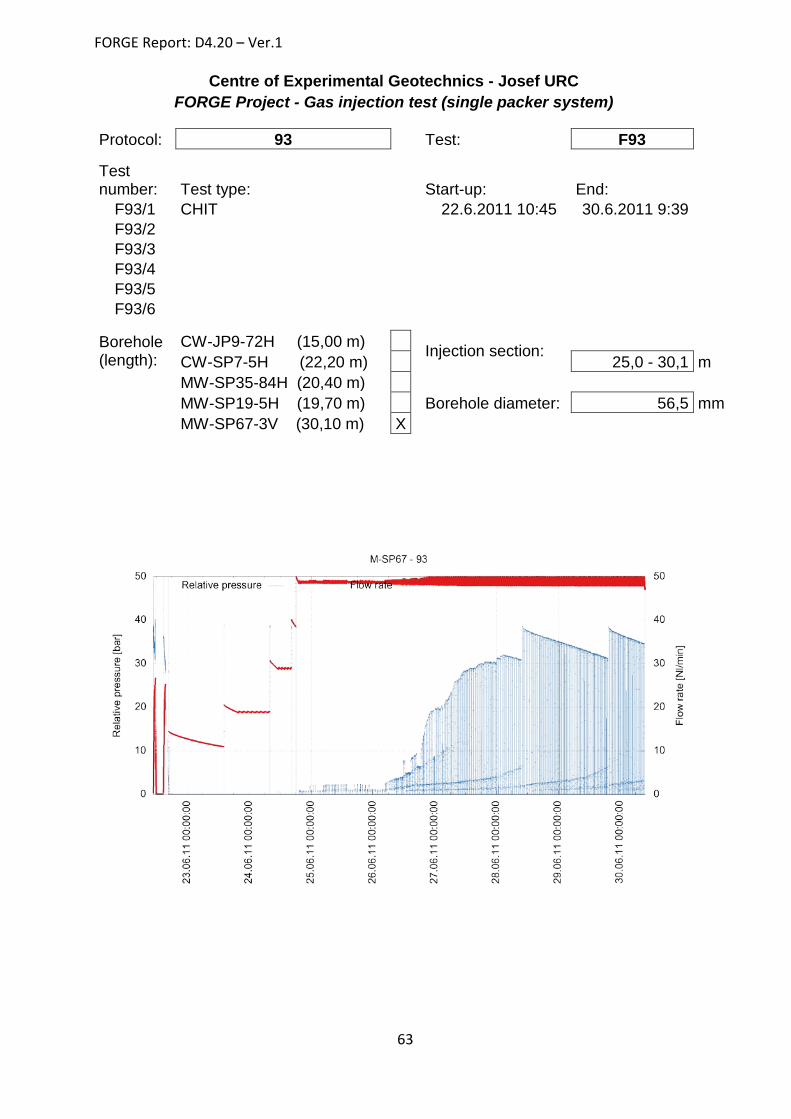
F93 25.0 - 30.1 * * 5.6E-19 3.8E-13
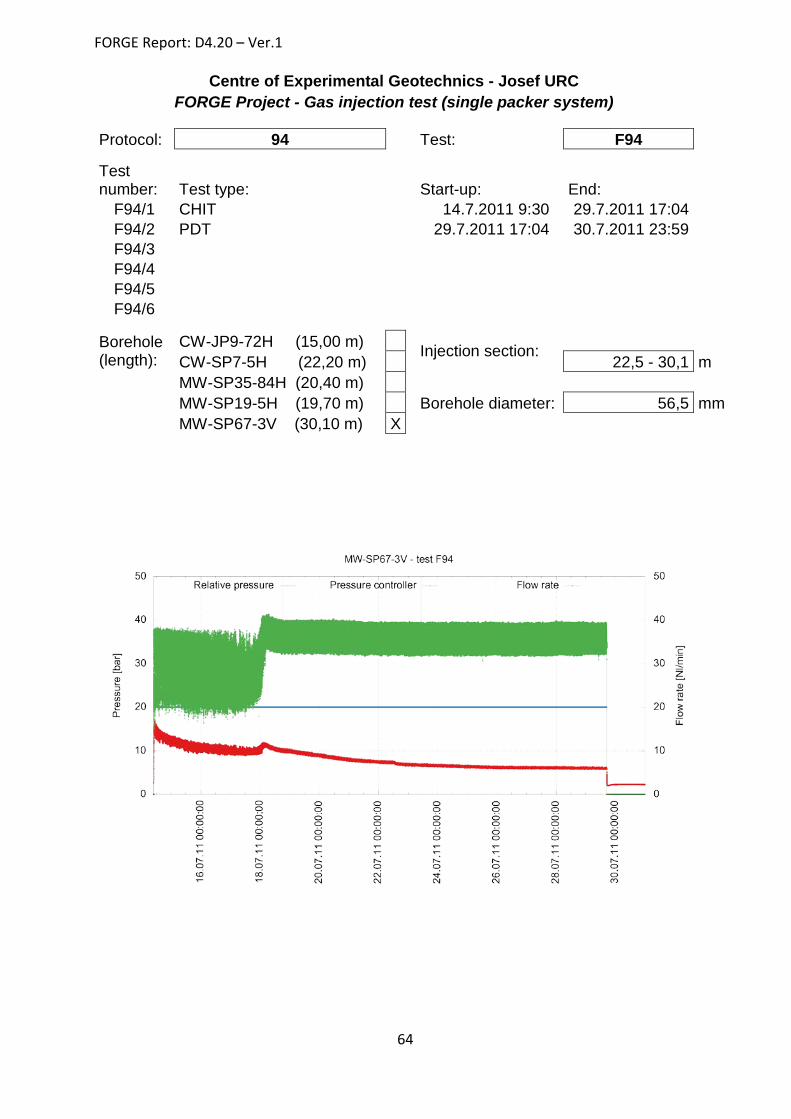
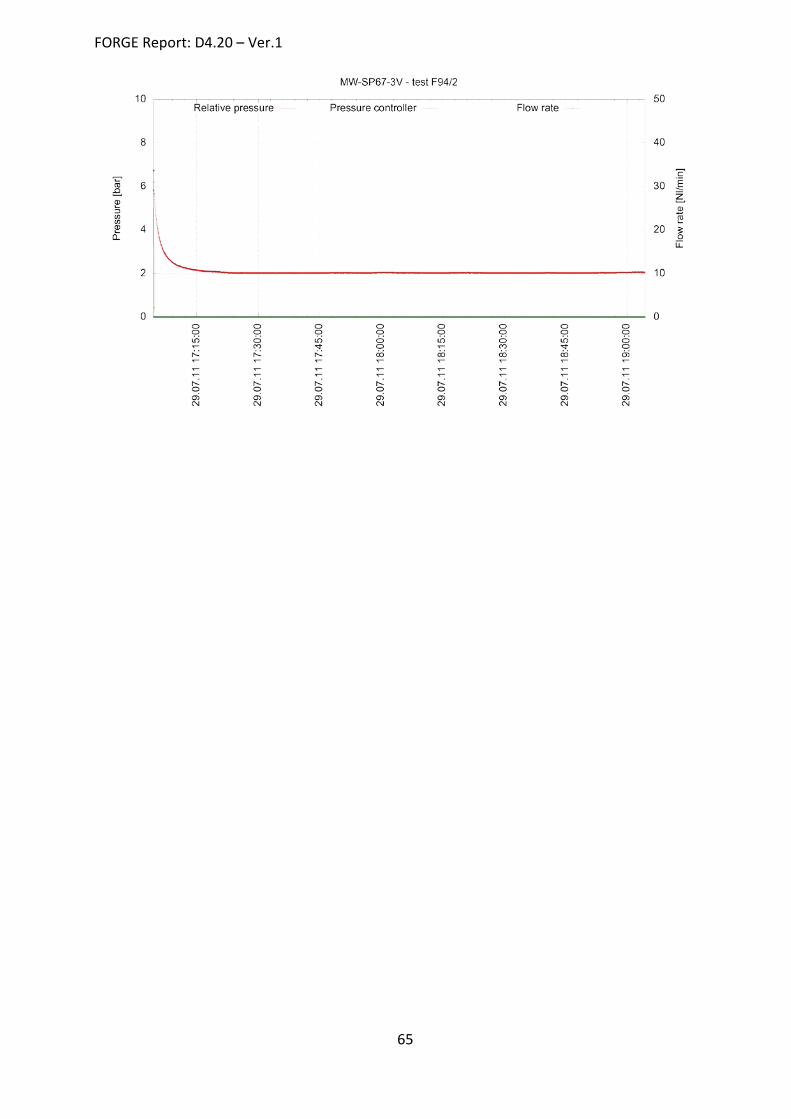
F94 22.5 - 30.1 35.9 7.0 5.4E-16 3.7E-10
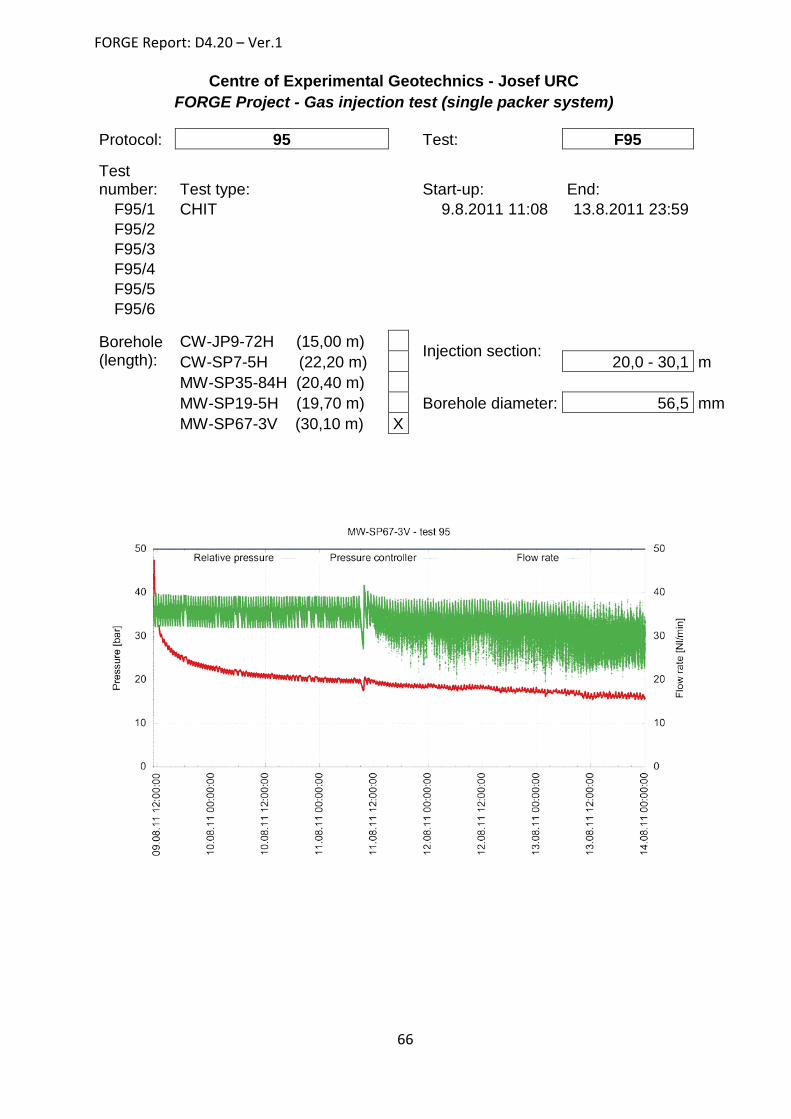
F95 20.0 - 30.1 30.0 17.7 5.2E-17 3.6E-11
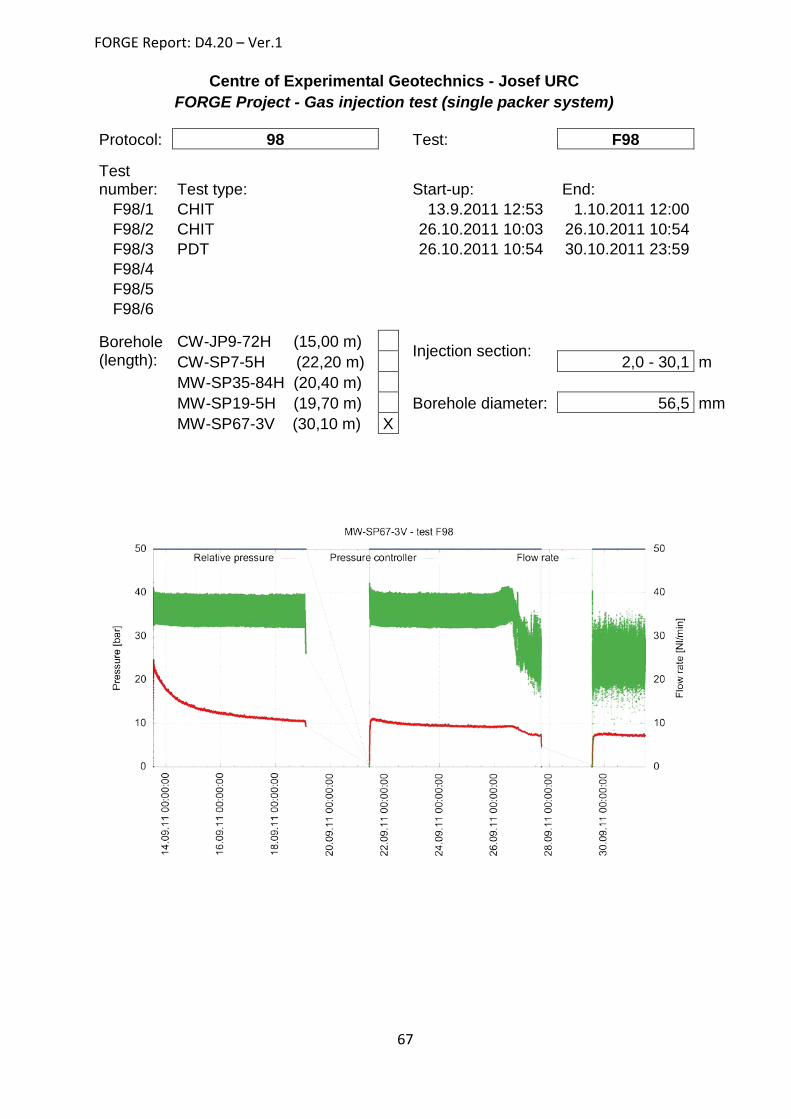
F98 2.0 - 30.1 35.8 10.3 6.6E-17 4.6E-11
F112 37.0 - 40.5 * * 1.3E-19 8.9E-14
F115 33.0 - 40.5 * * 1.1E-19 7.3E-14
F110 30.0 - 40.5 * * 1.5E-19 1.0E-13
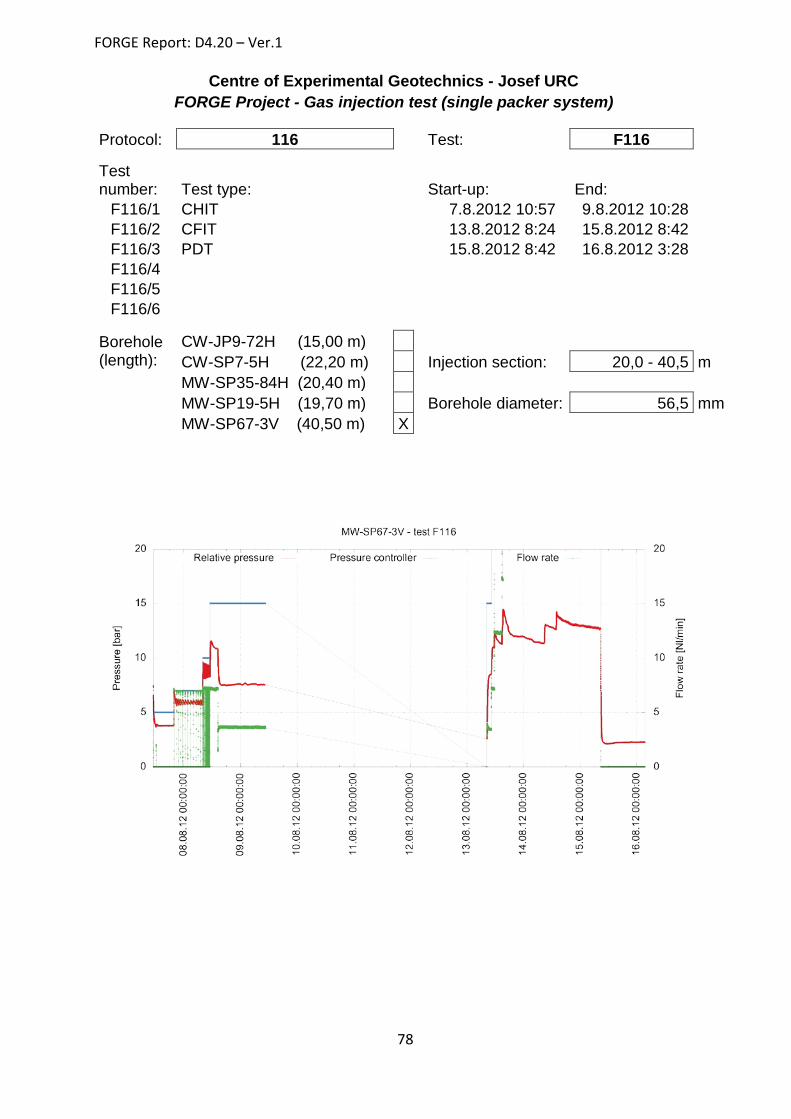
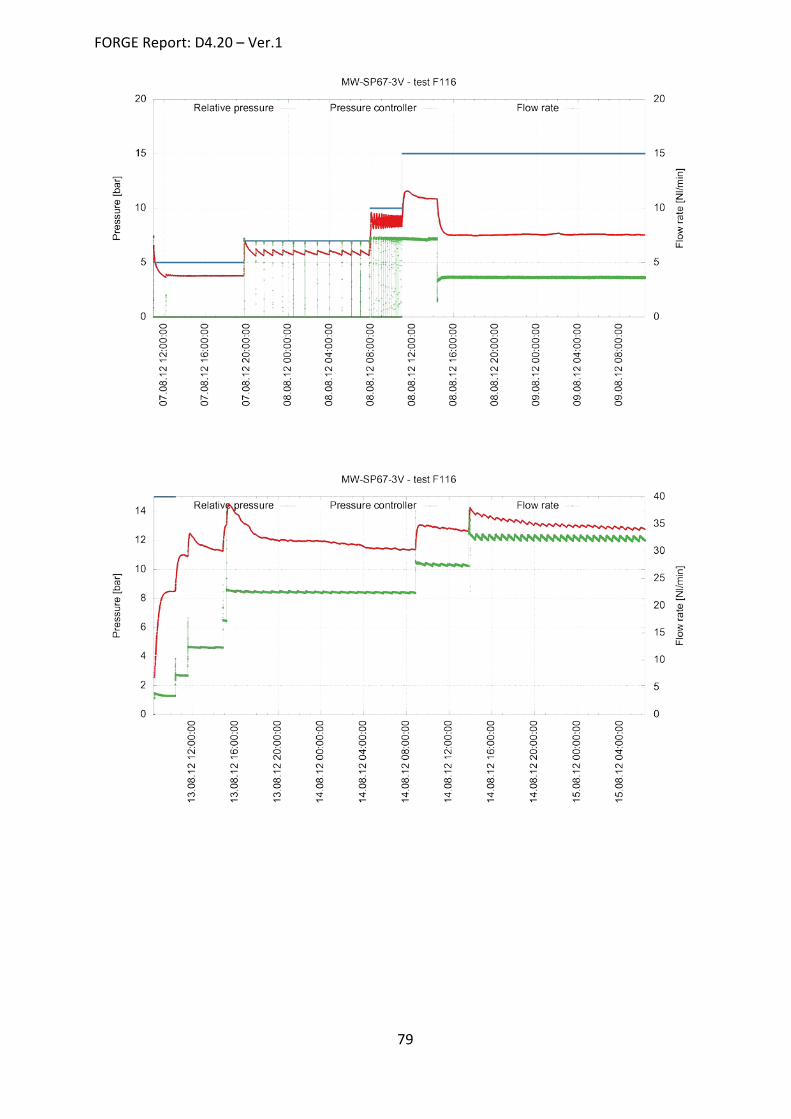
F116 20.0 - 40.5 * * 2.5E-17 1.7E-11
F113 2.0 - 40.5 14.9 9.8 2.2E-17 1.5E-11
* Tests with more pressure levels/flow rates (details in Tab. 2)
Tab. 10 - Field single packer tests results - borehole MW-SP67-3V (CHIT and CFIT tests)