LAPPEENRANTA UNIVERSITY OF TECHNOLOGY Faculty of Technology Management Department of Industrial Management POKA-YOKE FOR MASS CUSTOMIZATION The subject of this Master of Science Thesis was approved by the Council of the Faculty of Technology Management on 25th of February 2008 Supervisor: Prof. Janne Huiskonen Instructor: Matti Pilviö, M.Sc.(Eng.) Helsinki, May 9, 2008 Jussi Tapani Sissonen Rantakartanontie 5 C 99 00910 Helsinki
Transcript
LAPPEENRANTA UNIVERSITY OF TECHNOLOGY Faculty of Technology Management
Department of Industrial Management
POKA-YOKE FOR MASS CUSTOMIZATION
The subject of this Master of Science Thesis was approved by the Council of the
Faculty of Technology Management on 25th of February 2008
Supervisor: Prof. Janne Huiskonen
Instructor: Matti Pilviö, M.Sc.(Eng.)
Helsinki, May 9, 2008 Jussi Tapani Sissonen Rantakartanontie 5 C 99 00910 Helsinki
ABSTRACT
Author: Jussi Tapani Sissonen
Subject of the thesis: Poka-yoke for mass customization Department: Department of Industrial Management
Date: 2008 Location: Helsinki
Master of Science Thesis. Lappeenranta University of Technology.
107 pages, 37 figures, 3 tables and 2 appendices
Supervisor: Professor Janne Huiskonen
Instructor: M.Sc.(Eng.) Matti Pilviö Keywords: poka-yoke, mistake-proofing, quality improvement, mass
customization
Producing high quality products and services is one of the key concerns in order to
keep up with the competition in the global markets. Companies are putting a great
effort on preventing customers having faulty products and services by any means.
However, the total elimination of mistakes in manufacturing processes has always
been a great challenge for quality management.
In this thesis the applicability of poka-yoke methodology in reducing the number
of quality failures in the case company has been studied. Poka-yoke stands for the
mistake-proofing and is mainly developed for the purpose of eliminating human
errors in manufacturing processes. Inspection techniques; judgment, informative
and source inspection are in the core of this methodology.
Mass customization and large configurability of products leads to situation where
the root causes of quality problems may vary a lot. To study the effects of these
factors extensive analysis of quality failures was conducted. Recommendations
and proposals for further actions regarding problem solving processes and
utilization of mistake-proofing methods were provided on the basis of the analysis.
TIIVISTELMÄ Tekijä: Jussi Tapani Sissonen
Työn nimi: Poka-yoke massaräätälöinnissä
Osasto: Tuotantotalouden osasto
Vuosi: 2008 Paikka: Helsinki
Diplomityö. Lappeenrannan teknillinen yliopisto.
107 sivua, 37 kuvaa, 3 taulukkoa ja 2 liitettä
Tarkastaja: Professori Janne Huiskonen
Ohjaaja: DI Matti Pilviö
Hakusanat: poka-yoke, virheenestimet, laadun parantaminen, massaräätälöinti Korkealaatuisten tuotteiden ja palveluiden tuottaminen on yksi tärkeimmistä
edellytyksistä pysyä mukana kilpailussa globaaleilla markkinoilla. Yritykset
tekevät jatkuvia panostuksia varmistaakseen keinoilla millä hyvänsä, että
vialliset tuotteet ja palvelut eivät päätyisi loppuasiakkaalle asti. Tästä huolimatta,
virheiden eliminointi valmistusprosesseissa on ollut ainainen haaste
laatujohtamiselle.
Tässä diplomityössä tutkittiin poka-yoke metodologian soveltuvuutta
laatuvirheiden vähentämiseen kohdeyrityksessä. Poka-yoke tarkoittaa virheiden
ehkäisemistä ja se on alun perin kehitetty inhimillisten virheiden
eliminoimiseksi. Menetelmän ydin on tarkastustekniikoissa, joita ovat toteava ja
tiedottava tarkastus sekä lähdetarkastus.
Massaräätälöinnistä ja tuotteiden laajasta konfiguroitavuudesta johtuen juurisyyt
laatuongelmiin liittyen voivat vaihdella paljon. Näiden selvittämiseksi
toteutettiin kattava laatuvirheanalyysi. Analyysin perusteella annettiin
toimenpidesuosituksia ja ehdotuksia ongelmanratkaisuprosessien kehittämiseksi
sekä laitetehtaalla tapahtuvien vihreiden eliminoimiseksi kohdeyrityksessä.
ACKNOWLEDGEMENTS
This research project and the writing of Master's thesis has been a culmination for
my studies in Lappeenranta University of Technology. Many challenges have
been faced during this project but at the same time it has been very interesting and
rewarding.
Now that I am finishing this thesis, I would like to give my warmest thanks to the
various people in the case company who have contributed to this work during
these months. Without your valuable and professional comments and criticism
and outright support this wouldn't have been possible.
Specially, I would like to express my gratitude to my supervisor, Professor Janne
Huiskonen, for his constructive comments and guidance, and to my instructor
M.Sc. Matti Pilviö, for his ideas and support throughout the research project.
Finally, many thanks to my family and all my friends for their endless support and
energy they have given me during my studies.
v
TABLE OF CONTENTS
ABSTRACT.................................................................................................................................... II
TIIVISTELMÄ ............................................................................................................................ III
1.1 BACKGROUND AND MOTIVATION ............................................................................................ 1 1.2 RESEARCH PROBLEM AND OBJECTIVES.................................................................................... 2 1.3 STRUCTURE OF THIS THESIS..................................................................................................... 4
PART I: LITERATURE STUDY.................................................................................................. 5
2 THE PRINCIPLES OF POKA-YOKE METHODOLOGY .................................................... 5
2.1 HISTORY AND DEFINITIONS OF POKA-YOKE............................................................................. 5 2.2 ERRORS AND DEFECTS IN MISTAKE-PROOFING ........................................................................ 7
2.2.1 Human error classification............................................................................................. 8 2.2.2 Classifying mistakes ....................................................................................................... 9
2.3 INSPECTION TECHNIQUES IN THE FIELD OF QUALITY CONTROL .............................................. 10 2.3.1 Judgment inspection ..................................................................................................... 13 2.3.2 Informative inspection .................................................................................................. 13 2.3.3 Source inspection ......................................................................................................... 16 2.3.4 Summary of inspection methods ................................................................................... 17
2.4 TYPES OF POKA-YOKE SYSTEMS ............................................................................................ 19 2.5 DESIGN PRINCIPLES FOR POKA-YOKES................................................................................... 21
2.5.1 Characteristics ............................................................................................................. 22 2.5.2 Process deviations and value differences ..................................................................... 22
2.6 ZERO QUALITY CONTROL ..................................................................................................... 23 2.7 COMPANY-WIDE MISTAKE-PROOFING.................................................................................... 24 2.8 POKA-YOKE IMPLEMENTATION PROCESS............................................................................... 24 2.9 OBJECTIVES OF POKA-YOKE IMPLEMENTATION ..................................................................... 27
3 PROBLEM SOLVING AND ROOT CAUSE ANALYSIS .................................................... 28
3.1 PHILOSOPHICAL APPROACHES FOR PROBLEM SOLVING.......................................................... 28
vi
3.2 FRAMEWORKS FOR PROBLEM SOLVING PROCESSES: PDCA, DMAIC AND TOYOTA’S CYCLE31 3.3 ROOT CAUSE ANALYSIS ......................................................................................................... 35
4 MISTAKE-PROOFING IN TERMS OF QUALITY COST THINKING............................ 40
4.1 QUALITY COST SYSTEM ......................................................................................................... 40 4.1.1 Optimum models for quality cost thinking.................................................................... 42 4.1.2 Iceberg model ............................................................................................................... 43
4.3 QUALITY COSTS AND MISTAKE-PROOFING............................................................................. 47
5 CONCLUSIONS OF THE LITERATURE STUDY............................................................... 50
PART II: EMPIRICAL RESEARCH AND ANALYSIS .......................................................... 53
6 ANALYSIS OF QUALITY FAILURES IN DELIVERY PROCESS ................................... 53
6.1 CASE COMPANY DESCRIPTION ............................................................................................... 54 6.1.1 Delivery process ........................................................................................................... 54 6.1.2 Mass customization in the case company ..................................................................... 57
6.2 ANALYSIS OF QUALITY FAILURES IN DELIVERY PROCESS ...................................................... 58 6.2.1 Pareto analysis of quality defects by category ............................................................. 59 6.2.2 Pareto analysis of quality defects by products ............................................................. 62 6.2.3 Manufacturing team comparison.................................................................................. 64 6.2.4 Pareto analysis of internal inspection process ............................................................. 66 6.2.5 Origin of fault in manufacturing process ..................................................................... 67
6.3 SUMMARY OF QUALITY FAILURE ANALYSIS .......................................................................... 69
7 CASE STUDY: ROOT CAUSE ANALYSES OF TWO QUALITY FAILURE CASES .... 70
7.1 CASE 1: MISSING OR WRONG PARTS ...................................................................................... 70 7.2 CASE 2: CERTIFICATE OR SERIAL NUMBER PROBLEM ............................................................ 73
8 UTILIZATION OF MISTAKE-PROOFING METHODS: ANALYSIS AND
8.1 DEFINING THE EVALUATION AND DEVELOPMENT MATRIX..................................................... 77 8.1.1 Current state and corrective actions ............................................................................ 80 8.1.2 Current state and preventive actions............................................................................ 82 8.1.3 Ideal state and corrective actions................................................................................. 84 8.1.4 Ideal state and preventive actions ................................................................................ 85
vii
8.2 RECOMMENDATIONS FOR MAIN QUALITY FAILURE TYPES ..................................................... 86 8.2.1 Poka-yokes in missing part category............................................................................ 87 8.2.2 Poka-yokes in certificate and serial number problem category ................................... 88
8.3 SUPPORTIVE SYSTEMS FOR MISTAKE-PROOFING .................................................................... 89 8.3.1 Quality reporting systems in delivery process.............................................................. 89 8.3.2 Quality of data and information ................................................................................... 91
8.4 MISTAKE-PROOFING IN THE ORGANIZATION.......................................................................... 94 8.4.1. Mistake-proofing in Research and Development unit ................................................. 95 8.4.2 Product lifecycle management (PLM).......................................................................... 96 8.4.3 Product line .................................................................................................................. 96 8.4.4 Testing and calibration process ................................................................................... 97 8.4.5 Manufacturing and quality department ........................................................................ 97
8.5 CHALLENGES IN POKA-YOKE IMPLEMENTATION IN THE CASE COMPANY ............................... 98
An American mistake-proofing expert, John Grout, has experience on a few
situations where mistake-proofing efforts have not worked well. According to his
article "Mistake-proofing production" (1997), these situations can be found from
the area of very high-speed production, destructive tests and where the use of
control charts is very effective. When the production process has output rates that
are very rapid, inspections must be nearly instantaneous to be effective. Even, if
the inspection process slows down production slightly, the cost over the long run
may be substantial. Concerning destructive testing the use of 100 % inspection
has no sense at all. In this case, use of statistical sampling and inference is
27
required. Also effective use of control charts replaces the need for self-checks
when products have well-defined specifications and they use accurate
measurement system.
2.9 Objectives of poka-yoke implementation
Implementing poka-yoke methods have both short and long-term objectives.
Thus, the benefits can be direct and indirect. Usually the most obvious benefits
are seen in the assembly floor. According to Hinckley (2001) the amount of scrap
material will be reduced and also rework and repair costs will be cut. Manivannan
(2006) summarizes four types of long-term objectives for implementing poka-
yokes:
• Competitive advantage: Cost of quality is an important part of company’s
competitive advantage in the global markets; it costs far less to prevent
defects occurring in the first place
• Knowledgeable workers: Understanding the principles of mistake-
proofing helps to participate defect elimination
• Predictability: Poka-yoke devices and methods assures defect-free
products and services and thus reduce the need for traditional inspection
and rework operations
• Reduced variation: Mistake-proofing devices ensure that all sub-
assemblies and completed assemblies are exactly the same. There will be
little chance of part-to-part variation (standardization)
Mistake-proofing efforts also enhance safety issues because more attention is paid
on working environment and execution of operations (Superior Controls, 2007).
What is also important and useful for the whole company is that people in all
levels and across all functions begin to think in a preventive mode rather than an
"after-the-fact detection" regarding process errors.
28
3 PROBLEM SOLVING AND ROOT CAUSE ANALYSIS
Beneath every problem there is a cause for the problem. In order to solve a
problem one must identify the cause of the problem and take steps to eliminate the
cause. If the root cause of the problem is not identified, then one is merely
addressing the symptoms and the problem will continue to exist. (Doggett, 2005)
This chapter introduces a short literature review of the principles of problem
solving methods and root cause analysis tools. The main objective is to present
some methods for correcting problems and emphasize why identifying and
eliminating the root causes of the problems is of utmost importance. At first, in
section 3.1, an introduction of two different philosophical approaches in the
background of the problem solving processes is provided.
3.1 Philosophical approaches for problem solving
"The problem solving methodology is a skill that runs deep and strong at all levels
of the organization across all functions" - states Liker & Meier (2006) when
describing how problem solving is seen in Toyota; one of the world class pioneers
in quality. According to Liker et al. (2006) the term "problem solving" may be a
misnomer, since the process usually goes well beyond the basics of problem
solving. It requires thorough evaluation and reflection, careful consideration of
various options, and a carefully considered course of action, all leading toward
measurable and sustainable goals.
Very often, after a problem has occurred, main effort is put only on correcting that
particular existing problem rather than focusing on finding preventive and long-
term solutions. As a traditional approach for correcting problems (see figure 9)
illustrates, basic principle of this method is to avoid stopping the production to the
last and correct problems “off line”.
29
Figure 9. Traditional method of correcting problems (Liker et al., 2006). In many companies this kind of attitude towards correcting problems is very
common. Any problems that arise can be corrected later and according to this
approach quality is controlled by additional inspection and containment. And even
if people may have good ideas to solve the problem they are said that it is not your
job to worry about it. This erroneous thinking creates an attitude among the
workforce that identifying problems and possible solutions is not important.
Toyota’s core philosophy is based on eliminating waste. Figure 10 presents an
outlook of Toyota method of stopping to fix problems. Compared to traditional
method of correcting problems this method totally differs from many aspects.
30
Figure 10. Toyota method of stopping to fix problems (Liker et al., 2006). Whereas traditional method aims to keep run rates and line outputs high, even at
the expense of quality, one of Toyota’s main principles is to get right quality from
the first part produced. This is reached by the extensive support system which
provides tools and resources to identify and solve the problems. The effect of the
Toyota method is to motivate workers to identify and solve problems which in the
long run build a strong base for continuous learning and improvements. (Liker &
Meier, 2006)
The role of problem solving has also an effect on organizational learning. Some
literature studies have shown that the success of improvement efforts depends on
how problems are addressed. This approach leads us to the concept of single and
double loop learning. Loop learning concept makes a distinction between fixing
31
problems (first order solutions) and diagnosing and altering underlying causes to
prevent recurrence (second order solutions). First-order problem solving allows
work to continue but does nothing to prevent similar problems from occurring.
Second order problem solving, in contrast, investigates and seeks to change
underlying causes. (Tucker et al., 2001)
3.2 Frameworks for problem solving processes: PDCA, DMAIC
and Toyota’s cycle
Problem solving process is a simple process which provides certain steps needed
to be followed in a way from “problem-faced”-state to “problem solved”-state.
Literature presents several models and frameworks for problem solving used
largely in quality control efforts. In this section, a short introduction of three
problem solving methods, PDCA-cycle, DMAIC and Toyota’s cycle, is provided.
PDCA
PDCA-cycle stands for the words Plan-Do-Check-Act. PDCA was made popular
by Dr. W. Edwards Deming who is also known as a father of modern quality
control by many. The PDCA cycle is a serie of activities pursued for
improvement. It begins with a study of current situation, during which data are
gathered to be used in formulating a plan for improvement. Once plan has been
finalized, it is implemented. After that, the implementation is checked to see
whether it has brought about anticipated improvement. If so, a final action is to
standardize it and ensure that the new methods are practiced on a large scale.
(Imai, 1986)
32
Figure 11. Plan-Do-Check-Act cycle.
DMAIC
DMAIC is a widely used problem solving method inspired and originated from
PDCA. DMAIC stands for the words Define, Measure, Analyze, Improve and
Control (see figure 12). It is a problem solving method developed originally as a
tool for Six Sigma methodology. Six Sigma is a set of practices, developed by
Motorola to systematically improve processes by eliminating defects. The core of
the Six Sigma methodology is a data-driven, systematic approach for problem
solving, with a focus on customer impact. Statistical tools and analysis are often
useful in the process. (Pande & Holopp, 2002)
The strength of DMAIC method is based on Six Sigma teams, which consist of
people from different positions, for example from different job levels, skills and
seniority (Six Sigma Belts). Thus, the problem will be handled with expertise but
also many different aspects will be taken into consideration. (Pande & Holopp,
2002)
33
Figure 12. DMAIC problem solving cycle (IIL, 2007).
In defining stage, the problem is identified, goals are stated and also possible
constraints and assumptions are set up. Measure is a logical follow-up to define
and it is a bridge for a next step: analysis. The measure stage has two main
objectives; firstly, to gather data to validate and to quantify the
problem/opportunity and secondly, begin teasing out facts and numbers that offer
clues about the causes of the problem. In the analysis stage the understanding of
the process and problem is enhanced and resulting finally in the identification of
the root causes. Then it is time to implement the solution and finally control the
cause & effect metrics if goals set in the first place are achieved. (Pande &
Holopp, 2002)
Toyota’s problem resolution cycle
Toyota has developed its own method for problem solving (see figure 13). The
aim of this method is to build a culture that stops to fix a problem. This approach
has its roots in Toyota Production System (TPS) ideology (principles presented in
Jeffrey K. Liker´s book: The Toyota Way: 14 Management Principles from the
World´s Greatest Manufacturer), and specially in its first principle, which advises
to base your management decisions on a long-term philosophy, even at the
expense of short-term financial goals. Even though Toyota’s problem resolution
cycle aims at long-term solutions this entire cycle is repeated many times
34
throughout the day in Toyota plants. This describes not only method’s simplicity
but also its effectiveness. (Liker et al., 2006)
ContainPrevention(Short term)
Prevention(Long Term)
Control(Protect the customer)
Recognition
Elevate
Evaluate
Elevate to higherlevel if necessary
Find the source to prevent further occurence
Has the problem"escaped" to the
customer?
Operator is responsible fordetecting abnormalities
Long-term, permanent solutions from operator
or team
Figure 13. Toyota problem-resolution cycle (Liker & Meier, 2006).
In Toyota’s problem resolution cycle there are a few steps which might be
unusual for many. In this model "elevating" stands for signaling the need for
assistance e.g. when operator is not able to solve the problem by him/herself. In
Toyota, support people are always designated beforehand and thus assistance is
quickly available. At the control stage the main task is to ensure that the problem
will not go any further and especially do not reach the customer. In containment
stage the source of a problem is identified and controlled. (Liker & Meier, 2006)
After the problem has been controlled and contained and production has returned,
the focus shifts to prevention. In some cases preventive measures are short term in
nature, meaning they are temporary measures until more effective and permanent
(long-term) measures can be implemented. Usually long-term solutions are
generated by a team, where all participants are responsible for the development of
effective countermeasures. (Liker & Meier, 2006)
35
Similar processes for problem solving as presented above can be found a wide
variety from the literature. Some of them emphasize the importance of testing and
evaluating solutions before making them permanent, others focus on involving
those who know the problem best in solving it, while some point out the
importance of seeing the problem solving as part of a larger improvement effort.
(Andersen & Fagerhaug, 2000) From a company point of view a strict following
of some problem solving method is not the point, but combining and finding a
practical and effective model which serves the company’s specific needs best.
3.3 Root cause analysis Root cause analysis is a collective term used to describe a wide range of
approaches, tools and techniques used to uncover causes to problems. Some of the
approaches are more geared toward identifying the true root causes than others:
some are more general problem solving techniques while others simply offer
support for the core activity of a root cause analysis. Therefore there is not a
streamlined process of a fixed number of steps for a root cause analysis.
(Andersen & Fagerhaug, 2000)
36
ROOT CAUSESROOT CAUSES
VISIBLE PROBLEMVISIBLE PROBLEM SYMPTOMSSYMPTOMSAS A RESULT OFTHE PROBLEM
First level causes
Higher level causes
AN
ALY
SIS
LE
AD
S T
O
Problem understanding
Possible causegeneration and consensus reaching
Problem and causedata collection
Possible causeanalysis
Cause-and-effect analysis
Steps in root cause analysis
Figure 14. Symptoms versus root causes and possible steps in root cause
analysis (Adopted from Liker & Meier, 2006 and Andersen & Fagerhaug,
2000).
A problem is the result of multiple causes at different levels. This means that
some causes affect other causes which, in turn, create the visible problem.
According to Andersen et al. (2000) causes can be classified as following (see
also figure 14):
• Symptoms: these are not regarded as actual causes, but rather as signs of
existing problems.
• First level causes: causes that directly lead to a problem.
• Higher level causes: causes that lead to the first level causes. While they
do not directly cause the problem, higher level causes form links in the
chain of cause-and-effect relationship that ultimately create the problem
• Root cause: the highest level at the bottom which sets in motion the cause-
and-effect chain that creates problems.
37
Conducting a root cause analysis may have many objectives. As presented in table
3, Andersen et al. (2000) points out that different root cause analysis tools can be
grouped according to their purpose. In each group there is a great variety of tools
available. Depending on the situation, steps can be applied sequentially or others
can be applied on many points in the analysis.
It is usually difficult to know which tool should be used when, and how the tools
relate to one another in an overall root cause analysis. The main objective,
however, is to find the root causes of the problem and eliminate them. The tools
used are aids that help to reach this goal (Andersen et al., 2000). In table 3 there
are presented some general and widely applied tools, categorized according to
presented steps in overall root cause analysis.
38
Table 3. Tool summary for root cause analysis (Andersen & Fagerhaug, 2000).
Stage/Tool Purpose Problem understanding Flowchart Understand the flow of activities in a process Critical incident Understand what are the most troublesome
symptoms Spider Chart Compare performance with external references Performance matrix Priritize problems or symptoms to attack Possible cause generation and consensus reaching
Brainstorming Generate as many ideas as possible Brainwriting Generate as many ideas as possible Nominal group technique Prioritize ideas Paired comparisons Prioritize ideas Problem and cause data collection
Sampling Gain a representative sample from a large population
Surveys Collect data from respondents Check sheet Register data in a systematic fashion Possible cause analysis Histogram Portray data graphically Pareto chart Find the few elements causing most effects Scatter chart Find relationships between two variables Relations diagram Find relationships among many elements Affinity diagram Find relationships otherwise not easily seen Cause-and-effect analysis Cause-and-effect chart (with 4Ms)
Generate and group problem consensus
Matrix diagram Analyze causal relationships Five whys Identify chains of cause-and-effect
According to Bringslimark (2006) documenting "operator error" as a root cause is
an action which occurs very often. This conclusion to a problem is usually
achieved by little or none of deeper inspection of root causes. Bringslimark
(2006) states also that the label "operator error" sends a blatant message that
training has not been effective and that operations are not under control.
Therefore, companies must recognize that identifying operator error as a root
cause strongly suggests that things are not right, and that the real root cause needs
to be more thoroughly analyzed and effectively addressed by the organization to
39
demonstrate that the training and corrective/preventive action systems are
performing as planned.
Table 3 presents only a short list of available tools. However, in order to achieve
satisfactory results, the most critical issue is selecting the right tool for the right
application. It helps not only to ensure that the desired results are achieved, but it
also ensures wrong decisions don’t cause time to be wasted on the wrong
solutions (Okes, 2002).
According to Andersen et al. (2000) and Okes (2002) there are some
recommendations that need to be taken into consideration concerning analysis
tools. Firstly, you must not to become a slave to one or more tools and secondly
you must remember that a tool is not the solution in search of a problem to solve.
Also concerning the use of quality tools, one challenge is to learn whether a
particular tool fits for the degree of quality maturity of the organization. The level
of maturity describes the company’s attitude and understanding of quality issues.
Thus, depending on the level of maturity the tools used in quality issues varies a
bit; in a low maturity level very basic tools are used whereas in a high level of
maturity more emphasis is paid on quality management tools and the quality is
monitored very closely.
40
4 MISTAKE-PROOFING IN TERMS OF QUALITY COST
THINKING
Scrap and rework are common terms in many manufacturing companies.
Nevertheless, it is quite difficult for many to address what the true costs of quality
are. This chapter introduces main principles of quality cost thinking, different
components of quality costs and a comparison of two theoretical models of
defining the optimum of quality costs. In addition, the effects of mistake-proofing
efforts have in accumulating quality related costs are examined. Any emphasis on
how to measure these costs and what kind of reporting system it requires won’t be
taken.
4.1 Quality cost system
Quality costs are the measures of the costs specifically associated with the
achievement or non-achievement of product or service quality. More specifically,
quality costs are the total of the cost incurred by
a) investing in the prevention of non-conformances to requirements
b) appraising a product or service for conformance to requirements
c) failing to meet requirements
According to American Society of Quality (ASQ) definition, quality costs
represent the difference between the actual cost of a product or service and what
the reduced cost would be if there were no possibility of substandard service,
failure of products, or defects in their manufacture.
Why understanding the elements of quality costs and regular monitoring is useful
for a company? Campanella (1999) presents in the book "Principles of quality
costs" that the goal of any quality cost system is to facilitate quality improvement
41
efforts that will lead to operating cost reduction opportunities, in other words,
producing high quality products with lower costs.
Philip B. Crosby (1979) states in his book "Quality is Free" that the cost of quality
has two main components: the cost of good quality (the cost of conformance) and
the cost of poor quality (the cost of non-conformance) As presented in figure 15,
these two forms of quality can be divided even further:
Figure 15. Components of quality costs (Buthmann, 2007).
The costs of poor quality consist of both internal and external failure costs, which
results from failing to meet the requirements. The costs of good quality consist of
appraisal and prevention costs. Appraisal costs are associated with measuring,
evaluating or auditing products or services to assure conformance to quality
standards and performance requirements. Prevention costs are the costs of all
activities specifically designed to prevent poor quality in products or services.
42
Prevention
Component
Subsystem/assembly
Final inspection
Litigation loss
Field failure
Field repair
Failurecost (€)
Process
Good quality
Poor quality
Figure 16. Failure cost as a function of detection point in a process (Campanella, 1999).
The difference between the elements of a good and poor quality can be presented
from the failure cost point of view (see figure 16). Normal distinction between the
good and poor quality is made on the point when a product or service is delivered
to a customer. Due this, all efforts done to avoid the customer having a defective
product is referred as a good quality. Many companies are normally satisfied with
the situation where customers do not receive defective products, no matter what
the costs of good quality will be. The aim of figure 16 is still to point out that is
not the most admirable state and by taking a closer look to the elements of good
quality shows that there is still a remarkable chance to reduce quality costs. The
earlier a defect is detected in the process, the cheaper it will be to correct it.
(Campanella, 1999)
4.1.1 Optimum models for quality cost thinking
The most argued issue of quality costs is propably concerning the models of
optimum of quality costs. There are two different theoretical models available
43
which both tries to find the optimum between the costs and the quality. In the
classic model of optimum quality costs, illustrated in figure 17, achieving 100 %
defect free products is not reasonable because appraisal and prevention costs are
assumed to increase exponentially when approaching 100 % quality level. Thus,
the optimum is found somewhere below the 100% quality level.
Figure 17. Traditional vs. new model of optimum quality costs (Campanella, 1999).
In a few last decades the new model of optimum quality costs has gained ground.
The new model suggests that approaching 100 % quality level does not
necessarily increase the total quality costs. This model has two arguments. Firstly,
does it really take infinite investments (for appraisal and prevention) to reach zero
defects (Schneidermann, 1986) and secondly, according Pyzdek and Keller
(2003), the loss of sales could so remarkable under 100 % quality level. With
these arguments the model suggests that total quality costs have its minimum at
the 100 % quality level.
4.1.2 Iceberg model
Many of the elements of quality costs are hidden and thus difficult to identify by
formal measurement systems. The iceberg model, presented in figure 18, is very
often used to illustrate this matter. Only a minority of the costs of poor and good
quality is obvious and they appear above the surface of the water. According to
44
the survey of identifying the cost of quality conducted by VTT (1999) in Finland
many companies estimating their level of cost of quality listed only most concrete
"here and now" costs as true costs of quality and not even tried to estimate the
hidden costs. Referring to the iceberg model this survey shows that there is a huge
potential for reducing costs under the water. This basically means that, by
identifying and improving the area of hidden costs it is possible to reduce the
costs of doing business significantly.
Figure 18. The iceberg model of cost of quality (Buthmann, 2007).
4.2 Components of quality costs
As mentioned earlier, costs of quality can be separated to conformity and non-
conformity costs. Conformity costs are usually considered as necessary costs of
quality consisting of primarily quality assurance and prevention costs. Non-
conformity costs consist of fault costs and inspection costs which are held
unwanted and can be avoidable. Most of the quality costs cumulate from non-
conformity costs because the later the defect is detected the more expensive it is to
correct it. The following figure illustrates this approach to quality based costs.
45
Figure 19. Necessary and avoidable costs of quality (Pfeifer, 2002).
The "1-10-100 Rule" describes well the accumulation of quality related costs,
even though this "rule" has no specific research background. This widely used
rule of thumb suggests that a quality problem costing 100€ to resolve in the field
would cost only 10€ to correct if discovered during in-house processes and only
1€ to prevent in the first place.
4.2.1 Prevention costs
Prevention costs are the costs of all activities specifically designed to prevent poor
quality in products or services (Campanella, 1999). Examples includes the costs
for quality planning, supplier evaluation, new product review, mistake-proofing,
process capability evaluations, quality improvement team meetings, quality
improvement projects and naturally also quality education and training.
(Buthmann, 2007)
46
4.2.2 Appraisal costs
Appraisal costs consist of measuring, evaluating or auditing products or services
to assure conformance to quality standards and performance requirements
(Campanella, 1999). Costs occur mainly because of the need to control products
and services to ensure high quality level in all stages (Buthmann, 2007). Appraisal
costs include:
• checking and testing purchased good and services
• in-process and final inspections and tests
• field testing
• product, process and service audits
• calibration of measuring and test equipment
4.2.3 Internal failure costs
Internal failure costs are costs that are caused by products or services not
conforming to requirements or customers/users needs and are found before
delivery of products and services to external customers. These non-conformities
would otherwise have led to the customer not being satisfied. Deficiencies are
caused both by errors in products and inefficiencies in processes. Typical forms of
internal failure costs are
• scrap
• rework
• reinspection
• retesting
• material review
• downgrading
• delays and shortages
(Campanella,1999)
47
4.2.4 External failure costs
Concerning traditional quality cost systems, external failure costs are the most
obvious and thus easiest to measure and monitor. External failure costs occur after
delivery or shipment of the product, or during or after furnishing of the service, to
the customer. Examples include the costs for:
• complaints
• product recalls/ repairing goods and redoing services
• warranty claims
• customers' bad will
• losses due to sales reductions
External failure costs are the most expensive ones to correct and thus prevention
of mistakes beforehand is much more preferable than correcting afterwards.
(Campanella, 1999)
4.3 Quality costs and mistake-proofing
Mistake-proofing is a method which systematically aims at decreasing the
possibility of making mistakes in manufacturing processes and thus prevents
producing faulty products and services. As defect levels drop, failure costs
naturally decline while appraisal and prevention costs may increase
(Schneiderman, 1986). This approach was very dominant even few decades ago
and striving for zero defect -state was not seen acceptable in the belief that
reaching 100 % quality level would require enormous increase of appraisal and
prevention costs. Nowadays, however, the situation is somehow opposite; all
failure costs are considered to be some sort of waste which causes expenditures
and need thus to be avoided. More and more attention is paid on the importance of
appraisal and preventive actions which are considered necessary forms of good
quality.
48
Mistake-proofing efforts can be considered to be very favorable in terms of
quality costing. Referring to figure 16 about failure costs as a function of
detection point in a process, the basic principle behind mistake-proofing is to
detect an occurred mistake as on early stage as possible. In every action the basic
approach is preventive rather than corrective. This conclusion can be drawn up
when contrasting Shingo's inspection methods to this context; by source
inspection the circumstances behind correct execution are checked and possibility
for making a mistake is erased or by informative inspection the flow of defected
products is halted immediately. In both cases the amount of rework and scrapping
costs are minimized.
When combining Crosby's (1979) two main quality cost components and the
accumulation of failure costs according to the detection point in a process (figure
16) the effects of continuous mistake-proofing efforts to the accumulation of total
costs of quality can be presented as follows:
Figure 20. The effects of the continuous mistake-proofing efforts on total costs of quality.
49
As figure 20 summarizes, in a theoretical situation where defect rates are high
most of the quality related cost can be considered as form of poor quality costs
such as repairing goods, handling of customer complaints and warranty claims.
Only minor actions are taken to develop processes and quality control systems
towards preventive mode. However, with systematic mistake-proofing utilization
total costs of quality can be cut. Firstly, due the number of defected products
achieving customers decrease remarkably, it follows that the costs of poor quality
decreases too. Even the costs of good quality may increase considerably due to
investments on preventive methods of mistake proofing, the overall cost level still
remains at much lower level compared to initial state.
50
5 CONCLUSIONS OF THE LITERATURE STUDY
Every company operating in the global markets must be able to produce high
quality products and services that fulfil customers’ requirements in order to keep
up with the competition. In addition, “making of quality” needs to be executed as
cost-efficiency as possible.
Traditional Western approach for “making of quality” has been to eliminate the
possibility of customer receiving a faulty product or service, no matter what the
costs would be. When the percentage of external customers receiving faulty
products has increased, as a corrective action more inspections for finished
products have been arranged. Of course, this approach will increase the number of
defected products detected in-house and thus non-conforming products reaching
the customer is eliminated. However, if the causes of the problems are not solved
or any corrective actions made to processes, processes continue to produce
defective products at the same level as before.
In this study so far, a detailed overview of the principles of poka-yoke
methodology has been introduced. This concept aims at systematic improvement
of the processes and eliminating the mistakes from occurring with very simply
methods. In the heart of this methodology are the three levels of inspection
(presented thoroughly in section 2.3):
• Judgment inspection (for only detecting mistakes)
• Informative inspection (immediate feedback of detected mistake)
• Source inspection (eliminates mistakes at their source)
As Edward Deming has once stated “quality comes not from the inspection, but
from the improvement of the process”; poka-yoke also stands for this statement.
Especially informative inspection and source inspection are forms of inspections
which informs which part of the process needs to be corrected and do not allow
processes to continue before correcting. Poka-yokes are also in the great
51
importance in the “lean”-concept of the Japanese quality management. Through
source inspection is it possible to produce high quality products from the first part
on and thus avoiding producing waste in form of any kind of scrap and rework.
With informative inspection producing waste can be minimized due the faulty unit
can be detected almost immediate and allowing it to continue to next process is
halted.
If I reflect the advices of this methodology to my experiences I found the
approach of inspection methods very useful. Firstly, it gives a totally new insight
of how mistakes in in-house processes can or could be detected and what are
remarkable benefits achieved through the utilization of this methodology.
Secondly, the implementation of poka-yokes is not tied on any strict procedure
rather than they are very simple and inexpensive methods which any of us can
develop.
To obtain remarkable results in quality improvement it requires effective and
systematic use of problem solving methods. The main theses of chapter 3 is to
point out that problem solving methods should be executed in all levels of the
organization and the main emphasis should be paid on generating long-term
solutions. Lots of theoretical models for problem solving are provided in the
literature, however, every company should try to identify the tools and models
most suitable for their purposes.
Customer complaints, recalls of faulty products, scrap and rework all the forms of
unwanted costs associated with quality costs. The aim of quality cost thinking is
to assist in recognizing the elements of quality costs, especially hidden ones, and
to highlight the importance of good quality costs, such as prevention and appraisal
costs. In a classic model of optimum quality costs (see figure 16) the optimum
was found somewhere below the 100 % quality level due to assumption that
appraisal and prevention costs would increase exponentially when reaching the
100 % level.
52
However, in a new model the optimum is at the 100 % quality level, due to 100 %
quality inspection can be executed cost-effectively with the help of different
methods, such as poka-yoke inspection methods.
53
PART II: EMPIRICAL RESEARCH AND ANALYSIS
This is the empirical part of the thesis. Chapter 6 introduces the results of different
quality analyses conducted in the case company. In chapter 7 the analysis is taken
even further with a detailed examination of two typical case examples. With the
results of these, a framework for systematic utilization of poka-yoke efforts will
be defined and modified to meet the needs of the case company. Proposals and
recommendations to quality improvement efforts are provided in the chapter 8.
The conducted quality analyses are very basic measurements, but still very novel
in the case company. Due to insufficient level of relevant quality data available,
lots of emphasis is also paid on improving and developing quality reporting
systems during the study.
6 ANALYSIS OF QUALITY FAILURES IN DELIVERY
PROCESS
This chapter provides an extensive analysis of quality failures in case company's
delivery process. The content of this chapter is two-fold: at first, a general
description of the existing characteristics of delivery process and production
environment is presented to provide an overall view of the context. The latter part
concentrates on different analyses of quality failures. Main focus is to point out
the main problem areas from different aspects and appraise them according to
their type and severity. This helps finding out explanatory factors and consistency
to rationalize data and in the later phase to generate solution models to existing
quality problems.
54
6.1 Case company description
Case company develops, manufactures and markets products and services for
environmental and industrial measurements in the global markets. The major
customer groups are meteorological and hydrological institutes, aviation
organizations, defense forces, road and rail organizations and system integrators.
The core competency can be identified as a superiority of sensor manufacturing
and calibration technology.
Case company consists of three business divisions. Divisions vary from others in
the nature of their businesses. This analysis is carried out in one business division
which provides products for the measurements of humidity, dew point, barometric
pressure, wind, rain, visibility, cloud height and present weather. From now on,
until the end of this thesis; the term "case company" is used to describe the
production factory and related support functions of this specific division in which
the analysis is conducted.
6.1.1 Delivery process
Figure 21 introduces the structure of the case company’s delivery process.
Delivery process can be considered as a logistical process which comprises
activities regarding purchasing, manufacturing and finally delivering finished
products to the customers.
55
Figure 21. Description of case company's delivery process.
As the figure 21 shows, the case company has two factories, a sensor factory and
an equipment factory. This analysis concentrates on quality failures which take
place in the equipment manufacturing, introduced in the figure 22. In order to
have a more thorough understanding of the manufacturing process it can be
divided into three main sections: pre-assembly, testing and calibration and final
assembly. Supplier related actions are in the minor part of this study; however
their importance is remarkable due to the fact that more and more of materials are
acquired from suppliers.
Figure 22. Equipment manufacturing process.
56
Equipment manufacturing is executed in four manufacturing teams, with
approximately 10-15 persons per team. Depending on the team, they manufacture
products for 1 to 3 product lines, which mean that the number of product families
also varies a lot. Manufacturing teams differ from each other mainly in production
volumes. This is due to characteristics and complexity of manufactured products.
Figure 23 summarizes team volumes and their share of total sales.
Production summary by manufacturing teams
0
10000
20000
30000
40000
50000
60000
70000
80000
90000
TEAM1 TEAM2 TEAM3 TEAM4
Production team
Pro
duct
s pr
oduc
ed (p
cs)
0.0 %
5.0 %
10.0 %
15.0 %
20.0 %
25.0 %
30.0 %
35.0 %
Sha
re o
f tot
al s
ales
(%)
PCS
%
Figure 23. Summary of production output rates in 2007.
Depending on the product the number of operators involved in assembly process
varies. Within some products one operator executes only a certain phase of
assembly e.g. testing and calibration or replenishment of buffer stocks and within
some products the same operator takes care of all manufacturing tasks. In many
cases the same operator also receives the work order from the company’s ERP
system and also release finished products for the shipping team. This requires that
operators must be multi-skilled and motivated to avoid errors in complex and
various tasks.
57
In Make-to-Order (MTO) environment manufacturing process starts when a
customer order is received. According to configuration, products are assembled
from usually tested sub-assemblies, modules and components which are produced
to buffer stocks. Depending on the product, manufacturing lead time varies from
few minutes to few days, mainly due to long calibration and testing times but also
due to complexity of products.
6.1.2 Mass customization in the case company
Many companies nowadays are executing a strategy of mass customization - the
low cost production of high variety and individually customized goods and
services. This is due to today’s competitive environment which is changing
dramatically all the time. Customers demand products with lower prices, higher
quality and faster delivery customized to match their unique needs (Zerenler &
Özilhan, 2007). In mass customization economies of scale are gained through the
components rather than the products. In addition, economies of scope are gained
by using the modular components over and over again in different products (Pine,
1993).
The concept of mass customization is widely used in the case company. In
general, mass customization is executed through platforms and configurable
product structures. Same platforms can be used across several product lines and
platform thinking is executed through the use of the same electronic/
electromechanical modules, mechanical parts, component boards and same
software. From the customer aspect, mass customization is visible through
products’ configuration possibility. Depending on the customer's application,
customer can select the needed options among the provided features of products.
Example of configuration structure is presented in figure 24.
58
Figure 24. An example of the configuration structure.
The share of configurable product families of all product families in the case
company is approximately 50-60 % (discussion with case company’s product
lifecycle management manager 2008), while the rest of the products can be
considered as standard products.
6.2 Analysis of quality failures in delivery process
In order to clarify how principles of poka-yoke methodology and problem solving
processes could be effectively utilized in case company, the aim of this analysis is
to provide an extensive overview of quality failures. In this context we consider
“quality failure” as all kind of non-conformance to a product specification or any
deviation to planned and faultless delivery.
As mentioned earlier, analysis concentrates on quality failures which take place in
delivery process and especially in equipment manufacturing; quality non-
conformances of purchased items are not in the scope of this analysis. The main
objective is to provide information about:
• fault types and categories
• fault distribution by products
59
• fault distribution by manufacturing teams
• origins of faults in manufacturing process
Data used to conduct these analyses is gathered from the case company's
HelpDesk-system and from internal inspection reports. HelpDesk-data comprises
all the filtered customer complaint cases between Q1/2007 and Q3/2007
considering delivery process. Data of internal inspection stands for the reports of
100 % final inspection process for selected products. Final inspection process was
started in the spring of 2007 and the number of products taken to final inspection
has gradually increased.
6.2.1 Pareto analysis of quality defects by category
Case company delivers approximately 180 000 products per year (data from 2007
sales). However, when manufacturing mass customized products this means that
the batch size of similar products is very small; most of the product configurations
can be considered as one-of-a-kind.
Quality failures in this context comprise all the quality non-conformances, for
example any deviations of specifications and customer needs, which occur in the
delivery process. In order to have an overall view of quality failures, figure 25
illustrates the distribution of defects according to the defect type (this defect type
categorization has been used in the case company for a long time and the category
for the specific case is defined by the performer of the customer complaint when
receiving the case).
60
HelpDesk Q1/2007 - Q3/2007
0 %
5 %
10 %
15 %
20 %
25 %
30 %
Missing parts
Material quality
issueOther
Certifica
te or seria
l number problem
Delivered not according to
spesifi
ed configuration
Assembly erro
r
Wrong/Inaccurate output
Instruments/S
O's mixe
d up
Order entry
error
Late delivery
% o
f tot
al d
efec
ts
0 %10 %20 %30 %40 %50 %60 %70 %80 %90 %100 %
Figure 25. Customer complaints by fault category.
As this pareto analysis shows there are three major categories which cover almost
60 % of all the customer complaint cases. The biggest category, missing part(s),
comprises almost 30 % of the total. This is not a surprising result because of the
large configurability of products and the large number of items operators have to
handle manually. Typical characteristics regarding this category are that missing
parts are usually additional "parts" that need to be added to sales package
according to the customer's choice. Parts are usually picked and added to sales
package in the final assembly. Different kind of accessories, installation kits and
manuals (wrong language) are most common types of missing parts.
The second largest category among the customer complaints comprises material
quality issues which cover almost 20 % of all cases. Wide range of cases can be
explained by the diversity of manufactured products and their characteristics.
Compared to missing parts category the major difference is in the place where the
mistakes occur. Most of the material quality issue cases occur in the pre- assembly
or a material can be already defective when incoming from the supplier. Typical
defects in the assembly are scratches and dents in mechanical parts, defective
61
solders, cable damages, dirt in clean surfaces and incorrect wirings which
naturally are not according to quality requirements.
The category “other” includes cases which are not in the scope of this thesis; they
are mainly R&D cases which only have little interface to the delivery process and
are thus excluded of this study. However, this also signals that there is a need for
more specific classification of categories to obtain relevant data.
Certificate and serial number problem category was the fourth biggest category of
customer complaints during the study period. Typical cases of complaints can be
summarized as following:
• calibration certificate missing from the sales package
• product’s serial number is different in labels and in certificates
• wrong year codes in serial or in lot number
• duplicated serial numbers to the same customer (when ordered more than
one product)
Most of the cases can be considered to be caused by human errors, simply due to
carelessness or misidentification. Among the customers this usually causes some
confusion even if it has no effects on product’s functionality. However, when a
company markets its products as premium value products, these kinds of errors
might have effect on company’s image and reliability and are thus very
embarrassing ones.
The next three categories, “delivered not according to specified configuration”,
“assembly error” and “wrong / inaccurate output” can be treated as a one big
group. In these categories the product is not assembled as the customer has
wanted. Instruments could have been assembled with wrong modules or incorrect
cables, with wrong bushings or the instrument has wrong software settings. These
kinds of errors can occur due to many causes and they have to be analyzed at a
detailed level case by case. Sometimes it may also happen that the sales order and
instruments mix up and thus wrong instruments end up to wrong customers.
62
6.2.2 Pareto analysis of quality defects by products
As illustrated in figure 26 below, there are only a handful of products which
covers almost half of the all complaint cases. Due to case company’s Helpdesk
maintenance methods, the actual number of defected products is not available.
Thus, one complaint case can refer to one or more defected products. However,
research data can be valued quite relevant for this purpose, while the average
number of shipped products per sales order is low.
HelpDesk Q1/2007 - Q2/2008
0 %
2 %
4 %
6 %
8 %
10 %
12 %
14 %
Produc
t 1
Produc
t 2
Not Ava
Produc
t 3
Produc
t 4
Produc
t 5
Produc
t 6
Produc
t 7
Produc
t 8
Produc
t 9
Produc
t 10
Produc
t 11
Produc
t 12
Produc
t 13
Produc
t 14
Produc
t 15
Produc
t 16
Produc
t 17
Produc
t 18
Produc
t 19
Produc
t 20
Produc
t 21
Produc
t 22
Produc
t 23
Produc
t 24
Produc
t 25
Produc
t 26
Produc
t 27
Produc
t 28
Produc
t 29
Produc
t 30
Produc
t 31
Produc
t 32
Produc
t 33
Produc
t 34
Produc
t 35
Produc
t 36
Produc
t 37
Produc
t 38
Produc
t 39
Produc
t 40
Produc
t 41
Produc
t 42
Produc
t 43
Produc
t 44
Produc
t 45
Produc
t 46
Produc
t 47
Produc
t 48
Produc
t 49
Produc
t 50
Per
cent
age
of a
ll ca
ses
0 %
10 %
20 %
30 %
40 %
50 %
60 %
70 %
80 %
90 %
100 %
Cum
ulat
ive
shar
e
Figure 26. Customer complaints by products.
When analyzing the top 5 products further, a few very reasonable explanations
why these products are on the top of the list can be found. Products 1 and 2 are
firstly among the most sold products in volumes and secondly they also have the
most configurable product structures. Compared to two previous products,
product 3 instead, is a quite new one with low volumes and has only a few
features which can be configured. In addition only one operator executes the
63
whole assembly process himself, which might be one reason for the high rate of
defects. However, product 4 is not a configurable product and thus makes an
exemption compared to previous ones. "Not Ava" stands for the information not
available or otherwise cannot be allocated easily to a specific product.
Trying to identify some similarities between defects and products, analysis of
customer complaints by products indicates that every product has own product
specific defect types and the causes behind the defects can vary a lot. This
analysis reveals, not surprisingly, that most complaints are directed to products
with high volumes and most configurable products, where the possibility of
making a mistake is highest. The connection of how products’ maturity and the
number of operators executing an assembly task affects to error rate is not in the
major role. Products with complex structure and long lead-time in production
seem to have relatively small number of complaints based on the data of this
study. This indicates that assembly processes with these products can’t proceed if
certain steps are not executed correctly.
0 %
10 %
20 %
30 %
40 %
50 %
60 %
70 %
80 %
90 %
100 %
Product 1 Product 2 Product 3 Product 4 Product 5
Late delivery
Order entry error
Instruments/SO's mixed up
Wrong/Inaccurate output
Assembly error
Delivered not according to spes
Certificate or serial no proble
Other
Material quality issue
Missing parts
Figure 27. Defect type distribution in top 5 products.
64
A claim that every product has some product specific defect types is proved
according to the examination in figure 27. Within every product one or two major
categories can be found which comprise a great share of all defects to one product.
Products 1 and 3 faces the major problems concerning missing parts, instead of
product 4 has major problems with certificate and serial number problems and
with material quality issues. The most problematic issue, however, is that even
products 1 and 3 have both “missing parts” as the largest defect category; the
reasons behind the problems can vary a lot. Thus, finding a universal solution to
decrease the defect rate in this category may be a challenging task.
6.2.3 Manufacturing team comparison
Manufacturing teams differs remarkably from each other by the volumes of
manufactured products and complexity of the products. One aspect to define
possible problem areas in manufacturing environment is to take a look at how
defects are divided between manufacturing teams. Defect distribution by teams is
introduced in figure 28.
0
20
40
60
80
100
120
TEAM1 TEAM2 TEAM3 TEAM4 NOT AVA
Num
ber
of c
ases
0 %
10 %
20 %
30 %
40 %
50 %
60 %
70 %
80 %
90 %
100 %
Cum
ulat
ive
shar
e of
tota
l
Figure 28. HelpDesk-case distribution by teams.
65
Manufacturing teams 1 and 2 comprises together almost 70 % per cent of all the
complaint cases. The result of this comparison is not surprising; team 1
manufactures most of the volumes and team 2 has the most configurable products,
which explains the distribution of cases. However, it is a bit surprising that team
3 has over 30 % less cases even though its volumes are second highest, products
have more complex structures than team 1 and team represents and manufactures
products for three product lines. This result can thus be considered remarkable
good in team 3.
0 %
10 %
20 %
30 %
40 %
50 %
60 %
70 %
80 %
90 %
100 %
TEAM1 TEAM2 TEAM3 TEAM4 NOTAVA
TOTAL
Late deliveryOrder entry errorAssembly errorInstruments/SO's mixed upWrong/Inaccurate outputDelivered not according toOtherCertificate or serial no pMaterial quality issueMissing parts
Figure 29. Defect type distribution by teams.
Figure 29 illustrates defect category distribution in manufacturing teams. As this
comparison points out variation between teams exists. Manufacturing team 2 and
team 3 have almost the same kind of distribution in category comparison while
team 1 differs quite a lot from these two teams. Team 1 doesn't have any dominant
defect category, however, certificate and serial number problem-category can be
considered to be relatively big compared to teams 2 and 3, where most of the
66
problems were faced with missing parts. The results of team 4 cannot be
compared to other teams while the number of manufactured products is noticeably
smaller.
6.2.4 Pareto analysis of internal inspection process In addition to customer complaints another source to obtain useful information of
quality failures has been used. As already mentioned, case company executes final
inspections for finished products (complete sales packages) before the final
shipping. Inspection is carried out to all products sold to one specific geographic
area and for the top 3 products presented in the figure 26. In this inspection, sales
packages are opened by inspectors and contents of packages are checked at the
accuracy of every feature of the sales order. However, equipments are not
electrically tested in this inspection process which decreases the reliability of this
inspection method a bit.
During this study, actions towards developing the internal inspection system
further in order to obtain more specific information of faults were executed.
Another objective has been to develop the feedback and monitoring system of
quality failures.
67
Quality failures in internal inspection
0 %
5 %
10 %
15 %
20 %
25 %
30 %
35 %
Missing
parts
Certifica
te or se
rial n
umber pro
blem
Materia
l qua
lity is
sue
Assem
bly er
ror
Not acc
ordin
g to s
pesif
icatio
nOthe
r
Instru
ments or
SO's
mixe
d up
Wro
ng / i
nacc
urate
outpu
t
% o
f tot
al d
efec
ts
0 %
10 %
20 %
30 %
40 %
50 %
60 %
70 %
80 %
90 %
100 %
cum
ulat
ive
shar
e
Internal inspection Customer complaint Pareto
Figure 30. Final inspection pareto analysis and HelpDesk comparison.
As the results of internal inspection pareto analysis shows, similar trend to
customer complaint pareto exists. Missing parts and certificate and serial number
problems are the major categories.
Due to data has been gathered afterwards and final inspection process has been at
full scale use since late Q3/2007, the correlation of how the inspection process
and the corrective actions based on it has effected on the number of customer
complaints and defect distribution can’t be stated yet.
6.2.5 Origin of fault in manufacturing process
Targeting development actions to right phases of the manufacturing process it is
reasonable to clarify in which part of the process most defects occur. In this
examination manufacturing process is divided in three parts; assembly, testing and
68
calibration and final assembly. In addition there is a group "supplier" which stands
for the cases where the origin of fault can be traced back to supplier actions.
Origin of Faults
Supplier Assembly Testing / Calibration Final assembly
Figure 31. Origin of faults in manufacturing process.
The results introduced in figure 31 show that the majority of faults have taken
place in the final assembly. In this stage the product itself is complete and fully
functional, waiting for additional parts and accessories to be added into sales
package according to configuration.
Analysis supports also the insight that assembling basic structures of products are
executed quite correctly and the mistakes are controlled pretty well. In pre-
assembly, products are assembled to a stage where all the main components are
included and products are electrically functional. Defects occurred in pre-
assembly are mainly reported in material quality issue-category, e.g. incorrect
wirings or other visually detectable failures.
Typical defect types which take place in testing and calibration phase are related
to wrong outputs, e.g. operator enters temperature unit F instead of C. Also some
certificate and serial number problems have its origin in here, while the
certificates and labels are printed straight from the test station.
69
6.3 Summary of quality failure analysis
As the results of analyses have shown, a great majority of quality problems were
derived from only a handful of products. The largest category of defects according
to both data sources was missing parts. Certificate and serial number problems
can be considered to be as a second largest independent category, because the
categories other and material quality issues cover such a great variety of different
type of cases. The aim of this part was to provide data of quality failures from
many different aspects and point out which areas should be improved and further
developed.
In the production environment where the manufactured products are largely
configurable, the number of different kind of defects can be very high. This is a
major challenge for utilizing poka-yoke methods effectively, while the root causes
of the problems varies a lot. However, utilizing poka-yoke method is useful and
advisable approach for controlling these quality failures, due its nature on
eliminating human errors effectively.
The analysis revealed also some weaknesses and the areas which need
improvement regarding existing quality reporting methods. For example
categorization of defect types and reporting methods should be evaluated
thoroughly. Also the meaning of the final inspection should be evaluated
according to the framework of poka-yoke theory, which suggests that judgment
inspection process (as final inspection process can be compared in this context) is
the lowest form of inspection and only helps to detect mistakes, not to reduce or
prevent them effectively. However, at this stage the benefits of this inspection
process can be appraised to be very remarkable due to vital information it
provides.
70
7 CASE STUDY: ROOT CAUSE ANALYSES OF TWO QUALITY FAILURE CASES
This chapter presents a profound examination of two typical quality failure cases
in the case company. The main purpose is to define possible root causes for the
problems and according to the results identify and consider how and what poka-
yoke methods could be utilized to presented quality issues. Cause-and-effect
diagram added with 4M principles has been used as a tool for root cause analysis.
7.1 Case 1: Missing or wrong parts
As presented in the chapter six, the category missing parts is the largest defect
group in both pareto analyses. A closer look to cases reveals that products with
large configurability are on the top of this defect category. Another issue
concerning this category is that errors usually occur in the final assembly. The
following case represents both of these characteristics.
Problem description
Customer has received a measurement unit UNIT 1 with a wrong installation kit
inside the sales package. Instead of needed KIT 1 there was KIT 2 in place.
Customer took contact to the company and required replacement. Company's
representative shipped the right assembly kit to the customer as a corrective
action immediately.
The description above represents a typical example of the mistake in the final
assembly related to picking of correct items. The following cause-and-effect
diagram summarizes possible root causes for the problem.
71
Figure 32. Cause-and-effect diagram of missing or wrong parts.
As the cause-and-effect diagram shows there are various causes behind this kind
of error which makes the finding of preventive solutions very challenging.
However, the most profound causes derive from working methods and materials.
Regarding working methods a few critical issues can be found. In the picking
phase, only a list of features is provided for the operator instead of providing an
overall list which covers all the items that need to be picked for the specific sales
order. Due this, there can occur misreading in the specific mark of the
configuration code which cause the error to happen. As in this case all the
accessories and assembly kits are picked just before the packing phase and
releasing the product to the shipping team. It is just operator’s responsibility to
check that all the needed items are picked correctly because there is no separate
inspection process after the picking phase. Sometimes out-of-date product
documentations and instructions may be a cause for the shipment with wrong or
missing parts.
72
Some causes for missing and wrong parts can be derived from the materials
related aspect. In the final assembly picked items can be both purchased items and
manufactured items. In this specific case KIT 1 is purchased but KIT 2 is
manufactured in house by adding some items into the KIT 1. In addition, part lists
for checking the right structure of items are not always easily available. All the
materials needed in the packing phase have no shelf storages in the packing area.
The operator must move around the factory floor to collect the items needed. This
interrupts the packing operation and cause that some parts may unintentionally be
left out from the sales package.
When analyzing the case in the framework of poka-yoke inspection methods and
control function, several notifications can be found. Taking a closer look to the
picking phase shows that there are no “inspections” in this process which confirm
that the right items are added into sales package. While the operator is responsible
for the correct execution of picking and picking phase is usually carried out by
one person the suggested level of poka-yoke solution would be informative self-
check. It should either warn about the mistake occurred or control and support the
picking of right items.
However, finding a general solution to missing part problem can be regarded very
challenging. As the cause-and-effect diagram illustrates there are various causes
behind this phenomenon. In some cases implementing preventive actions would
require only small changes in the process to obtain remarkable results, while in
some cases the whole process should be totally reorganised. Due to products’
diversity, solutions to one product might not be easily applicable into another.
Derived from the problem description and from the cause-and-effect analysis
some suggestions can be made as possible solutions to missing part problems:
• generating picking lists
• pre-moulded packages which indicates visually if some items are missing
(especially in standard products)
• improving the layout of packing area
73
• improving material storage layout more supportive for picking materials
according to configuration (see proposal in appendix 1)
• the use of reader devices to control picking of correct items (bar codes,
RFIDs)
7.2 Case 2: Certificate or serial number problem
Quality issues concerning certificate and serial number problems comprise a large
share of reported quality failures. Even though these mistakes don’t have any
effect on equipment’s functionality, they are still considered to be very
embarrassing quality failures. Usually, they only cause some confusion at the
customer site and correct certificates and labels are delivered soon to the
customer. However, in some cases it may play an important role if, for example,
the equipment is named as reference equipment for the specific application and
the mix up is noticed after official documentation and verifying. Despite the
situation, this kind of quality issues always refer to carelessness and of course, in
some extend it may have an effect on company’s imago and credibility if same
problems continue to occur.
Problem description
Customer has received a measurement unit UNIT 2. The unit has a serial number
B2720017 on its product label and in its card box. However, in attached
calibration certificate has the serial number B2720016. S/n B2720017 is
confirmed as the correct ID of this specific unit.
This is a very typical example of quality issue faced with product labels and
certificates. In a normal situation, the customer is satisfied by delivering
afterwards correct certificates or correct product labels, depending on the case.
The following diagram clarifies the root causes behind this problem area.
74
Figure 33. Cause-and-effect diagram of certificate and serial number
problems.
As mentioned earlier this type of errors has no effects on products functionality
but can cause confusion among the customers. As in the case 1, as likely most of
the certificate and serial number problems occur due to human errors. However,
cause-and-effect diagram expands the outlook for the problem.
In this problem area the finding of unambiguous root causes is very challenging as
the cause-and-effect diagram shows. The following conclusions concerning the
root causes can be drawn out:
Methods
Printing of product labels and certificates to one product can be done in worst case
in three different places. Due this, the possibility of mixing them is regarded high
while they need to be moved around. Another major issue within working
methods is that s/n is created as a first task in pre-assembly. After this s/n is
manually copied many times in the following operations, which raises the
possibility of making mistake. Within some products the level of automation has
been increased to avoid copying errors.
75
Manpower
In a manpower examination, human errors take place due to interruptions in
operations and inadvertent errors in sorting the labels or certificates (because the
number of printed items simultaneously is high). Also typing errors with serial
numbers are common because they normally include 8 marks that need to be
typed manually. Within some products hundreds of serial numbers are handled
within one working day by one operator and thus it is not a surprise that these
kind human errors may happen, especially in a hurry.
Machines
Quality problems caused by machines are mainly related to printing quality in
both certificates and labels. Also selected label printing techniques and print
materials are not fully suitable for this magnitude of printing. However, technical
requirements for label materials forces to the use of selected printing techniques
and materials. Problems faced especially with sticker printers are due to
inadequate number of them and the insufficient level of automation.
Materials
Regarding the material aspect the most important issues concern the number of
different labels needed to one product. One product may have at least three
different kinds of label stickers, which need to be manufactured with different
machines. It would be recommendable that labels could be printed with just one
printer. Also the creation of some principles and rules for the designing of new
label blankets would be advisable, while almost every product has its own specific
design in labels. This makes the controlling of them very challenging.
As in the case 1, there are no any kinds of inspections or checks to cover this kind
of quality non-conformances. The feasible poka-yoke solution should provide a
procedure which decreases the risk of human error concerning e.g. the manual
typing of serial numbers or sorting of labels and certificates. If contrasting these
76
issues to lean environment, all of the activities mentioned can be considered as
some sort of waste.
Due to attaching labels and certificates to products and sales packages is done in
the very end of the production process the biggest challenge is faced with
designing mistake-proofing method. It requires that poka-yoke solution informs
immediately about the mistake and prevents its flow into the next phase. The
following aspects should be taken into consideration when defining poka-yoke
implementations:
• minimizing the manual typing of serial and lot numbers (data should be
electronically readable, e.g. bar codes and RFIDs)
• printing of labels and certificates just before the packing phase
(unnecessary movement will be avoided and thus the risk of mix up is
minimized)
• decreasing the need for sorting out labels from each other due to mass
printing (in a batch size of one the risk of mix up is minimized)
• defining visual requirements for the printing quality of labels and
certificates
77
8 UTILIZATION OF MISTAKE-PROOFING METHODS: ANALYSIS AND RECOMMENDATIONS
In the empirical part of this study so far, extensive analyses of quality problems
and more detailed descriptions of two case examples have been introduced. The
aim of this chapter, instead of defining poka-yoke solutions to individual cases, is
to generate overall procedure of what steps need to be taken into consideration
when utilizing and implementing poka-yoke methods. Analyses and case
examples act as a background for the definition of this procedure. In addition, the
current problem solving methods in the case company are examined and some
recommendations are given on the grounds of this examination. For this purpose,
a specific evaluation and development matrix tool has been created.
In addition, the following topics will be discussed thoroughly later in this chapter:
• prioritization of development areas in the case company
• proposals and recommendations for correcting existing quality failures
• recommendations for developing quality reporting systems and monitoring
• company-wide mistake-proofing efforts
• challenges faced with the mistake-proofing implementation
8.1 Defining the evaluation and development matrix
A matrix introduced in figure 34 will act as a framework for an analysis and
development tool. The matrix has two dimensions; the first dimension consists of
current and ideal states and the second dimension covers corrective and preventive
action approaches in problem solving. Dimensions have been chosen according to
the theoretical examination discussed in chapter 3, including perspectives of
Toyota’s problem solving methodology (short-term and long-term aspect) as well
as control cycle perspective (see figure 4) presented by Shigeo Shingo.
78
This matrix can be used, like now, to provide an overall analysis of problem
solving methods but also as a development tool for individual quality
improvement cases. The aim of this matrix is to help at collecting information and
examining cases from different aspects.
Figure 34. Framework for evaluation and development matrix.
The presented framework includes four possible states of movement. The
numbers beside the arrows describes how remarkable the changes are from the
initial state to the new state and are as follows:
1. Designed solution model for specific problem is effective and can be
considered as permanent and preventive for similar cases. This is the most
preferable movement.
2. At this state preventive solution model for a problem exist, but is not
efficient enough. With some improvement efforts it is possible to make
method more stable and reliable.
3. There are some problems which cannot be eliminated totally, or the
benefits achieved through the total elimination are minor. Thus, the main
emphasis should be paid on mitigating the effects of the problem.
79
4. No movement to any direction. Problems are so rare or cannot be
controlled otherwise.
In the current state section existing problem solving methods in case company are
analyzed. The main interest is on how mistakes are detected, what are the root
causes behind occurring problems and what actions take place immediately and
how preventive actions are handled. The results of these build a basis for
developing the ideal state and its related actions. In the background of proposals
concerning the ideal state the theory of poka-yoke and efficient problem solving
methods will be utilized.
Figure 35. Poka-yoke implementation process.
Within every section of the matrix there are a few suggestive steps which should
be taken into consideration when implementing and utilizing poka-yoke
methodology. Steps introduced in figure 35 concentrates on the following aspects:
80
• Identification: definition of detection methods; how certain type of defect
can be detected with existing or future methods
• Analysis: clarification of root causes and common characteristics of
defects
• Planning: defining, analyzing and comparing possible mistake-proofing
methods
• Implementation: executing the implementation, advising the operators
• Evaluation: evaluation of implemented method, approval or re-
implementation
In the following sections 8.1.1-8.1.4 descriptions of case company’s existing
problem solving methods and suggestions regarding the ideal state are provided.
8.1.1 Current state and corrective actions
Detection and identification
At the current state, most of the occurred quality failures were not detected in the
manufacturing process itself but through the final inspection process and customer
complaints. This indicates clearly that in existing manufacturing processes the
level of mistake-proofing is not sufficient, especially in the final assembly where
the majority of mistakes take place. Referring to figure 31, however, mistakes do
seldom pass the testing and calibration process easily, which indicates that
mistake-proofing methods in pre-assembly and testing and calibration process can
be considered to be a satisfactory level.
Detection of an occurred defect as early as possible is of great importance.
Referring to the case examples presented on the chapter 7 that kind of mistakes
are usually detected by the customer. Due to long feedback loop, there are no
evidences available anymore of which particular reasons were behind the mistake.
If quality failure is detected in final inspection process this prevents that the faulty
unit won't be sent to a customer until it has been repaired. At this time the
81
circumstances are traceable and the possibility to control the upstream processes
still exist.
Problem solving and corrective actions
All customer complaints concerning the delivery process are handled by a
responsible person. As an immediate corrective action a replacement is normally
sent to the customer or to the sales representative or in some cases, the product is
pulled back from the customer for the repair. In many cases this is the first time
when the operator gets the information of fault execution and together with the
responsible person they check the situation and try to clarify possible causes
behind the problem. If the mistake is detected in the final inspection, the person
inspecting corrects the fault him/herself or returns the product back to production.
As soon as the defect is detected it is important to inform all relevant interest
groups and especially the operator. However, sometimes it may be hard to identify
who has manufactured the specific product. Very often the main emphasis of
corrective action is only to correct the specific product; efforts should be more
paid on finding the causes from the process. This conclusion can be made because
similar problems arise again and again after a while of previous corrections.
Weaknesses regarding current state of mistake-proofing
Following aspects of mistake-proofing can be identified in the current state:
• Lack of quality checks in final assembly (majority of reported quality
failures occurs in this part of assembly).
• Corrective actions are primarily targeted on product aspect, no changes or
corrections in the process which causes that mistakes continue to occur.
• Corrective actions are usually type of “warning”. Teams are informed and
told to pay more attention next time or e.g. new instructions are created.
However, after a while same mistakes might continue to occur.
• Due to long delay of detection of a mistake, original circumstances of the
occurrence remain unknown and thus correcting the problem is
challenging.
82
• Low utilization rate of already handled Helpdesk-cases, even the same
mistakes are recurrent. No common database for corrective action reports.
• In some cases root cause analyses are not conducted thoroughly.
As the notes above points out, some weaknesses regarding mistake-proofing and
problem solving can be found. A more thorough study of customer complaint
cases reveals that the majority of the faults happen due to human error; this
indicates that a need for mistake-proofing processes is important. It is very typical
aspect for this kind of high-technology product manufacturing that most efforts of
development are targeted to products’ technical functionality and faultlessness.
This statement applies as well to case company. Manufactured equipments have
usually no problems with technical performance but the chain of “making-of-
quality” ends when sales package need to be covered with customer’s required
options. Everything goes well all the way to the final testing and the calibration
stage of manufacturing process, but after that the problems begin. Also in many
cases the level of technical mistake-proofing is on the very satisfactory level
before final assembly.
8.1.2 Current state and preventive actions
The aim of preventive actions is to generate long-term solutions which prevent the
reoccurrence of similar defects. Normally, preventive solutions are conducted and
implemented as a result of detailed and thorough examination and study of
mistakes and their root causes.
Long-term and preventive action process has two approaches. The first aspect is
to generate long-term solutions to quality issues of already known quality failures
(existing problems, which are usually corrected at some level, but the solution is
only temporary in-kind). The second aspect regarding preventive actions is to
utilize mistake-proofing methods before a mistake has even occurred. In this
situation possible error states are known at some level.
83
On the grounds of the empirical study some observations about the case
company’s problem solving methods can be made. As the results of quality failure
analyses reveal, preventive solutions for quality issues have not been efficient
enough. This conclusion can be made on the basis of that the same mistakes are
occurring regularly. Especially in cases of missing parts and certificate and serial
number problems this phenomenon is most obvious.
The following weaknesses can be found concerning preventive action methods in
the case company:
• The mentality of using “human error” as a root cause for a specific
problem is too dominant.
• Lack of systematic utilization of problem solving tools or methods.
• Preventive solutions are usually “weakly” preventative, such as telling a
team to pay more attention to execution, making of instructions or adding
the product under the final inspection. Any of these, however, do not fill
the requirements of preventive problem solving.
• Long-term solutions implemented have actually only made “judgment
inspections” more effective.
• Lack of organized problem solving teams and clear responsibilities.
• Existing data of delivery quality failures has not been analyzed at
sufficient level to utilize it into the preventive actions.
Due to ramp-up processes for taking a new product into full-scale production are
quite fast, the possibility of pre-studying mistake-proofing methods is low. During
ramp-up processes the main effort is to analyze methods from technical aspects of
manufacturing. At this point, only small effort is put on picking and packing
phase of production while they are held as secondary issues. However, this
usually causes that the real problems becomes visible when the full-scale
production is already running. Changing of working methods at this point can be
laborious and might even cause delays in production.
84
8.1.3 Ideal state and corrective actions
Even though it is almost impossible to eliminate some mistakes totally the greatest
effort should be paid on mitigating the effects mistakes may cause. A starting
point in ideal state is almost the same as in the current state: detection of defects
happens through customer complaints and final inspection process but most
importantly, more and more in added checkpoints in manufacturing processes.
There are a few issues which are of utmost importance on this stage. Firstly,
corrective actions for controlling problems should be started immediately and
secondly, to initiate actions for problem solving procedure. When a defect is
detected first time, it should be confirmed that no more faulty products are
delivered to customers or the flow of faulty units should be stopped in in-house
processes. The operator should be also informed immediately. After containment
of the problem, the emphasis should be targeted on starting to clarify possible root
causes and initiate problem solving process for preventing same mistakes from
occurring. Key concern is to find out possibilities how to detect defects earlier and
prevent them from reaching the customer.
Compared to current state situation in the ideal state the main difference is that the
corrective action can be executed faster, e.g. by utilizing the data obtained from
similar cases. And as stated earlier, some defects are so rare that their total
elimination is unreasonable, so the aim of corrective actions is to mitigate the
effects of them as much as possible.
In the ideal state possible problem statement is done thoroughly in the first place
which helps later the processing of the problem and narrows the group of possible
solution models. The aim of is stage is also to provide supporting data for finding
the preventive solution for the problem in the next phase.
85
Compared to current state situation:
• People are more aware of the existing quality problems and are able to
react to the problem faster.
• Problem solving process does not end when a case is closed to a customer.
• A common database for quality failures and corrective action reports
exists.
• Customer complaints are not the primary inputs to start corrective actions
in the manufacturing process.
• Inspections and/or checkpoints are added to manufacturing processes for
controlling mistakes better.
• Judgment inspections have been replaced by informative inspections.
• Warning mechanisms are replaced by control or shutdown mechanisms.
8.1.4 Ideal state and preventive actions
This is the most desired stage of the matrix. On this stage the true aim of quality
improvement efforts is in the prevention of mistakes especially in manufacturing
processes. Processes and their defect states are well-known and the major interest
is on possible causes ("inputs" in figure 35) of defects. The "inputs" are usually
conducted from the root cause analyses. With the information about possible
defect sources, it is possible to set up inspections and quality checks to right
phases of the processes.
Poka-yoke implementation process should start when a new input is detected. The
input is the target of “poka-yokeing”. The mentality of preventive actions should
be “what kind of poka-yoke do we need to detect the causes and prevent them
from turning into a defect”. When implementing poka-yokes to specific problems
following issues should be taken into consideration:
• Defining the level of inspection technique: judgment, informative or
source. Source inspection is always the most preferable technique.
• Assessing possible solution models between method, device and
procedure.
86
• Comparing solution’s complexity and implementing costs to the benefits
obtainable (e.g. are the massive changes regarding IT-systems or lay-outs
worth of execution).
• Defining clear responsibilities for the implementation and monitoring
(including operators, support functions and management).
If we contrast case company to the ideal state the major changes are required in
the raising the level of “inspections”. In the current state most of the preventive
actions have just raised the intensity of judgment inspections but to develop and
improve preventive action methods further it requires that informative inspections
and source inspections are implemented. In practice this means that stages of
manufacturing are split into smaller phases and they are controlled by poka-yokes.
Steps towards more preventive mode in the case company:
• systematic utilization of problem solving methods
• problem solving actions should be mainly targeted for improvement of the
processes
• increasing the level of work supportive methods
• increasing the importance of correct execution in the final assembly
already at the ramp-up phase
• defining clear responsibilities concerning problem solving
• continuous monitoring of quality failure cases (helps at prioritize
development efforts)
8.2 Recommendations for main quality failure types
As the nature of this study is, the main emphasis is paid on identification of
existing quality problems. Due to short period of time only minor poka-yoke
implementations were executed. Thus, the main effort is to provide
recommendations and proposals for possible poka-yoke solutions.
87
According to pareto analysis in the figure 30, majority of quality problems are
faced with the categories of "missing parts" and "certificate and serial number".
Together these two groups comprise nearly half of all mistakes reported in
HelpDesk and in internal final inspection process. The following section provides
some detailed suggestions of methods to decrease the occurrence of these
mistakes by utilizing poka-yoke methodology.
8.2.1 Poka-yokes in missing part category
Reducing the number of missing part - cases, main efforts of mistake-proofing
should be targeted on the products with high level of configurability and on final
assembly in manufacturing process.
Final assembly is normally executed manually and the operator is responsible for
the correct execution. In addition, this phase of manufacturing process includes
many configurative steps and at the moment there are no “poka-yoke" methods
which assure that for example picking phase is executed correctly and the
possibility of human error is eliminated.
Applying inspection and poka-yoke methods to this area of quality failures the
following proposals can be made for the case company:
Missing manuals or wrong language manuals
• use of multi-language manuals, especially in manuals with only a few
pages
• providing manuals only through the internet or e.g. the use of USB-stick
(all languages provided in one source)
• weighting methods (however, does not apply to wrong language, but may
detect a missing manual)
88
Screws and cables
• design of products so that correct assembly requires certain screws are
inserted (R&D), or making missing screws easily visually detectable
• additional testing in test stations, which checks that the specific cable
corresponds the same as the configuration code requires
• inspection process and/or poka-yokes should be installed in pre-assembly
because the parts are collected at this stage
Missing or wrong installation kits and other accessories
• poka-yoke method should be type of control or shut down because items
are picked in the final assembly and if they pass on this stage; customer is
more likely to receive a faulty unit
• rationalizing of options of features; existing options can be both purchased
or manufactured in-house and the difference in their structure is only
minimal
• use of pre-moulded packages, which works as a visual indicator for
missing item
• material storage layout (all picked items should be stored in one place)
• controlled picking of materials
8.2.2 Poka-yokes in certificate and serial number problem category
According to analyses certificate and serial number problems comprise a large
share of existing quality problems. During this study, new printers for both
certificates and labels have been bought and taken into use. However, this doesn't
have much effect on reducing defect rates while the possibility of human error
still exists in mixing up certificates and labels.
As pointed out in the cause-and-effect diagram earlier, different products have
different kind of labels and stickers and they are printed in different phases of
production. Only within few products there are utilized the system where the right
lot or serial number is read electronically and transferred to printer. However, at
89
the moment, the serials are copied many times manually which increases the
possibility of misreading or misinterpreting.
Considering the possible poka-yoke methods the same challenges are faced like in
the case of missing parts: this part of assembly is done in the very end and thus
the time to react a problem is minimal. Below are presented some issues that
should be taken into consideration:
• minimizing the manual typing of s/n and lot markings
• handling of only small number of labels, stickers and certificates at a time
• organizing the printing of labels and certificates into the one place
• creation and printing of the serial number in the final assembly
• the use of label sheets which include all necessary labels for one product,
see example in appendix 2.
• more extensive use of reader devices e.g. bar codes and RFIDs
8.3 Supportive systems for mistake-proofing
Improving the level of mistake-proofing can be also achieved through the
effective utilization and improvement of many supportive systems and tools
already used in the case company. These efforts may even have a greater overall
effect on decreasing the number of faulty deliveries due their effects on working
methods. From the case company’s point of view discussion concentrates firstly
on quality reporting and monitoring systems and secondly, quality of data and
information used in everyday operations in manufacturing.
8.3.1 Quality reporting systems in delivery process
As a kick-off for this study was that the number of customer complaints referring
to origin of delivery process had increased. The internal inspection process was
started on spring 2007 and the number of products taken under the final inspection
process has been gradually increased. Before the study the only information of the
90
quality issues concerning the delivery process was reported quarterly and only in
the level of fault category distribution (see figure 25 as a starting level). The
possibility of drilling down to product level or team level did not exist or it
required excessive amount of work. Also the utilization of quality data was at the
low level. Only people involved with a specific product or product line had a
comprehensive and specific knowledge of existing quality problems. As with
these statements the following conclusion can be drawn: reporting methods of
quality issues needs rationalization and the level of informative data needs to be
increased.
Continuous quality failure reporting is very critical at this point of implementing
poka-yoke methods. With the help of accurate information available, it is easier to
put focus on correct places and issues, but in addition, evaluation and
measurement of implementations is even more vital.
In order to have been able to conduct these analyses in this study, it has required
lots of manual work to be done. This indicates that the existing reporting methods
are not the kind that supports the utilization of it. During the study many
development areas concerning quality data collection methods have been
identified. The primary source for external quality failures, case company’s
HelpDesk system, needs the following requirements to be fulfilled to gain the
sufficient level needed in the future:
• improvement of data “drill down”- possibilities
o adding new compulsory fields; e.g. the product name, number of
faulty items
• fault category rationalization
o classification of fault types
o depending on the performer of the case the fault category varies;
categories are not unambiguous
• shortening the reporting period of HelpDesk (at the moment 3 months)
91
During this study some of the suggestions above have been tested in the final
inspection reporting and the results have been very promising. Especially, the
possibility to get easily an overall view of the quality failures, as well as the drill
down possibility is considered to be very useful and important aspect.
However, when defining the development areas of quality reporting methods, a
few crucial issues remain open: who will be responsible of delivery quality issues
in the future and what will be the needs of quality organization in the case
company? From this point of view, major changes in quality reporting system
have not been made. The purpose of this study has been to point out the areas
which need improvement and to increase the utilization level and usability of
quality reporting systems.
8.3.2 Quality of data and information
As described in chapter 2, there are many types of human errors which may cause
a mistake to happen. Some of them are closely related to the quality of data and
information handled in daily operations. In this context “quality of data” is
considered as all data related to materials, instructions and methods used in the
delivery process. Referring to table 1, most of the human errors in the case
company can be imagined to fall into categories of forgetfulness, errors due
misunderstanding and errors due to lack of standards. In many cases "quality of
data" can be seen as a partial cause to these errors. Next there will be taken a short
review of data quality issues from the selected areas which have the most effect
on daily operations.
Work order
As mentioned earlier the case company executes Make-to-Order manufacturing.
When a new sales order is entered to MFGPro (ERP-system in the case company),
operator receives it and places it into a job queue of the team. Next the operator
changes the status of order to WIP (work-in-progress) and prints the paper version
92
of the work order. Printed work orders move with the products through the
manufacturing process all the way to shipping point.
Work order includes e.g. a configuration code, list of selected options of features
and detailed shipping information. Primarily, work order should act as a summary
of needed information to be able to manufacture the right product and ship it to
right customer. However, in many cases work order is tailored to act also as some
kind of narrow picking list for needed items. At the moment, there are not
provided any other kind extensive picking lists.
Due to work order prints are tailored differently depending on the product and its
configuration structure, the outlook of them varies. This causes that when the
operator takes a new product (from different product family than previous) under
work, he/she has to learn how to read the work order right. For example, the same
option character can stand for "normal mounting kit" or "wall mounting kit"
depending on the product. This kind of variation requires that operator must pay
extensive attention to this kind of non-value performance. In addition, even if
there aren’t any problems with interpreting the right option, in case of any
frequently used option; the operator must confirm the right items that need to be
picked up from separate BOM, bill-of-materials, documents. Obtaining this
information can be very time-consuming and it easily interrupts normal
processing. In some cases operator may have difficulties in finding the right
source for the information. According to interviews during the study period, the
idea of printable picking lists was held very promising according to the personnel
in manufacturing. However, other methods, such like providing the same
information via computer screens, should be also assessed carefully.
Work instructions
Quality of data is an important issue concerning work instructions. Due to high
pace of changes in product structures this creates pressure to keep work
instructions up to date. The admirable state of work instructions should be on the
93
level where the assembly operation can be correctly executed unambiguously
according to instructions.
Work instructions are normally available near work place in product maps (as
paper versions) and, of course, electrically available in the company’s PDM
system. Up to the present, production people have preferred paper versions of
work instructions. Product maps include usually detailed assembly information
with text and photos, BOMs and any other relevant information e.g. regarding
OEM-products. However, the level of instructions varies a lot by products.
Typical problems faced with work instructions are that the information is out-of-
date or the information is useless for the purpose regarding especially paper
versions of instructions. Errors due to out-of-date information are totally
inadvertent errors from the operator’s point of view. In some cases the
information obtained from product maps is totally insufficient for correct
operation execution; e.g. there are no photos at all or job phases are not explained
detailed enough.
Based on the interviews and meetings with production teams, we have identified
which work instructions and product maps need urgent updating. There are three
major issues which raises the importance of the quality of data of work
instructions. Firstly, instructions should be unambiguous and easily available in
every work place. Secondly, in the case of new worker’s training, good
instructions work as an enormous support for the worker. Thirdly, documented
instructions are always much more reliable than information obtained first time
from another person verbally.
PDM system and Engineer-Change-Orders
Case company uses Aton software as a Product Data Management system.
Operators in assembly do not, however, use this master data source much since
they find it too complicated to use. Also finding the specific information is
94
sometimes found difficult, mostly due to the lack of routine of using the Aton
software. This is slightly conflicting issue because PDM system includes master
data and updated instructions. Updating changes into product maps is very
laborious updating should be done immediately when changes take place.
Gaps in the flow of the information may happen when a new engineering change
order (ECO) is released. If the operator is not aware of changes in product
structures, he / she will execute assembly process inadvertently wrong. Due to
this, new methods of how to inform production teams about changes and to
confirm that a new procedure is adopted by all should be defined.
8.4 Mistake-proofing in the organization
It would be useful that the utilization of mistake-proofing methods would stay as a
continuous process in the organization rather than only a one-shot effort during
this study. The best way to confirm the continuance is to spread responsibility for
enhancing the use of this methodology widely over the organization. As this study
has already shown there are many interest groups whose actions and decisions are
directly or indirectly in connection to quality issues. This doesn’t mean that
mistake-proofing is the only and absolute way to improve overall quality; it is
preferably a method which should be taken into consideration behind all quality
related activities.
To spread mistake-proofing efforts across the relevant interest groups in the case
company the following figure 36 summarizes the roles and responsibilities that
are recommendable. Chart comprises three states of product’s lifecycle from
product development phase to full-scale production and recommendations about
general tasks of different interest groups from the mistake-proofing aspect.
95
Figure 36. Generic mistake-proofing tasks within interest groups.
8.4.1. Mistake-proofing in Research and Development unit
To gain the "preventive"-mode in mistake-proofing, mistake-proofing efforts can't
wait until mistakes are discovered in production. The control of mistakes should
start at the earliest stage of product design, in this case in R&D phase of new
product process.
In the beginning of the new product process and product development phase and
latest in the ramp up phase, manufacturability issues should be taken under tight
investigation. Primary tasks should be, at first, to identify the mistakes that are
most likely to occur and then implement different techniques to minimize or
eliminate them. Typical aspects in product development would be, for example,
96
that parts are designed so that they can be only assembled in the correct location
and orientation. Also designing parts and products so that assembly can’t proceed
if parts are missing is preferable. As these examples shows, in mistake-proofing
even negligible changes can have an important influence on eliminating mistakes.
8.4.2 Product lifecycle management (PLM)
It is because PLM-team takes care of products’ ramp-up processes and related
issues to manufacturability, this team has many ways to affect improving the level
of mistake-proofing. During the product process, PLM should examine very
critically all the manufacturability issues. Also supportive methods and tools
should be planned at this stage. When a product is ready for the ramp-up and the
first series of products are manufactured, the emphasis should be paid on the
smoothness and practicality of the process flow e.g. lay-out issues. As mentioned
earlier, final assembly should be one of the key areas in addition to pre-assembly.
During the ramp-up process possible forms of poka-yoke methods should be
defined and implemented.
8.4.3 Product line Product line is responsible for products’ customization and through that the
creation of configuration structure. Product line defines what features and options
are provided to customers. However, more emphasis should be paid on
developing configuration structures in the future. As the results of these analyses
have pointed out, complex configuration structures can be regarded as one of the
reasons in the background of many quality issues. When starting to define
configuration structure for the new product, all possible "killer" combinations
should be carefully analyzed. If some of these cannot be totally avoided then
relevant mistake-proofing methods should be implemented in the first place. It
would be recommendable that co-operation with R&D and PLM is made.
97
8.4.4 Testing and calibration process
In testing and calibration process the main emphasis is naturally on technical
characteristics of the product. However, if possible and without having too much
extra load on testing capacity, it would recommendable to define what features
could be easily tested alongside with the technical features. This point of view
should be taken into consideration already as on early stage as possible. With this
procedure 100 % inspection is possible and it can be executed automatically.
Poka-yokes in this stage detect mistakes made in the pre-assembly. In case of
majority of products, e.g. the right outputs for the device are set by reading the
configuration code electrically. This eliminates the possibility of misreading
compared to situation where parameters are manually set. Other applications
could be e.g. that electronic testing detect if the equipment is equipped with or
without display and compares it to configuration code’s requirements.
8.4.5 Manufacturing and quality department Mistakes and quality failures take place in manufacturing processes. In this
context poka-yoke devices and methods are targeted to detect or inform about any
deviations occurring in manufacturing processes. This study has already provided
many ways of how poka-yokes can be utilized in the operations. Manufacturing
teams and quality team are in the major role of reducing the number of quality
failures. People in manufacturing teams are the best experts regarding the
execution of various tasks in the processes. It is of utmost importance to utilize
their knowledge in the development of possible poka-yoke solutions concerning
bad practices.
Quality department (includes both sourcing function's responsibility of incoming
material quality and all production quality responsibles) should have an overall
responsibility of controlling the utilization of mistake-proofing methods in all the
stages from product design to full-scale production. Quality department is
98
responsible for continuous monitoring and controlling of quality failures and
depending on the situation also responsible for immediate launches of corrective
and preventive actions. However, it must be kept in mind that quality department
is just one party among other interest groups in the making of quality.
8.5 Challenges in poka-yoke implementation in the case company
Implementing poka-yokes in the case company can be very challenging due to the
large number of unique type of mistakes. To provide poka-yoke solution into
every single problem requires a lot of resources and work but in many cases this is
the only way to correct the problem. In this situation it is important to define
beforehand what benefits can be achieved through the implementation so that
scarce resources won’t be thrown away. Finally, a short discussion of quality cost
aspects in the case company is provided.
Interpreting the true nature of mistake-proofing, Hinkcley (2006) states in his
book “Make no Mistake!” that the effective mistake-proofing techniques share the
following attributes, regardless of the target of the implementation:
• they are like checklists that verify correct procedure or conditions
• they are based on 100 % inspection, since mistakes cannot be detected by
any other means
• inspection methods must be reliable
• inspections are autonomous
• to control rare events, devices must be inexpensive to design, implement
and operate
• inspected process should be completely known
If we contrast these attributes in practice in the case company the most profound
question arises with the 100 % inspection: how to arrange 100 % inspections
smoothly in the different places in the assembly flow? This is the most critical
99
step to get rid of 100 % final inspection which only helps to sort out faulty
products of non-faulty products.
To find the correct places where to add inspections might also be a difficult issue.
Due to the nature of faults, many of the existing quality failures take place in the
final assembly where the lead time of the process step is very short. Thus,
suggested poka-yoke solutions should not make operators’ work more complex
and they should not lengthen the lead time. However, in some places total
rearrangement of process flow and layout may be the only way to correct the
problem.
Due to products’ large configurability, most of defects can be considered to be
very unique-in-kind and as the average batch size of manufactured products is
low, manufacturing processes may vary a lot and are not stable all the time. Also
due to the technical complexity of electronic devices or components, they have to
be processed every unit differently. Even if the visible problems are exactly the
same; root causes behind them can vary a lot which increases the challenges
regarding implementation.
Since there are many types of mistakes, mistake-proofing devices must generally
be customized for each specific condition. Thus, in this context, mistake-proofing
should be viewed as an approach for providing generic methods for understanding
and controlling mistakes rather than a strictly defined procedure.
Quality cost thinking in the case company
The reported quality costs in the case company are approximately somewhere
between 1-2 % of direct costs. Due to the nature of quality costs (as presented in
chapter 4) and according to my experiences obtained during the study, the true
costs of quality related can be considered to be higher.
100
In the case company, existing quality-based costs can be assessed to be more type
of avoidable cost of quality than necessary costs of quality. This stands for the
estimation that more money is spent to fix the quality failures already happened
than used to prevent them to happen. So called external failure costs (costs to
correct mistakes detected by a customer) are thus very dominant.
To be able to decrease the costs of poor quality, there are some obvious issues that
should be taken into consideration in the case company. Firstly, totally new in-
process inspections should be added and secondly while the amount of purchased
goods is remarkable, incoming inspection process for critical components should
be re-considered. In addition, not enough resources are allocated to preventive
work at a sufficient level. One way to add workers interest in quality costs is to
make all scrap and defected products visible. This helps them to pay more
attention on the quality of correct execution of their work.
As it is criticized that 100 per cent inspections are totally waste of money, this
claim can, however, be disproved by the utilization of poka-yoke methods. To
make this approach cost efficient also in the case company, existing 100 % final
inspection process for selected products should be replaced with new in-process
inspections. Here the benefits would be much higher, while mistakes could be
corrected almost immediate (minimizing the need for rework) and the feedback of
the failure to the previous process is faster.
101
9 CONCLUSIONS
How can all defects in complex manufacturing as well as in everyday living
activities be prevented when the most of them are, at some level, caused by
human errors? This question has been in the major role during this study. Case
company produces mass customized products, which causes that the number of
different kind of end-products is very high. The objective of mass customization
is to maximize the service level of the manufacturer and keep lead times at very
competitive level. However, due to large configurability of products, it requires
that lots of emphasis is paid on the correct execution of assembly tasks to avoid
mistakes from occurring, especially in the production environment where the level
of automation is considerably low.
One of the main objectives of this study was to define ways and methods how to
tackle against continuous and increasing number of quality failures. For this
purpose the poka-yoke methodology was chosen. As the theoretical part has
already shown, the use of poka-yoke methodology can be justified with two
absolute arguments: firstly, it is an effective method for eliminating human errors
and secondly, because of its true nature at aiming ambitiously towards preventive
mode of mistake-proofing.
The analyses conducted in this study were mainly quantitative. Suitability for the
purposes of this study and for further use in the case company the information
analyses provided can be regarded remarkable valuable. This was the first time
case company was able to have such a detailed information about overall quality
failures, defect distribution by products and production teams, and origin of faults,
just to name a few. With the help of this information it is now possible to
prioritize development actions effectively. However, if continuing to utilize the
results of the analyses in the future, reporting systems regarding quality failure
monitoring needs urgent updating or the work done during this study remains
102
untapped. Issues related to these actions are discussed more thoroughly in section
8.3.
The effectiveness of poka-yoke methods is based on inspection techniques
(discussed in chapter 2). In the ideal state they are sort of invisible checks,
executed by operator or some automated system, which verify the correct
execution of process step and the quality of product. If contrasting the principles
of poka-yoke methodology with results of quality analyses we can find clear
connections between them. These connections are summarized in the following
figure.
Figure 37. Summary of mistake-proofing efforts in the case company.
As the summary obviously shows, the main area for quality improvement efforts
can be found from the final assembly where most of the quality failures take
place. This stage lacks most of the methods for detecting mistakes and operator's
responsibility for the correct execution is high. However, testing and calibration
processes utilize mistake-proofing methods already very well at some level. In the
103
future the importance of this stage should be increased even further. Most
importantly, the efforts on final assembly and supplier related issues should be
raised into the new level. As more and more parts and assemblies are acquired
from outside, it is important to detect possible quality non-conformances before
they are taken into manufacturing processes in-house. The choice for specific
mistake-proofing method for individual cases depends on the application and the
stage of the manufacturing process. However, in the end of the manufacturing
process poka-yokes should be more in type of control or shut down instead of
warning, to prevent faulty units proceeding to customer.
In the organizational point of view raising mistake-proofing efforts as a common
concept in the case company is of utmost importance. It is not only a method for
production and quality departments but also for other interest groups to start
thinking in a preventive mode in quality related issues.
Even though this study concentrates only on examining the suitability of poka-
yoke methodology to the quality issues faced in the case company, we can't forget
the fact, that the chosen methodology is just one among many others quality
control techniques. Best results in quality improvement activities can be achieved
by combining best practices from different methods and applying them into the
needs of the case company.
It is predictable that in the future the markets become more and more competitive
and due to this the importance of quality will have a major role in this game. It
will be those companies, who can satisfy the customer needs by high-quality and
non-faulty products and services and whose internal processes are effective and
fault-free, to survive best. It remains to be seen whether the statistical quality
control methods continue to strengthen its position in the field of quality control
techniques or will the poka-yoke concept start to gain more ground.
104
REFERENCES Andersen, Björn & Fagerhaug, Tom. 2000. Root Cause Analysis: simplified tools
and techniques. Milwaukee: American society for Quality (ASQ). 155 p. ISBN 0-
87389-466-9.
Bayers, P.C. 1994. Using Poka Yoke (Mistake Proofing Devices) to Ensure
Quality. IEEE. pp. 201-204.
Bringslimark, Vivian. 2006. Operator Error: Is It Really the Root Cause of
Performance Problems? Biopharm International, Vol. 19, No 12. pp. 38-46.
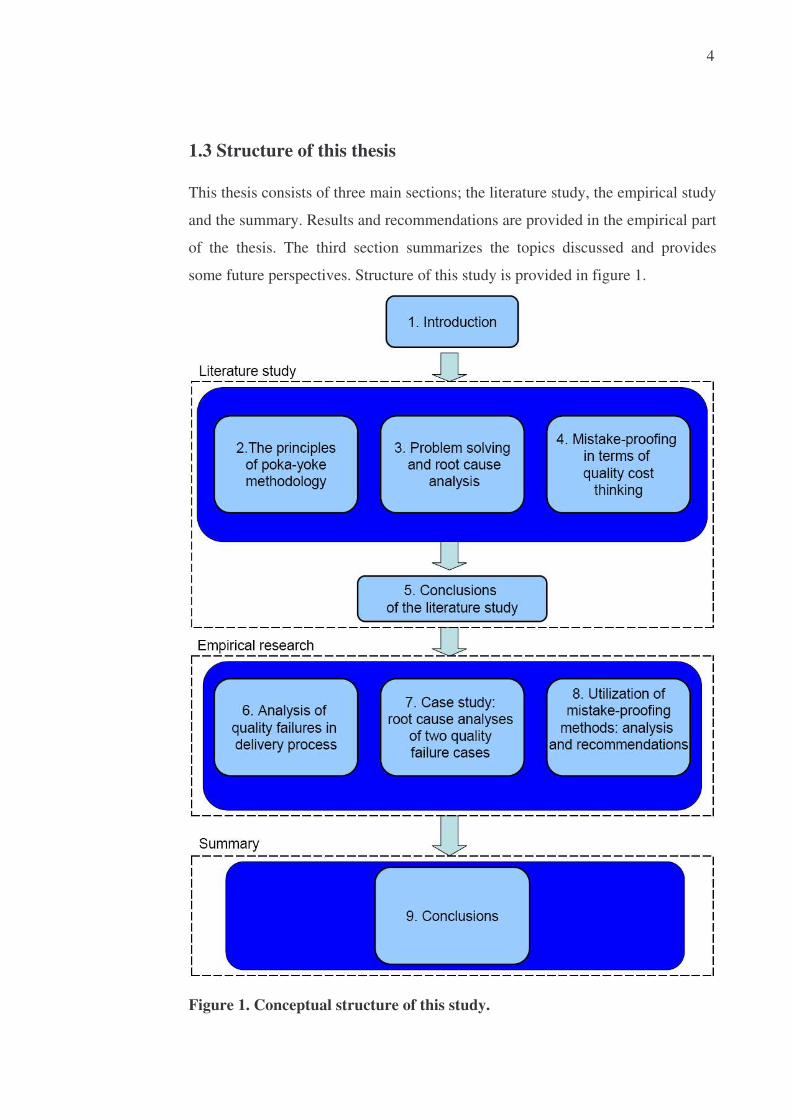
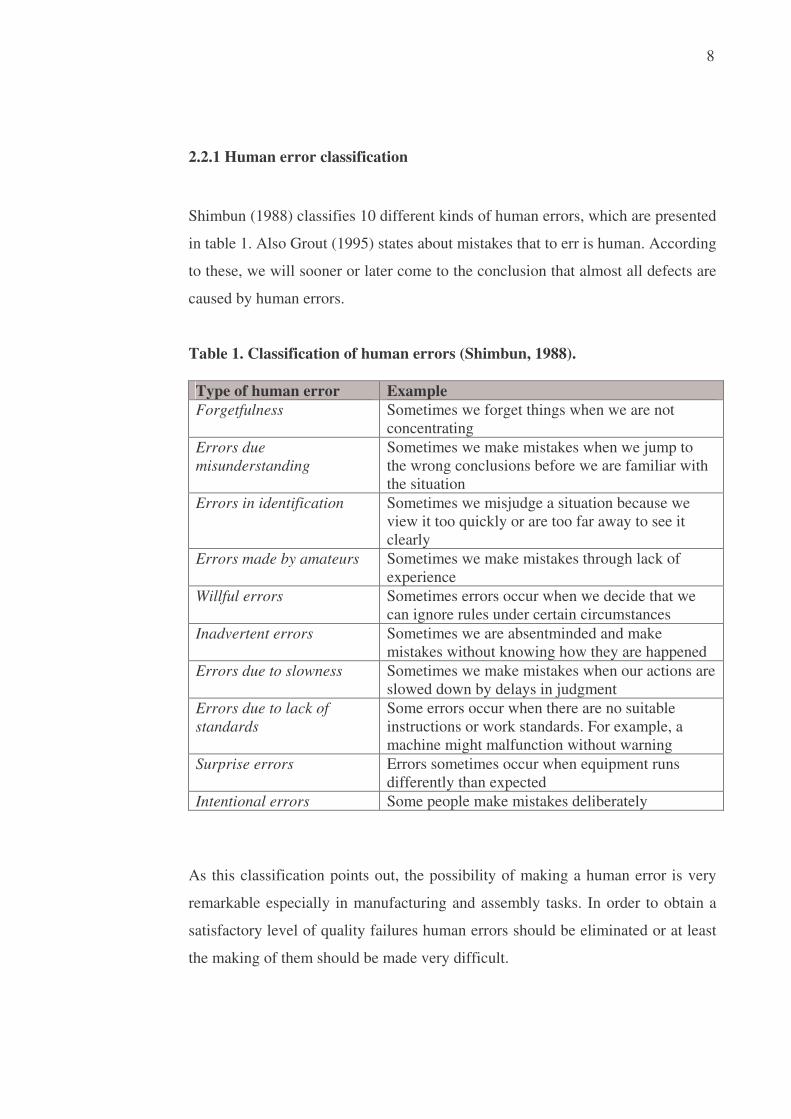
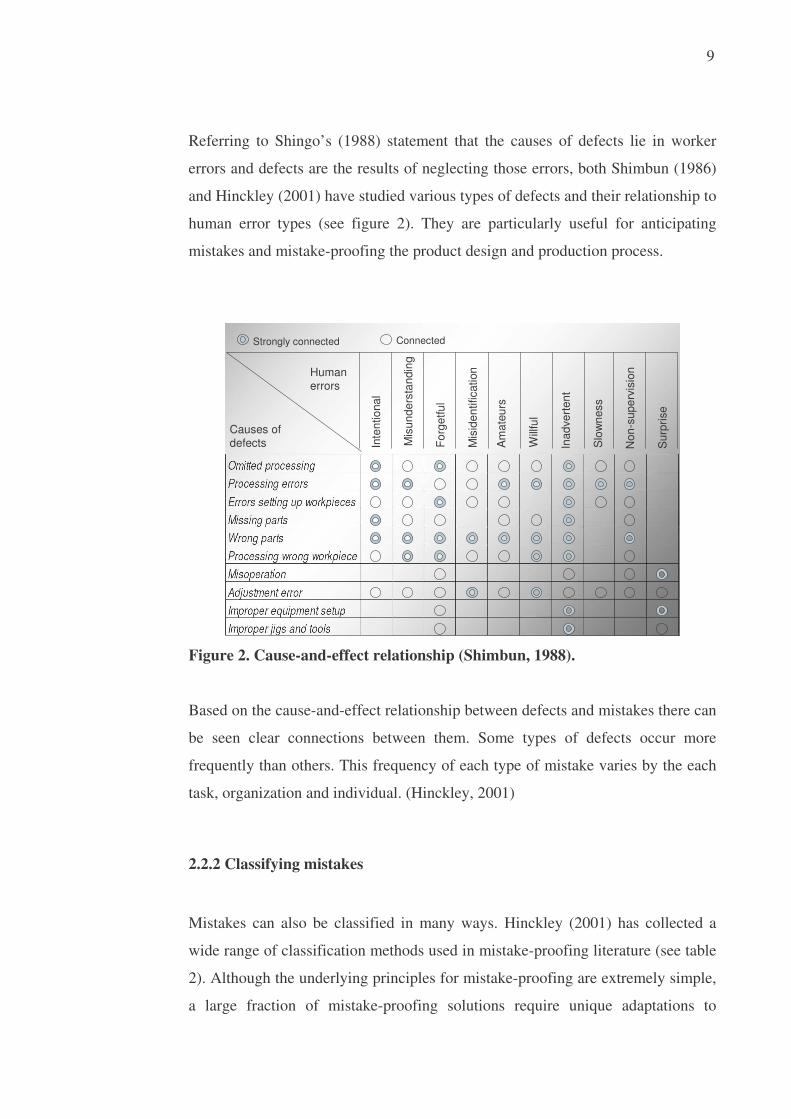
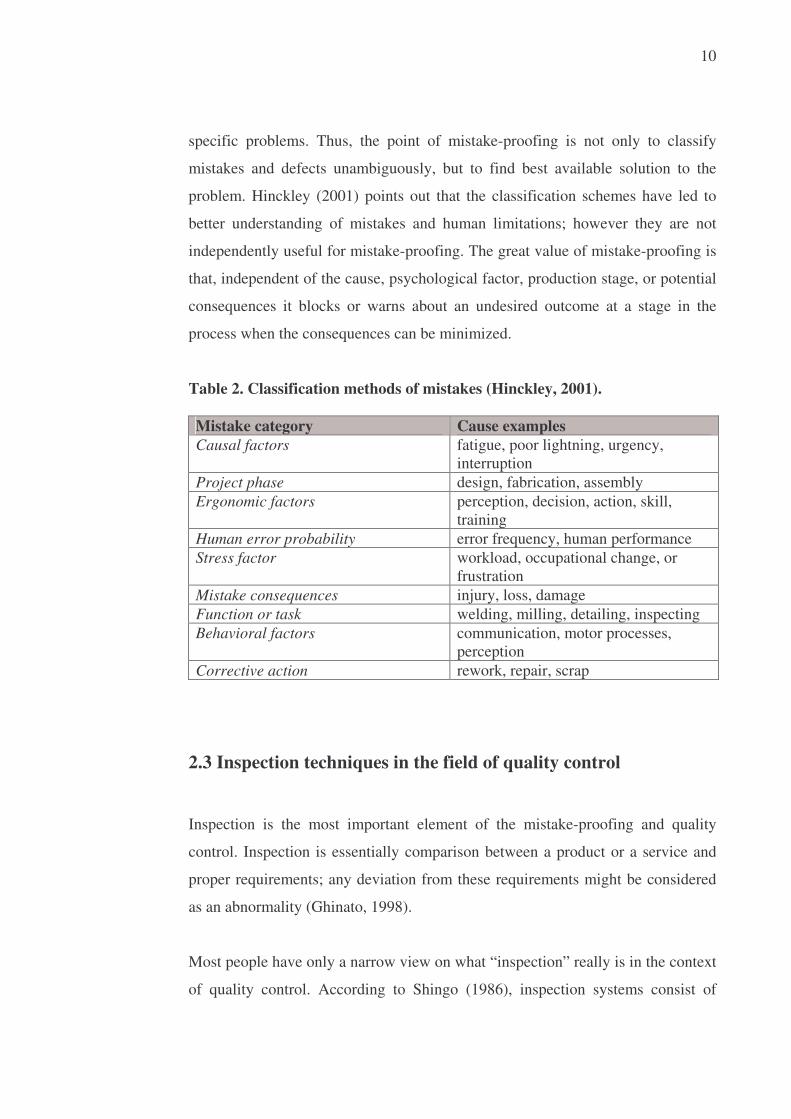
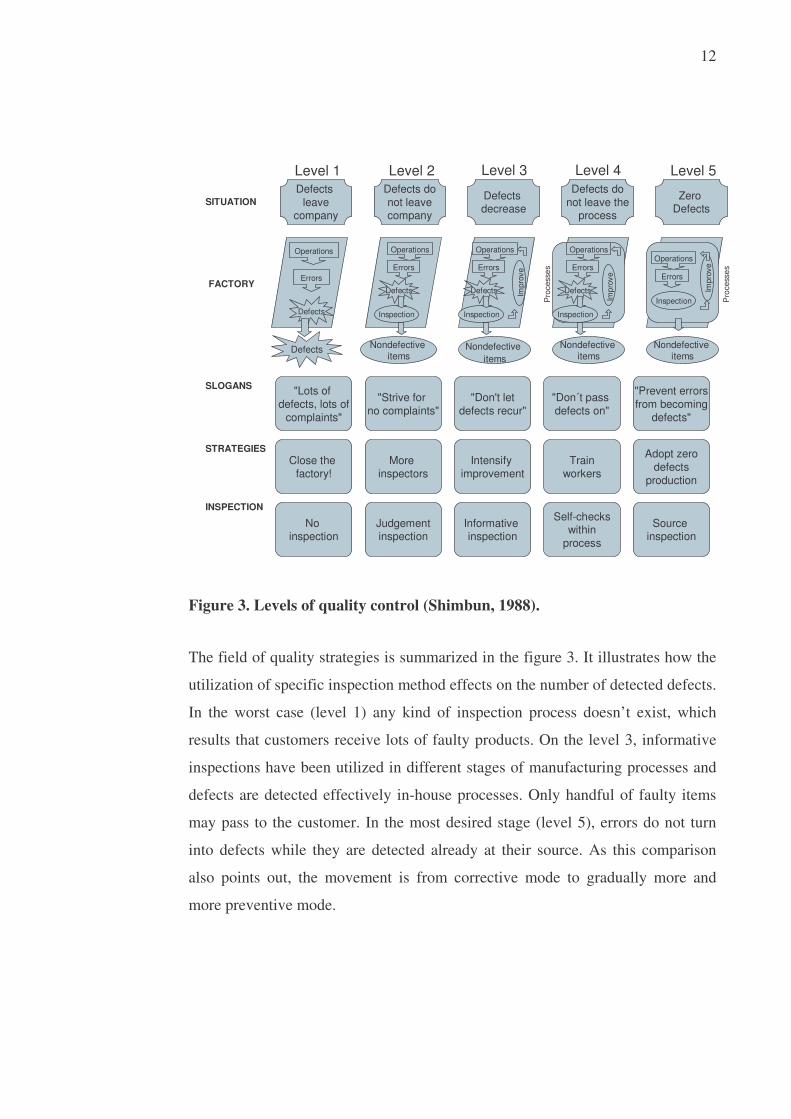
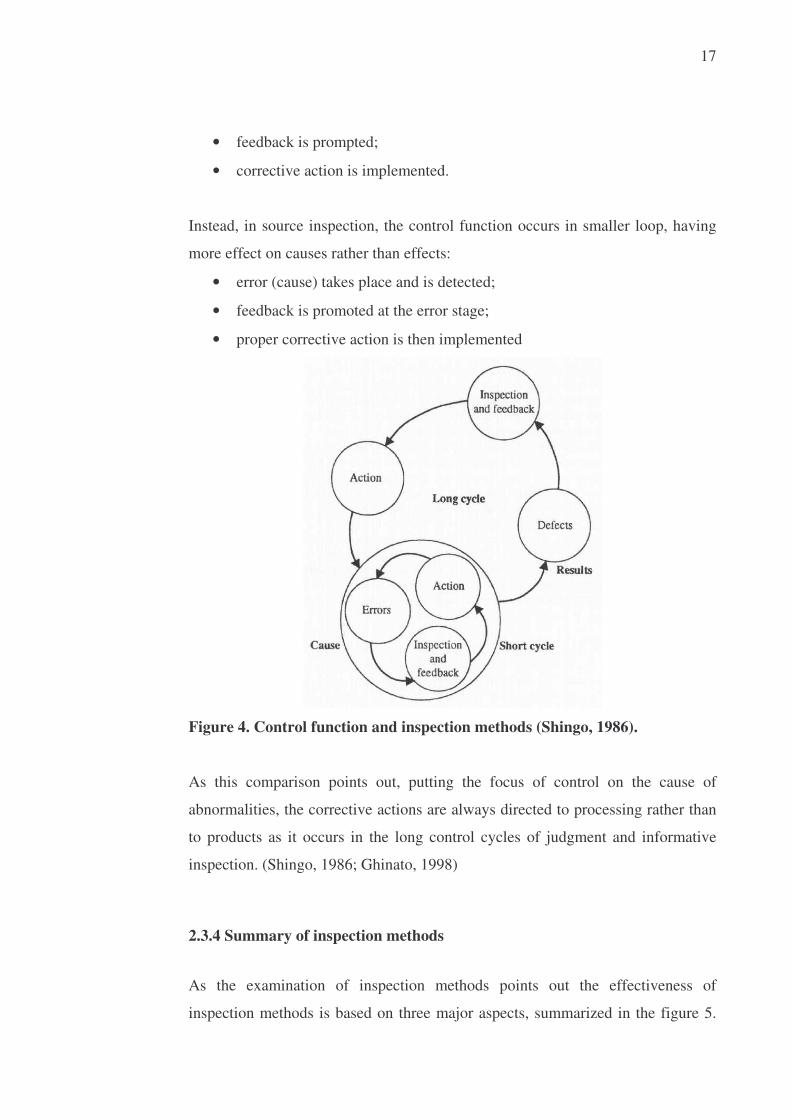
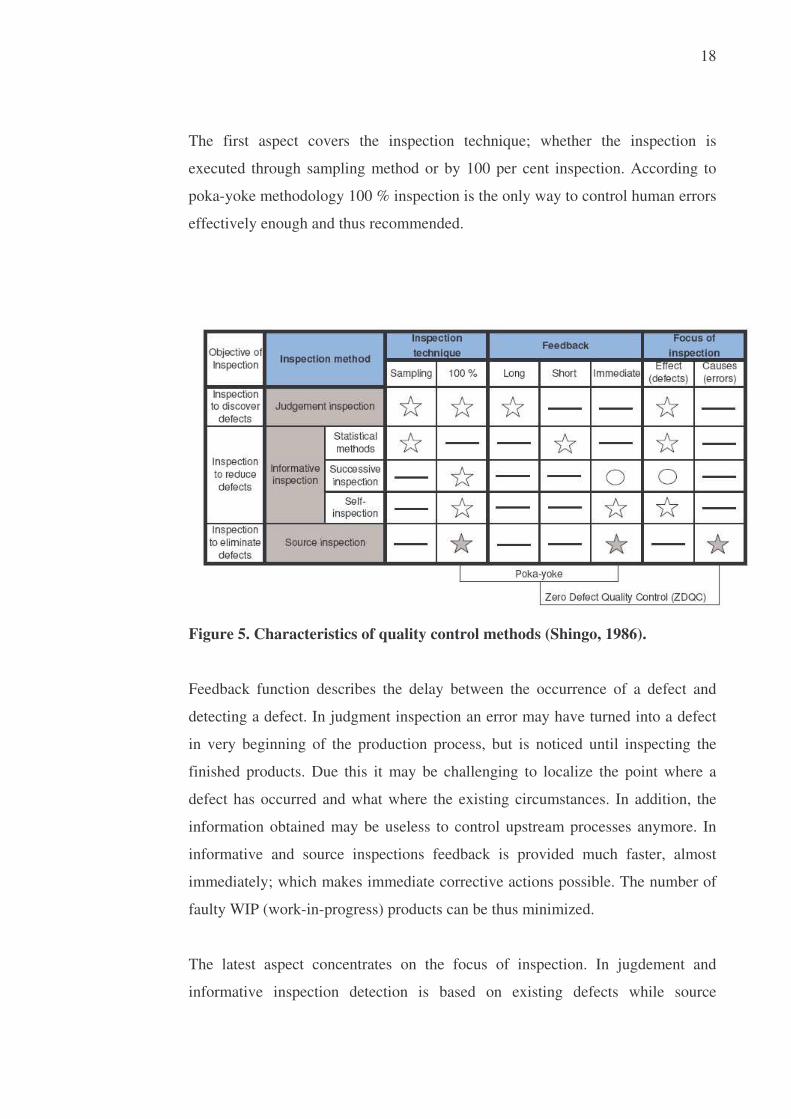
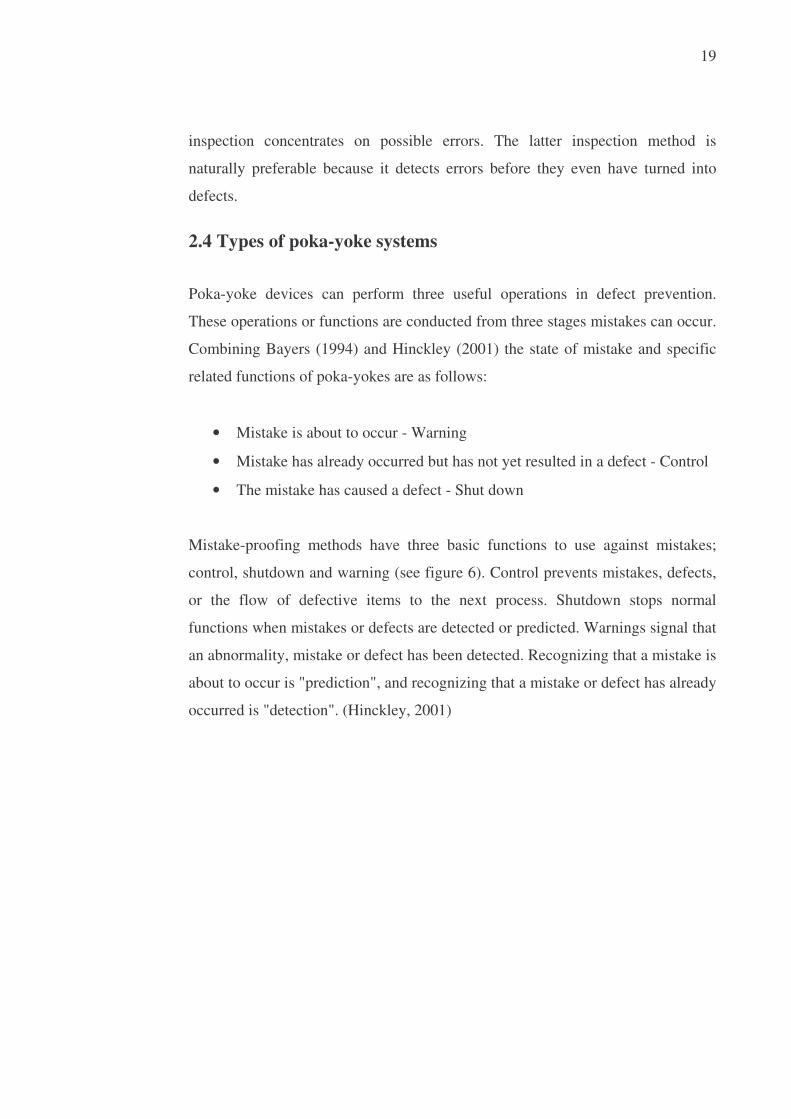
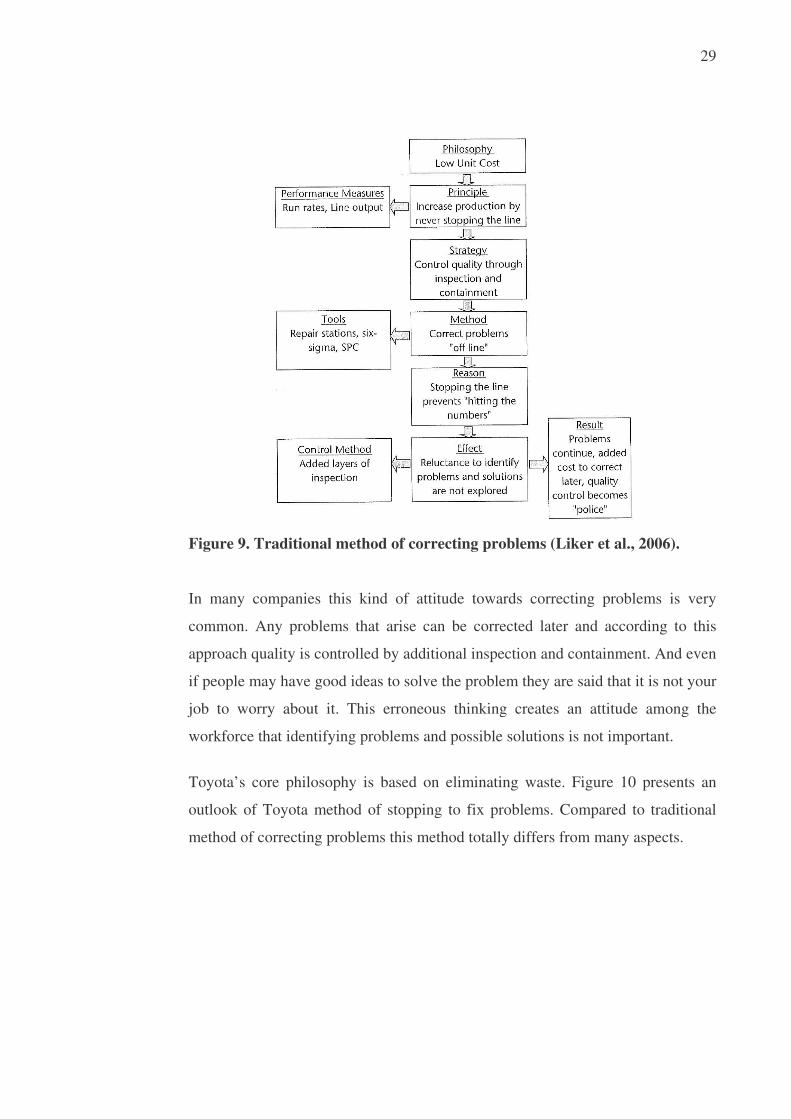
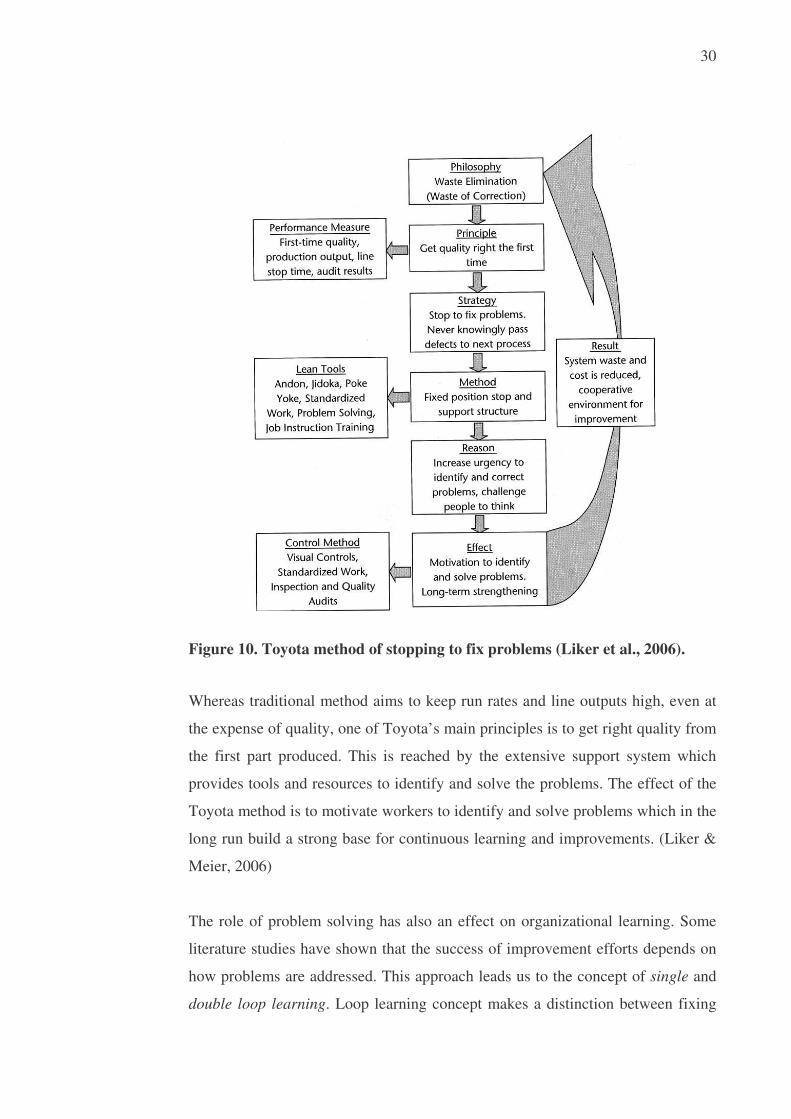
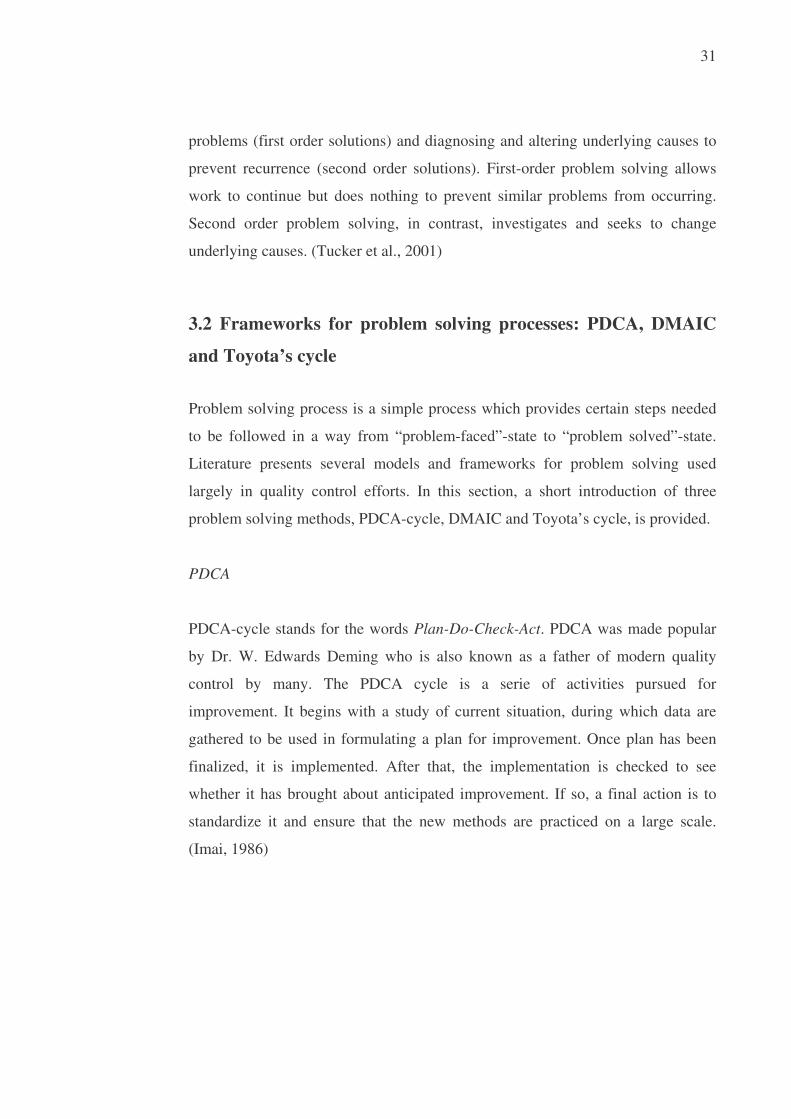
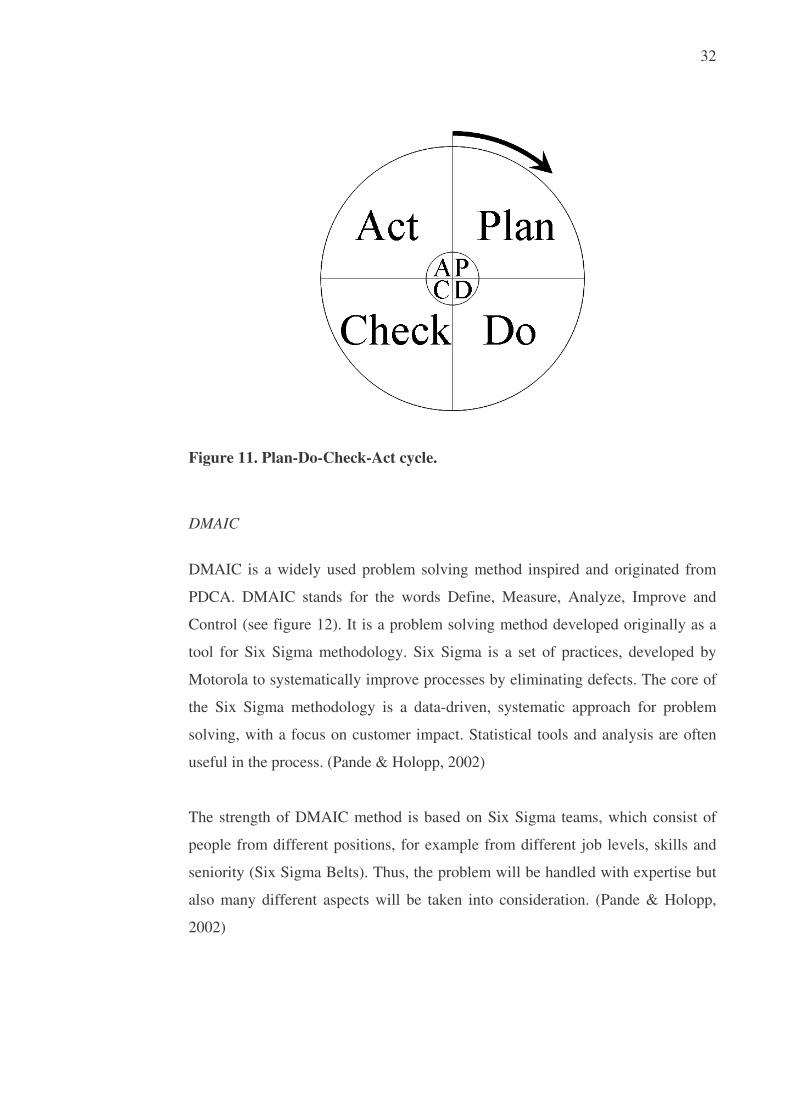
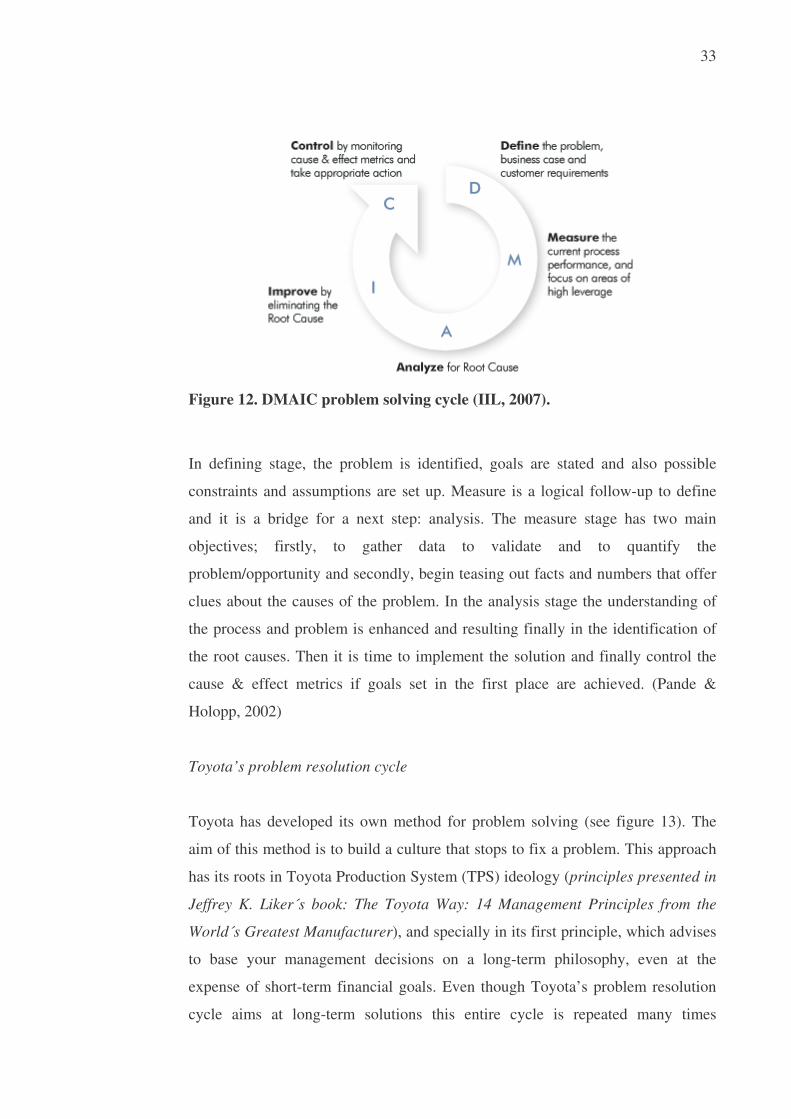
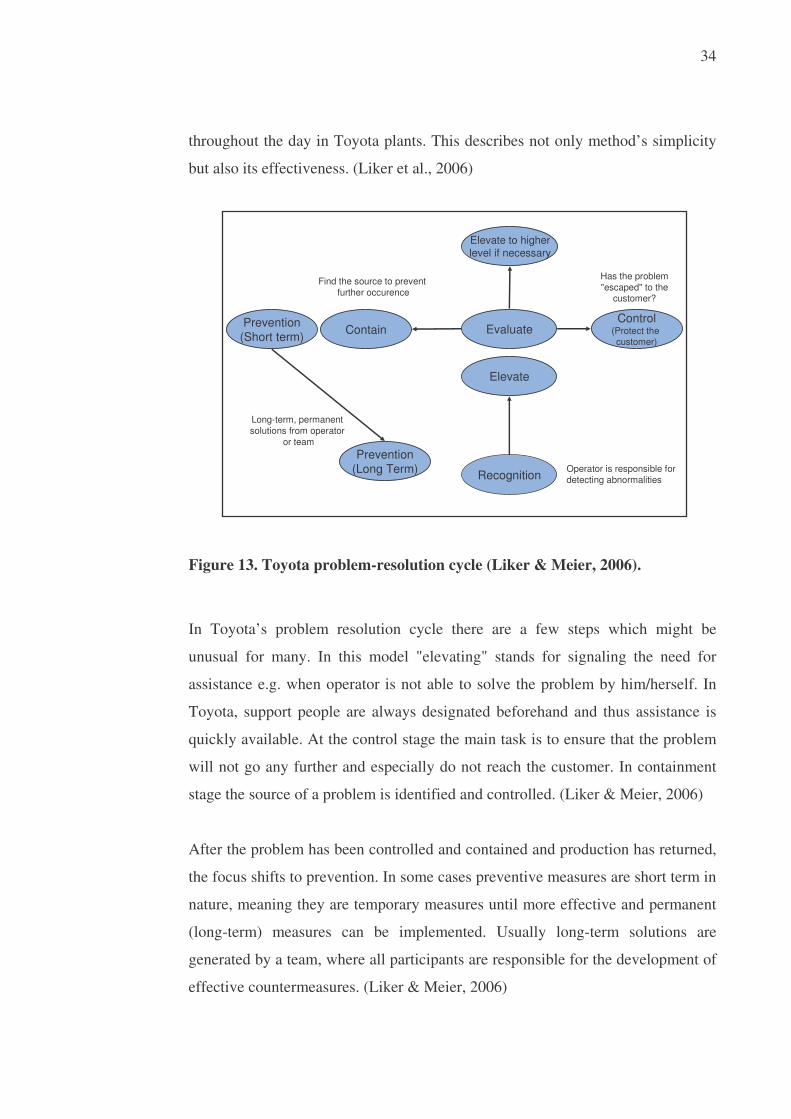
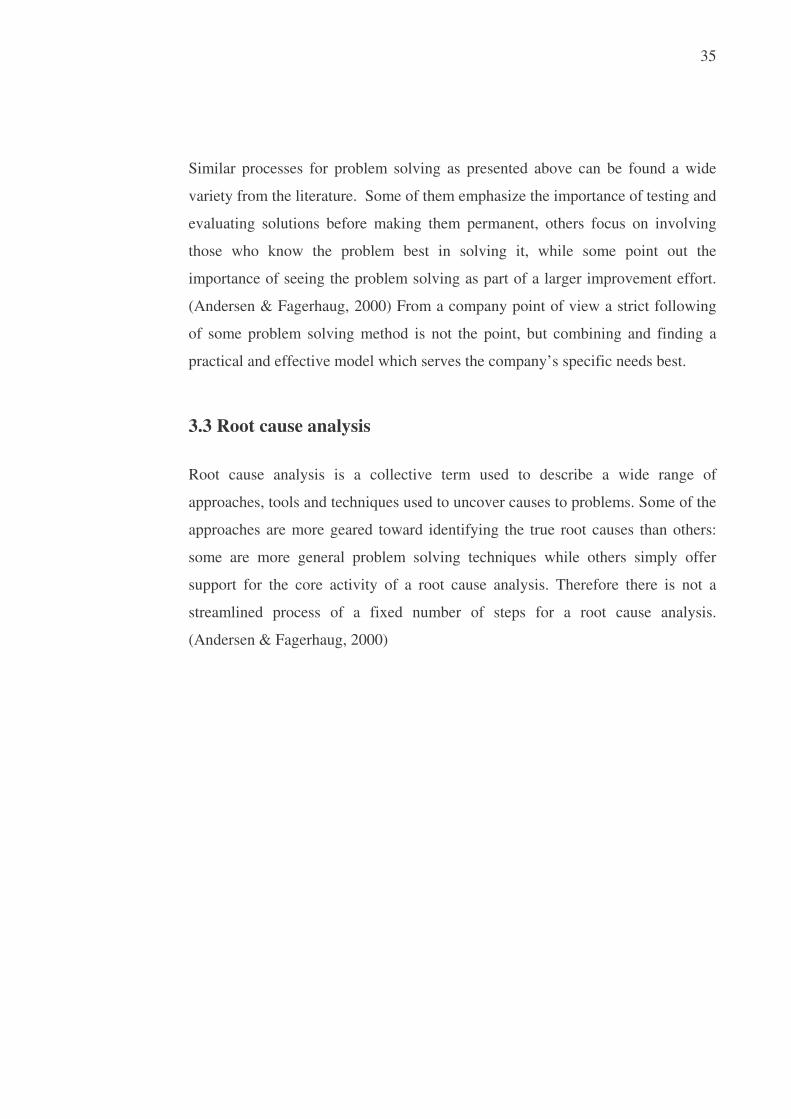
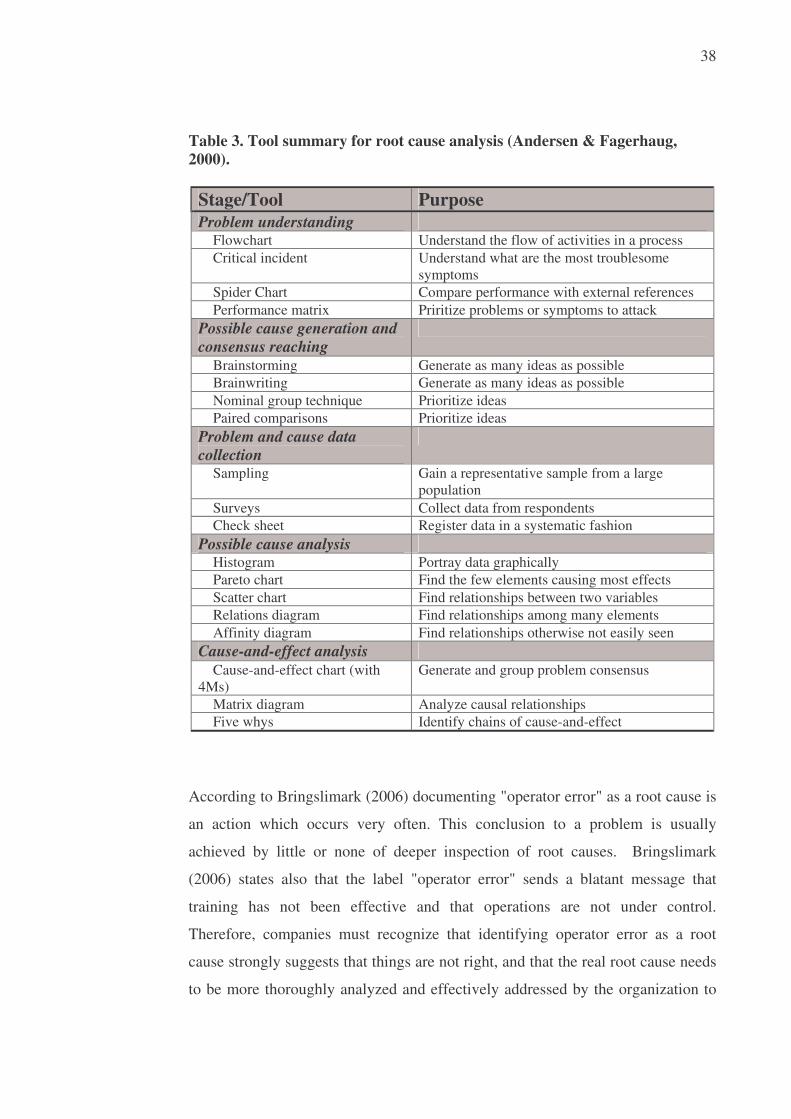
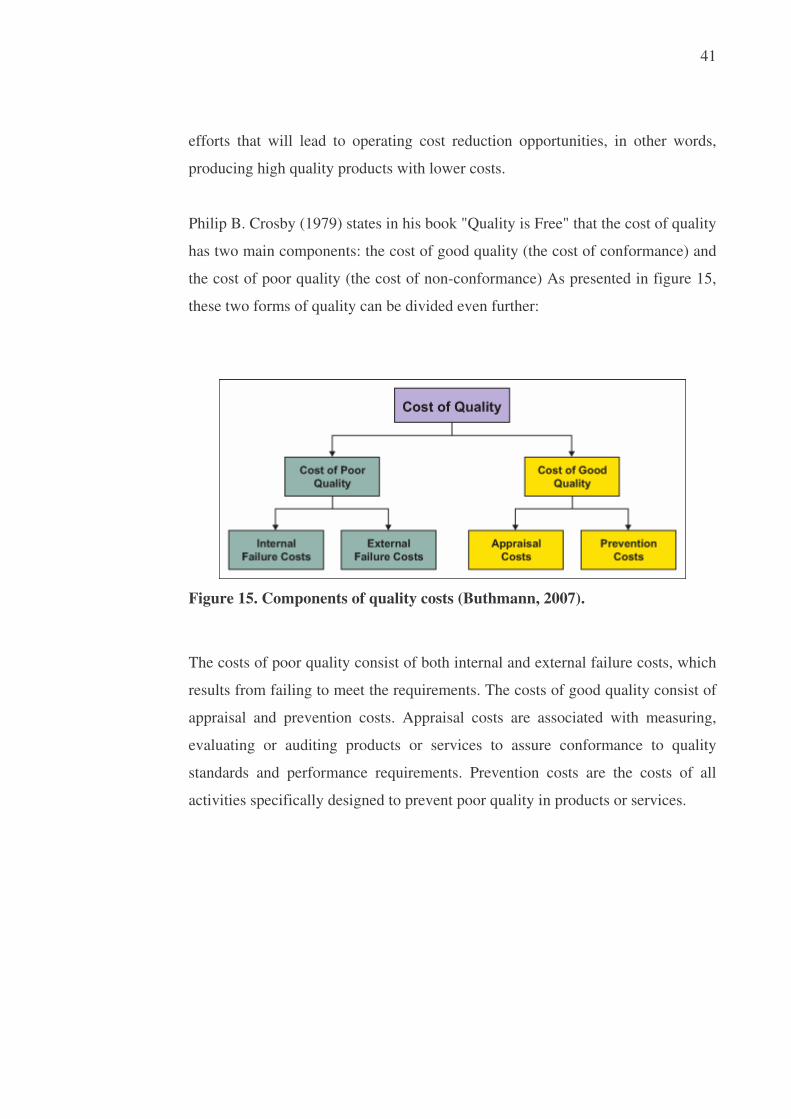
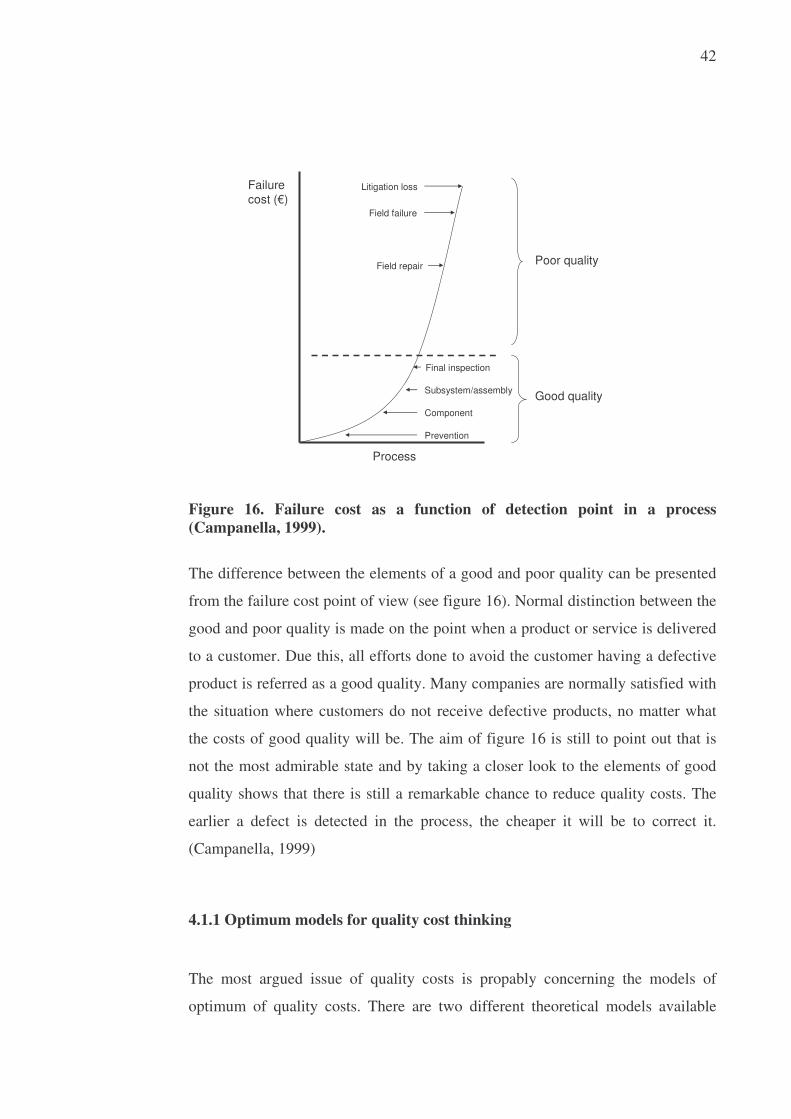
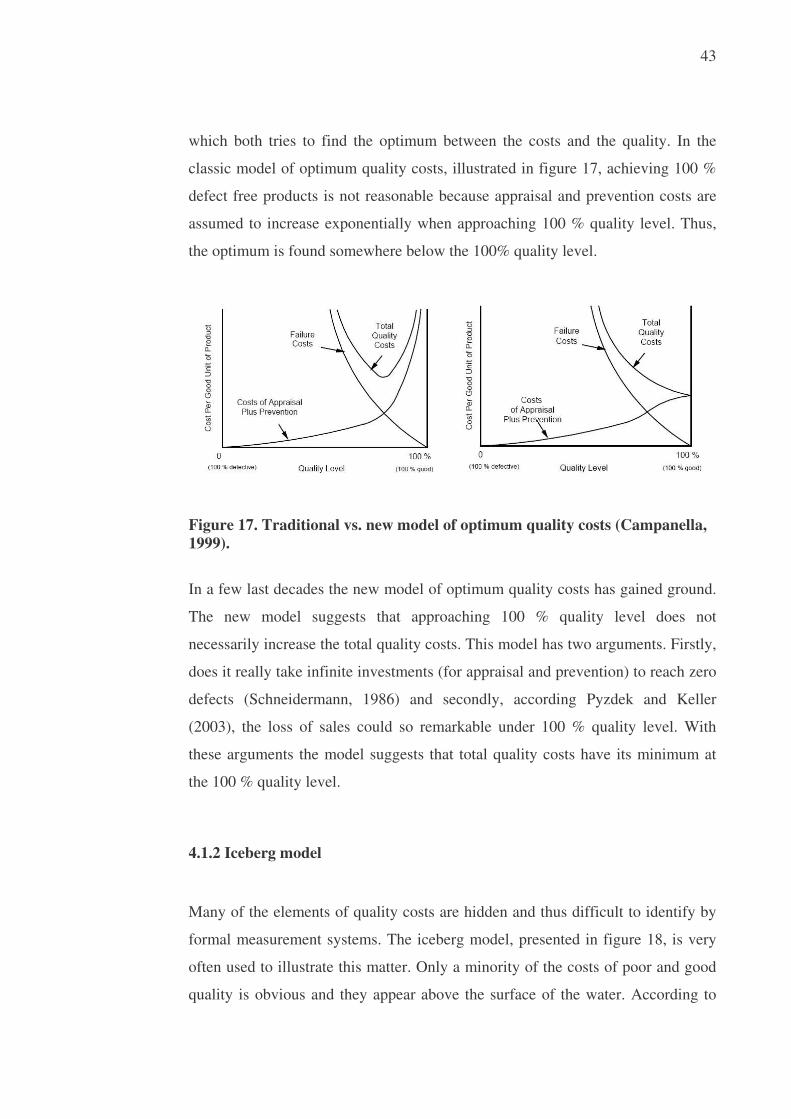
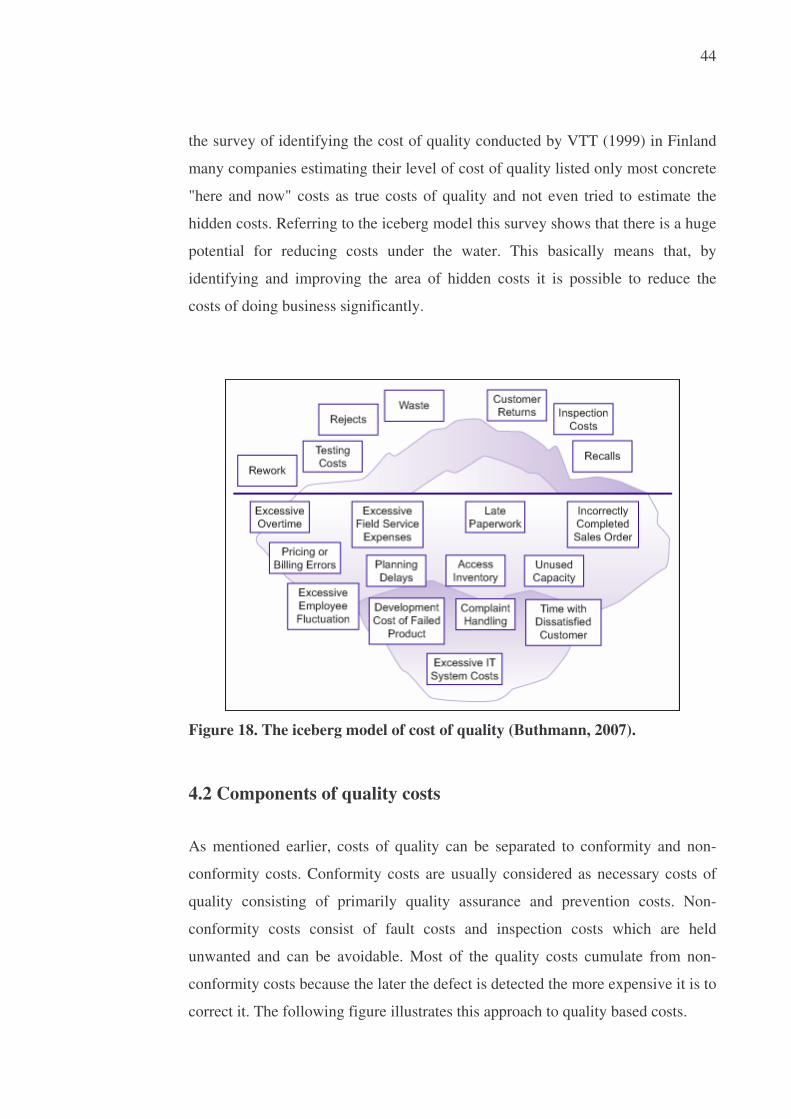
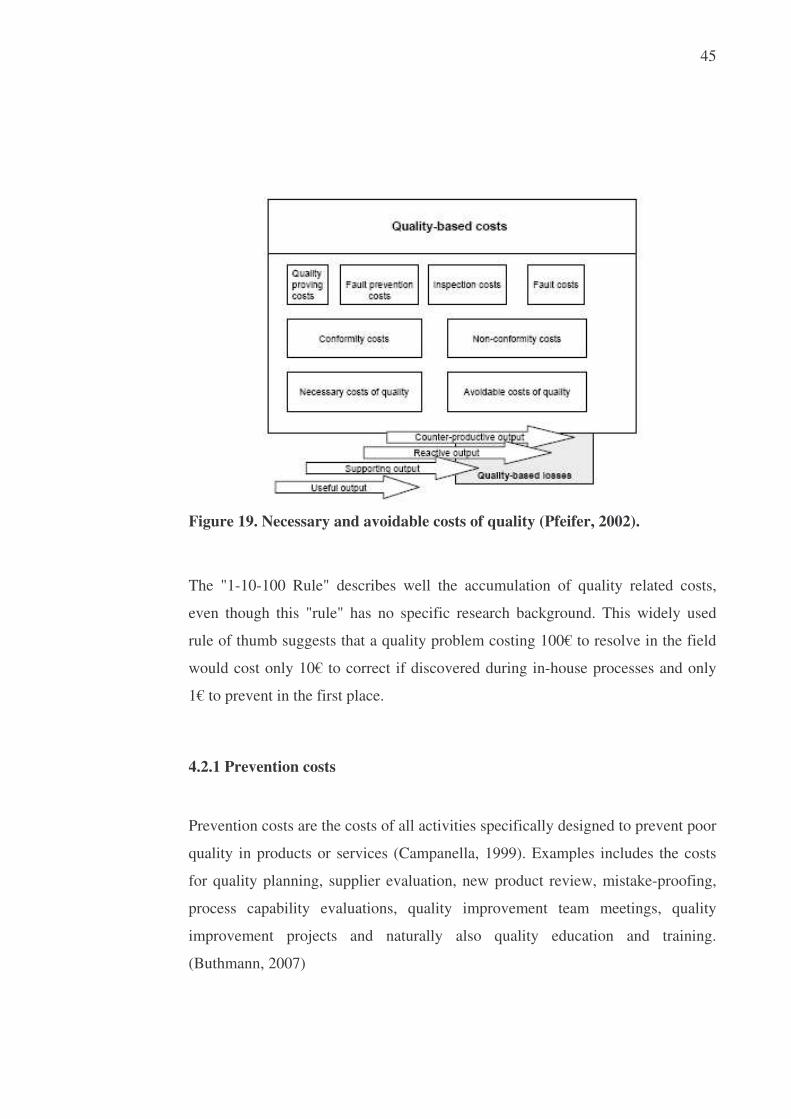
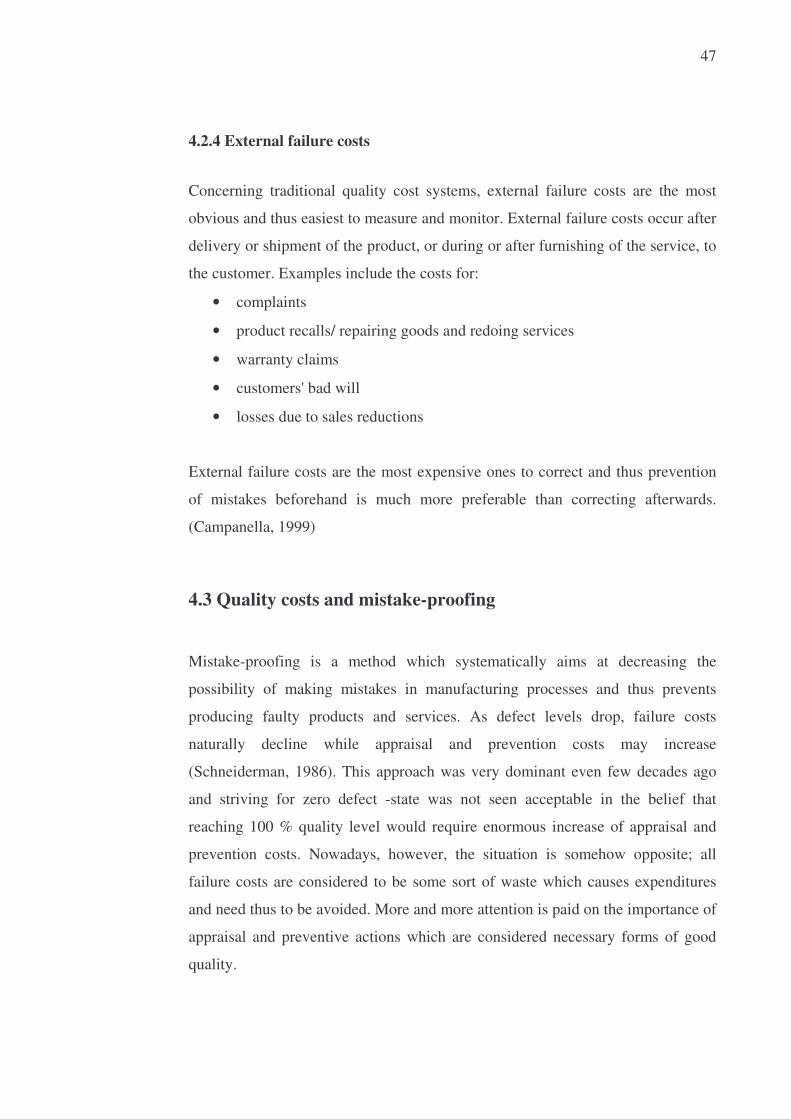
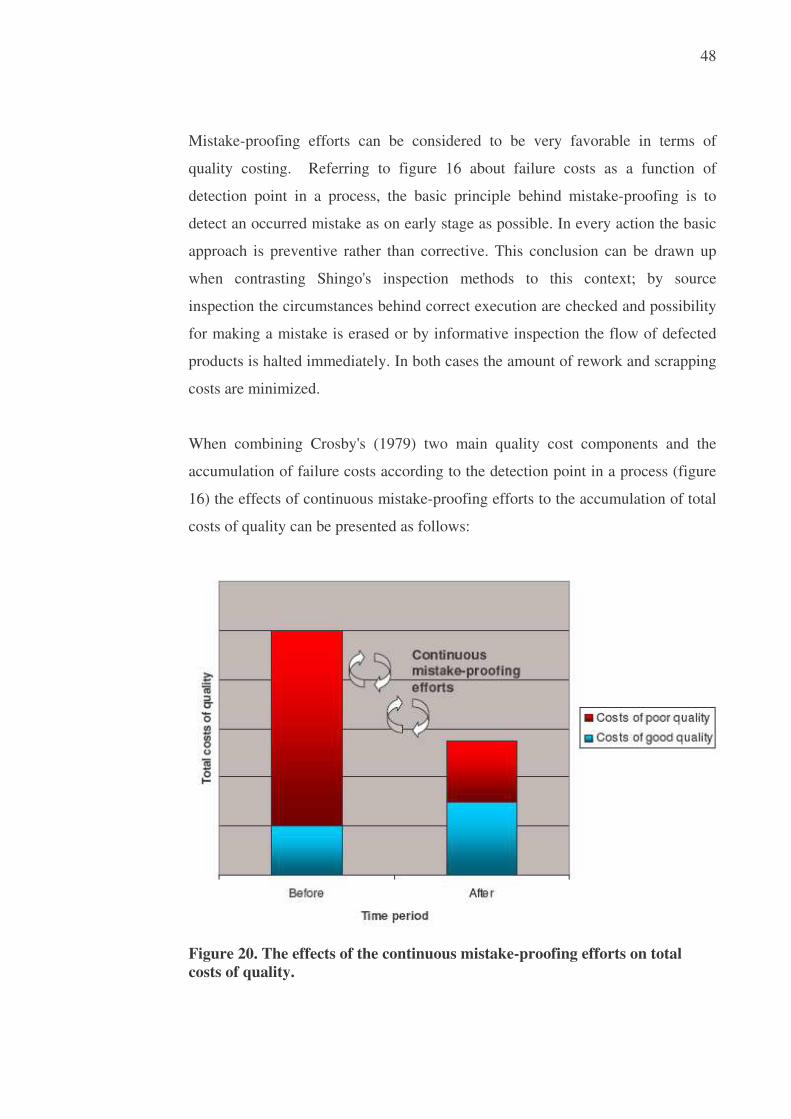
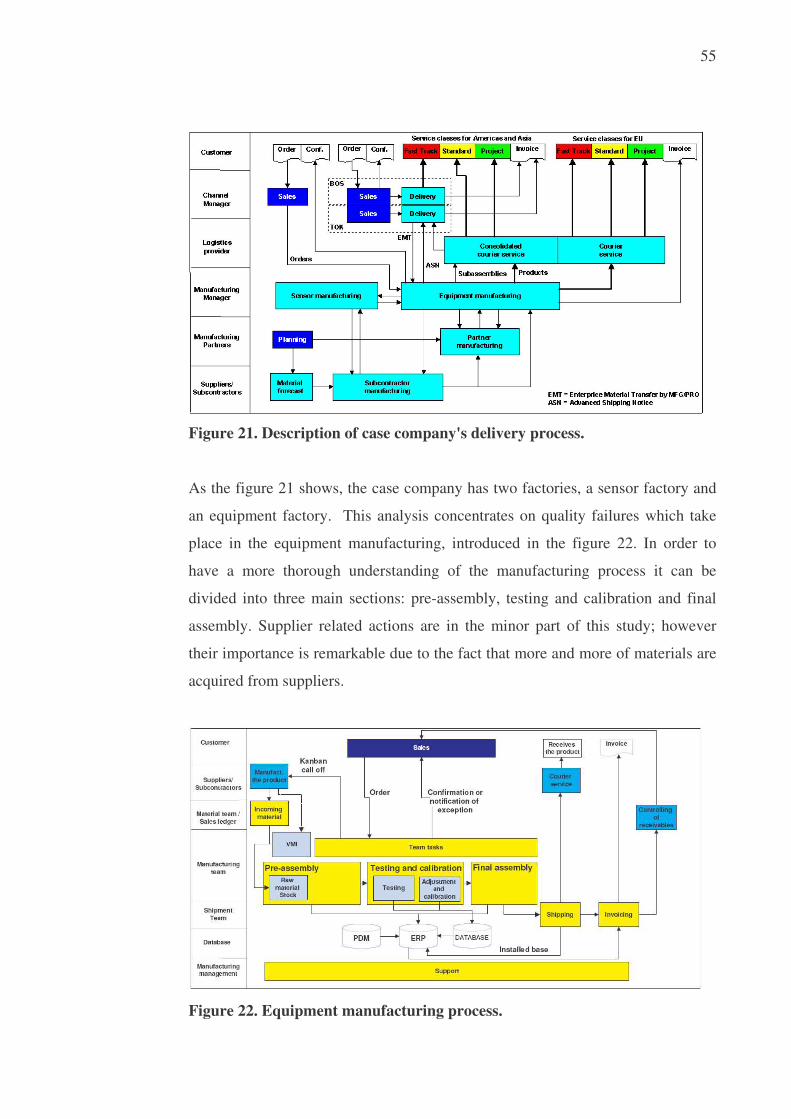
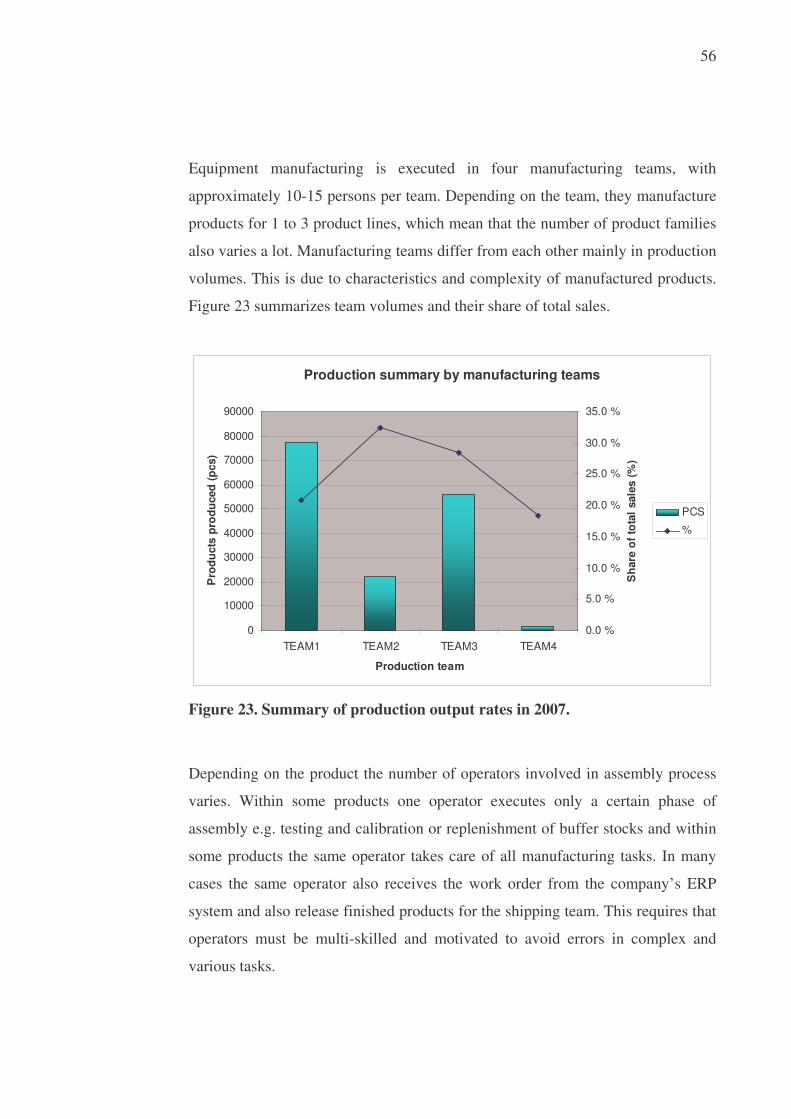
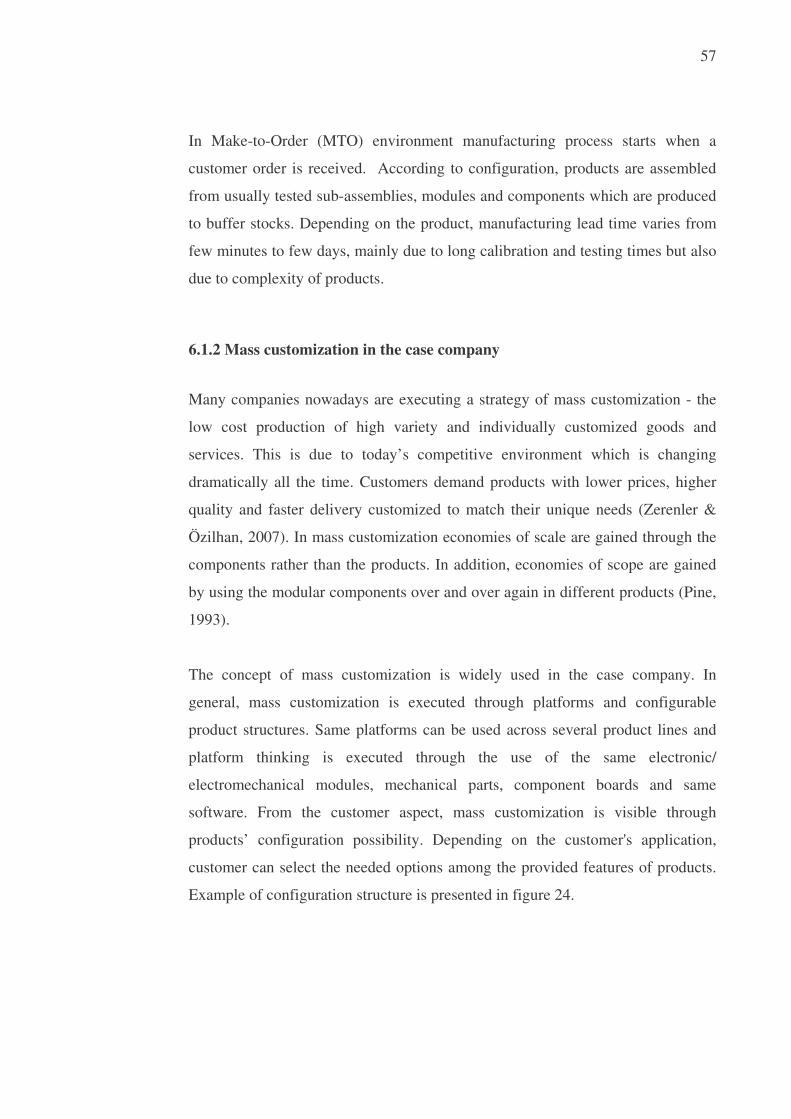
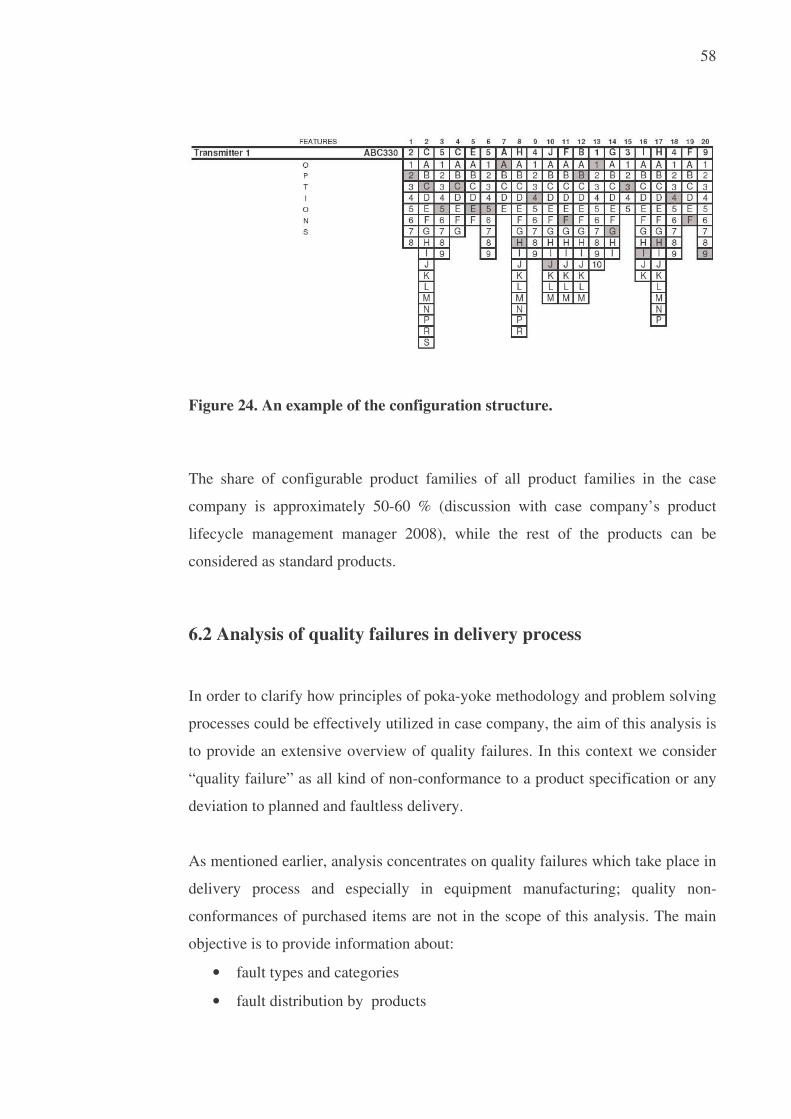
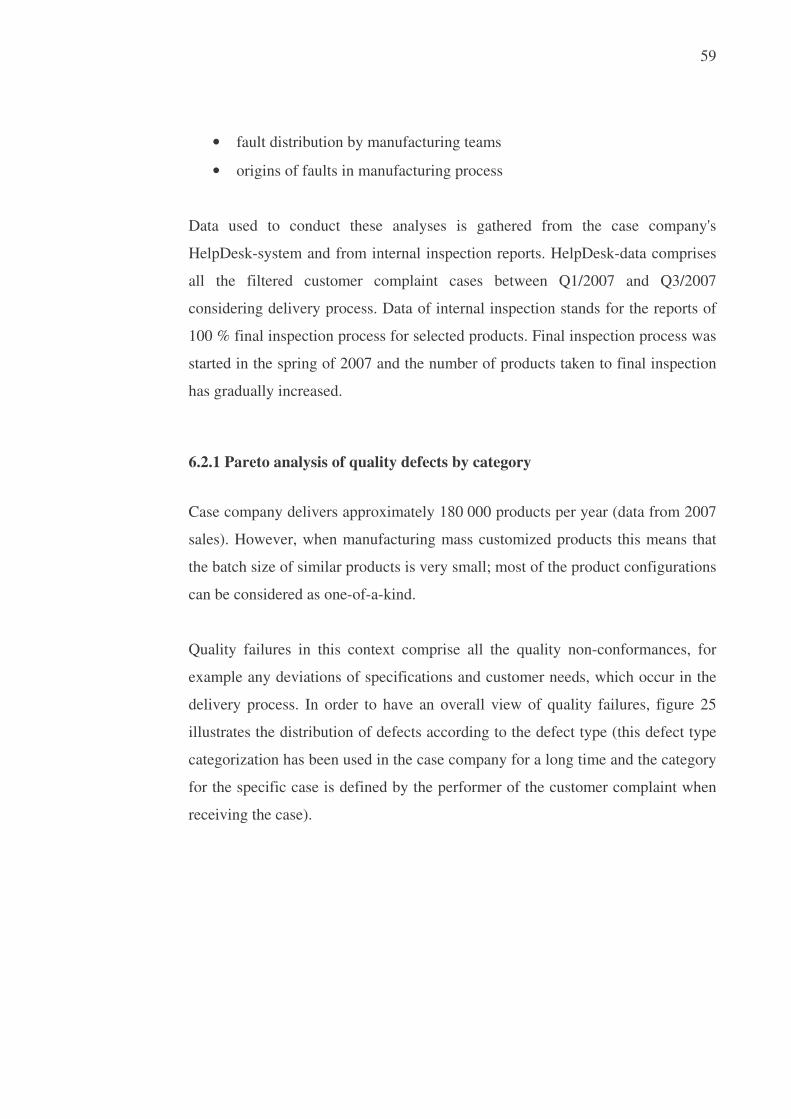
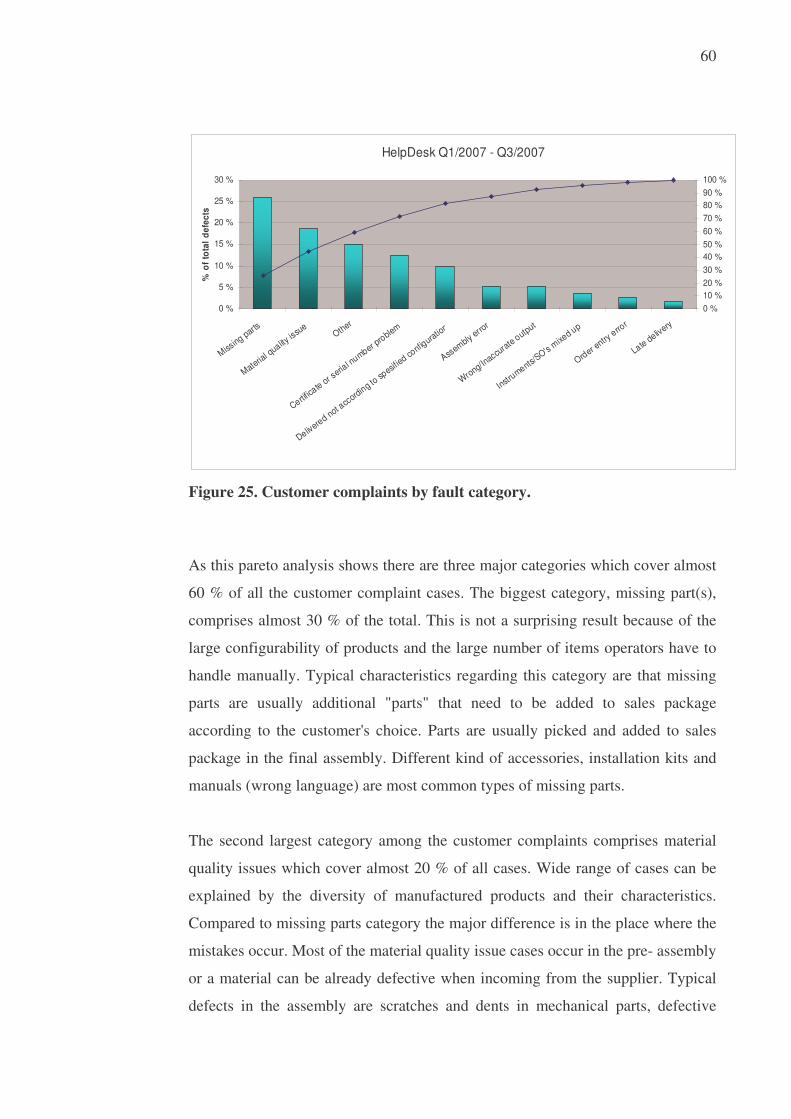
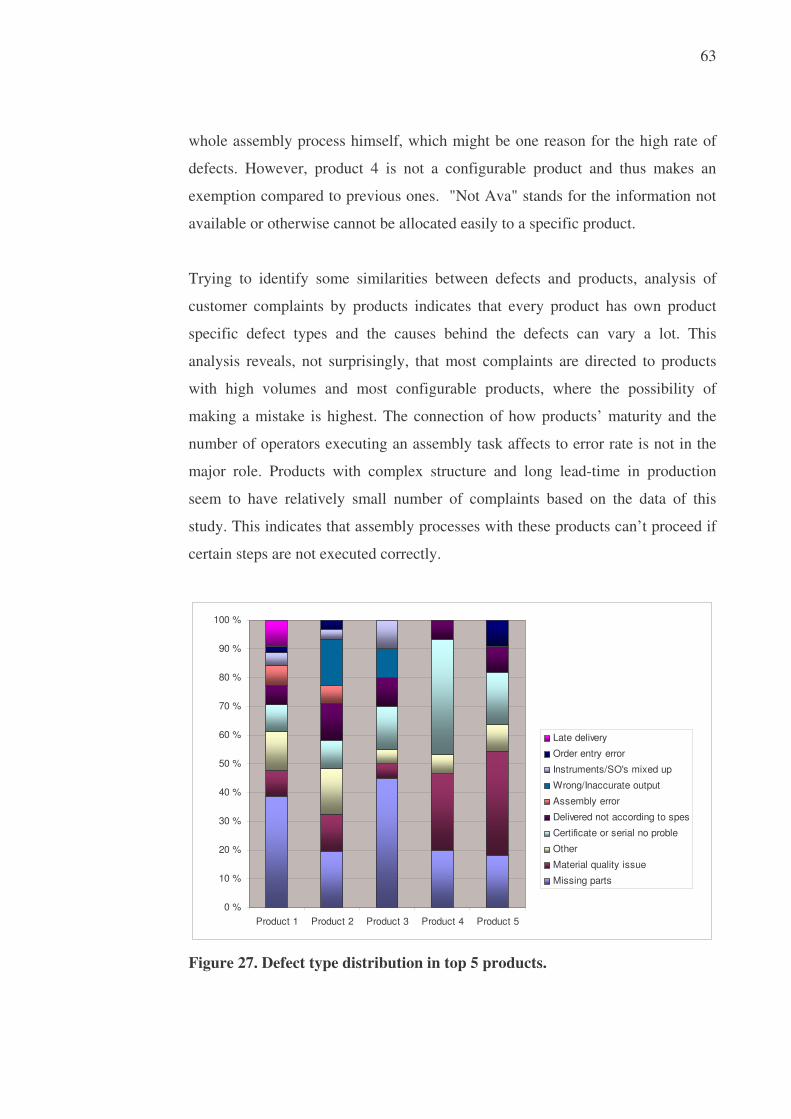
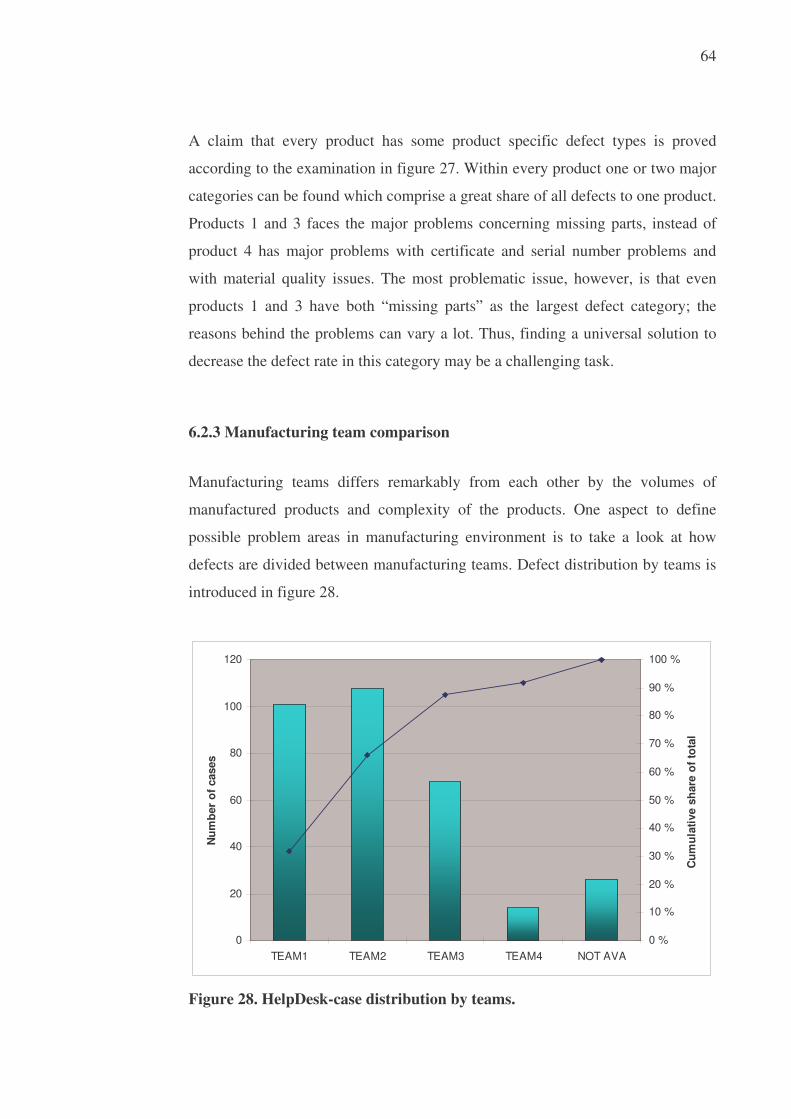
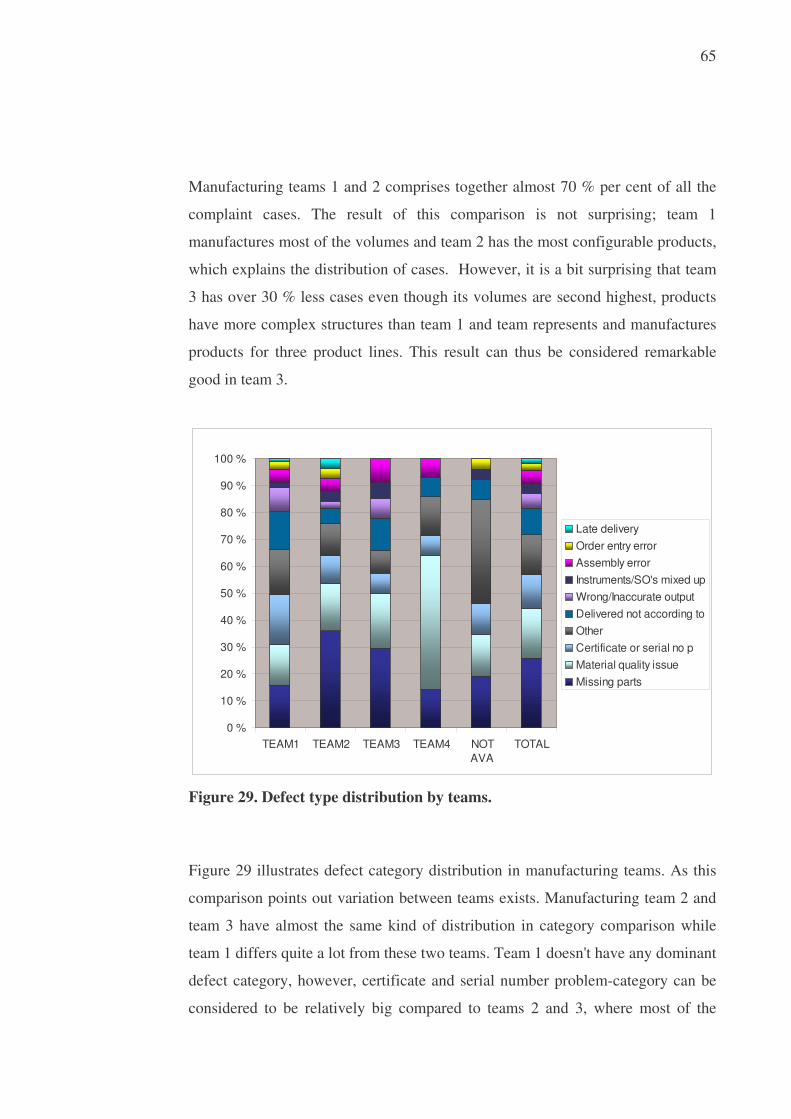
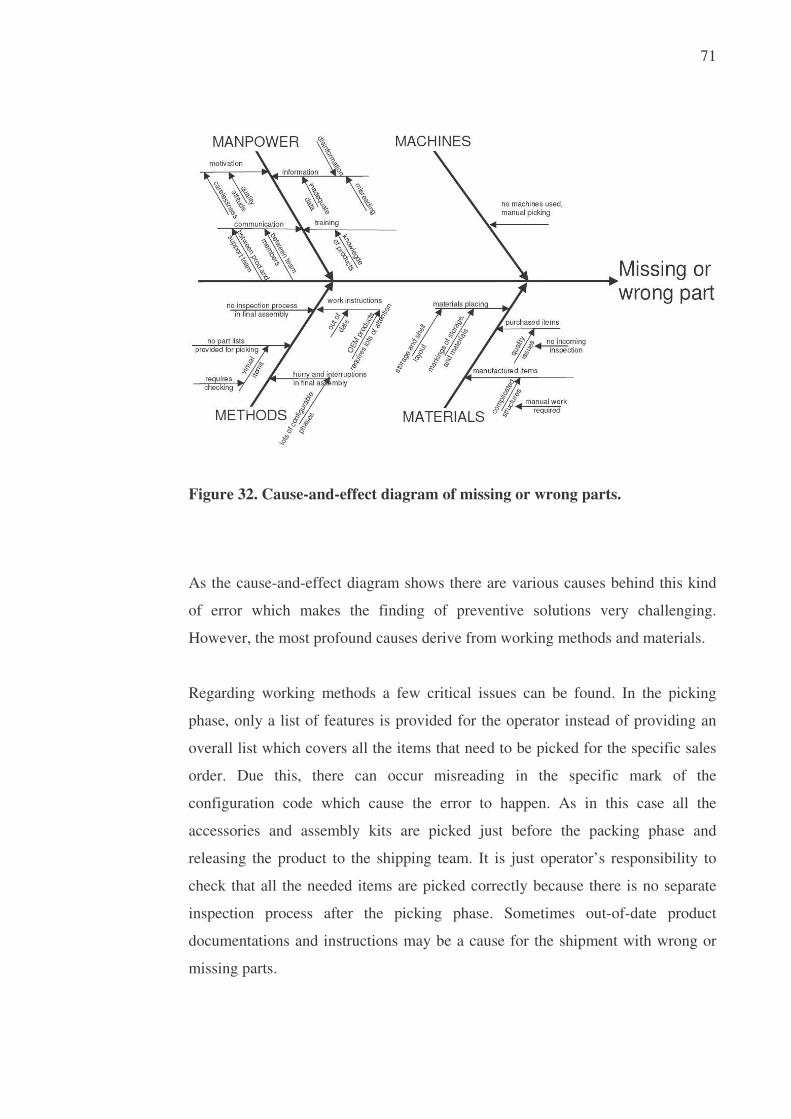
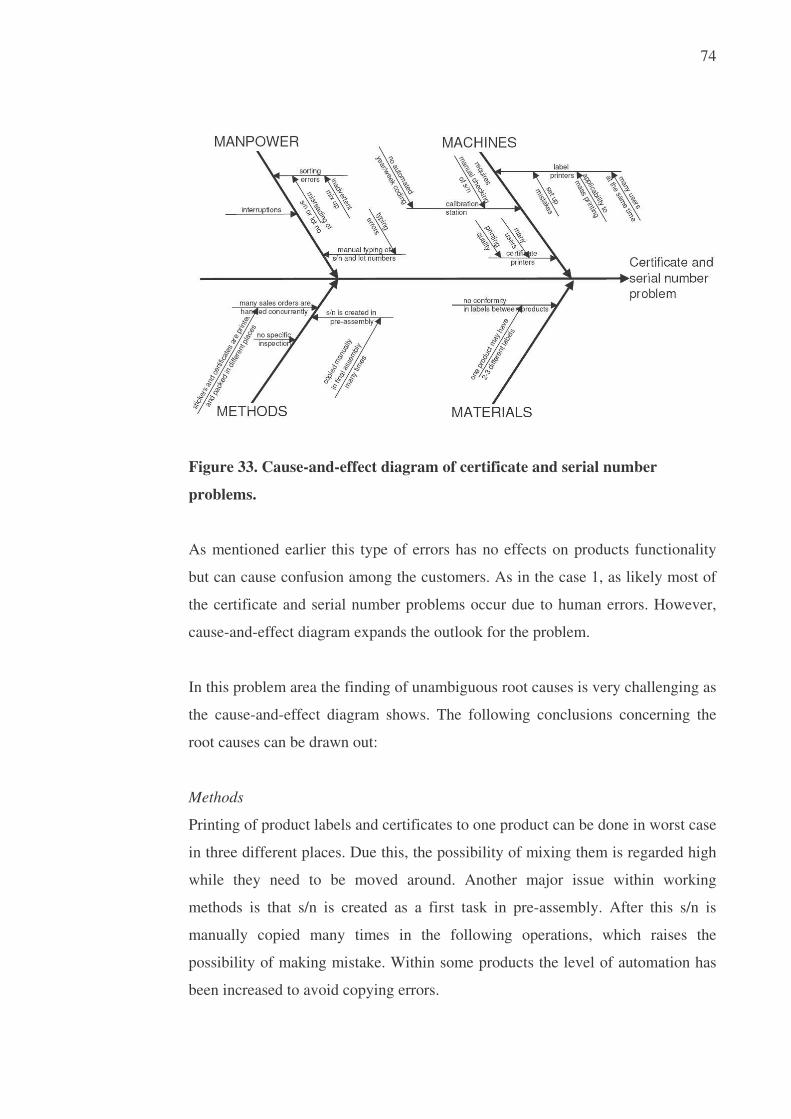
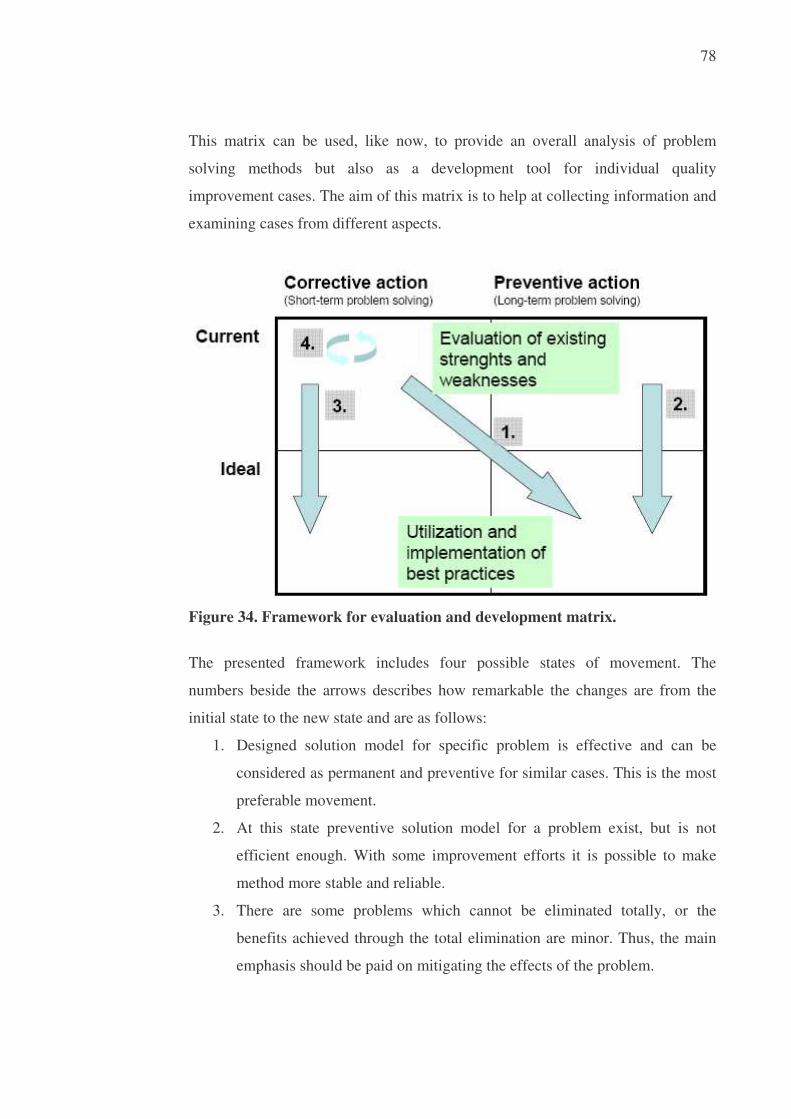
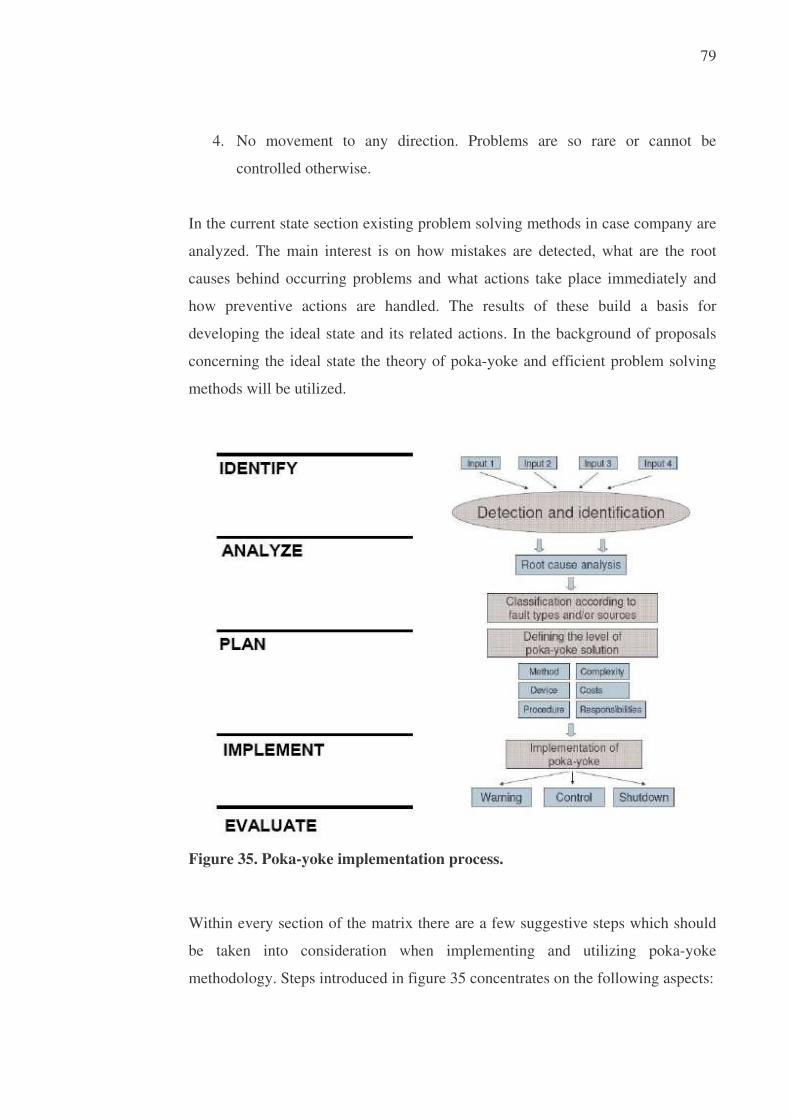
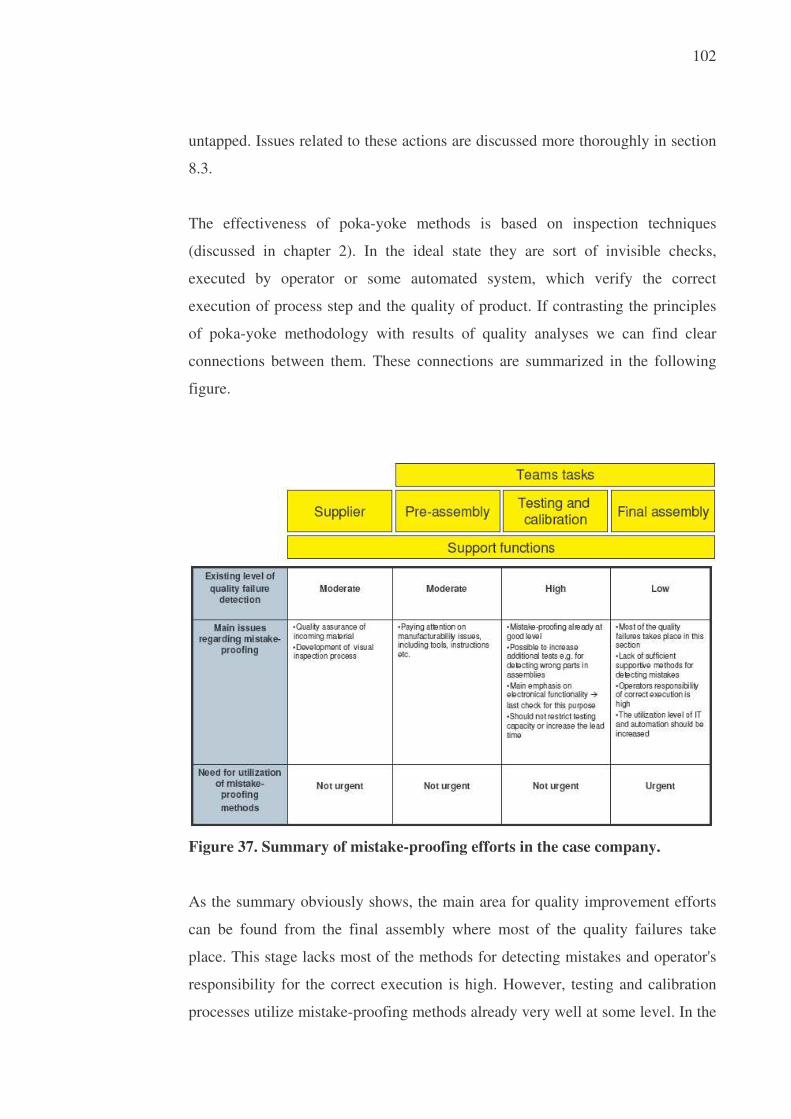


![Masy neutrin – metody nieoscylacyjneneutrino.fuw.edu.pl/public/wyklad-Vrok-neutrina/wyklad11... · 2019. 5. 13. · ``Theory of the Neutrino Mass,’’ arXiv:0808.0812 [hep-ph].](https://static.dokumenty.site/doc/80x56/60cfc97dbf062c62ab328cb0/masy-neutrin-a-metody-ni-2019-5-13-theory-of-the-neutrino-massaa-arxiv08080812.jpg)


