MIT Advanced Vehicle Technology Study: Large-Scale Naturalistic Driving Study of Driver Behavior and Interaction with Automation Lex Fridman * , Daniel E. Brown, Michael Glazer, William Angell, Spencer Dodd, Benedikt Jenik, Jack Terwilliger, Aleksandr Patsekin, Julia Kindelsberger, Li Ding, Sean Seaman, Alea Mehler, Andrew Sipperley, Anthony Pettinato, Bobbie Seppelt, Linda Angell, Bruce Mehler, Bryan Reimer Abstract—Today, and possibly for a long time to come, the full driving task is too complex an activity to be fully formalized as a sensing-acting robotics system that can be explicitly solved through model-based and learning-based approaches in order to achieve full unconstrained vehicle autonomy. Localization, map- ping, scene perception, vehicle control, trajectory optimization, and higher-level planning decisions associated with autonomous vehicle development remain full of open challenges. This is especially true for unconstrained, real-world operation where the margin of allowable error is extremely small and the number of edge-cases is extremely large. Until these problems are solved, human beings will remain an integral part of the driving task, monitoring the AI system as it performs anywhere from just over 0% to just under 100% of the driving. The governing objectives of the MIT Advanced Vehicle Technology (MIT-AVT) study are to (1) undertake large-scale real-world driving data collection that includes high-definition video to fuel the development of deep learning based internal and external perception systems, (2) gain a holistic understanding of how human beings interact with vehicle automation technology by integrating video data with vehicle state data, driver characteristics, mental models, and self-reported experiences with technology, and (3) identify how technology and other factors related to automation adoption and use can be improved in ways that save lives. In pursuing these objectives, we have instrumented 23 Tesla Model S and Model X vehicles, 2 Volvo S90 vehicles, 2 Range Rover Evoque, and 2 Cadillac CT6 vehicles for both long-term (over a year per driver) and medium term (one month per driver) naturalistic driving data collection. Furthermore, we are continually developing new methods for analysis of the massive-scale dataset collected from the instrumented vehicle fleet. The recorded data streams include IMU, GPS, CAN messages, and high-definition video streams of the driver face, the driver cabin, the forward roadway, and the instrument cluster (on select vehicles). The study is on-going and growing. To date, we have 122 participants, 15,610 days of participation, 511,638 miles, and 7.1 billion video frames. This paper presents the design of the study, the data collection hardware, the processing of the data, and the computer vision algorithms currently being used to extract actionable knowledge from the data. Fig. 1: Dataset statistics for the MIT-AVT study as a whole and for the individual vehicles in the study. * Corresponding author: Lex Fridman ([email protected]). Linda Angell and Sean Seaman are affiliated with Touchstone Evaluations, Inc. All other authors are affiliated with Massachusetts Institute of Technology (MIT). arXiv:1711.06976v4 [cs.CY] 14 Aug 2019
Transcript
MIT Advanced Vehicle Technology Study:Large-Scale Naturalistic Driving Study of
Driver Behavior and Interaction with AutomationLex Fridman∗, Daniel E. Brown, Michael Glazer, William Angell, Spencer Dodd, Benedikt Jenik,
Jack Terwilliger, Aleksandr Patsekin, Julia Kindelsberger, Li Ding, Sean Seaman, Alea Mehler,Andrew Sipperley, Anthony Pettinato, Bobbie Seppelt, Linda Angell, Bruce Mehler, Bryan Reimer
Abstract—Today, and possibly for a long time to come, thefull driving task is too complex an activity to be fully formalizedas a sensing-acting robotics system that can be explicitly solvedthrough model-based and learning-based approaches in order toachieve full unconstrained vehicle autonomy. Localization, map-ping, scene perception, vehicle control, trajectory optimization,and higher-level planning decisions associated with autonomousvehicle development remain full of open challenges. This isespecially true for unconstrained, real-world operation where themargin of allowable error is extremely small and the number ofedge-cases is extremely large. Until these problems are solved,human beings will remain an integral part of the driving task,monitoring the AI system as it performs anywhere from just over0% to just under 100% of the driving. The governing objectivesof the MIT Advanced Vehicle Technology (MIT-AVT) study areto (1) undertake large-scale real-world driving data collectionthat includes high-definition video to fuel the development ofdeep learning based internal and external perception systems,(2) gain a holistic understanding of how human beings interactwith vehicle automation technology by integrating video data
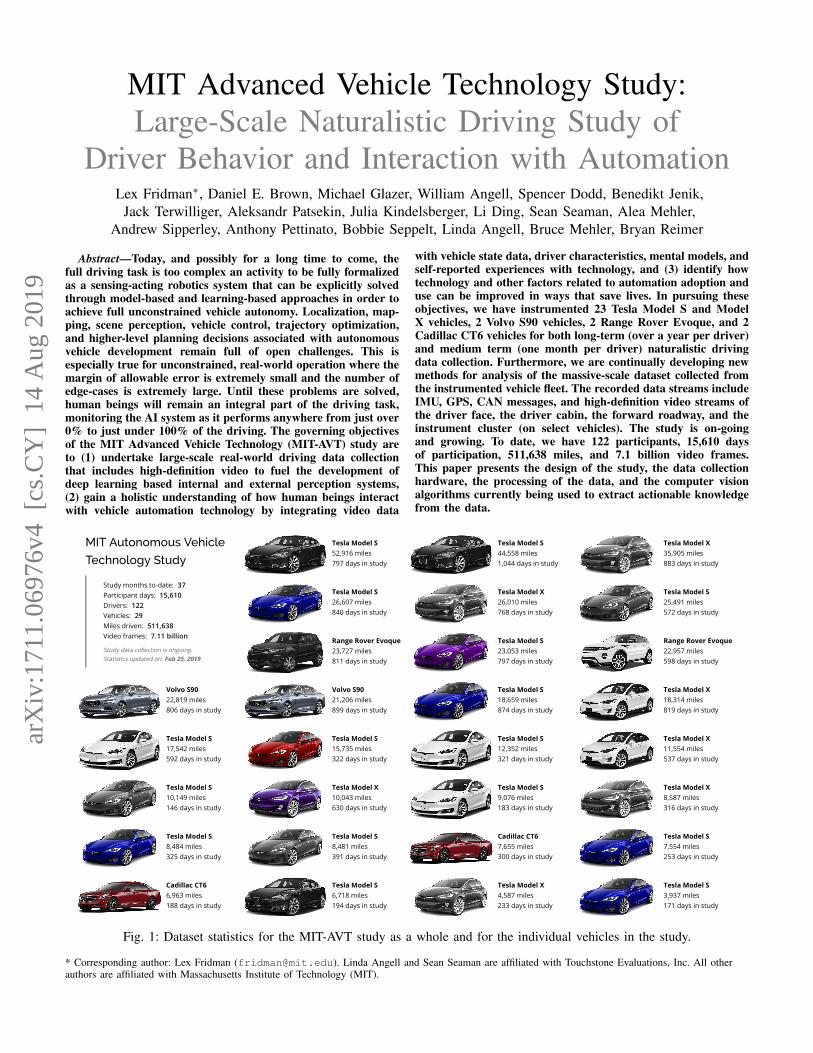
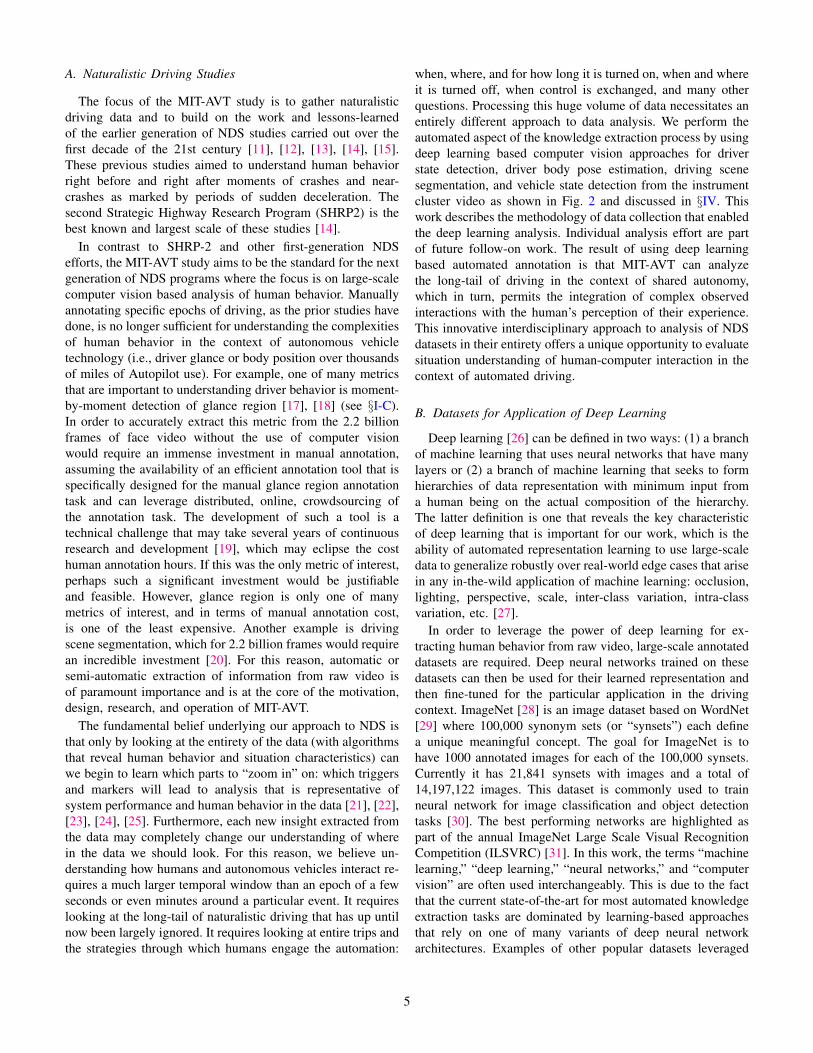
with vehicle state data, driver characteristics, mental models, andself-reported experiences with technology, and (3) identify howtechnology and other factors related to automation adoption anduse can be improved in ways that save lives. In pursuing theseobjectives, we have instrumented 23 Tesla Model S and ModelX vehicles, 2 Volvo S90 vehicles, 2 Range Rover Evoque, and 2Cadillac CT6 vehicles for both long-term (over a year per driver)and medium term (one month per driver) naturalistic drivingdata collection. Furthermore, we are continually developing newmethods for analysis of the massive-scale dataset collected fromthe instrumented vehicle fleet. The recorded data streams includeIMU, GPS, CAN messages, and high-definition video streams ofthe driver face, the driver cabin, the forward roadway, and theinstrument cluster (on select vehicles). The study is on-goingand growing. To date, we have 122 participants, 15,610 daysof participation, 511,638 miles, and 7.1 billion video frames.This paper presents the design of the study, the data collectionhardware, the processing of the data, and the computer visionalgorithms currently being used to extract actionable knowledgefrom the data.��������� ����
Fig. 1: Dataset statistics for the MIT-AVT study as a whole and for the individual vehicles in the study.
* Corresponding author: Lex Fridman ([email protected]). Linda Angell and Sean Seaman are affiliated with Touchstone Evaluations, Inc. All otherauthors are affiliated with Massachusetts Institute of Technology (MIT).
arX
iv:1
711.
0697
6v4
[cs
.CY
] 1
4 A
ug 2
019
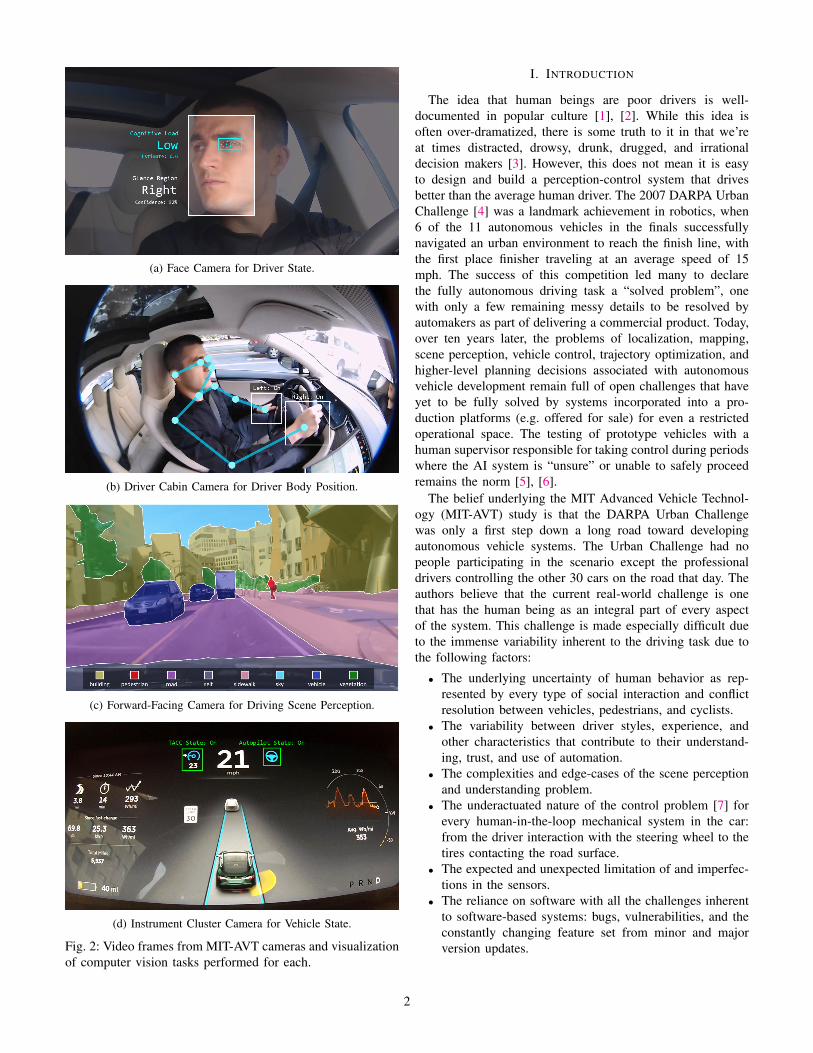
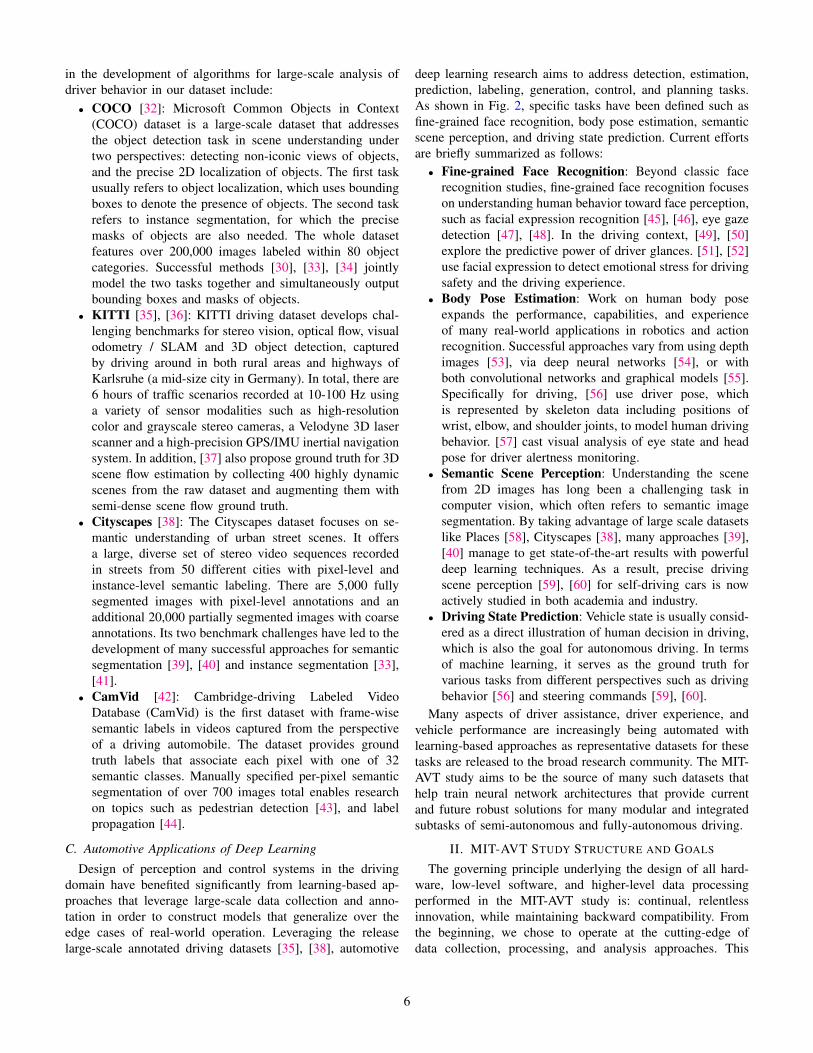
(a) Face Camera for Driver State.
(b) Driver Cabin Camera for Driver Body Position.
(c) Forward-Facing Camera for Driving Scene Perception.
(d) Instrument Cluster Camera for Vehicle State.
Fig. 2: Video frames from MIT-AVT cameras and visualizationof computer vision tasks performed for each.
I. INTRODUCTION
The idea that human beings are poor drivers is well-documented in popular culture [1], [2]. While this idea isoften over-dramatized, there is some truth to it in that we’reat times distracted, drowsy, drunk, drugged, and irrationaldecision makers [3]. However, this does not mean it is easyto design and build a perception-control system that drivesbetter than the average human driver. The 2007 DARPA UrbanChallenge [4] was a landmark achievement in robotics, when6 of the 11 autonomous vehicles in the finals successfullynavigated an urban environment to reach the finish line, withthe first place finisher traveling at an average speed of 15mph. The success of this competition led many to declarethe fully autonomous driving task a “solved problem”, onewith only a few remaining messy details to be resolved byautomakers as part of delivering a commercial product. Today,over ten years later, the problems of localization, mapping,scene perception, vehicle control, trajectory optimization, andhigher-level planning decisions associated with autonomousvehicle development remain full of open challenges that haveyet to be fully solved by systems incorporated into a pro-duction platforms (e.g. offered for sale) for even a restrictedoperational space. The testing of prototype vehicles with ahuman supervisor responsible for taking control during periodswhere the AI system is “unsure” or unable to safely proceedremains the norm [5], [6].
The belief underlying the MIT Advanced Vehicle Technol-ogy (MIT-AVT) study is that the DARPA Urban Challengewas only a first step down a long road toward developingautonomous vehicle systems. The Urban Challenge had nopeople participating in the scenario except the professionaldrivers controlling the other 30 cars on the road that day. Theauthors believe that the current real-world challenge is onethat has the human being as an integral part of every aspectof the system. This challenge is made especially difficult dueto the immense variability inherent to the driving task due tothe following factors:
• The underlying uncertainty of human behavior as rep-resented by every type of social interaction and conflictresolution between vehicles, pedestrians, and cyclists.
• The variability between driver styles, experience, andother characteristics that contribute to their understand-ing, trust, and use of automation.
• The complexities and edge-cases of the scene perceptionand understanding problem.
• The underactuated nature of the control problem [7] forevery human-in-the-loop mechanical system in the car:from the driver interaction with the steering wheel to thetires contacting the road surface.
• The expected and unexpected limitation of and imperfec-tions in the sensors.
• The reliance on software with all the challenges inherentto software-based systems: bugs, vulnerabilities, and theconstantly changing feature set from minor and majorversion updates.
2
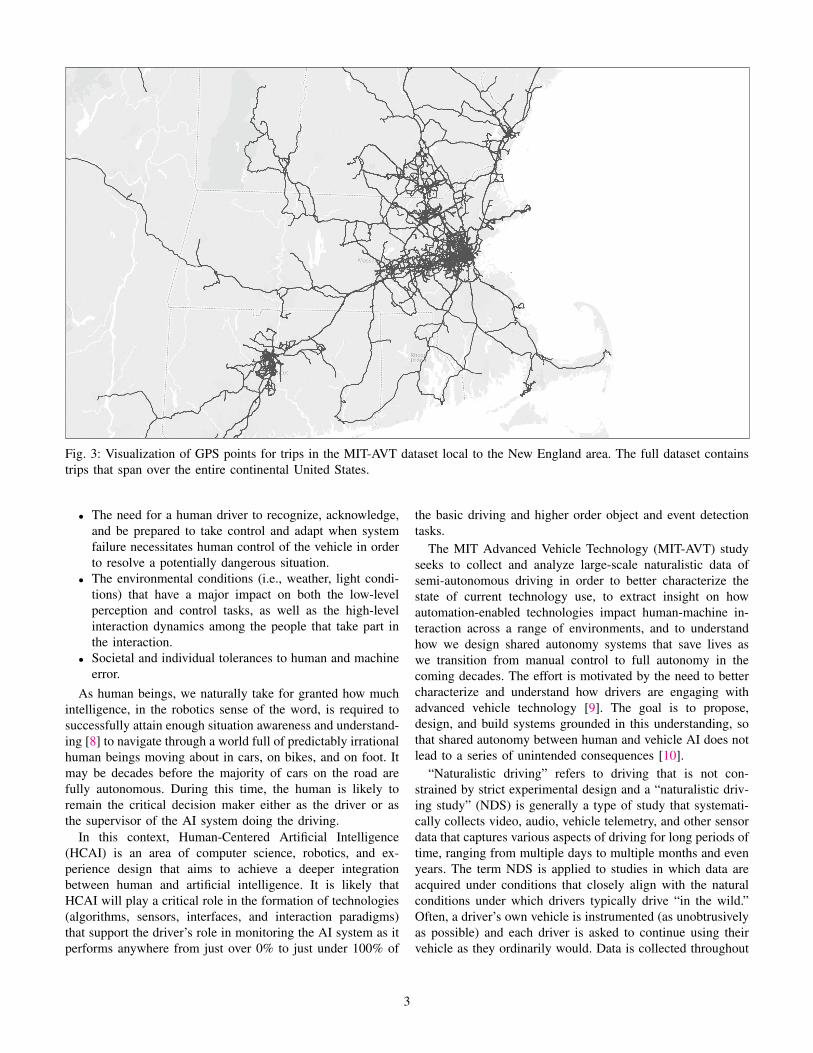
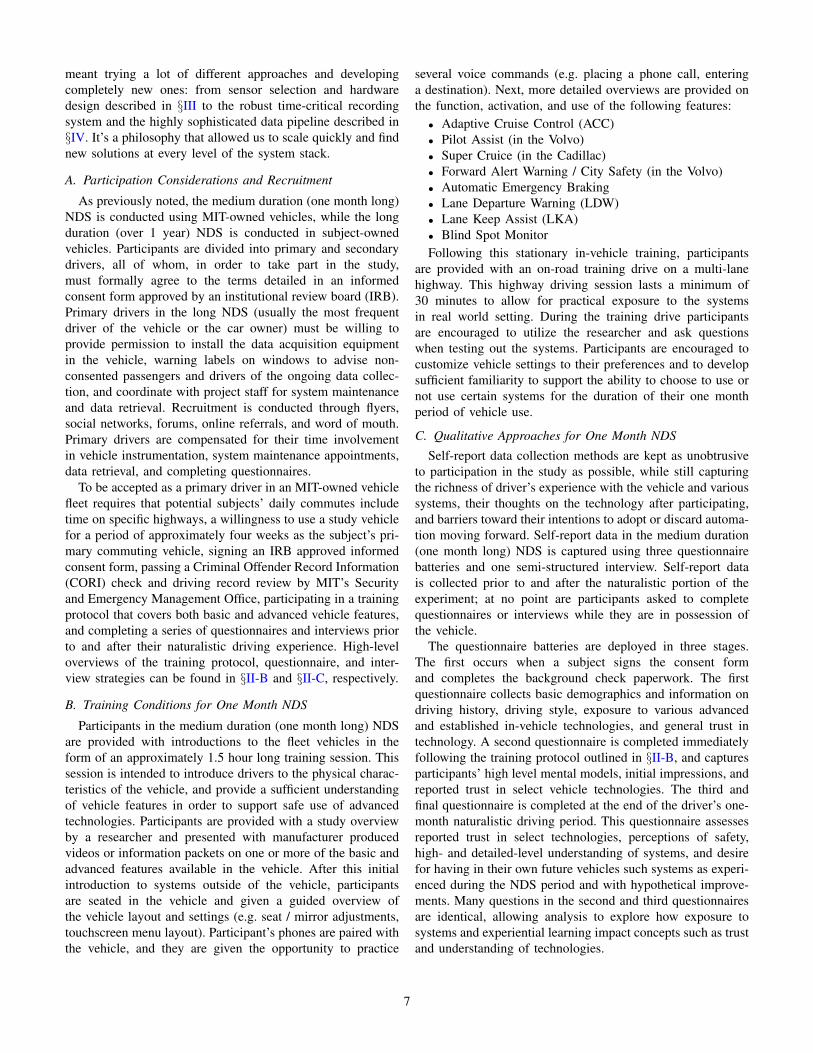
Fig. 3: Visualization of GPS points for trips in the MIT-AVT dataset local to the New England area. The full dataset containstrips that span over the entire continental United States.
• The need for a human driver to recognize, acknowledge,and be prepared to take control and adapt when systemfailure necessitates human control of the vehicle in orderto resolve a potentially dangerous situation.
• The environmental conditions (i.e., weather, light condi-tions) that have a major impact on both the low-levelperception and control tasks, as well as the high-levelinteraction dynamics among the people that take part inthe interaction.
• Societal and individual tolerances to human and machineerror.
As human beings, we naturally take for granted how muchintelligence, in the robotics sense of the word, is required tosuccessfully attain enough situation awareness and understand-ing [8] to navigate through a world full of predictably irrationalhuman beings moving about in cars, on bikes, and on foot. Itmay be decades before the majority of cars on the road arefully autonomous. During this time, the human is likely toremain the critical decision maker either as the driver or asthe supervisor of the AI system doing the driving.
In this context, Human-Centered Artificial Intelligence(HCAI) is an area of computer science, robotics, and ex-perience design that aims to achieve a deeper integrationbetween human and artificial intelligence. It is likely thatHCAI will play a critical role in the formation of technologies(algorithms, sensors, interfaces, and interaction paradigms)that support the driver’s role in monitoring the AI system as itperforms anywhere from just over 0% to just under 100% of
the basic driving and higher order object and event detectiontasks.
The MIT Advanced Vehicle Technology (MIT-AVT) studyseeks to collect and analyze large-scale naturalistic data ofsemi-autonomous driving in order to better characterize thestate of current technology use, to extract insight on howautomation-enabled technologies impact human-machine in-teraction across a range of environments, and to understandhow we design shared autonomy systems that save lives aswe transition from manual control to full autonomy in thecoming decades. The effort is motivated by the need to bettercharacterize and understand how drivers are engaging withadvanced vehicle technology [9]. The goal is to propose,design, and build systems grounded in this understanding, sothat shared autonomy between human and vehicle AI does notlead to a series of unintended consequences [10].
“Naturalistic driving” refers to driving that is not con-strained by strict experimental design and a “naturalistic driv-ing study” (NDS) is generally a type of study that systemati-cally collects video, audio, vehicle telemetry, and other sensordata that captures various aspects of driving for long periods oftime, ranging from multiple days to multiple months and evenyears. The term NDS is applied to studies in which data areacquired under conditions that closely align with the naturalconditions under which drivers typically drive “in the wild.”Often, a driver’s own vehicle is instrumented (as unobtrusivelyas possible) and each driver is asked to continue using theirvehicle as they ordinarily would. Data is collected throughout
3
periods of use. Further, use is unconstrained by any structuredexperimental design. The purpose is to provide a record ofnatural behavior that is as unaffected by the measurementprocess as possible. This contrasts with on-road experimentsthat are conducted in similarly instrumented vehicles, but inwhich experimenters are present in the vehicle, and ask driversto carry out specific tasks at specific times on specific roadsusing specific technology systems in the vehicle.
The MIT-AVT study is a new generation of NDS thataims to discover insights and understanding of real-worldinteraction between human drivers and autonomous drivingtechnology. Our goal is to derive insight from large-scalenaturalistic data being collected through the project to aid inthe design, development and delivery of new vehicle systems,inform insurance providers of the changing market for safety,and educate governments and other non-governmental stake-holders on how automation is being used in the wild.
This paper outlines the methodology and underlying princi-ples governing the design and operation of the MIT-AVT studyvehicle instrumentation, data collection, and the use of deeplearning methods for automated analysis of human behavior.These guiding principles can be summarized as follows:
• Autonomy at All Levels: We seek to study and under-stand human behavior and interaction with every formof advanced vehicle technology that assists the driverthrough first sensing the external environment and thedriver cabin, and then either controlling the vehicle orcommunicating with the driver based on the perceivedstate of the world. These technologies include everythingfrom automated emergency braking systems that can takecontrol in rare moments of imminent danger to semi-autonomous driving technology (e.g., Autopilot) that canhelp control the lateral and longitudinal movements ofthe vehicle continuously for long periods of driving onwell-marked roadways (e.g., highways).
• Beyond Epochs and Manual Annotation: Successfullarge-scale naturalistic driving studies of the past in theUnited States [11], [12], [13], [14], [15] and in Europe[16] focused analysis on crash and near-crash epochs.Epochs were detected using traditional signal processingof vehicle kinematics. The extraction of driver state fromvideo was done primarily with manual annotation. Theseapproaches, by their nature, left the vast remainder ofdriving data unprocessed and un-analyzed. In contrast tothis, the MIT-AVT study seeks to analyze the “long-tail”of shared-autonomy from both the human and machineperspectives. The “long-tail” is the part of data that isoutside of short, easily-detectable epochs. It is, for exam-ple, the data capturing moment-to-moment allocation ofglance over long stretches of driving (hundreds of hoursin MIT-AVT) when the vehicle is driving itself. Analyzingthe long-tail data requires processing billions of high-definition video frames with state-of-the-art computervision algorithms multiple times as we learn both what tolook for and how to interpret what we find. At the sametime, despite the focus on deep learning based analysis
of large-scale data, the more traditional NDS analytic ap-proaches remain valuable, including manual annotation,expert review of data, insight integration from technol-ogy suppliers, and contextualizing observed naturalisticbehavior with driver characteristics, understanding, andperceptions of vehicle technology.
• Multiple Study Duration: We seek understanding hu-man behavior in semi-autonomous systems both from thelong-term perspective of over 1 year in subject-ownedvehicles and from a medium-term perspective of 1 monthin MIT-owned vehicles. The former provides insightsinto use of vehicle technology over time and the latterprovides insights about initial interactions that involvelearning the limitations and capabilities of each subsys-tem in a fashion more closely aligned with a driver’sexperience after purchasing a new vehicle equipped witha suite of technology that the driver may or may not befamiliar with.
• Multiple Analysis Modalities: We use computer visionto extract knowledge from cameras that look at the driverface, driver body, and the external driving scene, but wealso use GPS, IMU, and CAN bus data to add rich detailsabout the context and frequency of technology use. Thisdata is further complemented by detailed questionnaireand interview data that comprise driver history, exposureto various automated and non-automated technologies,mental model evaluation, perceptions of safety, trust, self-reported use, and enjoyment. With this interdisciplinaryapproach, the dataset allows for a holistic view of real-world advanced technology use, and identifies potentialareas for design, policy, and educational improvements.
The key statistics about the MIT-AVT study as a wholeand about the individual vehicles in the study are shown inFig. 1. The key measures of the data with explanations of themeasures are as follows:
• Study months to-date: 37(Number of months the study has been actively running withvehicles on the road.)
• Participant days: 15,610(Number of days of active data logger recording across allvehicles in the study.)
• Drivers: 122(Number of consented drivers across all vehicles in the study.)
• Vehicles: 29(Number of vehicles in the study.)
• Miles driven: 511,638(Number of miles driven.)
• Video frames: 7.1 billion(Number of video frames recorded and processed across allcameras and vehicles in the study.)
Latest dataset statistics can be obtained at http://hcai.mit.edu/avt (see §VII). Data collection is actively on-going. Fig. 3shows GPS traces for trips in the dataset local to the NewEngland Area.
The focus of the MIT-AVT study is to gather naturalisticdriving data and to build on the work and lessons-learnedof the earlier generation of NDS studies carried out over thefirst decade of the 21st century [11], [12], [13], [14], [15].These previous studies aimed to understand human behaviorright before and right after moments of crashes and near-crashes as marked by periods of sudden deceleration. Thesecond Strategic Highway Research Program (SHRP2) is thebest known and largest scale of these studies [14].
In contrast to SHRP-2 and other first-generation NDSefforts, the MIT-AVT study aims to be the standard for the nextgeneration of NDS programs where the focus is on large-scalecomputer vision based analysis of human behavior. Manuallyannotating specific epochs of driving, as the prior studies havedone, is no longer sufficient for understanding the complexitiesof human behavior in the context of autonomous vehicletechnology (i.e., driver glance or body position over thousandsof miles of Autopilot use). For example, one of many metricsthat are important to understanding driver behavior is moment-by-moment detection of glance region [17], [18] (see §I-C).In order to accurately extract this metric from the 2.2 billionframes of face video without the use of computer visionwould require an immense investment in manual annotation,assuming the availability of an efficient annotation tool that isspecifically designed for the manual glance region annotationtask and can leverage distributed, online, crowdsourcing ofthe annotation task. The development of such a tool is atechnical challenge that may take several years of continuousresearch and development [19], which may eclipse the costhuman annotation hours. If this was the only metric of interest,perhaps such a significant investment would be justifiableand feasible. However, glance region is only one of manymetrics of interest, and in terms of manual annotation cost,is one of the least expensive. Another example is drivingscene segmentation, which for 2.2 billion frames would requirean incredible investment [20]. For this reason, automatic orsemi-automatic extraction of information from raw video isof paramount importance and is at the core of the motivation,design, research, and operation of MIT-AVT.
The fundamental belief underlying our approach to NDS isthat only by looking at the entirety of the data (with algorithmsthat reveal human behavior and situation characteristics) canwe begin to learn which parts to “zoom in” on: which triggersand markers will lead to analysis that is representative ofsystem performance and human behavior in the data [21], [22],[23], [24], [25]. Furthermore, each new insight extracted fromthe data may completely change our understanding of wherein the data we should look. For this reason, we believe un-derstanding how humans and autonomous vehicles interact re-quires a much larger temporal window than an epoch of a fewseconds or even minutes around a particular event. It requireslooking at the long-tail of naturalistic driving that has up untilnow been largely ignored. It requires looking at entire trips andthe strategies through which humans engage the automation:
when, where, and for how long it is turned on, when and whereit is turned off, when control is exchanged, and many otherquestions. Processing this huge volume of data necessitates anentirely different approach to data analysis. We perform theautomated aspect of the knowledge extraction process by usingdeep learning based computer vision approaches for driverstate detection, driver body pose estimation, driving scenesegmentation, and vehicle state detection from the instrumentcluster video as shown in Fig. 2 and discussed in §IV. Thiswork describes the methodology of data collection that enabledthe deep learning analysis. Individual analysis effort are partof future follow-on work. The result of using deep learningbased automated annotation is that MIT-AVT can analyzethe long-tail of driving in the context of shared autonomy,which in turn, permits the integration of complex observedinteractions with the human’s perception of their experience.This innovative interdisciplinary approach to analysis of NDSdatasets in their entirety offers a unique opportunity to evaluatesituation understanding of human-computer interaction in thecontext of automated driving.
B. Datasets for Application of Deep Learning
Deep learning [26] can be defined in two ways: (1) a branchof machine learning that uses neural networks that have manylayers or (2) a branch of machine learning that seeks to formhierarchies of data representation with minimum input froma human being on the actual composition of the hierarchy.The latter definition is one that reveals the key characteristicof deep learning that is important for our work, which is theability of automated representation learning to use large-scaledata to generalize robustly over real-world edge cases that arisein any in-the-wild application of machine learning: occlusion,lighting, perspective, scale, inter-class variation, intra-classvariation, etc. [27].
In order to leverage the power of deep learning for ex-tracting human behavior from raw video, large-scale annotateddatasets are required. Deep neural networks trained on thesedatasets can then be used for their learned representation andthen fine-tuned for the particular application in the drivingcontext. ImageNet [28] is an image dataset based on WordNet[29] where 100,000 synonym sets (or “synsets”) each definea unique meaningful concept. The goal for ImageNet is tohave 1000 annotated images for each of the 100,000 synsets.Currently it has 21,841 synsets with images and a total of14,197,122 images. This dataset is commonly used to trainneural network for image classification and object detectiontasks [30]. The best performing networks are highlighted aspart of the annual ImageNet Large Scale Visual RecognitionCompetition (ILSVRC) [31]. In this work, the terms “machinelearning,” “deep learning,” “neural networks,” and “computervision” are often used interchangeably. This is due to the factthat the current state-of-the-art for most automated knowledgeextraction tasks are dominated by learning-based approachesthat rely on one of many variants of deep neural networkarchitectures. Examples of other popular datasets leveraged
5
in the development of algorithms for large-scale analysis ofdriver behavior in our dataset include:
• COCO [32]: Microsoft Common Objects in Context(COCO) dataset is a large-scale dataset that addressesthe object detection task in scene understanding undertwo perspectives: detecting non-iconic views of objects,and the precise 2D localization of objects. The first taskusually refers to object localization, which uses boundingboxes to denote the presence of objects. The second taskrefers to instance segmentation, for which the precisemasks of objects are also needed. The whole datasetfeatures over 200,000 images labeled within 80 objectcategories. Successful methods [30], [33], [34] jointlymodel the two tasks together and simultaneously outputbounding boxes and masks of objects.
• KITTI [35], [36]: KITTI driving dataset develops chal-lenging benchmarks for stereo vision, optical flow, visualodometry / SLAM and 3D object detection, capturedby driving around in both rural areas and highways ofKarlsruhe (a mid-size city in Germany). In total, there are6 hours of traffic scenarios recorded at 10-100 Hz usinga variety of sensor modalities such as high-resolutioncolor and grayscale stereo cameras, a Velodyne 3D laserscanner and a high-precision GPS/IMU inertial navigationsystem. In addition, [37] also propose ground truth for 3Dscene flow estimation by collecting 400 highly dynamicscenes from the raw dataset and augmenting them withsemi-dense scene flow ground truth.
• Cityscapes [38]: The Cityscapes dataset focuses on se-mantic understanding of urban street scenes. It offersa large, diverse set of stereo video sequences recordedin streets from 50 different cities with pixel-level andinstance-level semantic labeling. There are 5,000 fullysegmented images with pixel-level annotations and anadditional 20,000 partially segmented images with coarseannotations. Its two benchmark challenges have led to thedevelopment of many successful approaches for semanticsegmentation [39], [40] and instance segmentation [33],[41].
• CamVid [42]: Cambridge-driving Labeled VideoDatabase (CamVid) is the first dataset with frame-wisesemantic labels in videos captured from the perspectiveof a driving automobile. The dataset provides groundtruth labels that associate each pixel with one of 32semantic classes. Manually specified per-pixel semanticsegmentation of over 700 images total enables researchon topics such as pedestrian detection [43], and labelpropagation [44].
C. Automotive Applications of Deep Learning
Design of perception and control systems in the drivingdomain have benefited significantly from learning-based ap-proaches that leverage large-scale data collection and anno-tation in order to construct models that generalize over theedge cases of real-world operation. Leveraging the releaselarge-scale annotated driving datasets [35], [38], automotive
deep learning research aims to address detection, estimation,prediction, labeling, generation, control, and planning tasks.As shown in Fig. 2, specific tasks have been defined such asfine-grained face recognition, body pose estimation, semanticscene perception, and driving state prediction. Current effortsare briefly summarized as follows:
• Fine-grained Face Recognition: Beyond classic facerecognition studies, fine-grained face recognition focuseson understanding human behavior toward face perception,such as facial expression recognition [45], [46], eye gazedetection [47], [48]. In the driving context, [49], [50]explore the predictive power of driver glances. [51], [52]use facial expression to detect emotional stress for drivingsafety and the driving experience.
• Body Pose Estimation: Work on human body poseexpands the performance, capabilities, and experienceof many real-world applications in robotics and actionrecognition. Successful approaches vary from using depthimages [53], via deep neural networks [54], or withboth convolutional networks and graphical models [55].Specifically for driving, [56] use driver pose, whichis represented by skeleton data including positions ofwrist, elbow, and shoulder joints, to model human drivingbehavior. [57] cast visual analysis of eye state and headpose for driver alertness monitoring.
• Semantic Scene Perception: Understanding the scenefrom 2D images has long been a challenging task incomputer vision, which often refers to semantic imagesegmentation. By taking advantage of large scale datasetslike Places [58], Cityscapes [38], many approaches [39],[40] manage to get state-of-the-art results with powerfuldeep learning techniques. As a result, precise drivingscene perception [59], [60] for self-driving cars is nowactively studied in both academia and industry.
• Driving State Prediction: Vehicle state is usually consid-ered as a direct illustration of human decision in driving,which is also the goal for autonomous driving. In termsof machine learning, it serves as the ground truth forvarious tasks from different perspectives such as drivingbehavior [56] and steering commands [59], [60].
Many aspects of driver assistance, driver experience, andvehicle performance are increasingly being automated withlearning-based approaches as representative datasets for thesetasks are released to the broad research community. The MIT-AVT study aims to be the source of many such datasets thathelp train neural network architectures that provide currentand future robust solutions for many modular and integratedsubtasks of semi-autonomous and fully-autonomous driving.
II. MIT-AVT STUDY STRUCTURE AND GOALS
The governing principle underlying the design of all hard-ware, low-level software, and higher-level data processingperformed in the MIT-AVT study is: continual, relentlessinnovation, while maintaining backward compatibility. Fromthe beginning, we chose to operate at the cutting-edge ofdata collection, processing, and analysis approaches. This
6
meant trying a lot of different approaches and developingcompletely new ones: from sensor selection and hardwaredesign described in §III to the robust time-critical recordingsystem and the highly sophisticated data pipeline described in§IV. It’s a philosophy that allowed us to scale quickly and findnew solutions at every level of the system stack.
A. Participation Considerations and Recruitment
As previously noted, the medium duration (one month long)NDS is conducted using MIT-owned vehicles, while the longduration (over 1 year) NDS is conducted in subject-ownedvehicles. Participants are divided into primary and secondarydrivers, all of whom, in order to take part in the study,must formally agree to the terms detailed in an informedconsent form approved by an institutional review board (IRB).Primary drivers in the long NDS (usually the most frequentdriver of the vehicle or the car owner) must be willing toprovide permission to install the data acquisition equipmentin the vehicle, warning labels on windows to advise non-consented passengers and drivers of the ongoing data collec-tion, and coordinate with project staff for system maintenanceand data retrieval. Recruitment is conducted through flyers,social networks, forums, online referrals, and word of mouth.Primary drivers are compensated for their time involvementin vehicle instrumentation, system maintenance appointments,data retrieval, and completing questionnaires.
To be accepted as a primary driver in an MIT-owned vehiclefleet requires that potential subjects’ daily commutes includetime on specific highways, a willingness to use a study vehiclefor a period of approximately four weeks as the subject’s pri-mary commuting vehicle, signing an IRB approved informedconsent form, passing a Criminal Offender Record Information(CORI) check and driving record review by MIT’s Securityand Emergency Management Office, participating in a trainingprotocol that covers both basic and advanced vehicle features,and completing a series of questionnaires and interviews priorto and after their naturalistic driving experience. High-leveloverviews of the training protocol, questionnaire, and inter-view strategies can be found in §II-B and §II-C, respectively.
B. Training Conditions for One Month NDS
Participants in the medium duration (one month long) NDSare provided with introductions to the fleet vehicles in theform of an approximately 1.5 hour long training session. Thissession is intended to introduce drivers to the physical charac-teristics of the vehicle, and provide a sufficient understandingof vehicle features in order to support safe use of advancedtechnologies. Participants are provided with a study overviewby a researcher and presented with manufacturer producedvideos or information packets on one or more of the basic andadvanced features available in the vehicle. After this initialintroduction to systems outside of the vehicle, participantsare seated in the vehicle and given a guided overview ofthe vehicle layout and settings (e.g. seat / mirror adjustments,touchscreen menu layout). Participant’s phones are paired withthe vehicle, and they are given the opportunity to practice
several voice commands (e.g. placing a phone call, enteringa destination). Next, more detailed overviews are provided onthe function, activation, and use of the following features:
• Adaptive Cruise Control (ACC)• Pilot Assist (in the Volvo)• Super Cruice (in the Cadillac)• Forward Alert Warning / City Safety (in the Volvo)• Automatic Emergency Braking• Lane Departure Warning (LDW)• Lane Keep Assist (LKA)• Blind Spot MonitorFollowing this stationary in-vehicle training, participants
are provided with an on-road training drive on a multi-lanehighway. This highway driving session lasts a minimum of30 minutes to allow for practical exposure to the systemsin real world setting. During the training drive participantsare encouraged to utilize the researcher and ask questionswhen testing out the systems. Participants are encouraged tocustomize vehicle settings to their preferences and to developsufficient familiarity to support the ability to choose to use ornot use certain systems for the duration of their one monthperiod of vehicle use.
C. Qualitative Approaches for One Month NDS
Self-report data collection methods are kept as unobtrusiveto participation in the study as possible, while still capturingthe richness of driver’s experience with the vehicle and varioussystems, their thoughts on the technology after participating,and barriers toward their intentions to adopt or discard automa-tion moving forward. Self-report data in the medium duration(one month long) NDS is captured using three questionnairebatteries and one semi-structured interview. Self-report datais collected prior to and after the naturalistic portion of theexperiment; at no point are participants asked to completequestionnaires or interviews while they are in possession ofthe vehicle.
The questionnaire batteries are deployed in three stages.The first occurs when a subject signs the consent formand completes the background check paperwork. The firstquestionnaire collects basic demographics and information ondriving history, driving style, exposure to various advancedand established in-vehicle technologies, and general trust intechnology. A second questionnaire is completed immediatelyfollowing the training protocol outlined in §II-B, and capturesparticipants’ high level mental models, initial impressions, andreported trust in select vehicle technologies. The third andfinal questionnaire is completed at the end of the driver’s one-month naturalistic driving period. This questionnaire assessesreported trust in select technologies, perceptions of safety,high- and detailed-level understanding of systems, and desirefor having in their own future vehicles such systems as experi-enced during the NDS period and with hypothetical improve-ments. Many questions in the second and third questionnairesare identical, allowing analysis to explore how exposure tosystems and experiential learning impact concepts such as trustand understanding of technologies.
7
A semi-structured interview is conducted in person betweena research associate and the study participant at the end of theone-month naturalistic driving period, and lasts approximately30-60 minutes. It consists of predefined questions focusingon initial reactions to the vehicle, experience during thetraining drive, how training affected their understanding of thetechnologies, and driver perceptions of the technologies.
D. Competitors Collaborate: Consortium Model
Naturalistic driving data and automated deep learning basedinterpretation of that data gives insights, suggestions, andwell-grounded scenarios as to the path forward for safe andeffective integration of artificial intelligence into modern andfuture vehicle systems. The raw data and the high-level under-standing of human behavior and system performance in suchautonomous vehicle technology is of interest to:
• Car companies (both established and newly formed)• Automotive parts suppliers• Insurance companies• Technology companies• Government agencies• Academic and research organizationWhen the path forward is full of uncertainty, risks, po-
tentially costly misaligned investments, and paradigm shifts,open innovation provides more value than closed competition.At this moment in time, autonomous vehicle technology is aspace where competitors win by collaborating, sharing high-level insights and large-scale, real-world data.
High-level measures such as system use and system perfor-mance can be used to inform the design, development andvalidation of future vehicle systems. Basic driver behaviorwith and without technology use can fuel basic research ondriver understanding, use characteristics, and decision modelswhile aiding in the actuation of risk in the insurance market.Video recording inside and out of the vehicle can be usedto develop perception, control, planning, driver sensing, anddriver assistance systems. As such, the data collected in theMIT-AVT study can be leveraged for a range of quantitativeand qualitative efforts. Members of the Advanced VehicleTechnology consortium [61] are collaborating to support theacquisition of data through the MIT-AVT study, developmentof new data processing approaches, and selected analysis.Full members of the consortia have rights to data access forproprietary or other internal use purposes. Several members ofthe effort are actively involved in independent research (withand without MIT involvement) using MIT-AVT study data.
III. HARDWARE: DATA LOGGING AND REAL-TIMEPROCESSING
The backbone of a successful naturalistic driving study isthe hardware and low-level software that performs the datacollection. In the MIT-AVT study, that role is served by asystem named RIDER (Real-time Intelligent Driving Envi-ronment Recording system) as shown in Fig. 6. RIDER wasdesigned and continuously developed to satisfy the followinggoals and requirements:
1) Timestamped Asynchronous Sensor Recording:Record all sensors and data streams in a way that eachsample of data (no matter its frequency or data source)is timestamped using a centralized, reliable time-keeper.In other words, data has to be timestamped in a way thatallows perfect synchronization of multiple data streamsin post-processing [62].
2) High-Definition Video: Capture and record 3 to 6 cam-eras at 720p (2.1 megapixels) resolution. The selectionof camera positions, resolution, and compression wasone of the most essential design decisions of the entirestudy. See §III-C for discussion of how this selectionwas made.
3) CAN Bus: Collect vehicle telemetry from the ControllerArea Network (CAN) bus(es) of the vehicle [63]. Eachvehicle has different ports and bus utilization policies,with little information made publicly available about themapping of message ID’s and the message content. RawCAN messages must be recorded such that the essentialinformation is contained within those messages even if atthe time of collection those messages cannot be decoded.
4) Remote Cellular Connectivity: Low-bandwidth, infre-quent communication of system status via a cellularconnection in order to detect when RIDER systemmalfunction occurs.
5) Discrete and Elegant Appearance: Parts of the systemthat are visible from inside or outside the car shouldhave a small form-factor and have visual design charac-teristics that do not detract from the overall appearanceof the vehicle or have an impact on the overall drivingexperience.
6) Camera Mounting is Robust but Removable: Mount-ing must be consistent, reliable, and removable designedspecifically for each vehicle’s interior physical charac-teristics.
RIDER components include a real-time-clock, GPS, IMU,and the ability to record up to 6 cameras at 720p resolution,remote cellular connectivity. The developed system employsthe use of common components tailored to suit its needsachieving a scalable ultra low cost, accurate, extendable androbust data recording platform.
To keep the electronics and stored data secure, RIDERis placed within in the trunk away from the elements andpossible disturbances from passengers. Power and CAN datacables are run from the OBD-II or diagnostic port to the trunkinto RIDER. USB cables for cameras are also run from eachcamera location into the trunk. All data and power cables aresecured and hidden beneath interior trim panels.
A. Power Management System
The power systems for RIDER has many constraints: itdemanded flexibility to transfer into different vehicles anddraw minimal power when not in use as to not drain theprimary vehicle battery. The power system consists of a mainsmart CAN monitoring section and a buck converter. Whenactive and logging data, RIDER draws less than 8 watts of
8
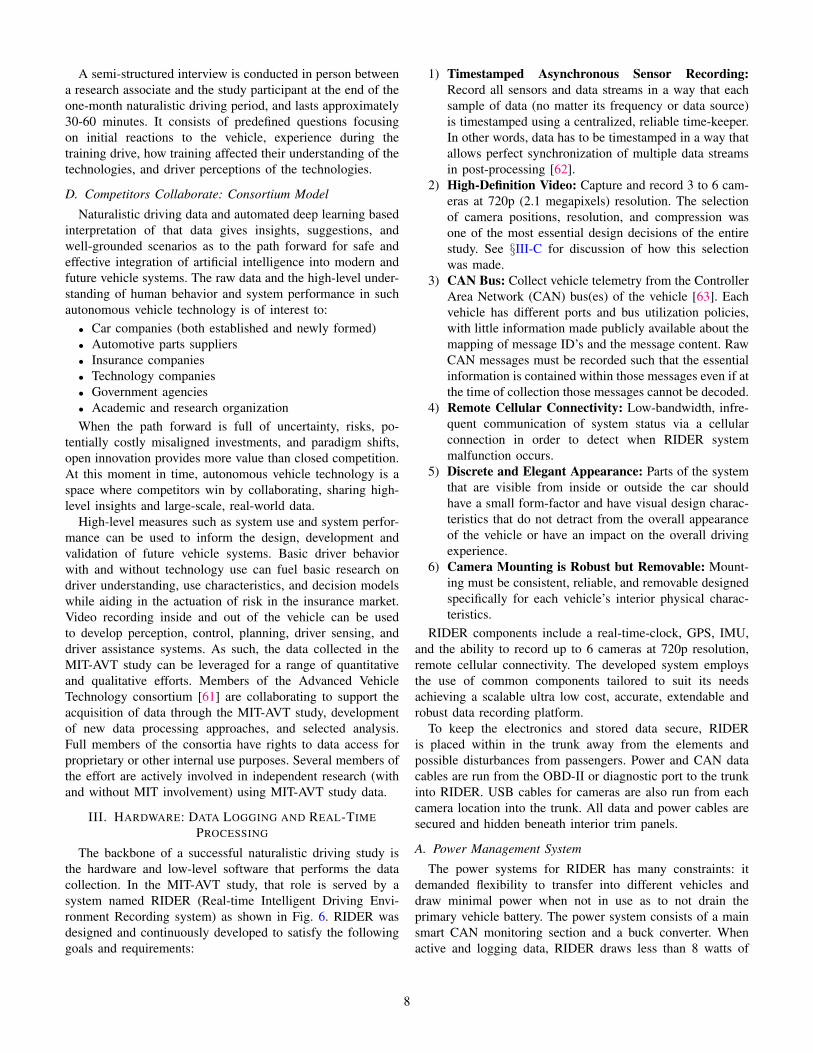
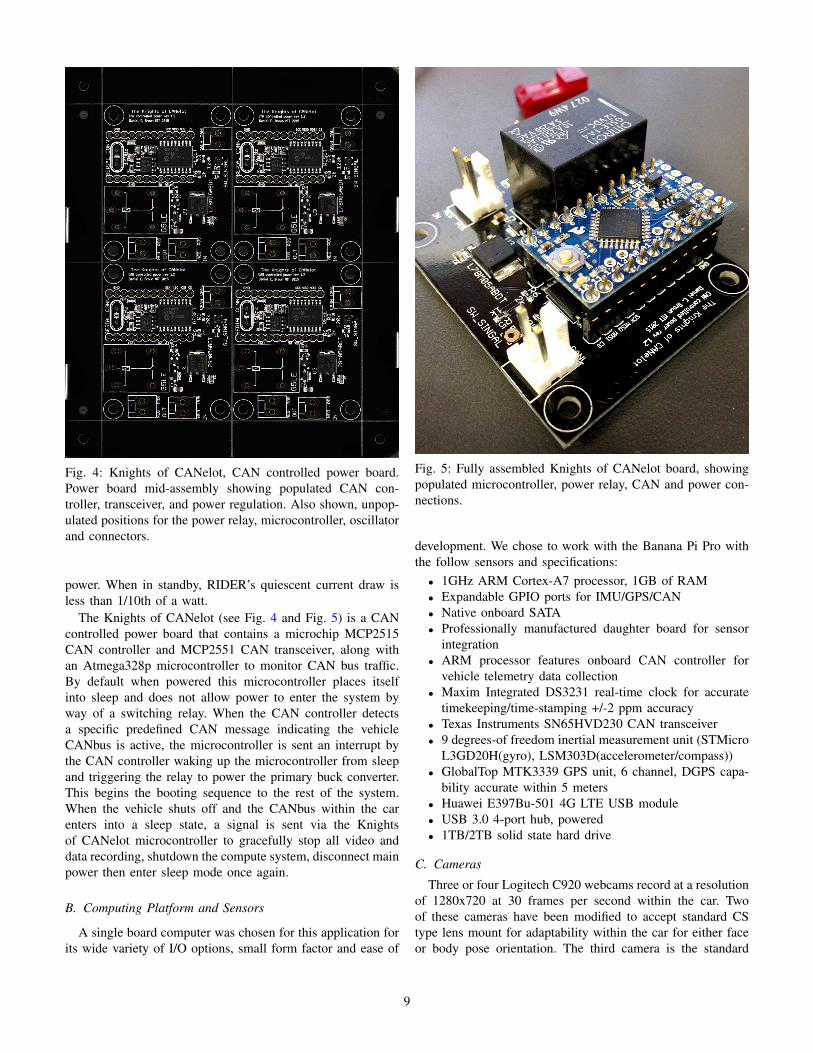
Fig. 4: Knights of CANelot, CAN controlled power board.Power board mid-assembly showing populated CAN con-troller, transceiver, and power regulation. Also shown, unpop-ulated positions for the power relay, microcontroller, oscillatorand connectors.
power. When in standby, RIDER’s quiescent current draw isless than 1/10th of a watt.
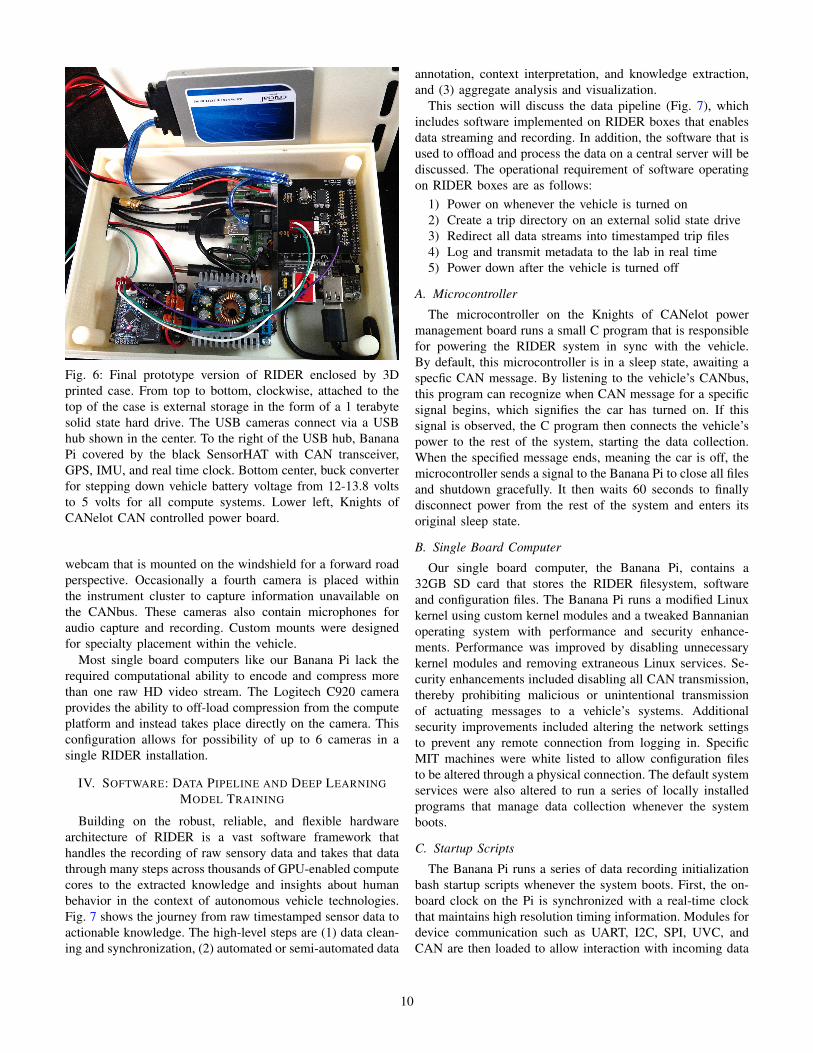
The Knights of CANelot (see Fig. 4 and Fig. 5) is a CANcontrolled power board that contains a microchip MCP2515CAN controller and MCP2551 CAN transceiver, along withan Atmega328p microcontroller to monitor CAN bus traffic.By default when powered this microcontroller places itselfinto sleep and does not allow power to enter the system byway of a switching relay. When the CAN controller detectsa specific predefined CAN message indicating the vehicleCANbus is active, the microcontroller is sent an interrupt bythe CAN controller waking up the microcontroller from sleepand triggering the relay to power the primary buck converter.This begins the booting sequence to the rest of the system.When the vehicle shuts off and the CANbus within the carenters into a sleep state, a signal is sent via the Knightsof CANelot microcontroller to gracefully stop all video anddata recording, shutdown the compute system, disconnect mainpower then enter sleep mode once again.
B. Computing Platform and Sensors
A single board computer was chosen for this application forits wide variety of I/O options, small form factor and ease of
Fig. 5: Fully assembled Knights of CANelot board, showingpopulated microcontroller, power relay, CAN and power con-nections.
development. We chose to work with the Banana Pi Pro withthe follow sensors and specifications:
• 1GHz ARM Cortex-A7 processor, 1GB of RAM• Expandable GPIO ports for IMU/GPS/CAN• Native onboard SATA• Professionally manufactured daughter board for sensor
integration• ARM processor features onboard CAN controller for
vehicle telemetry data collection• Maxim Integrated DS3231 real-time clock for accurate
timekeeping/time-stamping +/-2 ppm accuracy• Texas Instruments SN65HVD230 CAN transceiver• 9 degrees-of freedom inertial measurement unit (STMicro
L3GD20H(gyro), LSM303D(accelerometer/compass))• GlobalTop MTK3339 GPS unit, 6 channel, DGPS capa-
bility accurate within 5 meters• Huawei E397Bu-501 4G LTE USB module• USB 3.0 4-port hub, powered• 1TB/2TB solid state hard drive
C. Cameras
Three or four Logitech C920 webcams record at a resolutionof 1280x720 at 30 frames per second within the car. Twoof these cameras have been modified to accept standard CStype lens mount for adaptability within the car for either faceor body pose orientation. The third camera is the standard
9
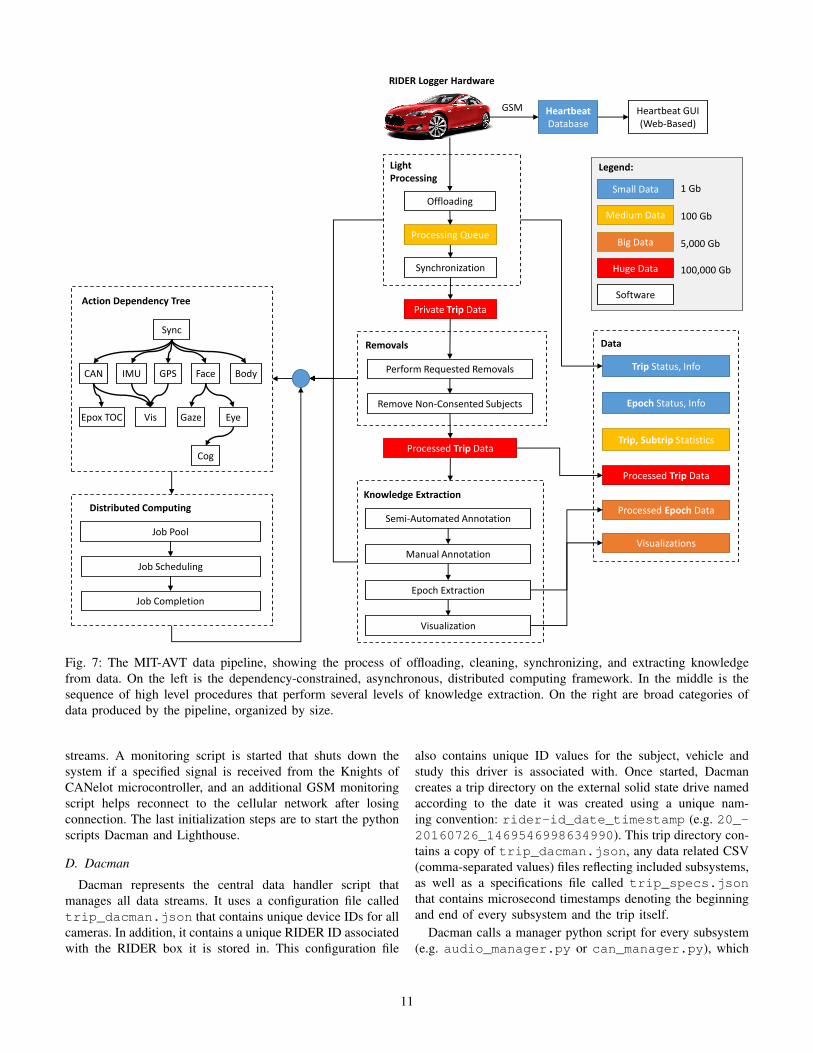
Fig. 6: Final prototype version of RIDER enclosed by 3Dprinted case. From top to bottom, clockwise, attached to thetop of the case is external storage in the form of a 1 terabytesolid state hard drive. The USB cameras connect via a USBhub shown in the center. To the right of the USB hub, BananaPi covered by the black SensorHAT with CAN transceiver,GPS, IMU, and real time clock. Bottom center, buck converterfor stepping down vehicle battery voltage from 12-13.8 voltsto 5 volts for all compute systems. Lower left, Knights ofCANelot CAN controlled power board.
webcam that is mounted on the windshield for a forward roadperspective. Occasionally a fourth camera is placed withinthe instrument cluster to capture information unavailable onthe CANbus. These cameras also contain microphones foraudio capture and recording. Custom mounts were designedfor specialty placement within the vehicle.
Most single board computers like our Banana Pi lack therequired computational ability to encode and compress morethan one raw HD video stream. The Logitech C920 cameraprovides the ability to off-load compression from the computeplatform and instead takes place directly on the camera. Thisconfiguration allows for possibility of up to 6 cameras in asingle RIDER installation.
IV. SOFTWARE: DATA PIPELINE AND DEEP LEARNINGMODEL TRAINING
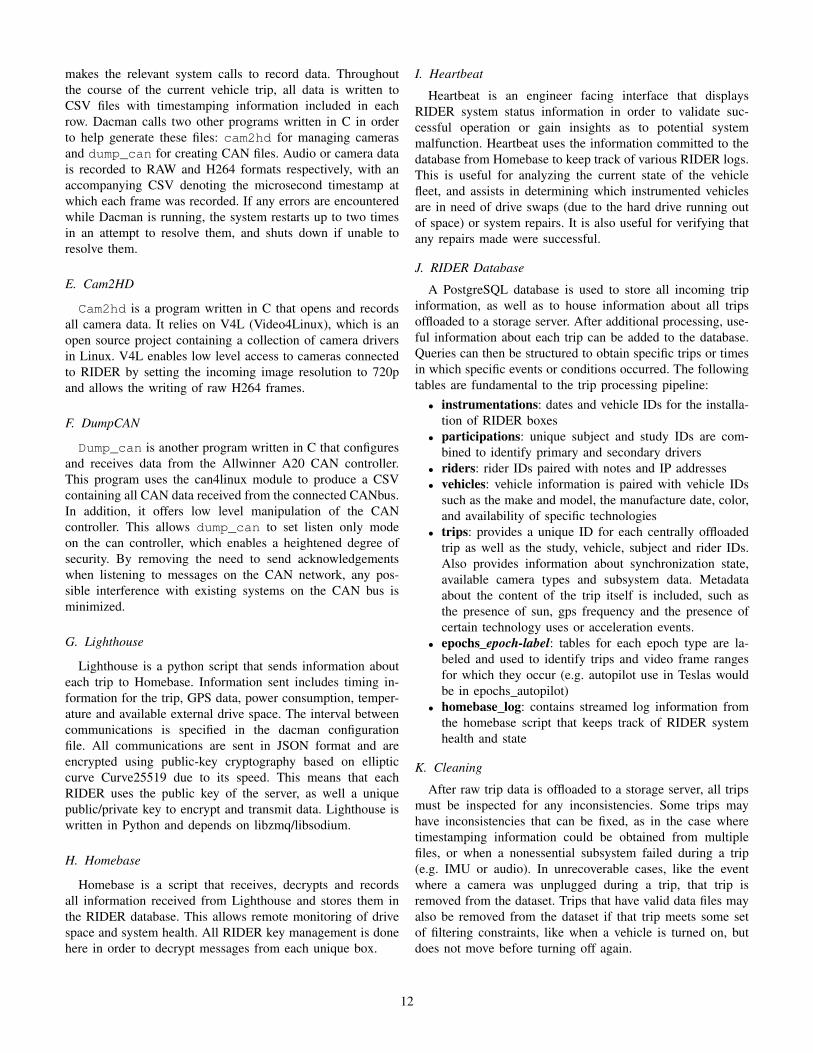
Building on the robust, reliable, and flexible hardwarearchitecture of RIDER is a vast software framework thathandles the recording of raw sensory data and takes that datathrough many steps across thousands of GPU-enabled computecores to the extracted knowledge and insights about humanbehavior in the context of autonomous vehicle technologies.Fig. 7 shows the journey from raw timestamped sensor data toactionable knowledge. The high-level steps are (1) data clean-ing and synchronization, (2) automated or semi-automated data
annotation, context interpretation, and knowledge extraction,and (3) aggregate analysis and visualization.
This section will discuss the data pipeline (Fig. 7), whichincludes software implemented on RIDER boxes that enablesdata streaming and recording. In addition, the software that isused to offload and process the data on a central server will bediscussed. The operational requirement of software operatingon RIDER boxes are as follows:
1) Power on whenever the vehicle is turned on2) Create a trip directory on an external solid state drive3) Redirect all data streams into timestamped trip files4) Log and transmit metadata to the lab in real time5) Power down after the vehicle is turned off
A. Microcontroller
The microcontroller on the Knights of CANelot powermanagement board runs a small C program that is responsiblefor powering the RIDER system in sync with the vehicle.By default, this microcontroller is in a sleep state, awaiting aspecfic CAN message. By listening to the vehicle’s CANbus,this program can recognize when CAN message for a specificsignal begins, which signifies the car has turned on. If thissignal is observed, the C program then connects the vehicle’spower to the rest of the system, starting the data collection.When the specified message ends, meaning the car is off, themicrocontroller sends a signal to the Banana Pi to close all filesand shutdown gracefully. It then waits 60 seconds to finallydisconnect power from the rest of the system and enters itsoriginal sleep state.
B. Single Board Computer
Our single board computer, the Banana Pi, contains a32GB SD card that stores the RIDER filesystem, softwareand configuration files. The Banana Pi runs a modified Linuxkernel using custom kernel modules and a tweaked Bannanianoperating system with performance and security enhance-ments. Performance was improved by disabling unnecessarykernel modules and removing extraneous Linux services. Se-curity enhancements included disabling all CAN transmission,thereby prohibiting malicious or unintentional transmissionof actuating messages to a vehicle’s systems. Additionalsecurity improvements included altering the network settingsto prevent any remote connection from logging in. SpecificMIT machines were white listed to allow configuration filesto be altered through a physical connection. The default systemservices were also altered to run a series of locally installedprograms that manage data collection whenever the systemboots.
C. Startup Scripts
The Banana Pi runs a series of data recording initializationbash startup scripts whenever the system boots. First, the on-board clock on the Pi is synchronized with a real-time clockthat maintains high resolution timing information. Modules fordevice communication such as UART, I2C, SPI, UVC, andCAN are then loaded to allow interaction with incoming data
10
Heartbeat GUI (Web-Based)
HeartbeatDatabase
GSM
Offloading
Synchronization
Trip Status, Info
LightProcessing
RIDER Logger Hardware
Private Trip Data
Epoch Status, Info
Perform Requested Removals
Remove Non-Consented Subjects
Removals
Processed Trip Data
Processing Queue
Trip, Subtrip Statistics
Small Data
Big Data
Huge Data
Legend:
Software
Medium Data
1 Gb
100 Gb
5,000 Gb
100,000 Gb
Processed Trip Data
Processed Epoch Data
Data
Semi-Automated Annotation
Manual Annotation
Visualization
Visualizations
Epoch Extraction
Knowledge Extraction
Action Dependency Tree
Sync
CAN IMU GPS
VisEpox TOC
Face Body
Gaze Eye
Cog
Job Pool
Job Scheduling
Distributed Computing
Job Completion
Fig. 7: The MIT-AVT data pipeline, showing the process of offloading, cleaning, synchronizing, and extracting knowledgefrom data. On the left is the dependency-constrained, asynchronous, distributed computing framework. In the middle is thesequence of high level procedures that perform several levels of knowledge extraction. On the right are broad categories ofdata produced by the pipeline, organized by size.
streams. A monitoring script is started that shuts down thesystem if a specified signal is received from the Knights ofCANelot microcontroller, and an additional GSM monitoringscript helps reconnect to the cellular network after losingconnection. The last initialization steps are to start the pythonscripts Dacman and Lighthouse.
D. Dacman
Dacman represents the central data handler script thatmanages all data streams. It uses a configuration file calledtrip_dacman.json that contains unique device IDs for allcameras. In addition, it contains a unique RIDER ID associatedwith the RIDER box it is stored in. This configuration file
also contains unique ID values for the subject, vehicle andstudy this driver is associated with. Once started, Dacmancreates a trip directory on the external solid state drive namedaccording to the date it was created using a unique nam-ing convention: rider-id_date_timestamp (e.g. 20_-20160726_1469546998634990). This trip directory con-tains a copy of trip_dacman.json, any data related CSV(comma-separated values) files reflecting included subsystems,as well as a specifications file called trip_specs.jsonthat contains microsecond timestamps denoting the beginningand end of every subsystem and the trip itself.
Dacman calls a manager python script for every subsystem(e.g. audio_manager.py or can_manager.py), which
11
makes the relevant system calls to record data. Throughoutthe course of the current vehicle trip, all data is written toCSV files with timestamping information included in eachrow. Dacman calls two other programs written in C in orderto help generate these files: cam2hd for managing camerasand dump_can for creating CAN files. Audio or camera datais recorded to RAW and H264 formats respectively, with anaccompanying CSV denoting the microsecond timestamp atwhich each frame was recorded. If any errors are encounteredwhile Dacman is running, the system restarts up to two timesin an attempt to resolve them, and shuts down if unable toresolve them.
E. Cam2HD
Cam2hd is a program written in C that opens and recordsall camera data. It relies on V4L (Video4Linux), which is anopen source project containing a collection of camera driversin Linux. V4L enables low level access to cameras connectedto RIDER by setting the incoming image resolution to 720pand allows the writing of raw H264 frames.
F. DumpCAN
Dump_can is another program written in C that configuresand receives data from the Allwinner A20 CAN controller.This program uses the can4linux module to produce a CSVcontaining all CAN data received from the connected CANbus.In addition, it offers low level manipulation of the CANcontroller. This allows dump_can to set listen only modeon the can controller, which enables a heightened degree ofsecurity. By removing the need to send acknowledgementswhen listening to messages on the CAN network, any pos-sible interference with existing systems on the CAN bus isminimized.
G. Lighthouse
Lighthouse is a python script that sends information abouteach trip to Homebase. Information sent includes timing in-formation for the trip, GPS data, power consumption, temper-ature and available external drive space. The interval betweencommunications is specified in the dacman configurationfile. All communications are sent in JSON format and areencrypted using public-key cryptography based on ellipticcurve Curve25519 due to its speed. This means that eachRIDER uses the public key of the server, as well a uniquepublic/private key to encrypt and transmit data. Lighthouse iswritten in Python and depends on libzmq/libsodium.
H. Homebase
Homebase is a script that receives, decrypts and recordsall information received from Lighthouse and stores them inthe RIDER database. This allows remote monitoring of drivespace and system health. All RIDER key management is donehere in order to decrypt messages from each unique box.
I. Heartbeat
Heartbeat is an engineer facing interface that displaysRIDER system status information in order to validate suc-cessful operation or gain insights as to potential systemmalfunction. Heartbeat uses the information committed to thedatabase from Homebase to keep track of various RIDER logs.This is useful for analyzing the current state of the vehiclefleet, and assists in determining which instrumented vehiclesare in need of drive swaps (due to the hard drive running outof space) or system repairs. It is also useful for verifying thatany repairs made were successful.
J. RIDER Database
A PostgreSQL database is used to store all incoming tripinformation, as well as to house information about all tripsoffloaded to a storage server. After additional processing, use-ful information about each trip can be added to the database.Queries can then be structured to obtain specific trips or timesin which specific events or conditions occurred. The followingtables are fundamental to the trip processing pipeline:
• instrumentations: dates and vehicle IDs for the installa-tion of RIDER boxes
• participations: unique subject and study IDs are com-bined to identify primary and secondary drivers
• riders: rider IDs paired with notes and IP addresses• vehicles: vehicle information is paired with vehicle IDs
such as the make and model, the manufacture date, color,and availability of specific technologies
• trips: provides a unique ID for each centrally offloadedtrip as well as the study, vehicle, subject and rider IDs.Also provides information about synchronization state,available camera types and subsystem data. Metadataabout the content of the trip itself is included, such asthe presence of sun, gps frequency and the presence ofcertain technology uses or acceleration events.
• epochs epoch-label: tables for each epoch type are la-beled and used to identify trips and video frame rangesfor which they occur (e.g. autopilot use in Teslas wouldbe in epochs autopilot)
• homebase log: contains streamed log information fromthe homebase script that keeps track of RIDER systemhealth and state
K. Cleaning
After raw trip data is offloaded to a storage server, all tripsmust be inspected for any inconsistencies. Some trips mayhave inconsistencies that can be fixed, as in the case wheretimestamping information could be obtained from multiplefiles, or when a nonessential subsystem failed during a trip(e.g. IMU or audio). In unrecoverable cases, like the eventwhere a camera was unplugged during a trip, that trip isremoved from the dataset. Trips that have valid data files mayalso be removed from the dataset if that trip meets some setof filtering constraints, like when a vehicle is turned on, butdoes not move before turning off again.
12
L. Synchronization
After completing cleaning and filtration, valid trips undergoa series of synchronization steps. First, the timestamps of everyframe gathered from every camera are aligned in a single videoCSV file at 30 frames per second using the latest camerastart timestamp and the earliest camera end timestamp. Inlow lighting conditions the cameras may drop to recordingat 15 frames per second. In these cases, some frames may berepeated to achieve 30 frames per second in the synced video.
After all raw videos have been aligned, new synchronizedvideo files can then be created at 30 frames per second. CANdata is then decoded by creating a CSV with all relevant CANmessages as columns and synced frame IDs as rows. CANmessage values are then inserted frame-by-frame based onthe closest timestamp to each decoded CAN message. A finalsynchronized visualization can then be generated that showsall video streams and CAN info in separate panels in the samevideo. The data is then ready to be processed by any algorithmrunning statistics, detection tasks, or manual annotation tasks.
V. TRIPS AND FILES
This section will define how trip data files may be storedin a trip directory. A trip directory represents a trip that adriver took with their vehicle from start to finish. These arethe files that are offloaded from the external storage drive ina RIDER box onto a central server, where the data can becleaned, synchronized, or processed in some other way.
A. Trip Configuration Files
Trip configuration files store specifications and informationabout available subsystems are included to manage the datalogging process.
• trip dacman.json: a configuration file containing subjectand systems information used to record the trip
• trip diagnostics.log: a text file containing diagnosticsinformation recorded during the trip: includes externaltemperature, PMU temperature, HDD temperature, powerusage and free disk space
• trip specs.json: a json file containing start and endtimestamps for all subsystems
B. Trip Data Files
Trip data files are the end point of all recording RIDERdata streams. They include numerous CSV (comma separatedvalues) files that provide timestamping information, as well asraw video files in H264 and audio files in RAW formats.
• camera-directory: a directory named by camera type (allcontained files are also named by that camera type)
– camera-name.h264: a raw H264 file– camera-name.error: contains camera-specific errors– camera-name.csv: matches recorded frames with
system timestamps for later synchronization∗ frame,ts_micro
• audio.raw: contains raw output from a specified camera• can.error, gps.error, imu.error, audio.error: text-based
error files for CAN, GPS, IMU and audio recordings
C. Cleaning Criteria
The following cases represent recoverable errors that a tripmay contain, as well as their implemented solutions:
• Invalid permissions: UNIX permissions of the trip di-rectory must allow group-only read/write access
• Missing backup: Raw essential files are backed up toallow a rollback to previous versions
• Missing trip specs.json: The trip specs.json file cansometimes be reconstructed using recorded timestamps
• Missing or invalid ID: Vehicle, camera or subject IDsmay be corrected based on trip context
• Invalid Nonessential Files: If IMU or audio have failed,they can be removed and the trip can be preserved
• Invalid last CSV line: Interrupted subsystems may writeincomplete lines to their data file, which can be removed
D. Filtering Criteria
The following cases represent unrecoverable errors or cho-sen criteria that result in the removal of a trip from the dataset:
• Nonconsenting driver: When the driver is not a con-sented participant in the study
• Requested removal: When the subject requests certaintrips, dates or times be removed
• Vehicle doesn’t move: When the kinematics of thevehicle indicate no change in speed
• Trip data files < 15MB: When the total size of a trip’sfiles are less than 15MB (faster than duration checks)
• Trip duration < 30 seconds: When the shortest camerarecording is less than 30 seconds in duration
• Missing essential files: When camera files, trip_-dacman.json or data_can.csv are missing
• Outside volunteer participation range: Indicative ofMIT staff driving the vehicle to be maintained or washed
• Large essential subsystem error files: When there aremany errors for a camera or for CAN
• Mismatches in subsystem timestamps: When one sub-system ends at least one minute earlier than another
E. Synchronized Files
Synchronized files are created by synchronization scriptsthat run after cleaning and filtering has taken place. Thesescripts align video frames and CAN messages at a rate of
13
30 frames per second. They are created using the same tripnaming convention in a separate, processed directory.
• synced video.csv: every row contains a video frame IDand timestamp from every camera at 30 frames per second
• synced video camera-name.mp4: Synchronized withall other videos at 30 FPS using H264 encoding
• synced can.csv: each row represents a synced videoframe and the closest CAN values associated with thattimestamp for every CAN message
• synced vis panels.mp4: an optional visualization videofile that displays all synced videos in separate panelswhere CAN data may be also displayed
VI. ONGOING HARDWARE DEVELOPMENT ANDINNOVATION
RIDER is an instrumentation platform that has been proventhrough extensive testing to have adequate data collectionabilities for naturalistic driving research. During the research,development, and testing process we met some limitationsof the system. While a single board computer is sufficientfor most collection processes, limitations of minimal systemmemory could create issues when expanding the system.Similarly, a Dual-Core ARM processor is very capable wheninterfacing with sensors and writing data out to files, butperformance can fluctuate if any preprocessing of the datais required onboard. From our work we have proposed thefollowing improvements to some of these common issues.
The largest enhancement for the entire RIDER systemwould be to upgrade the single board computing platform. Useof the NVIDIA Jetson TX2 would provide more expandabilityboth for I/O and processing. With greater processing and GPUbandwidth available, real-time systems could be implementedusing both video and sensor data simultaneously for detectionand driver warning systems, internal annotation of data andmore. With greater I/O capability, upgraded sensors packageswith higher data bandwidths can be implemented. Much likethe Banana Pi Pro the Jetson TX2 has not one, but twofully supported CAN controllers to interface with a secondaryCANbus system on the vehicle. Jetson TX2 has expandabilitynot only for SATA but also PCIe and mSATA, allowing foreven greater expansion of third party modules. The enhancedprocessing via CPU and GPU with 8 times the onboardRAM allows the potential for preprocessing and integrationof real-time driver monitoring systems. The Jetson also hasthe major advantage of being supported for use in multipleconfigurations for in vehicle applications.
VII. CONCLUSION
The application of state-of-the-art embedded system pro-gramming, software engineering, data processing, distributedcomputing, computer vision and deep learning techniques tothe collection and analysis of large-scale naturalistic drivingdata in the MIT-AVT study seeks to break new ground inoffering insights into how human and autonomous vehicles in-teract in the rapidly changing transportation system. This workpresents the methodology behind the MIT-AVT study which
aims to define and inspire the next generation of naturalisticdriving studies. To date, the dataset includes 122 participants,15,610 days of participation, 511,638 miles, and 7.1 billionvideo frames. Statistics about the size and scope of the MIT-AVT dataset are updated regularly on https://hcai.mit.edu/avt.
ACKNOWLEDGMENT
The authors would like to thank MIT colleagues and thebroader driving and artificial intelligence research communityfor their valuable feedback and discussions throughout thedevelopment and on-going operation of this study, especiallyJoseph F. Coughlin, Sertac Karaman, William T. Freeman,John Leonard, Ruth Rosenholtz, Karl Iagnemma, and all themembers of the AVT consortium.
The authors would also like to thank the many vehicleowners who have provided and continue to provide valuableinsights (via email or in-person discussion) about their experi-ences interacting with these systems. Lastly, the authors wouldlike to thank the annotation teams at MIT and TouchstoneEvaluations for their help in continually evolving a state-of-the-art framework for annotation and discovering new essentialelements necessary for understanding human behavior in thecontext of advanced vehicle technologies.
Support for this work was provided by the AdvancedVehicle Technology (AVT) consortium at MIT. The viewsand conclusions being expressed are those of the authors, andhave not been sponsored, approved, or necessarily endorsedby members of the consortium. All authors listed as affiliatedwith MIT contributed to the work only during their time atMIT as employees or visiting graduate students.
REFERENCES
[1] A. Davies, “Oh look, more evidence humans shouldn’t bedriving,” May 2015. [Online]. Available: https://www.wired.com/2015/05/oh-look-evidence-humans-shouldnt-driving/
[2] T. Vanderbilt and B. Brenner, “Traffic: Why we drive the way we do(and what it says about us) , alfred a. knopf, new york, 2008; 978-0-307-26478-7,” 2009.
[3] W. H. Organization, Global status report on road safety 2015. WorldHealth Organization, 2015.
[4] M. Buehler, K. Iagnemma, and S. Singh, The DARPA urban challenge:autonomous vehicles in city traffic. springer, 2009, vol. 56.
[5] V. V. Dixit, S. Chand, and D. J. Nair, “Autonomous vehicles: disen-gagements, accidents and reaction times,” PLoS one, vol. 11, no. 12, p.e0168054, 2016.
[6] F. M. Favaro, N. Nader, S. O. Eurich, M. Tripp, and N. Varadaraju, “Ex-amining accident reports involving autonomous vehicles in california,”PLoS one, vol. 12, no. 9, p. e0184952, 2017.
[7] R. Tedrake, “Underactuated robotics: Algorithms for walking, running,swimming, flying, and manipulation (course notes for mit 6.832),” 2016.
[8] M. R. Endsley and E. O. Kiris, “The out-of-the-loop performanceproblem and level of control in automation,” Human factors, vol. 37,no. 2, pp. 381–394, 1995.
[9] B. Reimer, “Driver assistance systems and the transition to automatedvehicles: A path to increase older adult safety and mobility?” PublicPolicy & Aging Report, vol. 24, no. 1, pp. 27–31, 2014.
[10] K. Barry, “Too much safety could make drivers less safe,”July 2011. [Online]. Available: https://www.wired.com/2011/07/active-safety-systems-could-create-passive-drivers/
[11] V. L. Neale, T. A. Dingus, S. G. Klauer, J. Sudweeks, and M. Goodman,“An overview of the 100-car naturalistic study and findings,” NationalHighway Traffic Safety Administration, Paper, no. 05-0400, 2005.
[12] T. A. Dingus, S. G. Klauer, V. L. Neale, A. Petersen, S. E. Lee,J. Sudweeks, M. Perez, J. Hankey, D. Ramsey, S. Gupta et al., “The100-car naturalistic driving study, phase ii-results of the 100-car fieldexperiment,” Tech. Rep., 2006.
[13] S. G. Klauer, T. A. Dingus, V. L. Neale, J. D. Sudweeks, D. J. Ramseyet al., “The impact of driver inattention on near-crash/crash risk: Ananalysis using the 100-car naturalistic driving study data,” 2006.
[14] K. L. Campbell, “The shrp 2 naturalistic driving study: Addressing driverperformance and behavior in traffic safety,” TR News, no. 282, 2012.
[15] T. Victor, M. Dozza, J. Bargman, C.-N. Boda, J. Engstrom, C. Flannagan,J. D. Lee, and G. Markkula, “Analysis of naturalistic driving study data:Safer glances, driver inattention, and crash risk,” Tech. Rep., 2015.
[16] M. Benmimoun, F. Fahrenkrog, A. Zlocki, and L. Eckstein, “Incidentdetection based on vehicle can-data within the large scale field opera-tional test (eurofot),” in 22nd Enhanced Safety of Vehicles Conference(ESV 2011), Washington, DC/USA, 2011.
[17] L. Fridman, P. Langhans, J. Lee, and B. Reimer, “Driver gaze regionestimation without use of eye movement,” IEEE Intelligent Systems,vol. 31, no. 3, pp. 49–56, 2016.
[18] L. Fridman, J. Lee, B. Reimer, and T. Victor, “Owl and lizard: patternsof head pose and eye pose in driver gaze classification,” IET ComputerVision, vol. 10, no. 4, pp. 308–313, 2016.
[19] B. C. Russell, A. Torralba, K. P. Murphy, and W. T. Freeman, “Labelme:a database and web-based tool for image annotation,” Internationaljournal of computer vision, vol. 77, no. 1, pp. 157–173, 2008.
[20] M. Cordts, M. Omran, S. Ramos, T. Rehfeld, M. Enzweiler, R. Be-nenson, U. Franke, S. Roth, and B. Schiele, “The cityscapes datasetfor semantic urban scene understanding,” in Proceedings of the IEEEConference on Computer Vision and Pattern Recognition, 2016, pp.3213–3223.
[21] R. R. Knipling, “Naturalistic driving events: No harm, no foul, novalidity,” in Driving Assessment 2015: International Symposium onHuman Factors in Driver Assessment, Training, and Vehicle Design.Public Policy Center, University of Iowa Iowa City, 2015, pp. 196–202.
[22] R. R. Knipling, “Crash heterogeneity: implications for naturalistic driv-ing studies and for understanding crash risks,” Transportation ResearchRecord: Journal of the Transportation Research Board, no. 2663, pp.117–125, 2017.
[23] L. Fridman, B. Jenik, and B. Reimer, “Arguing machines: Perception-control system redundancy and edge case discovery in real-worldautonomous driving,” arXiv preprint arXiv:1710.04459, 2017.
[24] V. Shankar, P. Jovanis, J. Aguero-Valverde, and F. Gross, “Analy-sis of naturalistic driving data: prospective view on methodologicalparadigms,” Transportation Research Record: Journal of the Transporta-tion Research Board, no. 2061, pp. 1–8, 2008.
[25] N. Kalra and S. M. Paddock, “Driving to safety: How many miles ofdriving would it take to demonstrate autonomous vehicle reliability?”Transportation Research Part A: Policy and Practice, vol. 94, pp. 182–193, 2016.
[26] I. Goodfellow, Y. Bengio, and A. Courville, Deep learning. MIT press,2016.
[27] R. Hartley and A. Zisserman, Multiple view geometry in computer vision.Cambridge university press, 2003.
[28] J. Deng, W. Dong, R. Socher, L.-J. Li, K. Li, and L. Fei-Fei, “Imagenet:A large-scale hierarchical image database,” in Computer Vision andPattern Recognition, 2009. CVPR 2009. IEEE Conference on. IEEE,2009, pp. 248–255.
[29] G. A. Miller, R. Beckwith, C. Fellbaum, D. Gross, and K. J. Miller,“Introduction to wordnet: An on-line lexical database,” Internationaljournal of lexicography, vol. 3, no. 4, pp. 235–244, 1990.
[30] K. He, X. Zhang, S. Ren, and J. Sun, “Deep residual learning for imagerecognition,” in Proceedings of the IEEE conference on computer visionand pattern recognition, 2016, pp. 770–778.
[31] O. Russakovsky, J. Deng, H. Su, J. Krause, S. Satheesh, S. Ma,Z. Huang, A. Karpathy, A. Khosla, M. Bernstein et al., “Imagenet largescale visual recognition challenge,” International Journal of ComputerVision, vol. 115, no. 3, pp. 211–252, 2015.
[32] T.-Y. Lin, M. Maire, S. Belongie, J. Hays, P. Perona, D. Ramanan,P. Dollar, and C. L. Zitnick, “Microsoft coco: Common objects incontext,” in European conference on computer vision. Springer, 2014,pp. 740–755.
[33] K. He, G. Gkioxari, P. Dollar, and R. Girshick, “Mask r-cnn,” in TheIEEE International Conference on Computer Vision (ICCV), Oct 2017.
[34] J. Dai, H. Qi, Y. Xiong, Y. Li, G. Zhang, H. Hu, and Y. Wei, “Deformableconvolutional networks,” in The IEEE International Conference onComputer Vision (ICCV), Oct 2017.
[35] A. Geiger, P. Lenz, C. Stiller, and R. Urtasun, “Vision meets robotics:The kitti dataset,” International Journal of Robotics Research (IJRR),2013.
[36] A. Geiger, P. Lenz, and R. Urtasun, “Are we ready for autonomousdriving? the kitti vision benchmark suite,” in Conference on ComputerVision and Pattern Recognition (CVPR), 2012.
[37] M. Menze and A. Geiger, “Object scene flow for autonomous vehicles,”in Conference on Computer Vision and Pattern Recognition (CVPR),2015.
[38] M. Cordts, M. Omran, S. Ramos, T. Scharwachter, M. Enzweiler,R. Benenson, U. Franke, S. Roth, and B. Schiele, “The cityscapesdataset,” 2015.
[39] H. Zhao, J. Shi, X. Qi, X. Wang, and J. Jia, “Pyramid scene parsingnetwork,” in The IEEE Conference on Computer Vision and PatternRecognition (CVPR), July 2017.
[40] P. Wang, P. Chen, Y. Yuan, D. Liu, Z. Huang, X. Hou, and G. Cottrell,“Understanding convolution for semantic segmentation,” arXiv preprintarXiv:1702.08502, 2017.
[41] S. Liu, J. Jia, S. Fidler, and R. Urtasun, “Sgn: Sequential grouping net-works for instance segmentation,” in The IEEE International Conferenceon Computer Vision (ICCV), Oct 2017.
[42] G. J. Brostow, J. Fauqueur, and R. Cipolla, “Semantic object classesin video: A high-definition ground truth database,” Pattern RecognitionLetters, vol. 30, no. 2, pp. 88–97, 2009.
[43] Y. Tian, P. Luo, X. Wang, and X. Tang, “Pedestrian detection aided bydeep learning semantic tasks,” in Proceedings of the IEEE Conferenceon Computer Vision and Pattern Recognition, 2015, pp. 5079–5087.
[44] V. Badrinarayanan, F. Galasso, and R. Cipolla, “Label propagation invideo sequences,” in Computer Vision and Pattern Recognition (CVPR),2010 IEEE Conference on. IEEE, 2010, pp. 3265–3272.
[45] P. Liu, S. Han, Z. Meng, and Y. Tong, “Facial expression recognition viaa boosted deep belief network,” in Proceedings of the IEEE Conferenceon Computer Vision and Pattern Recognition, 2014, pp. 1805–1812.
[46] Z. Yu and C. Zhang, “Image based static facial expression recognitionwith multiple deep network learning,” in Proceedings of the 2015 ACMon International Conference on Multimodal Interaction. ACM, 2015,pp. 435–442.
[47] E. A. Hoffman and J. V. Haxby, “Distinct representations of eye gazeand identity in the distributed human neural system for face perception,”Nature neuroscience, vol. 3, no. 1, pp. 80–84, 2000.
[48] J. Wisniewska, M. Rezaei, and R. Klette, “Robust eye gaze estima-tion,” in International Conference on Computer Vision and Graphics.Springer, 2014, pp. 636–644.
[49] L. Fridman, H. Toyoda, S. Seaman, B. Seppelt, L. Angell, J. Lee,B. Mehler, and B. Reimer, “What can be predicted from six seconds ofdriver glances?” in Proceedings of the 2017 CHI Conference on HumanFactors in Computing Systems. ACM, 2017, pp. 2805–2813.
[50] F. Vicente, Z. Huang, X. Xiong, F. De la Torre, W. Zhang, and D. Levi,“Driver gaze tracking and eyes off the road detection system,” IEEETransactions on Intelligent Transportation Systems, vol. 16, no. 4, pp.2014–2027, 2015.
[51] H. Gao, A. Yuce, and J.-P. Thiran, “Detecting emotional stress fromfacial expressions for driving safety,” in Image Processing (ICIP), 2014IEEE International Conference on. IEEE, 2014, pp. 5961–5965.
[52] I. Abdic, L. Fridman, D. McDuff, E. Marchi, B. Reimer, and B. Schuller,“Driver frustration detection from audio and video in the wild,” in KI2016: Advances in Artificial Intelligence: 39th Annual German Confer-ence on AI, Klagenfurt, Austria, September 26-30, 2016, Proceedings,vol. 9904. Springer, 2016, p. 237.
[53] J. Shotton, T. Sharp, A. Kipman, A. Fitzgibbon, M. Finocchio, A. Blake,M. Cook, and R. Moore, “Real-time human pose recognition in partsfrom single depth images,” Communications of the ACM, vol. 56, no. 1,pp. 116–124, 2013.
[54] A. Toshev and C. Szegedy, “Deeppose: Human pose estimation via deepneural networks,” in Proceedings of the IEEE Conference on ComputerVision and Pattern Recognition, 2014, pp. 1653–1660.
[55] J. J. Tompson, A. Jain, Y. LeCun, and C. Bregler, “Joint trainingof a convolutional network and a graphical model for human poseestimation,” in Advances in neural information processing systems, 2014,pp. 1799–1807.
15
[56] D. Sadigh, K. Driggs-Campbell, A. Puggelli, W. Li, V. Shia, R. Bajcsy,A. L. Sangiovanni-Vincentelli, S. S. Sastry, and S. A. Seshia, “Data-driven probabilistic modeling and verification of human driver behavior,”Formal Verification and Modeling in Human-Machine Systems, 2014.
[57] R. O. Mbouna, S. G. Kong, and M.-G. Chun, “Visual analysis of eyestate and head pose for driver alertness monitoring,” IEEE transactionson intelligent transportation systems, vol. 14, no. 3, pp. 1462–1469,2013.
[58] B. Zhou, A. Lapedriza, J. Xiao, A. Torralba, and A. Oliva, “Learningdeep features for scene recognition using places database,” in Advancesin neural information processing systems, 2014, pp. 487–495.
[59] H. Xu, Y. Gao, F. Yu, and T. Darrell, “End-to-end learning of drivingmodels from large-scale video datasets,” in The IEEE Conference on
Computer Vision and Pattern Recognition (CVPR), July 2017.[60] M. Bojarski, D. Del Testa, D. Dworakowski, B. Firner, B. Flepp,
P. Goyal, L. D. Jackel, M. Monfort, U. Muller, J. Zhang et al., “Endto end learning for self-driving cars,” arXiv preprint arXiv:1604.07316,2016.
[62] L. Fridman, D. E. Brown, W. Angell, I. Abdic, B. Reimer, and H. Y.Noh, “Automated synchronization of driving data using vibration andsteering events,” Pattern Recognition Letters, vol. 75, pp. 9–15, 2016.
[63] R. Li, C. Liu, and F. Luo, “A design for automotive can bus monitoringsystem,” in Vehicle Power and Propulsion Conference, 2008. VPPC’08.IEEE. IEEE, 2008, pp. 1–5.