Vysoké učení technické v Brně Fakulta stavební Studentská vědecká a odborná činnost Akademický rok 2011/2012 Non-destructive tests of timber Nedestruktivní testování dřeva Jméno a příjmení studenta, ročník, obor: Eliška Bartůňková, 1. ročník magisterského studia, C Vedoucí práce: Ing. Anna Kuklíková Ph.D., doc.Ing. Petr Kuklík, CSc. Katedra / Ústav: Katedra ocelových a dřevěných konstrukcí / ČVUT FSv
Transcript
Vysoké učení technické v Brně Fakulta stavební
Studentská vědecká a odborná činnost Akademický rok 2011/2012
Non-destructive tests of timber
Nedestruktivní testování dřeva
Jméno a příjmení studenta, ročník, obor: Eliška Bartůňková, 1. ročník
Dřevo je jeden z nejčastěji používaných materialů historických budov. Statické posouzení existující dřevěné stavby je obvykle založené na vizuální inspekci a na nedestruktivních testech provedené v místě stavby za účelem spolehlivého odhadu mechanických a fyzikálních vlastností, kdy jsou současně dodržena základní pravidla ochrany památek a způsobena je pouze minimální škoda.
Hlavní cílem této práce je korelovat výsledky nedestruktivních a mechanických testů provedených na nedegradovaných prostředních částech 20 starých kaštanových (Castanea Sativa Mill.) trámech a tedy posoudit spolehlivost nedestruktivních testů pro odhad pevnosti, tuhosti a hustoty. Součástí testovací kampaně byly následující zkoušky: mechanické testy (v tahu, v tlaku a v ohybu), nedestruktivní testy (ultrazvuk, metoda odporového vrtání a penetrační zkouška), vizuální inspekce a zkoušky hustoty a vlhkosti.
Abstract
Timber represents one of the most frequently used materials in historical constructions. The assessment of structural performance of an existing timber structure is usually based on in-situ visual inspection and non-destructive testing with the aim of a reliable estimation of mechanical and physical properties while respecting the essential preservation rule of minimum damage to any historical monument.
Main objective of this work is to correlate non-destructive tests and mechanical tests results, both measured on undecayed middle parts of 20 old chestnut (Castanea sativa Mill.) beams approximately hundred years old, and therefore assess the reliability of non-destructive testing used for strength, stiffness and density estimation. In the test campaign were applied the following measurements: mechanical tests (tension, compression and bending tests), non-destructive tests (ultrasound, resistance drilling and penetration test), visual inspection, density and MC tests.
4
1 Introduction
1.1 Motivation
Timber is one of the most frequently used building materials, together with masonry and stone, in historical monuments structures. The oldest timber constructions can be traced back to thousand years ago in various structural typologies.
Assessment of structural behaviour and safety of historical timber structures ought to be performed in accordance with the preservation rule of minimum damage. This requirement favours the use of visual inspection and non-destructive testing methods (NDT´s) and aims to exclude mechanical tests which have a destructive impact. However, it is of utmost importance to consider the reliability of the NDT´s methodology used for the structural assessment of existing timber structures.
Correlation found between NDT´s and mechanical tests results are not always reliable mostly due to the natural variability of timber properties. Especially in case of old decayed timber, the correlations are rather moderate or weak depending on the testing method used.
In practice, in-situ inspection together with assessment of residual mechanical properties represent the first steps towards diagnosis, structural analysis and the decision about eventual intervention measures.
1.2 Objectives and Methodology
Main objective of this work is to establish correlations between non-destructive tests, density values and mechanical tests results, all of them measured on undecayed middle parts of 20 chestnut (Castanea sativa Mill.) beams with approximately hundred years old. The main purpose is to find those correlations in order to assess the reliability of non-destructive testing for stiffness and strength in-situ estimation of existing timber elements.
The test campaign performed on undecayed middle parts of original beams includes NDT´s, such as ultrasonic pulse velocity test (UPV), resistance drilling (using the device of Resistograph®) and penetration test (used device: Pilodyn®), and mechanical tests, such as bending, tension and compression tests.
2 Non-destructive tests (NDT´s)
2.1 Overview of non-destructive tests
Density together with bending strength and modulus of elasticity (MoE) are three main characteristics of timber from which can be derived other important mechanical parameters of timber on the basis of empirical relations. That is why these three main parameters are being correlated with output parameters of NDT´s in order to find relations among destructive and non-destructive methods and thus replace destructive tests with NDT´s.
Two main groups of NDT´s can be distinguished as follows: global test methods (GTM) and local test methods (LTM) [1]. GTM include:
Semi-destructive / minor-destructive tests (MDT): resistance drilling, penetration test, videoscopy, small non-standard sample testing, etc.
2.2 NDTs used in this work
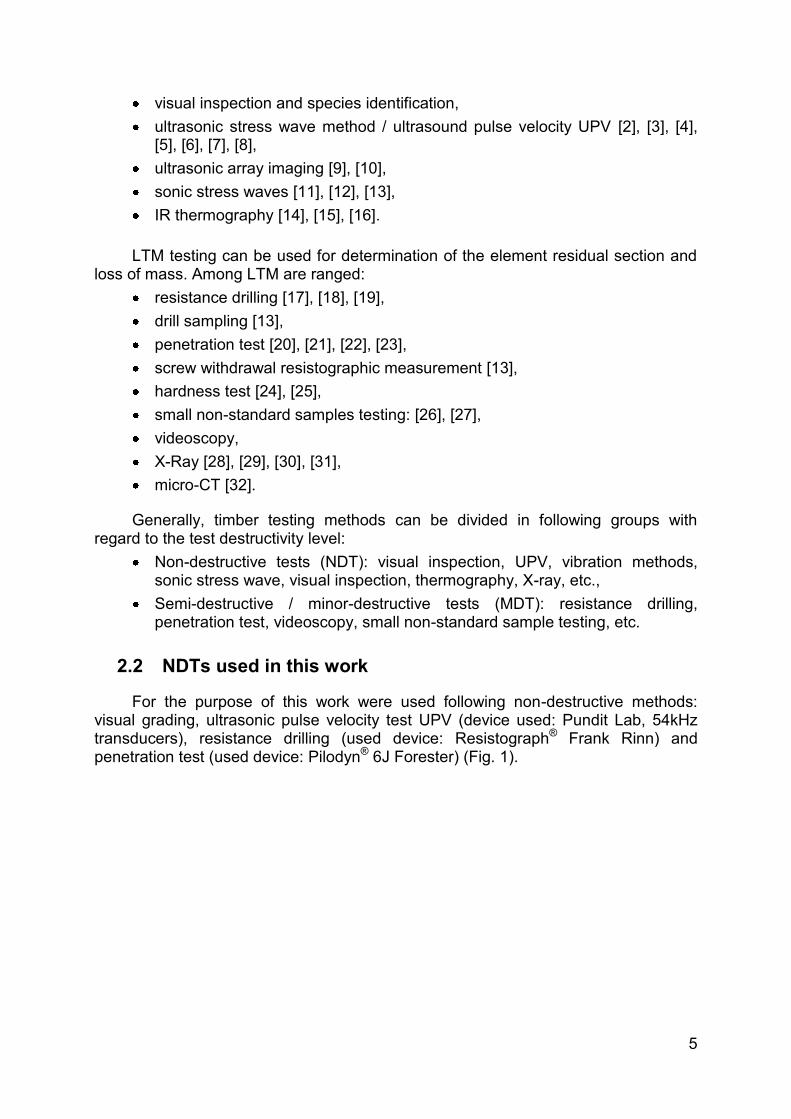
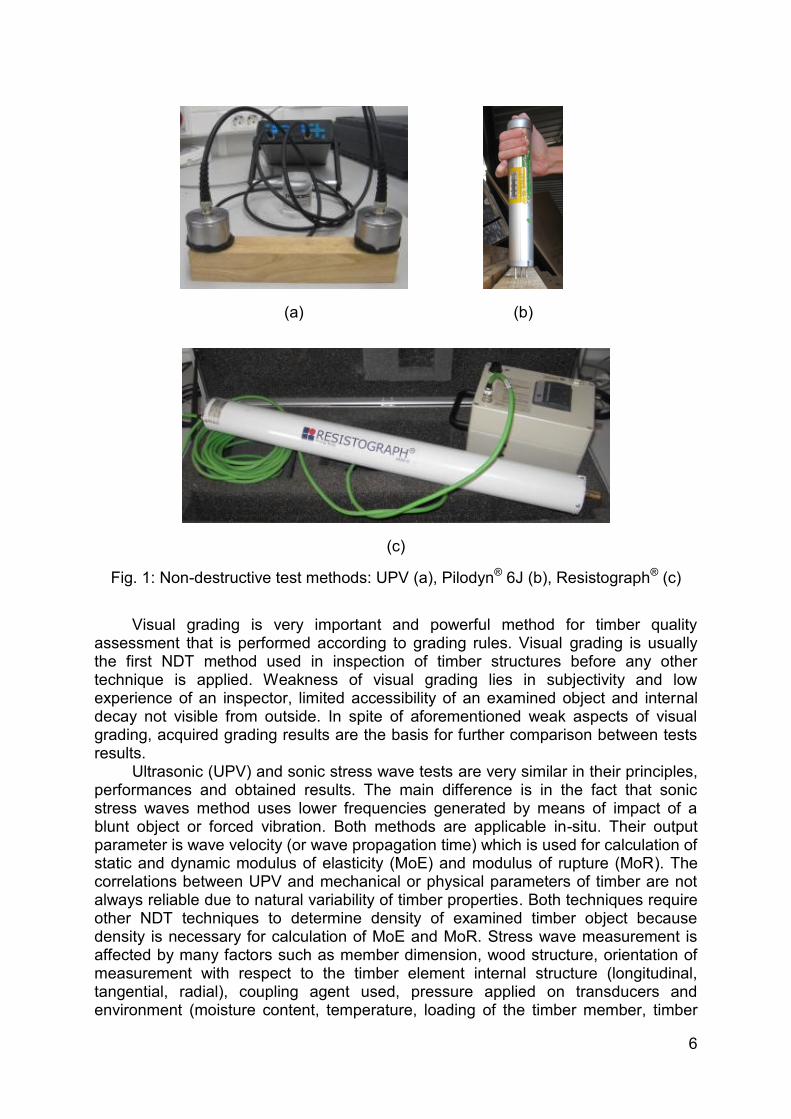
For the purpose of this work were used following non-destructive methods: visual grading, ultrasonic pulse velocity test UPV (device used: Pundit Lab, 54kHz transducers), resistance drilling (used device: Resistograph® Frank Rinn) and penetration test (used device: Pilodyn® 6J Forester) (Fig. 1).
Visual grading is very important and powerful method for timber quality assessment that is performed according to grading rules. Visual grading is usually the first NDT method used in inspection of timber structures before any other technique is applied. Weakness of visual grading lies in subjectivity and low experience of an inspector, limited accessibility of an examined object and internal decay not visible from outside. In spite of aforementioned weak aspects of visual grading, acquired grading results are the basis for further comparison between tests results.
Ultrasonic (UPV) and sonic stress wave tests are very similar in their principles, performances and obtained results. The main difference is in the fact that sonic stress waves method uses lower frequencies generated by means of impact of a blunt object or forced vibration. Both methods are applicable in-situ. Their output parameter is wave velocity (or wave propagation time) which is used for calculation of static and dynamic modulus of elasticity (MoE) and modulus of rupture (MoR). The correlations between UPV and mechanical or physical parameters of timber are not always reliable due to natural variability of timber properties. Both techniques require other NDT techniques to determine density of examined timber object because density is necessary for calculation of MoE and MoR. Stress wave measurement is affected by many factors such as member dimension, wood structure, orientation of measurement with respect to the timber element internal structure (longitudinal, tangential, radial), coupling agent used, pressure applied on transducers and environment (moisture content, temperature, loading of the timber member, timber
7
treatment). In case of sonic stress wave method the problem with coupling agent can be omitted when using transducers with spikes properly drilled into timber element.
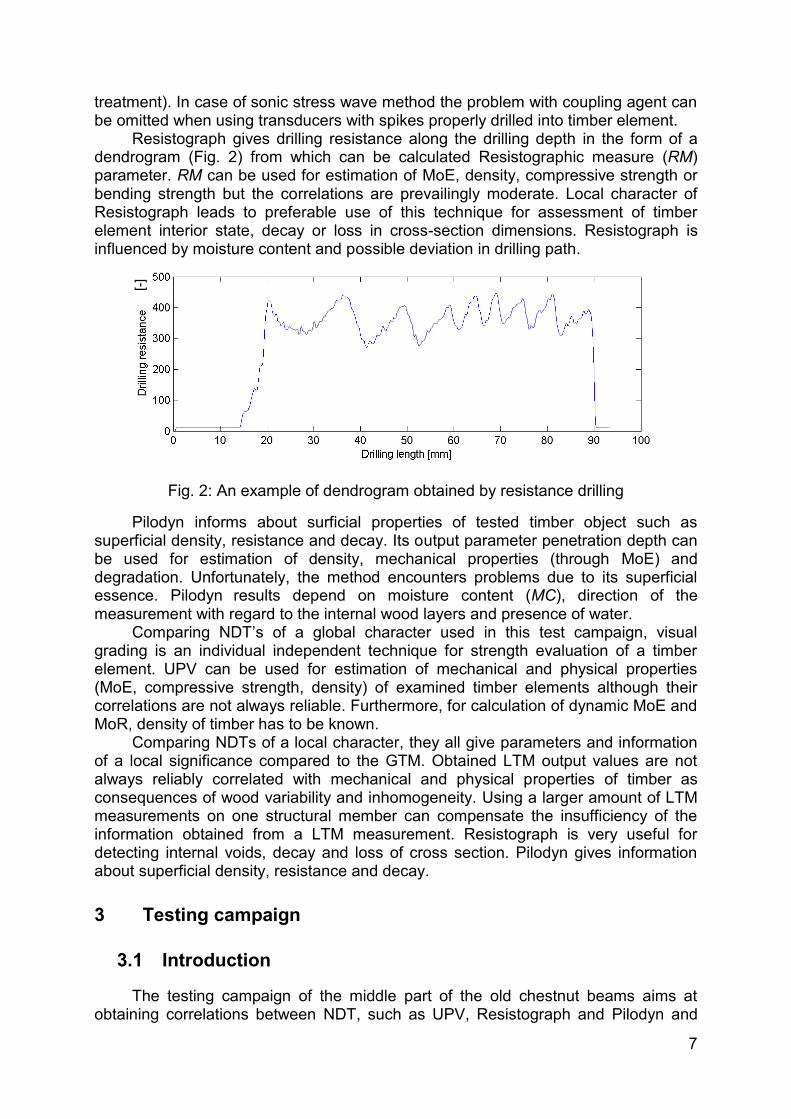
Resistograph gives drilling resistance along the drilling depth in the form of a dendrogram (Fig. 2) from which can be calculated Resistographic measure (RM) parameter. RM can be used for estimation of MoE, density, compressive strength or bending strength but the correlations are prevailingly moderate. Local character of Resistograph leads to preferable use of this technique for assessment of timber element interior state, decay or loss in cross-section dimensions. Resistograph is influenced by moisture content and possible deviation in drilling path.
Fig. 2: An example of dendrogram obtained by resistance drilling
Pilodyn informs about surficial properties of tested timber object such as superficial density, resistance and decay. Its output parameter penetration depth can be used for estimation of density, mechanical properties (through MoE) and degradation. Unfortunately, the method encounters problems due to its superficial essence. Pilodyn results depend on moisture content (MC), direction of the measurement with regard to the internal wood layers and presence of water.
Comparing NDT’s of a global character used in this test campaign, visual grading is an individual independent technique for strength evaluation of a timber element. UPV can be used for estimation of mechanical and physical properties (MoE, compressive strength, density) of examined timber elements although their correlations are not always reliable. Furthermore, for calculation of dynamic MoE and MoR, density of timber has to be known.
Comparing NDTs of a local character, they all give parameters and information of a local significance compared to the GTM. Obtained LTM output values are not always reliably correlated with mechanical and physical properties of timber as consequences of wood variability and inhomogeneity. Using a larger amount of LTM measurements on one structural member can compensate the insufficiency of the information obtained from a LTM measurement. Resistograph is very useful for detecting internal voids, decay and loss of cross section. Pilodyn gives information about superficial density, resistance and decay.
3 Testing campaign
3.1 Introduction
The testing campaign of the middle part of the old chestnut beams aims at obtaining correlations between NDT, such as UPV, Resistograph and Pilodyn and
[-]
8
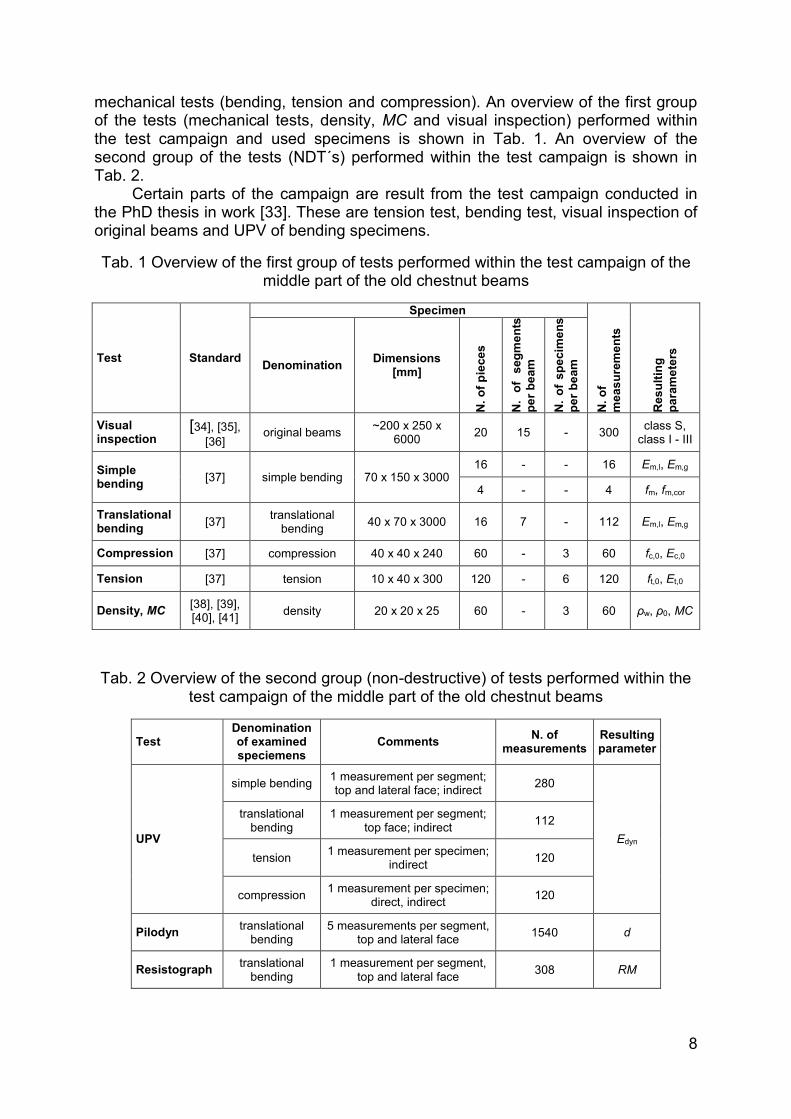
mechanical tests (bending, tension and compression). An overview of the first group of the tests (mechanical tests, density, MC and visual inspection) performed within the test campaign and used specimens is shown in Tab. 1. An overview of the second group of the tests (NDT´s) performed within the test campaign is shown in Tab. 2.
Certain parts of the campaign are result from the test campaign conducted in the PhD thesis in work [33]. These are tension test, bending test, visual inspection of original beams and UPV of bending specimens.
Tab. 1 Overview of the first group of tests performed within the test campaign of the middle part of the old chestnut beams
Test Standard
Specimen
N.
of
me
as
ure
me
nts
Re
su
ltin
g
pa
ram
ete
rs
Denomination Dimensions
[mm]
N.
of
pie
ce
s
N.
of
seg
me
nts
pe
r b
eam
N.
of
sp
ecim
en
s
pe
r b
eam
Visual inspection
[34], [35],
[36] original beams
~200 x 250 x 6000
20 15 - 300 class S,
class I - III
Simple bending
[37] simple bending 70 x 150 x 3000 16 - - 16 Em,l, Em,g
4 - - 4 fm, fm,cor
Translational bending
[37] translational
bending 40 x 70 x 3000 16 7 - 112 Em,l, Em,g
Compression [37] compression 40 x 40 x 240 60 - 3 60 fc,0, Ec,0
Tension [37] tension 10 x 40 x 300 120 - 6 120 ft,0, Et,0
Density, MC [38], [39], [40], [41]
density 20 x 20 x 25 60 - 3 60 ρw, ρ0, MC
Tab. 2 Overview of the second group (non-destructive) of tests performed within the test campaign of the middle part of the old chestnut beams
Test Denomination of examined speciemens
Comments N. of
measurements Resulting parameter
UPV
simple bending 1 measurement per segment; top and lateral face; indirect
280
Edyn
translational bending
1 measurement per segment; top face; indirect
112
tension 1 measurement per specimen;
indirect 120
compression 1 measurement per specimen;
direct, indirect 120
Pilodyn translational
bending 5 measurements per segment,
top and lateral face 1540 d
Resistograph translational
bending 1 measurement per segment,
top and lateral face 308 RM
9
3.2 Specimen description
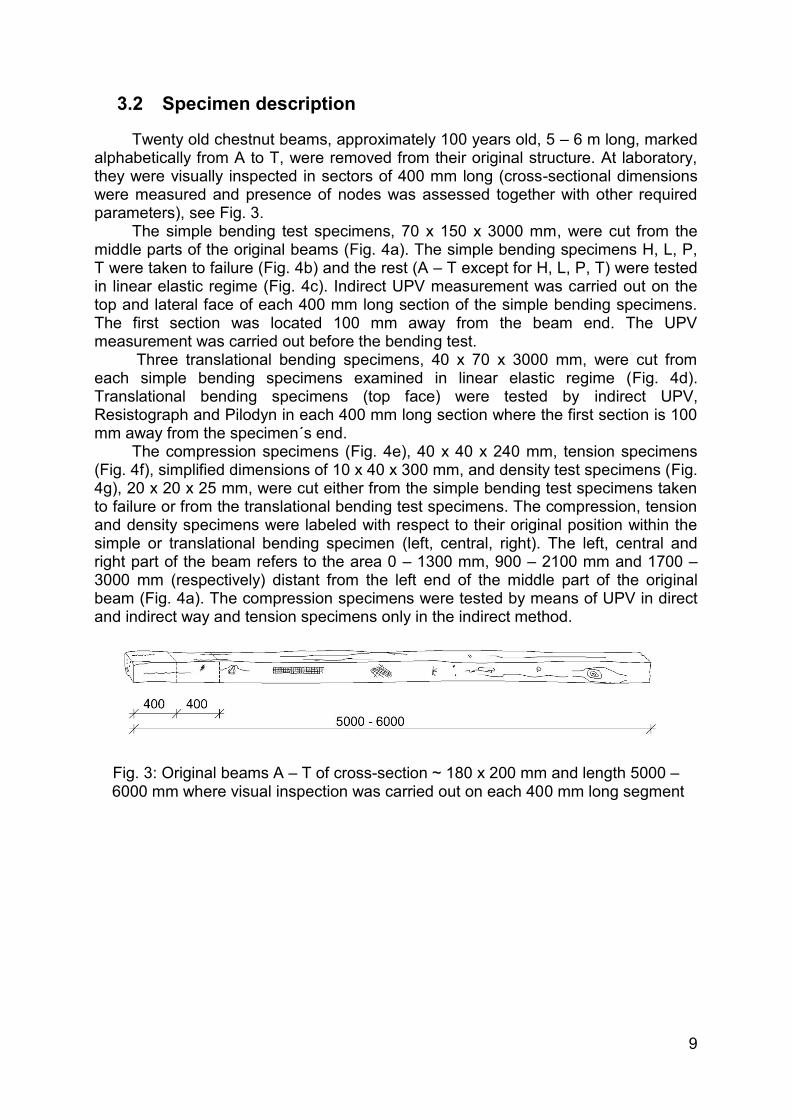
Twenty old chestnut beams, approximately 100 years old, 5 – 6 m long, marked alphabetically from A to T, were removed from their original structure. At laboratory, they were visually inspected in sectors of 400 mm long (cross-sectional dimensions were measured and presence of nodes was assessed together with other required parameters), see Fig. 3.
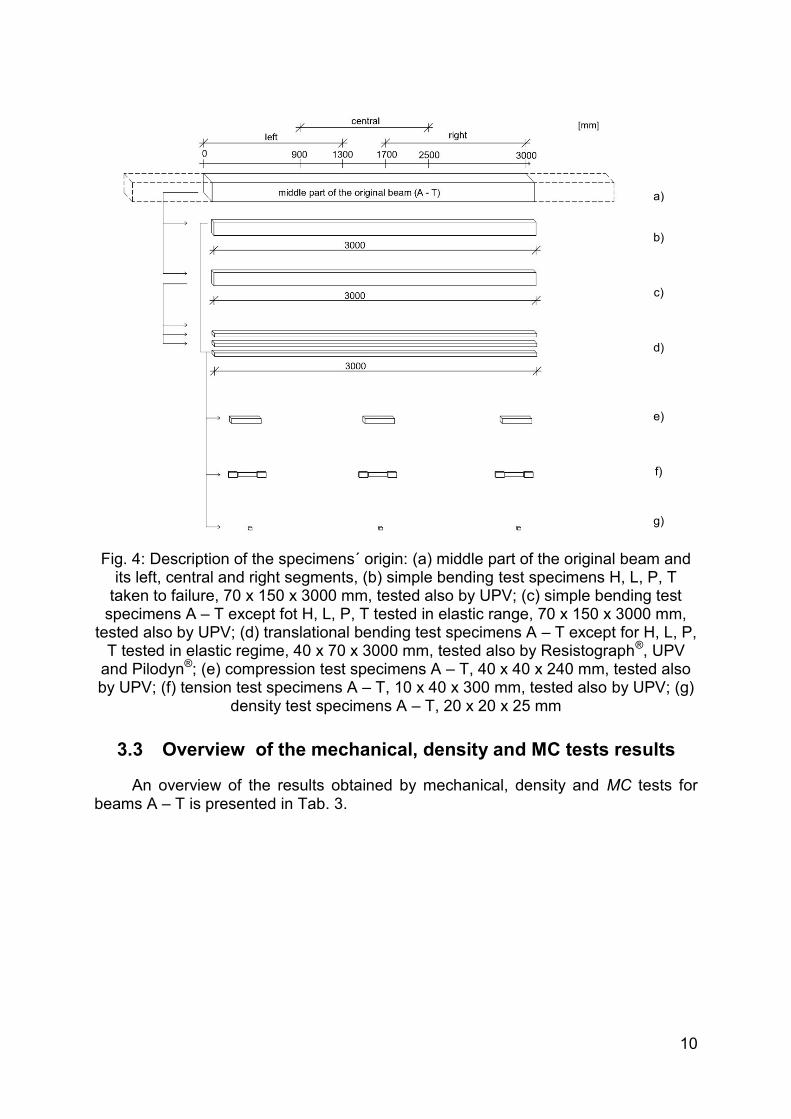
The simple bending test specimens, 70 x 150 x 3000 mm, were cut from the middle parts of the original beams (Fig. 4a). The simple bending specimens H, L, P, T were taken to failure (Fig. 4b) and the rest (A – T except for H, L, P, T) were tested in linear elastic regime (Fig. 4c). Indirect UPV measurement was carried out on the top and lateral face of each 400 mm long section of the simple bending specimens. The first section was located 100 mm away from the beam end. The UPV measurement was carried out before the bending test.
Three translational bending specimens, 40 x 70 x 3000 mm, were cut from each simple bending specimens examined in linear elastic regime (Fig. 4d). Translational bending specimens (top face) were tested by indirect UPV, Resistograph and Pilodyn in each 400 mm long section where the first section is 100 mm away from the specimen´s end.
The compression specimens (Fig. 4e), 40 x 40 x 240 mm, tension specimens (Fig. 4f), simplified dimensions of 10 x 40 x 300 mm, and density test specimens (Fig. 4g), 20 x 20 x 25 mm, were cut either from the simple bending test specimens taken to failure or from the translational bending test specimens. The compression, tension and density specimens were labeled with respect to their original position within the simple or translational bending specimen (left, central, right). The left, central and right part of the beam refers to the area 0 – 1300 mm, 900 – 2100 mm and 1700 – 3000 mm (respectively) distant from the left end of the middle part of the original beam (Fig. 4a). The compression specimens were tested by means of UPV in direct and indirect way and tension specimens only in the indirect method.
Fig. 3: Original beams A – T of cross-section ~ 180 x 200 mm and length 5000 – 6000 mm where visual inspection was carried out on each 400 mm long segment
10
(
a)
b)
c)
d)
e)
f)
(g)
Fig. 4: Description of the specimens´ origin: (a) middle part of the original beam and its left, central and right segments, (b) simple bending test specimens H, L, P, T
taken to failure, 70 x 150 x 3000 mm, tested also by UPV; (c) simple bending test specimens A – T except fot H, L, P, T tested in elastic range, 70 x 150 x 3000 mm,
tested also by UPV; (d) translational bending test specimens A – T except for H, L, P, T tested in elastic regime, 40 x 70 x 3000 mm, tested also by Resistograph®, UPV
and Pilodyn®; (e) compression test specimens A – T, 40 x 40 x 240 mm, tested also by UPV; (f) tension test specimens A – T, 10 x 40 x 300 mm, tested also by UPV; (g)
density test specimens A – T, 20 x 20 x 25 mm
3.3 Overview of the mechanical, density and MC tests results
An overview of the results obtained by mechanical, density and MC tests for beams A – T is presented in Tab. 3.
11
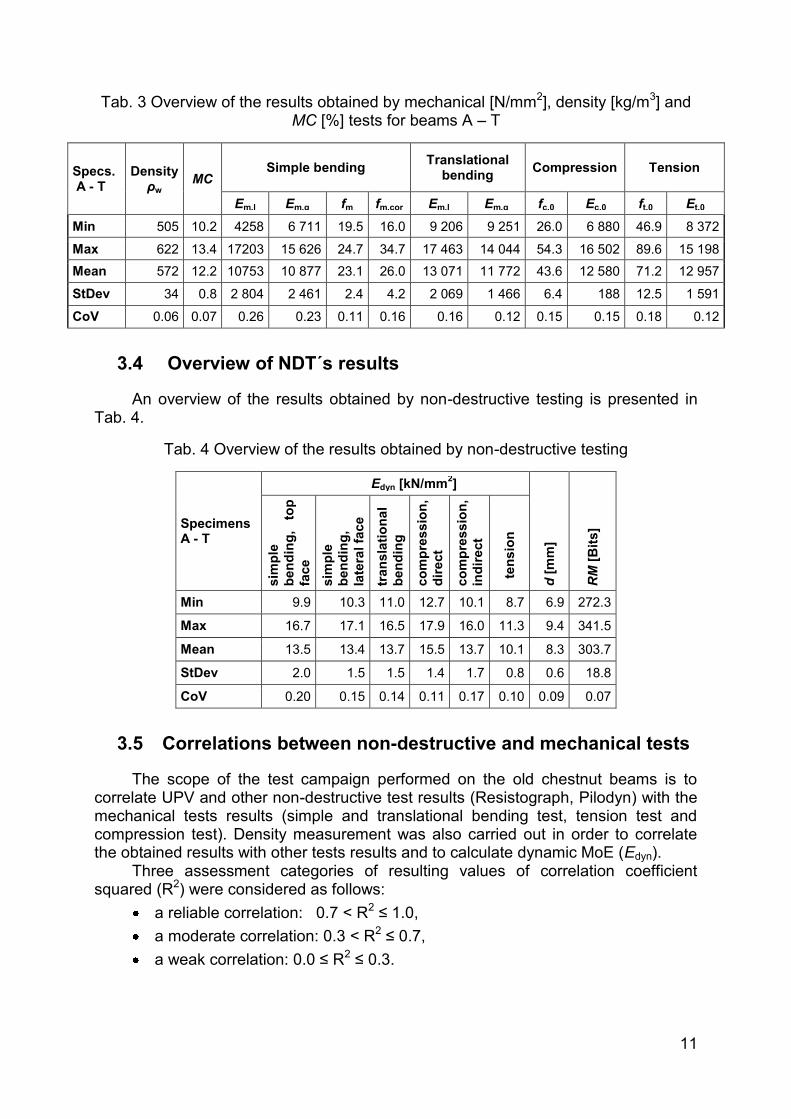
Tab. 3 Overview of the results obtained by mechanical [N/mm2], density [kg/m3] and MC [%] tests for beams A – T
An overview of the results obtained by non-destructive testing is presented in Tab. 4.
Tab. 4 Overview of the results obtained by non-destructive testing
Specimens A - T
Edyn [kN/mm2]
d [
mm
]
RM
[B
its]
sim
ple
ben
din
g,
top
face
sim
ple
ben
din
g,
late
ral fa
ce
tran
sla
tio
na
l
ben
din
g
co
mp
res
sio
n,
dir
ect
co
mp
res
sio
n,
ind
irect
ten
sio
n
Min 9.9 10.3 11.0 12.7 10.1 8.7 6.9 272.3
Max 16.7 17.1 16.5 17.9 16.0 11.3 9.4 341.5
Mean 13.5 13.4 13.7 15.5 13.7 10.1 8.3 303.7
StDev 2.0 1.5 1.5 1.4 1.7 0.8 0.6 18.8
CoV 0.20 0.15 0.14 0.11 0.17 0.10 0.09 0.07
3.5 Correlations between non-destructive and mechanical tests
The scope of the test campaign performed on the old chestnut beams is to correlate UPV and other non-destructive test results (Resistograph, Pilodyn) with the mechanical tests results (simple and translational bending test, tension test and compression test). Density measurement was also carried out in order to correlate the obtained results with other tests results and to calculate dynamic MoE (Edyn).
Three assessment categories of resulting values of correlation coefficient squared (R2) were considered as follows:
a reliable correlation: 0.7 < R2 ≤ 1.0,
a moderate correlation: 0.3 < R2 ≤ 0.7,
a weak correlation: 0.0 ≤ R2 ≤ 0.3.
12
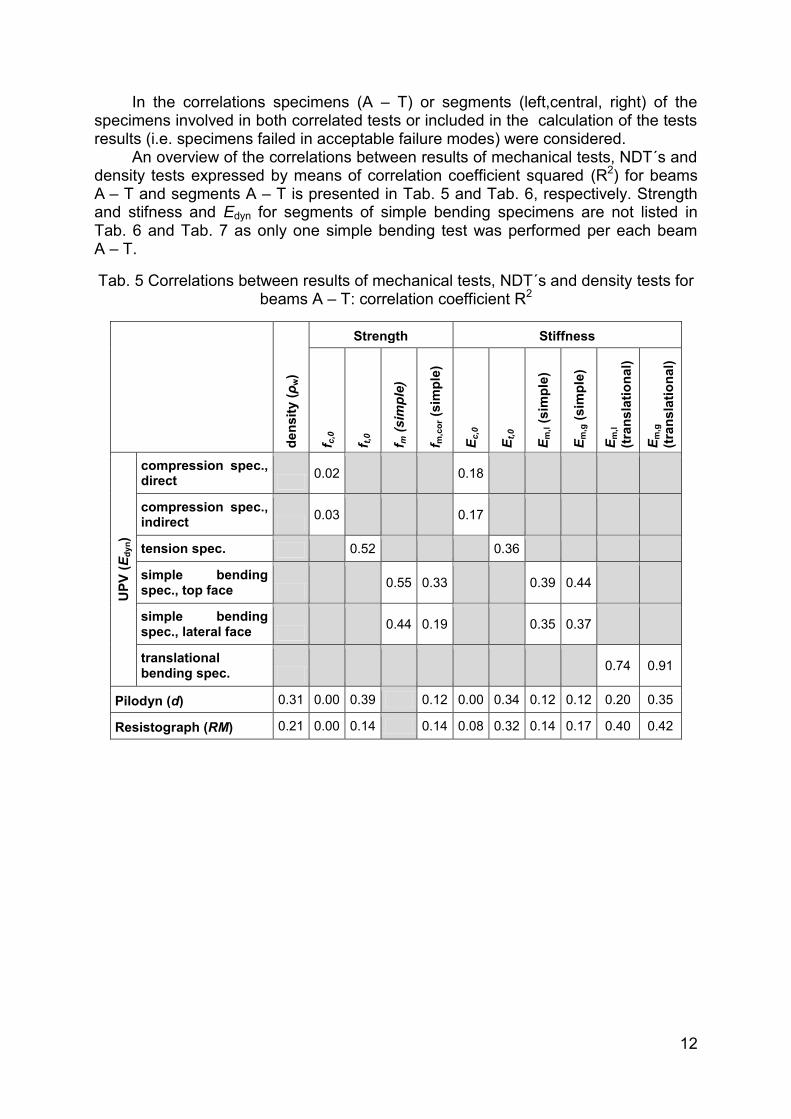
In the correlations specimens (A – T) or segments (left,central, right) of the specimens involved in both correlated tests or included in the calculation of the tests results (i.e. specimens failed in acceptable failure modes) were considered.
An overview of the correlations between results of mechanical tests, NDT´s and density tests expressed by means of correlation coefficient squared (R2) for beams A – T and segments A – T is presented in Tab. 5 and Tab. 6, respectively. Strength and stifness and Edyn for segments of simple bending specimens are not listed in Tab. 6 and Tab. 7 as only one simple bending test was performed per each beam A – T.
Tab. 5 Correlations between results of mechanical tests, NDT´s and density tests for beams A – T: correlation coefficient R2
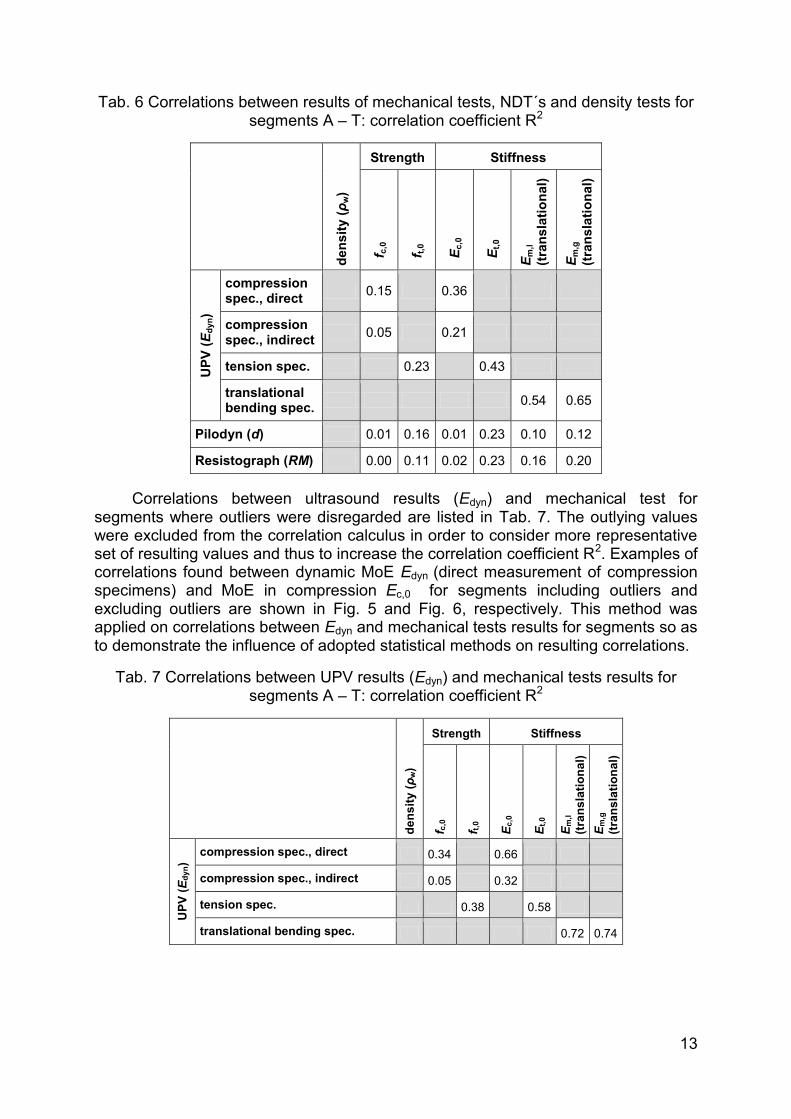
Tab. 6 Correlations between results of mechanical tests, NDT´s and density tests for segments A – T: correlation coefficient R2
den
sit
y (ρ
w)
Strength Stiffness
f c,0
f t,0
Ec,0
Et,
0
Em
,l
(tra
nsla
tio
nal)
Em
,g
(tra
nsla
tio
nal)
UP
V (
Ed
yn)
compression spec., direct
0.15 0.36
compression spec., indirect
0.05 0.21
tension spec. 0.23 0.43
translational bending spec.
0.54 0.65
Pilodyn (d) 0.01 0.16 0.01 0.23 0.10 0.12
Resistograph (RM) 0.00 0.11 0.02 0.23 0.16 0.20
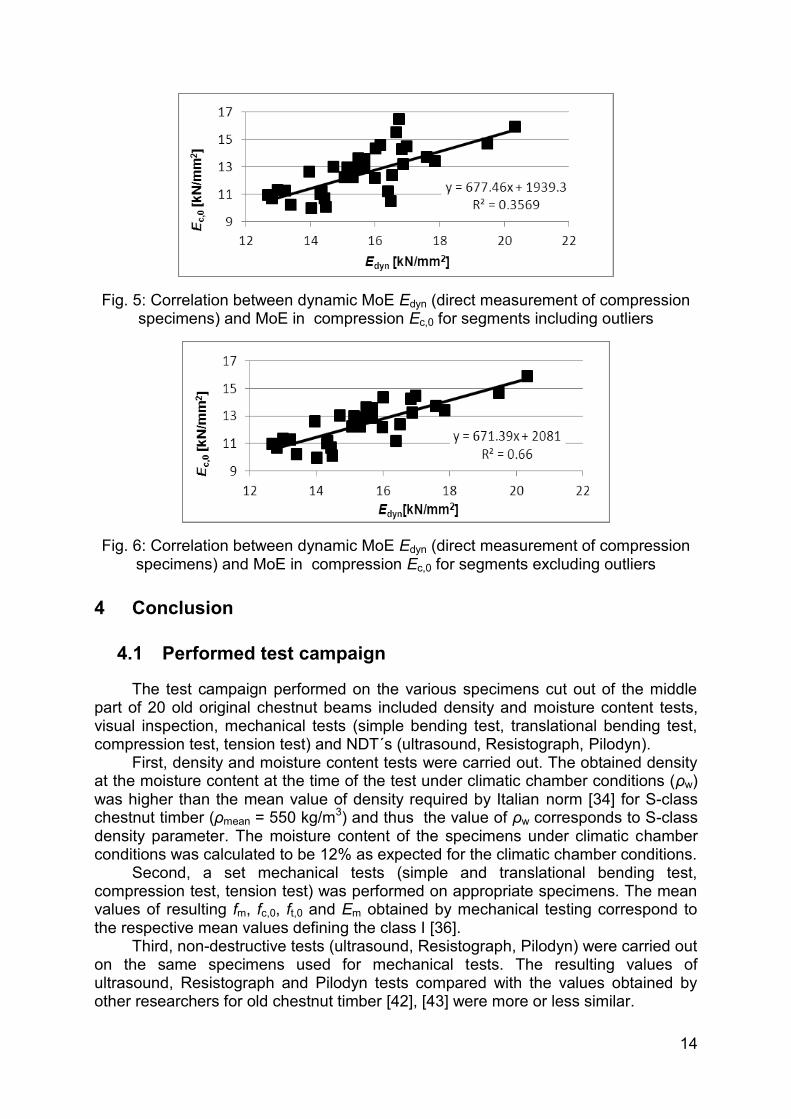
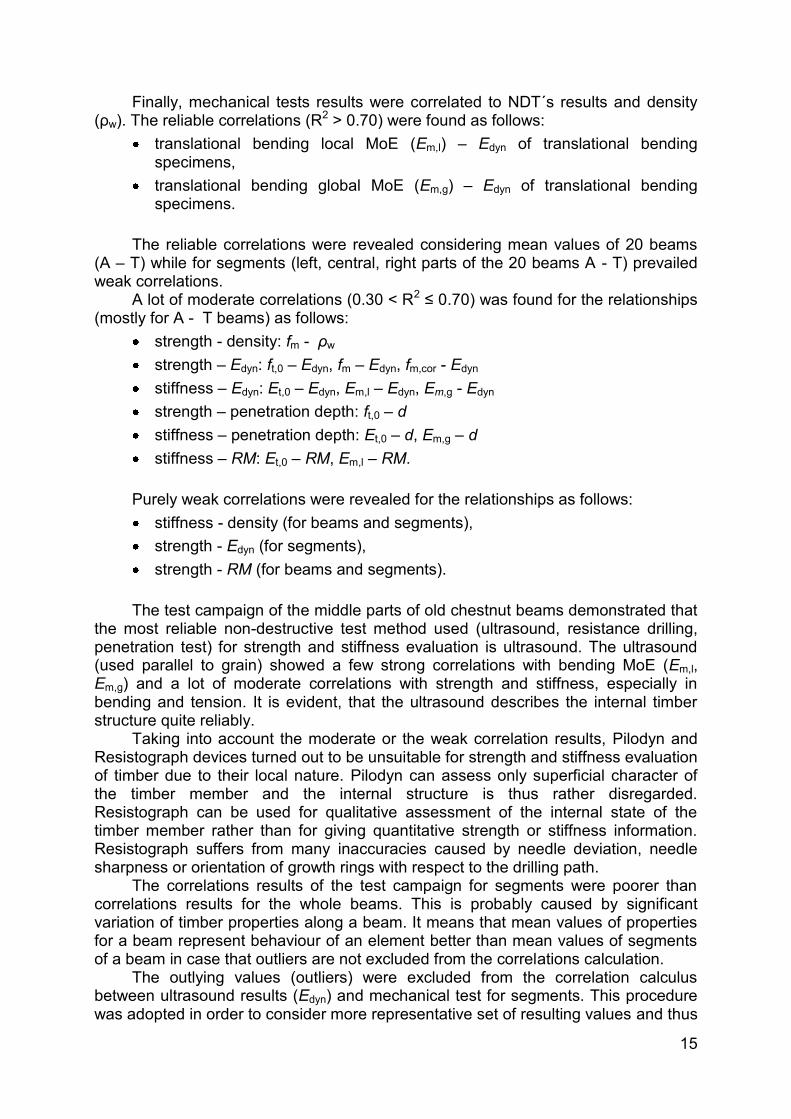
Correlations between ultrasound results (Edyn) and mechanical test for segments where outliers were disregarded are listed in Tab. 7. The outlying values were excluded from the correlation calculus in order to consider more representative set of resulting values and thus to increase the correlation coefficient R2. Examples of correlations found between dynamic MoE Edyn (direct measurement of compression specimens) and MoE in compression Ec,0 for segments including outliers and excluding outliers are shown in Fig. 5 and Fig. 6, respectively. This method was applied on correlations between Edyn and mechanical tests results for segments so as to demonstrate the influence of adopted statistical methods on resulting correlations.
Tab. 7 Correlations between UPV results (Edyn) and mechanical tests results for segments A – T: correlation coefficient R2
de
ns
ity (ρ
w)
Strength Stiffness
f c,0
f t,0
Ec
,0
Et,
0
Em
,l
(tra
ns
lati
on
al)
Em
,g
(tra
ns
lati
on
al)
UP
V (
Ed
yn)
compression spec., direct 0.34 0.66
compression spec., indirect 0.05 0.32
tension spec. 0.38
0.58
translational bending spec. 0.72 0.74
14
Fig. 5: Correlation between dynamic MoE Edyn (direct measurement of compression specimens) and MoE in compression Ec,0 for segments including outliers
Fig. 6: Correlation between dynamic MoE Edyn (direct measurement of compression specimens) and MoE in compression Ec,0 for segments excluding outliers
4 Conclusion
4.1 Performed test campaign
The test campaign performed on the various specimens cut out of the middle part of 20 old original chestnut beams included density and moisture content tests, visual inspection, mechanical tests (simple bending test, translational bending test, compression test, tension test) and NDT´s (ultrasound, Resistograph, Pilodyn).
First, density and moisture content tests were carried out. The obtained density at the moisture content at the time of the test under climatic chamber conditions (ρw) was higher than the mean value of density required by Italian norm [34] for S-class chestnut timber (ρmean = 550 kg/m3) and thus the value of ρw corresponds to S-class density parameter. The moisture content of the specimens under climatic chamber conditions was calculated to be 12% as expected for the climatic chamber conditions.
Second, a set mechanical tests (simple and translational bending test, compression test, tension test) was performed on appropriate specimens. The mean values of resulting fm, fc,0, ft,0 and Em obtained by mechanical testing correspond to the respective mean values defining the class I [36].
Third, non-destructive tests (ultrasound, Resistograph, Pilodyn) were carried out on the same specimens used for mechanical tests. The resulting values of ultrasound, Resistograph and Pilodyn tests compared with the values obtained by other researchers for old chestnut timber [42], [43] were more or less similar.
15
Finally, mechanical tests results were correlated to NDT´s results and density (ρw). The reliable correlations (R2 > 0.70) were found as follows:
translational bending local MoE (Em,l) – Edyn of translational bending specimens,
translational bending global MoE (Em,g) – Edyn of translational bending specimens.
The reliable correlations were revealed considering mean values of 20 beams
(A – T) while for segments (left, central, right parts of the 20 beams A - T) prevailed weak correlations.
A lot of moderate correlations (0.30 < R2 ≤ 0.70) was found for the relationships (mostly for A - T beams) as follows:
Purely weak correlations were revealed for the relationships as follows:
stiffness - density (for beams and segments),
strength - Edyn (for segments),
strength - RM (for beams and segments).
The test campaign of the middle parts of old chestnut beams demonstrated that
the most reliable non-destructive test method used (ultrasound, resistance drilling, penetration test) for strength and stiffness evaluation is ultrasound. The ultrasound (used parallel to grain) showed a few strong correlations with bending MoE (Em,l, Em,g) and a lot of moderate correlations with strength and stiffness, especially in bending and tension. It is evident, that the ultrasound describes the internal timber structure quite reliably.
Taking into account the moderate or the weak correlation results, Pilodyn and Resistograph devices turned out to be unsuitable for strength and stiffness evaluation of timber due to their local nature. Pilodyn can assess only superficial character of the timber member and the internal structure is thus rather disregarded. Resistograph can be used for qualitative assessment of the internal state of the timber member rather than for giving quantitative strength or stiffness information. Resistograph suffers from many inaccuracies caused by needle deviation, needle sharpness or orientation of growth rings with respect to the drilling path.
The correlations results of the test campaign for segments were poorer than correlations results for the whole beams. This is probably caused by significant variation of timber properties along a beam. It means that mean values of properties for a beam represent behaviour of an element better than mean values of segments of a beam in case that outliers are not excluded from the correlations calculation.
The outlying values (outliers) were excluded from the correlation calculus between ultrasound results (Edyn) and mechanical test for segments. This procedure was adopted in order to consider more representative set of resulting values and thus
16
to increase the correlation coefficient R2. This method demonstrated the influence of adopted statistical methods on resulting correlations.
4.2 Suggested methodology for in-situ inspection
Based on the results obtained in test campaigns performed in this work, a suitable methodology for an in-situ inspection can be composed of visual inspection and NDT´s such as ultrasound, Pilodyn and Resistograph. An inspector can obtain quantitative and qualitative values of strength, stiffness and NDT parameters.
The NDT parameters can be used for estimation of density and other mechanical characteristics using the correlations already found for the examined timber species. At the same time, NDT parameters can give qualitative information about internal state (UPV, Resistograph) or superficial state (Pilodyn) of a timber element. Knowing the reference NDT values of examined timber, the state of the structure can be assessed directly at construction site. Generally, NDT´s used in proposed methodology have a local character which requires a performance of a lot of NDT´s within each specimen.
Comparing UPV values obtained in-situ with reference UPV values for a timber species, the level of internal decay can be revealed. Also Resistograph can give information about internal presence of voids, cross-section and resistance of tested material. Although in-situ information given by Resistograph in the form of dendrogram is rather qualitative as resistographic measure (RM) has to be analyzed in office. Pilodyn gives penetration depth values in-situ at the time of measurement which can be after calculation of their average value compared with reference penetration depth values and thus the superficial state of the material can be assessed.
In case of decayed timber, the in-situ inspection encounters some difficulties such as dirty and rough surface, internal voids or external irregularity in shape due to decay. It was concluded by the performed test campaign that visual inspection is overconservative for old decayed timber specimens. Therefore, NDT´s must be used together with visual inspection, since it was shown that: (i) ultrasonic velocity differs for decayed and undecayed specimens (lower values of velocity for decayed specimens); (ii) penetration depth of Pilodyn increases significantly with decay; (iii) Resistograph may find internal voids and decay.
17
References
[1] Baldassino, N., Piazza, M. and Zanon, P. In situ evaluation of mechanical properties of timber structural elements. Proceedings of the 10th International Symposium on NDT of Wood. (Presses Polytechniques et Universitaires Romans) 369-378. Lausanne 1996
[2] Sandoz, J. Grading of construction timber by ultrasound. Wood Science Technology. 23: pp. 95-108. 1989
[3] Bucur, V. Acoustics of wood. 1st Ed. CRC Press Inc. 284 pp. NY 1995 [4] Ross, R., DeGroot, r., Nelson, W., Lebow, P. The relationship between stress
wave transmission characteristics and the compressive strength of biologically degraded wood. Forest Products Journal. Vol. 47(5). pp. 89-93. 1997
[5] Ross, R., Pellerin, R. Non-destructive testing for assessing wood members in structures: A review. Gen. Tech. Rep. FPL-GTR-70 (Rev.). Madison, WI: U.S. Department of Agriculture, Forest Service, Forest Products Laboratory: 40 pp. 1994
[6] Ross, R., J., Hunt, M., O. Stress wave timing nondestructive evaluation tools for inspecting historic structures – A guide for use and interpretation. Madison. WI: U.S. Department of Agriculture. Forest Service, Forest Product Laboratory, 15 pp. 2000
[7] Oliveira, F., G., R., Campos, J. A. O., Sales, A. Ultrasonic measurements in Brazilian hardwood. Materials research 5 (1). pp. 2443-2446. 2002
[8] Wang, S., Chiu, C., Liu, C. Application of the drilling resistance method for annual ring characteristics: evaluation of Taiwania (Taiwania cryptomerioides) trees grown with different thinning and pruning treatments. J. Wood Sci. Vol. 49: pp. 116-124. 2003
[9] Krause, M., Mielentz, F., Milman, B., Muller, W., Schmitz, W., Wiggenhauser, H. Ultrasonic imaging of concrete members using an array system, NDT&E International 34 (2001) 403-408. 2001
[10] Kroggel, O., Hasenstab, A., Lutz, J., Hgarrecht, H. Recognition of Local Defects in Timber Constructions to Optimize Repair Work. 2011
[11] Ross, R., Pellerin, R., Volny, N., Salsig, W., Falk, R. Inspection of timber bridges using stress wave timing non-destructive evaluation tools – A guide for use and interpretation. Gen. Tech. Rep. FPL-GTR-114. Madison. WI: U.S. Department of Agriculture, Forest Service, Forest Products Laboratory: 15 pp. 1999
[12] Divos, F. Defect detection in timber by stress wave time and amplitude. NDT.net – March 2001. Vol. 6, No. 03. 2000
[13] Divos, F., Kiss, F., S., Takats, P. Evaluation of historical wooden structures using nondestructive methods. 2011
[14] Tanaka, T. Wood inspection by thermography, NDT.net – March 2001. Vol. 6. No. 03. 2000
[15] Berglind, H., Dillenz, A. Detection of glue deficiency in laminated wood with pulse thermography. Journal of Wood and Science. Vol. 49: pp. 216–220. 2003
[16] Kandemir-Yucel,A., Tavukcuoglu, A., Caner-Saltik,E., N. In situ assessment of structural timber elements of a historic building by infrared thermography and ultrasonic velocity, Infrared Physics & Technology 49 (2007) 243–248. 2006
[17] Rinn, F. Catalogue of relative density profiles of trees, poles and timber derived from Resistograph® microdrillings. 9th International Symposium on Non-destructive Testing. Madison. USA: pp. 61-67. 1994
18
[18] Rinn, F., Schweingruber, F., Schar, E. Resistograph® and X-ray density charts of wood. Comparative evaluation of drill resistance profiles and X-ray density charts of different wood species. Holzforschung – International journal of the Biology, Chemistry, Physics and Technology of Wood. Vol. 50(4). 1996. pp. 303-311. 1996
[19] Kasal, B., Anthony, R. Advances in insitu evaluation of timber structures, Progress in Structural Engineering and Materials. John Villey&Sons Ltd. London UK. Vol. 6 No 2 April-June 2004. pp. 94-103, 100. 2004
[20] Gorlacher, R. Non-destructive testing of wood: an in-situ method for determination of density. Holz as Roh- und Werkstoff. Vol. 45: pp. 273-278. 1987
[21] Watt, M., Garnett, B., Walker, J. The use of the Pilodyn® for assessing outerwood density in New Zealand radiate pine. Forest Products Journal. Vol. 46 (11/12). pp. 101-105. 1996
[22] Ronca, P., Gubana, A. Mechanical characterization of wooden structures by means of an insitu penetration test. Elsevier publishing Co., Oxford, England, Construction and Building Materials 12, pp. 233-243. 1998
[23] Zombori, B. In situ non-destructive testing of built in wooden members, NDT.net – March 2000. Vol. 6. No. 03. 2000
[24] Piazza, M ., Turrini, G. Il recupero dei solai in legno, Esperienze e realizzazioni. In Recuperare. 1983
[25] Piazza, M., Riggio, M. Visual strength-grading and NDT of timber in traditional structures. Journal of Building Appraisal (2008) 3. 267 – 296. 2008
[26] Kasal, B., Drdacky, M., Jirovsky, I. Semi-destructive methods for evaluation of timber structures. Proceedings STREMAH VIII. Series: Advances in Architecture. Vol. 15: pp. 835-842. 2003
[27] Kasal, B., Anthony, W. Semi-destructive techniques for in-situ evaluation of historic wood structures. in Proceedings: In-Situ Evaluation & Non-destructive Testing of Historic Wood and Masonry Structures. edited by Luigia Binda, Miloš Drdácký and Bo Kasal. 2006
[28] Lindgren, O., Davis, J., Wells, P., Shabold, P. Non-destructive wood density distribution measurements using computed tomography: a comparison between two canners. Holz as Roh- und Werkstoff. Vol. 50(7/8): pp. 295-299. 1992
[29] Bucur, V., Garros, S., Navarette, E., De Troya, M., Guyonnet, R. Kinetics of wood degradation by fungi with x-ray microdensitometric technique. Wood Science and Technology. Vol. 31: pp. 383-389. 1997
[30] Bergsten, U., Lindeberg, J., Rindby, A., Evans, R. Batch measurements of wood density on intact or prepared drill cores using x-ray microdensiometry, Wood Science and Technology. Vol. 35: pp. 435-452. 2001
[31] Drdácký, M., F., Kloiber, M. Non-destructive survey of historic timber. in Proceedings: In-Situ Evaluation & Non-destructive Testing of Historic Wood and Masonry Structures. edited by Luigia Binda, Miloš Drdácký and Bo Kasal. 2006
[32] Bryscejn, J., Drdácký, M., Jakůbek, J., Valach, J., Vavřík, D., Weiss, P. Enhanced optical mehods for analysis of historical objects. Proceedings: Safeguard Cultural Heritage. Vol. 1, ISBN 978-80-86246-29-1, ITAM 2007
[33] Sousa, H. Methodologies for Safety Assessment of Existing Timber Structures. University of Minho. Department of Civil Engineering. Portugal (work in progress). 2011
[34] UNI 11119:2004 Beni culturali - Manufatti lignei - Strutture portanti degli edifici - Ispezione in situ per la diagnosi degli elementi in opera. UNI - Ente Nazionale Italiano di Unificazione
[35] UNI 11035-1:2003 Legno strutturale - Classificazione a vista di legnami italiani secondo la resistenza meccanica: terminologia e misurazione delle caratteristiche. UNI - Ente Nazionale Italiano di Unificazione
[36] UNI 11035-2:2003 Legno strutturale - Regole per la classificazione a vista secondo la resistenza e i valori caratteristici per tipi di legname strutturale italiani. UNI - Ente Nazionale Italiano di Unificazione
[37] EN 408:2003:2003 Timber structures - Structural timber and glued laminated timber - Determination of some physical and mechanical properties. CEN – European Committee for Standardization. 2003
[38] ISO 3131:1975:1975 Wood – Determination of density for physical and mechanical tests. ISO – International Organization for Standardization
[39] ISO 3130:1975:1975 Wood – Determination of moisture content for physical and mechanical tests. ISO – International Organization for Standardization
[40] UNI EN 13183-1:2003:2003 Umiditá di un pezzo di legno segato – Determinazione tramite il metodo per peseta. UNI - Ente Nazionale Italiano di Unificazione
[41] UNI EN 13183-2:2003:2003 Umiditá di un pezzo di legno segato – Stima tramite il metodo elettrico. UNI - Ente Nazionale Italiano di Unificazione
[43] Feio, A., O. Inspection and diagnosis of Historical Timber Structures: NDT correlations and structural behaviour. Ph.D. thesis - Universidade do Minho. Guimaraes. 2005