Page 1
Doctoral Thesis
Predictive analytics: a data mining technique in
customer churn management for decision making
Prediktivní analytika: technika data miningu pro rozhodování s
využitím v řízení odchodu zákazníků
Author: Ing. Stephen Nabareseh
Degree programme: P6208 Economics and Management
Degree course 6208V038 Management and Economics
Supervisor: doc. Ing. Petr Klímek, Ph.D.
Zlín, February 2017
Page 2
2
© Stephen Nabareseh
Published by Tomas Bata University in Zlín in the Edition Doctoral Thesis
The publication was issued in the year 2017
Key words in English: Data mining, Predictive analytics, Decision making,
Customer churn, Telecommunication companies, Ghana, C5.0, Logistic
Regression, Discriminant Analysis
Key words in Czech: Data mining, Prediktivní analytika, Rozhodování, Analýza
odchodu zákazníka, Telekomunikační společnosti, Ghana, C5.0, logistická
regrese, diskriminační analýza
The full version of the Doctoral thesis is available in the Central Library of TBU
in Zlín.
ISBN 978-80-………
Page 3
3
DEDICATION
The dissertation is dedicated to my lovely wife Dr. Linda Spence Juayiben for
your Love, Care and Continuous support in my pursuit of higher education. It is also
dedicated to my late parents Mr. and Mrs. Lawrence Nabarese for providing me a
solid foundation in my educational life.
It is further dedicated to my brother Justice John Bosco Nabarese for his
encouragement in this journey. I also dedicate this work to entire Nabareseh family
for your support. May God bless you all.
Page 4
4
ACKNOWLEDGEMENT
The contribution of many individuals has led to the successful completion of this
doctoral studies. I acknowledge the immense contribution of my supervisor, Assoc.
Prof. Petr Klimek, who spent enormous time to guide me through this study. I am
grateful for his dedication in reading my dissertation and proffering salient and
constructive revisions.
I am particularly grateful to Ing. Eric Afful-Dadzie, PhD for encouraging me to
pursue this doctoral studies. He has contributed immensely in my publications and
assisted me to get a footing in the research world. I am most grateful to my “twin
brother”, Prince Kurtis Ofori, for his valuable advice and being there for my family
in my absence. I do cherish the worthy contribution of several friends and colleagues
in my studies. Special mention goes to Ing. Michael Adu Kwarteng, Ing. Christian
Nedu Osakwe, PhD, Ing. Oksana Koval, Ing. Vladyslav Vlasov and Ing. Lucia Hasa.
I also acknowledge the immense support of staff of the PhD study office, especially
Martina Drabkova for her readiness to advice in difficult times.
I am further grateful to Ing. Emmanuel Selasi Asamoah, PhD, Vida Atakpa and
Angelina Afrifa for assisting in the collection of data for this dissertation.
Special appreciation goes to the Director and Staff of the Department of Statistics
and Quantitative Methods for their guidance and giving me the platform to lecture
and build on my experience. I am especially grateful to Ing. et. Ing. Dolejšová
Miroslava, PhD for effecting the necessary corrections in the dissertation. Last but
not the least, I recognize the immense contribution of my external supervisors and
the entire committee members for the constructive criticisms that helped to shape
the final work.
Page 5
5
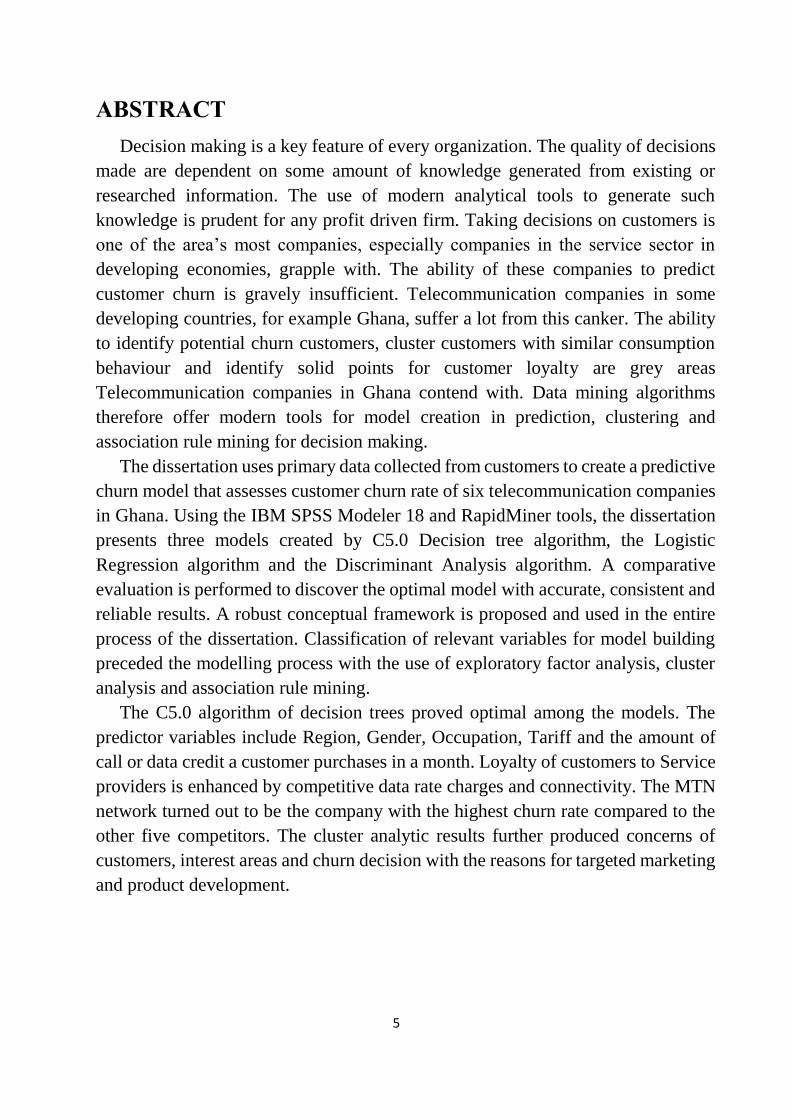
ABSTRACT
Decision making is a key feature of every organization. The quality of decisions
made are dependent on some amount of knowledge generated from existing or
researched information. The use of modern analytical tools to generate such
knowledge is prudent for any profit driven firm. Taking decisions on customers is
one of the area’s most companies, especially companies in the service sector in
developing economies, grapple with. The ability of these companies to predict
customer churn is gravely insufficient. Telecommunication companies in some
developing countries, for example Ghana, suffer a lot from this canker. The ability
to identify potential churn customers, cluster customers with similar consumption
behaviour and identify solid points for customer loyalty are grey areas
Telecommunication companies in Ghana contend with. Data mining algorithms
therefore offer modern tools for model creation in prediction, clustering and
association rule mining for decision making.
The dissertation uses primary data collected from customers to create a predictive
churn model that assesses customer churn rate of six telecommunication companies
in Ghana. Using the IBM SPSS Modeler 18 and RapidMiner tools, the dissertation
presents three models created by C5.0 Decision tree algorithm, the Logistic
Regression algorithm and the Discriminant Analysis algorithm. A comparative
evaluation is performed to discover the optimal model with accurate, consistent and
reliable results. A robust conceptual framework is proposed and used in the entire
process of the dissertation. Classification of relevant variables for model building
preceded the modelling process with the use of exploratory factor analysis, cluster
analysis and association rule mining.
The C5.0 algorithm of decision trees proved optimal among the models. The
predictor variables include Region, Gender, Occupation, Tariff and the amount of
call or data credit a customer purchases in a month. Loyalty of customers to Service
providers is enhanced by competitive data rate charges and connectivity. The MTN
network turned out to be the company with the highest churn rate compared to the
other five competitors. The cluster analytic results further produced concerns of
customers, interest areas and churn decision with the reasons for targeted marketing
and product development.
Page 6
6
ABSTRAKT
Rozhodování je klíčovým prvkem každé organizace. Kvalita provedených
rozhodnutí je závislá na určitém množství poznatků získaných z již existujících
nebo nově získaných informací. Využití moderních analytických nástrojů pro
vytváření takových znalostí je rozumné pro každou firmu založenou za účelem
zisku. Rozhodování o zákaznících je jednou z oblastí, na kterou se většina
společností soustředí, zejména společnosti podnikající v odvětví služeb
v rozvojových zemích. Schopnost těchto společností předpovědět fluktuaci
zákazníků je značně nedostačující. Telekomunikační společnosti v některých
rozvojových zemích, např. Ghana, tímto nedostatkem velice trpí. Schopnost
identifikovat potenciální zákazníky, kteří odejdou, schopnost identifikovat
zákazníky clusteru s podobným spotřebním chováním a schopnost identifikovat
pevné body spojené s věrností zákazníků jsou problematickou oblastí.
Telekomunikační společnosti v Ghaně se s těmito problémy běžně potýkají.
Nástroje sloužící k vytěžování dat jsou moderními nástroji pro tvorbu modelu
predikce, shlukování a dolování asociačních pravidel pro rozhodování.
Disertační práce využívá primárních dat shromážděných od zákazníků, která
slouží pro vytvoření prediktivního modelu odchodu zákazníků. Tento prediktivní
model posuzuje míru fluktuace zákazníků šesti telekomunikačních společností
působících v Ghaně. Disertace prostřednictvím nástrojů IBM SPSS Modeler 18 a
RapidMiner představuje tři modely vytvořené pomocí rozhodovacích stromů
(algoritmus C5.0), logistické regrese a diskriminační analýzy. Srovnávací
hodnocení se provádí za účelem vytvoření optimálního modelu s přesnými,
konzistentními a spolehlivými výsledky. Robustní koncepční rámec je navržen
a použit v celém procesu disertační práce. Klasifikace relevantních proměnných
pro budovaný model předcházela procesu modelování s využitím průzkumné
faktorové analýzy, shlukové analýzy a dolování asociačních pravidel.
Algoritmus C5.0 rozhodovacích stromů se ukázal jako optimální mezi danými
modely. Mezi významné prediktory patří proměnné oblast, pohlaví, zaměstnání,
sazebník a částka, za kterou si zákazník koupí hovor, nebo údaje o kreditu za
měsíc. Loajalita zákazníků poskytovatelů služeb je závislá na výhodnějších cenách
dat a rychlosti připojení. Síť MTN byla prokazatelně jednou s nejvyšší mírou
odchodu zákazníků v porovnání s ostatními pěti konkurenty. Shluková analýza
dále prokázala obavy zákazníků, oblasti jejich zájmu a důvody rozhodnutí
k odchodu – toto vše za účelem cíleného marketingu a vývoje produktu.
Page 7
7
TABLE OF CONTENTS
DEDICATION ...................................................................................................... 3
ACKNOWLEDGEMENT ................................................................................... 4
ABSTRACT........................................................................................................... 5
ABSTRAKT .......................................................................................................... 6
LIST OF FIGURES ............................................................................................ 10
LIST OF TABLES .............................................................................................. 11
LIST OF ABBREVIATIONS ............................................................................ 12
1 INTRODUCTION ........................................................................................ 13
1.1 Theoretical foundation of data mining ....................................................................................14
1.2 Data mining vs. the economic sector .......................................................................................17
2 STATE OF THE ART ................................................................................. 20
2.1 Predictive modelling ..............................................................................................................20
2.1.1 Logistic regression ........................................................................................................ 21
2.1.2 Decision tree analysis .................................................................................................... 21
2.1.3 Neural networks ............................................................................................................ 23
2.1.4 Nearest-neighbour models ........................................................................................... 23
2.1.5 Discriminant analysis ................................................................................................... 24
2.2 Customer churn prediction ...................................................................................................24
2.3 The Ghanaian Telecommunication Industry ......................................................................28
2.4 Predictive analytics in Ghana ...............................................................................................30
3. OBJECTIVES ............................................................................................... 32
3.1 Research Problem ..................................................................................................................32
3.2 Research Questions ................................................................................................................32
3.3 Research Objectives ...............................................................................................................33
3.4 Research Hypotheses .............................................................................................................33
3.5 Conceptual Framework .........................................................................................................33
3.6 Definition of Variables ............................................................................................................35
4. SELECTED PROCESSING METHOD .................................................... 36
4.1 Research design and sampling ..............................................................................................36
4.1.1 Research design ............................................................................................................. 36
Page 8
8
4.1.2 Population and Sampling method ............................................................................... 36
4.1.3 Quantitative Research .................................................................................................. 37
4.2 Data collection ........................................................................................................................37
4.3 Data Analysis, Modelling, Deployment and Evaluation .......................................................38
4.3.1 Data preprocessing ....................................................................................................... 38
4.3.2 Data analysis ................................................................................................................. 38
4.3.3 Model building .............................................................................................................. 40
4.3.4 Model deployment and evaluation .............................................................................. 41
4.3.5 Model validation ........................................................................................................... 41
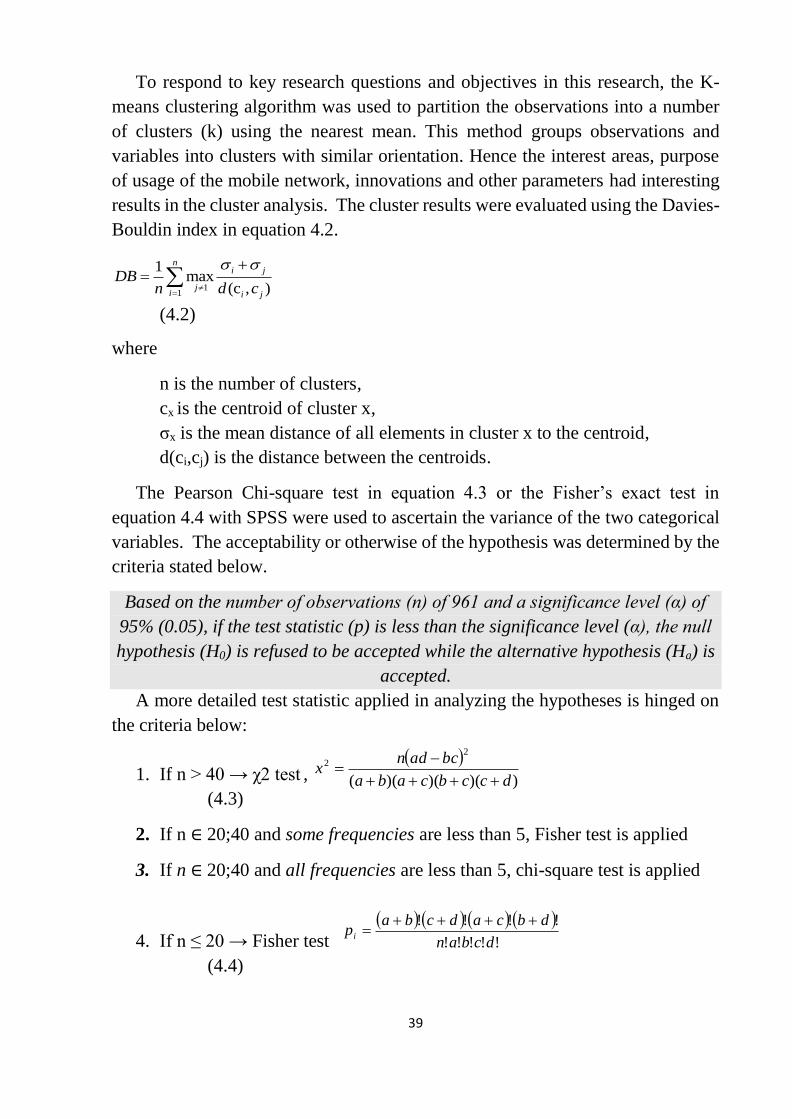
5 MAIN RESULTS .......................................................................................... 42
5.1 Data preprocessing ................................................................................................................42
5.2 Data analytics .........................................................................................................................47
5.2.1 Summary and descriptive statistics ............................................................................. 47
5.2.2 Hypothesis testing ......................................................................................................... 58
5.2.3 Cluster analysis ............................................................................................................. 61
5.2.4 Association rule (arule) mining ................................................................................... 65
5.3 Predictive Model ....................................................................................................................68
5.3.1 C5.0 algorithm tree model ........................................................................................... 68
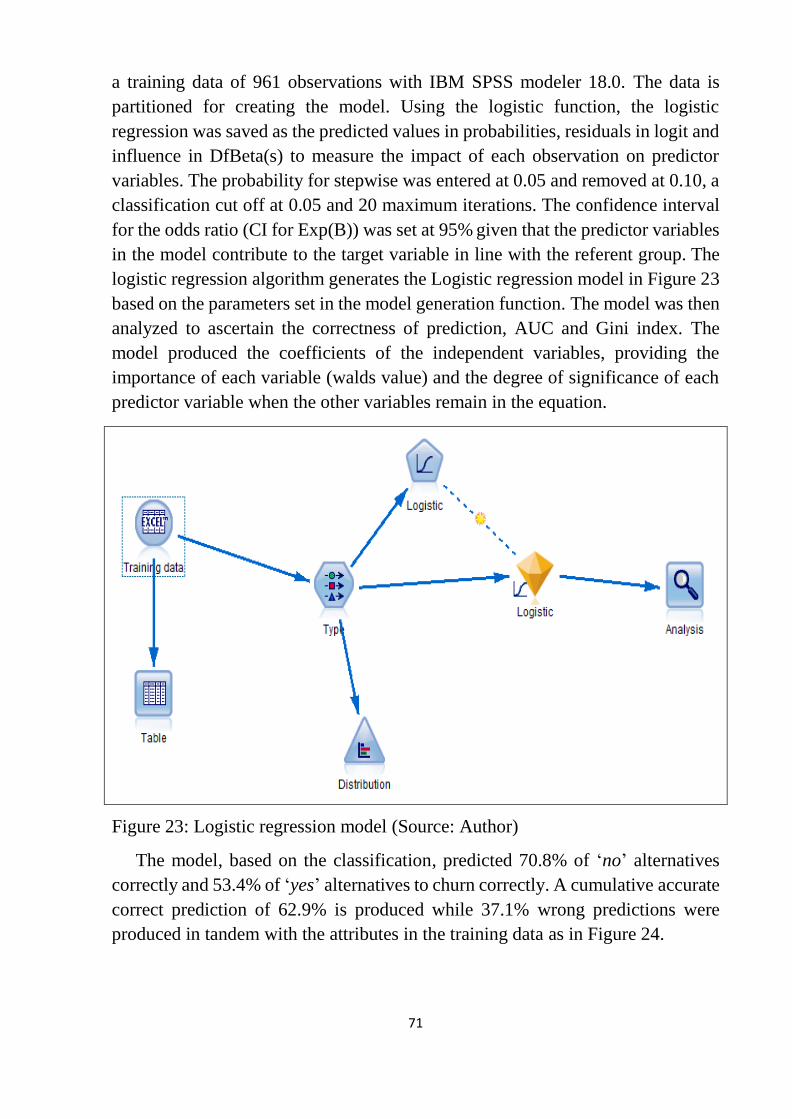
5.3.2 Logistic regression model ............................................................................................. 70
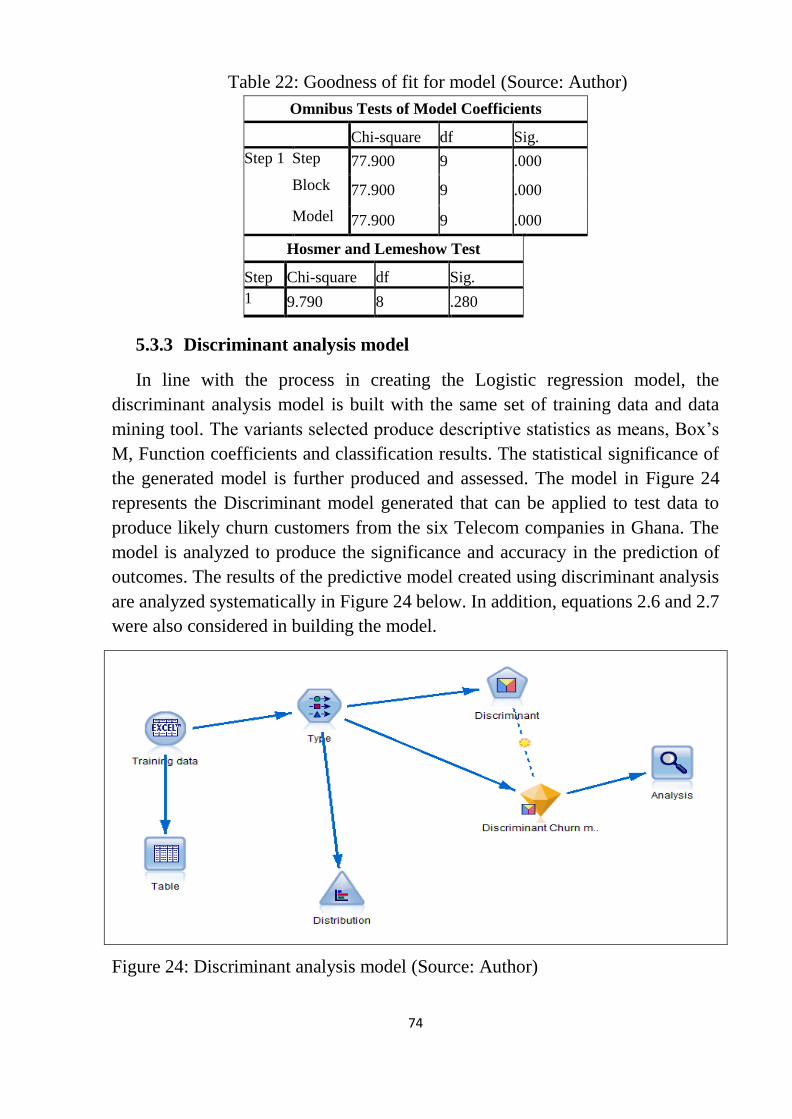
5.3.3 Discriminant analysis model ........................................................................................ 74
5.3.4 Model evaluation and deployment .............................................................................. 77
5.3.5 Model validation ........................................................................................................... 82
6 CONTRIBUTION TO SCIENCE, THEORY AND PRACTICE ........... 84
6.1 Gains for Science ...................................................................................................................84
6.2 Gains for theory .....................................................................................................................84
6.3 Gains for Practice ..................................................................................................................84
7 CONCLUSION, LIMITATIONS AND FUTURE RESEARCH ............ 86
7.1 Conclusion ..............................................................................................................................86
7.2 Limitations of the Dissertation .............................................................................................91
7.3 Suggestions for future research ............................................................................................91
Bibliography ........................................................................................................ 93
List of Publications ........................................................................................... 104
Curriculum Vitae .............................................................................................. 108
Page 9
9
Appendices ........................................................................................................ 110
Appendix A: Training Questionnaire ............................................................. 110
Appendix B: Testing Questionnaire ............................................................... 117
Page 10
10
LIST OF FIGURES Figure 1: Data mining process .............................................................................. 15
Figure 2: Forms of Data mining ........................................................................... 16
Figure 3: Churn rate of Europe, US and Asia ...................................................... 25
Figure 4: Churn rate in the US wireless telecom industry ................................... 25
Figure 5: Voice Market share of telecoms ........................................................... 29
Figure 6: Data Market share of telecoms ............................................................. 29
Figure 7: Conceptual framework for the dissertation ........................................... 34
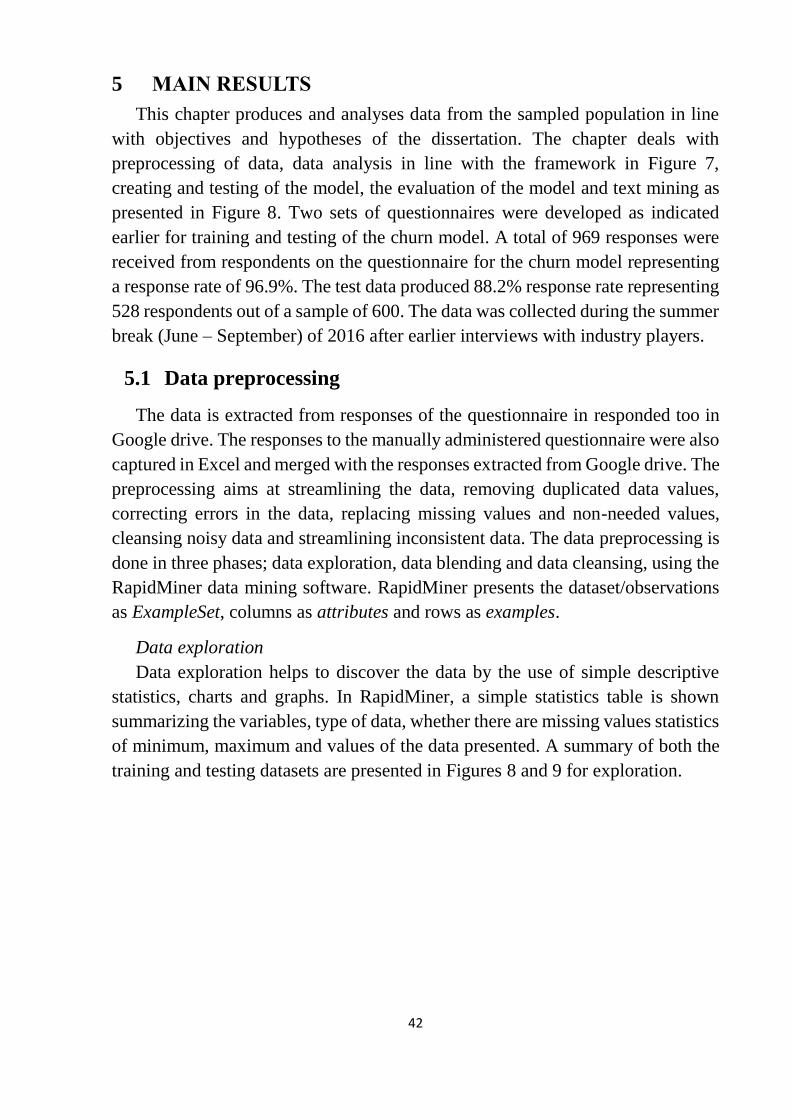
Figure 8: Summarized statistics for training dataset ............................................ 43
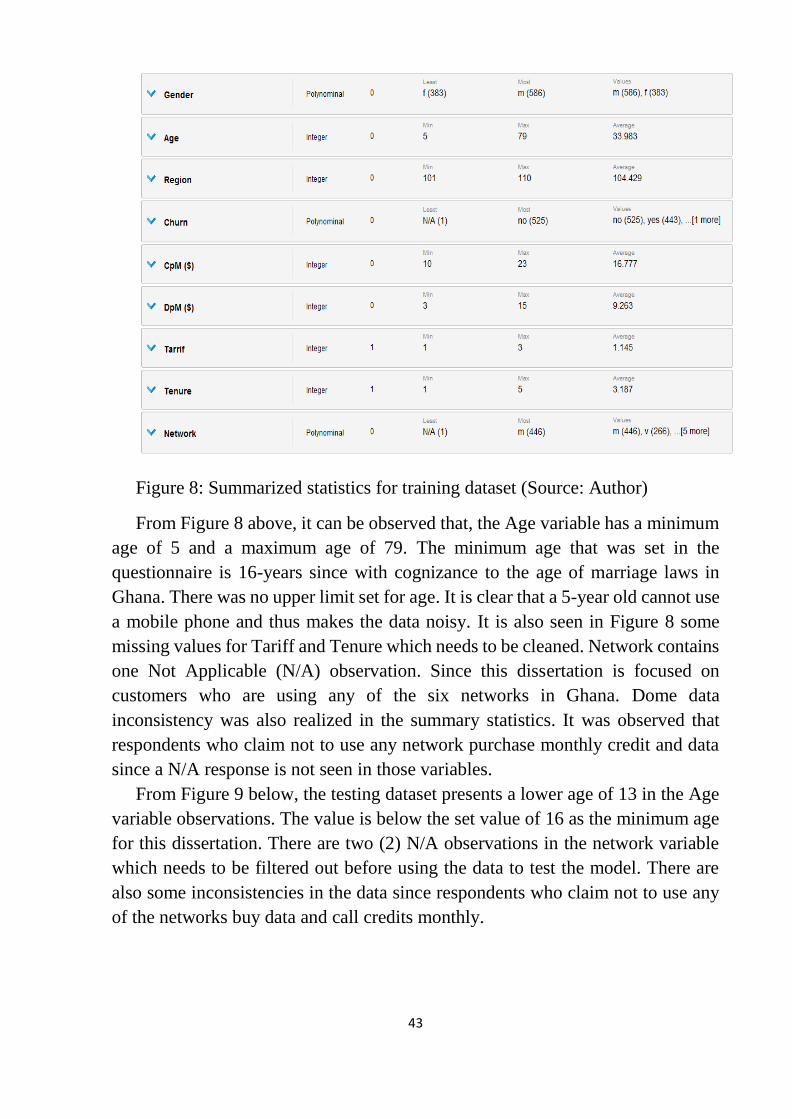
Figure 9: Summarized statistics for test dataset ................................................... 44
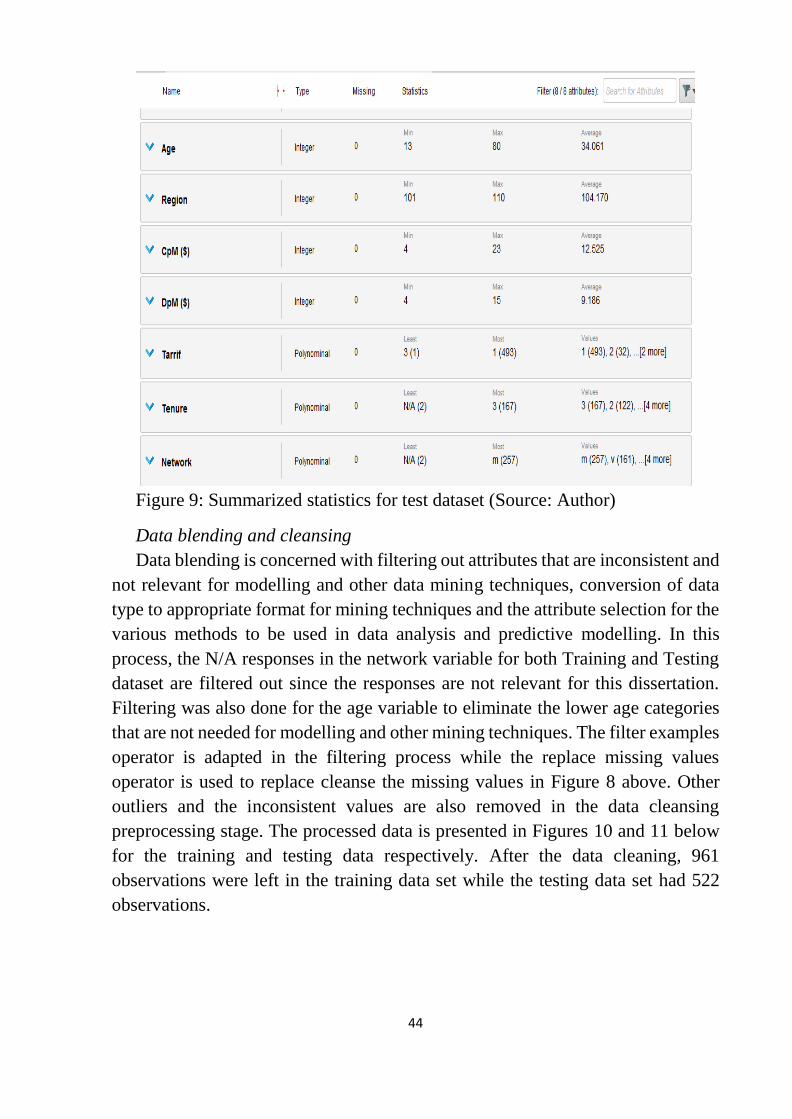
Figure 10: Processed statistics for training dataset .............................................. 45
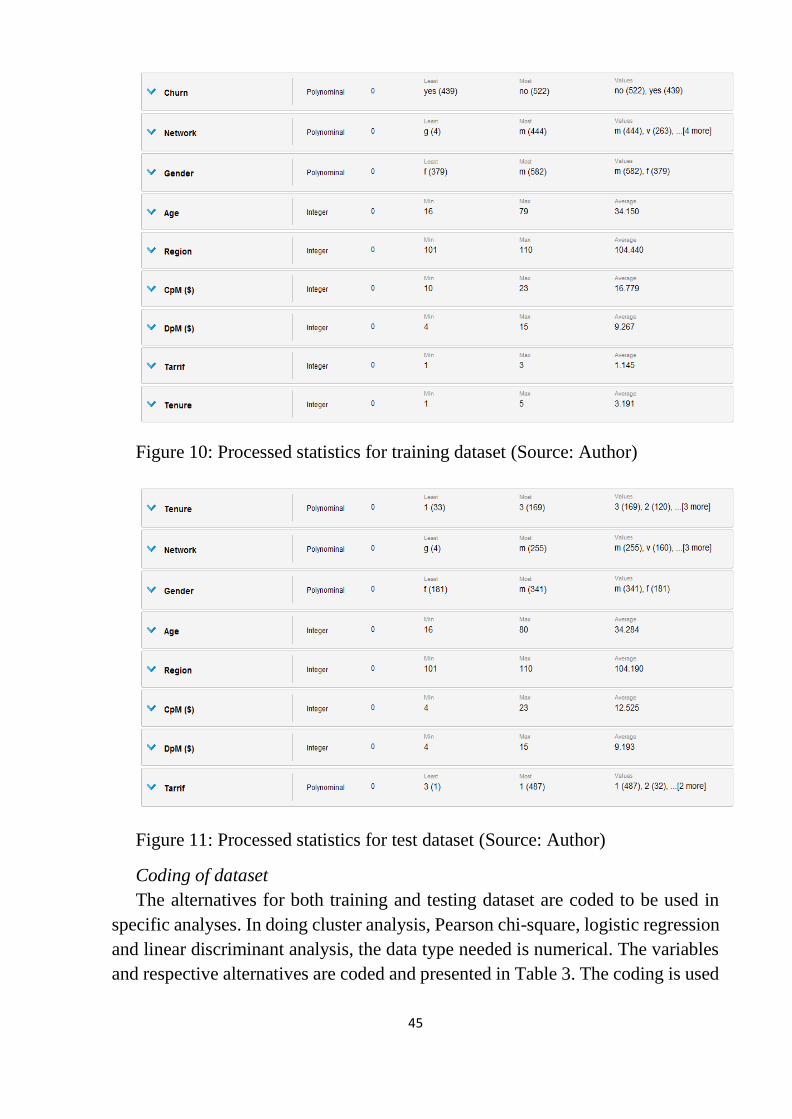
Figure 11: Processed statistics for test dataset ..................................................... 45
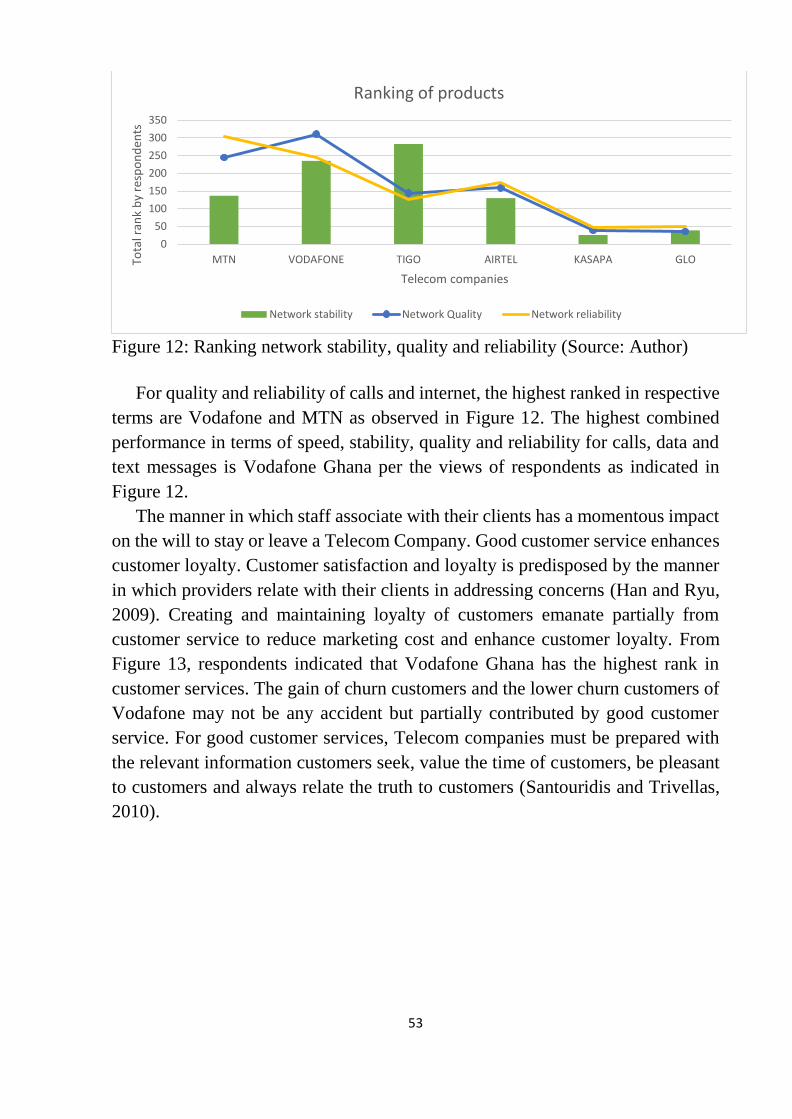
Figure 12: Ranking network stability, quality and reliability .............................. 53
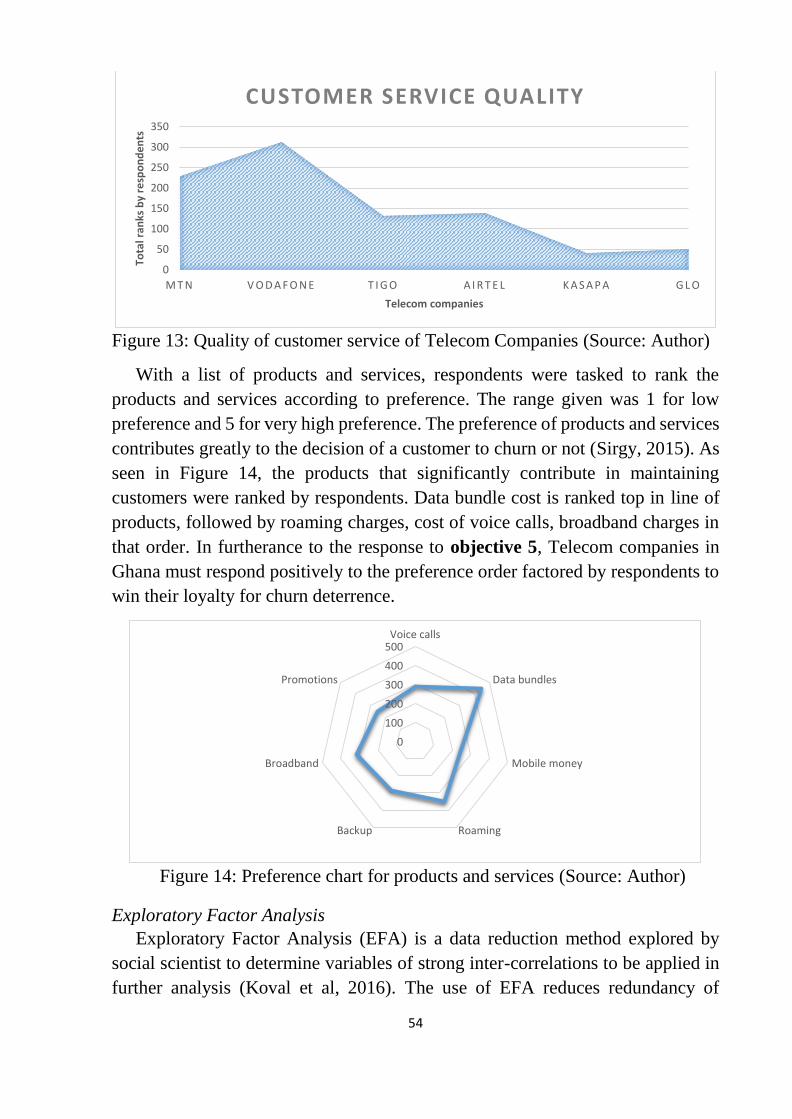
Figure 13: Quality of customer service of Telecom Companies .......................... 54
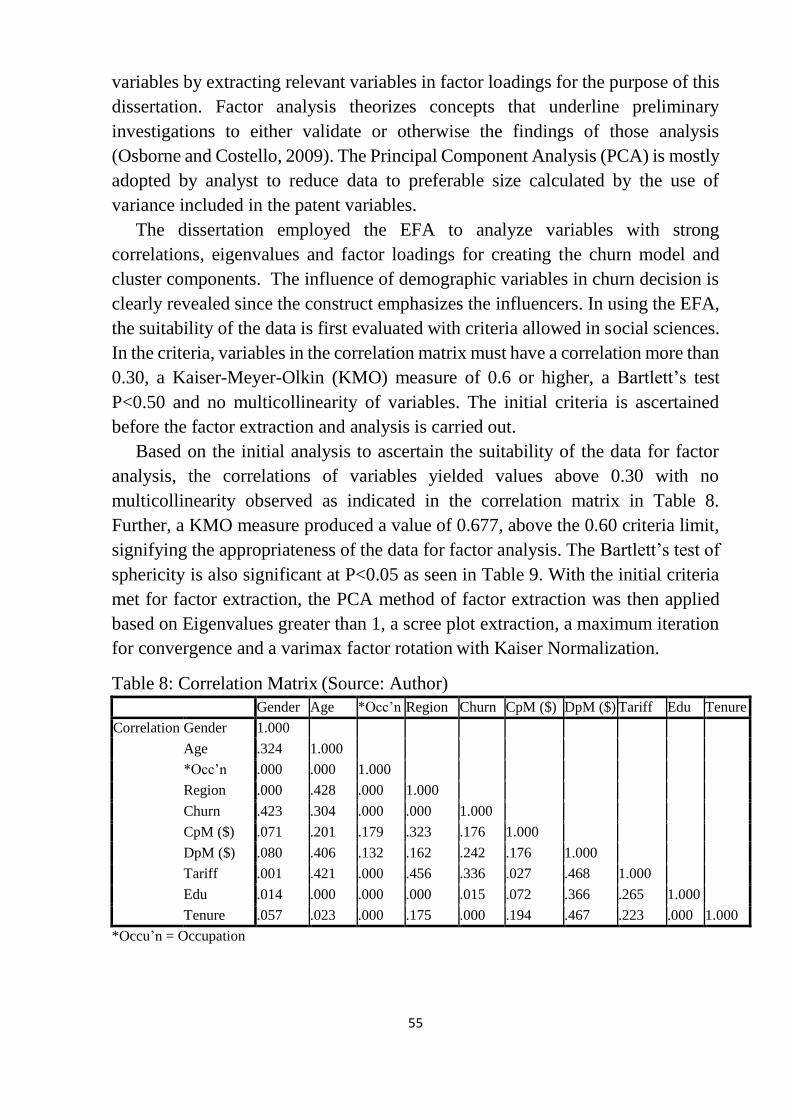
Figure 14: Preference chart for products and services ......................................... 54
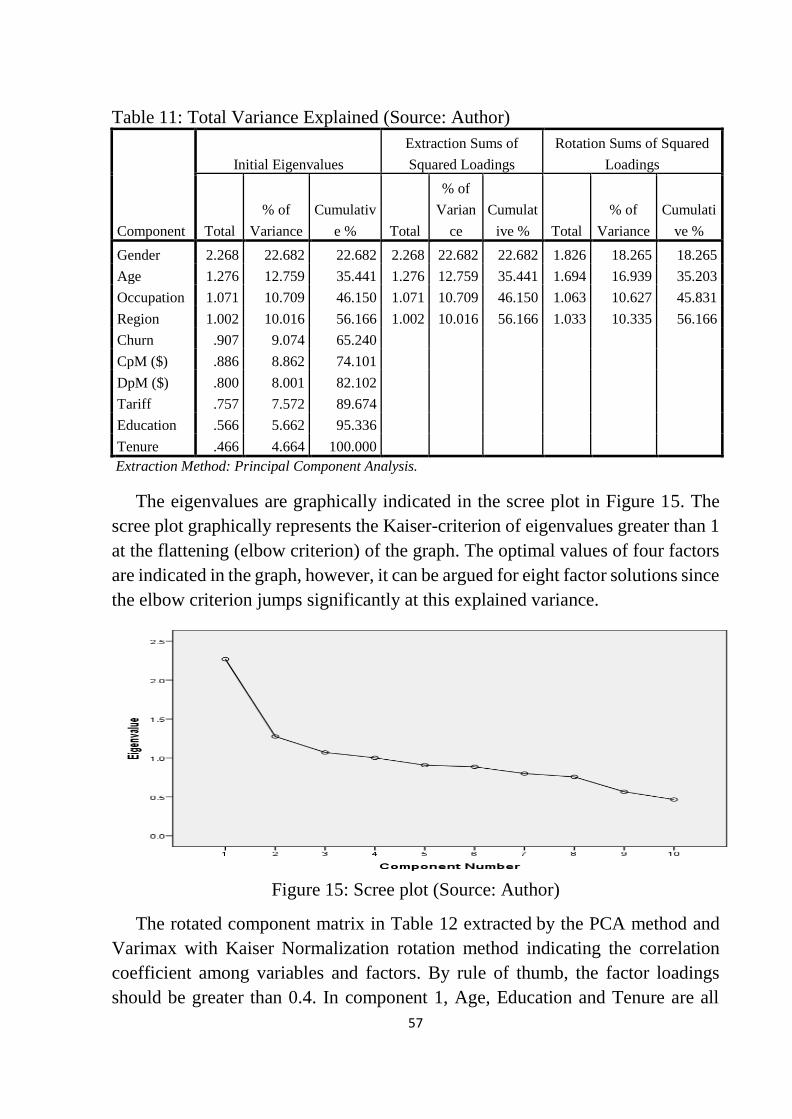
Figure 15: Scree plot............................................................................................. 57
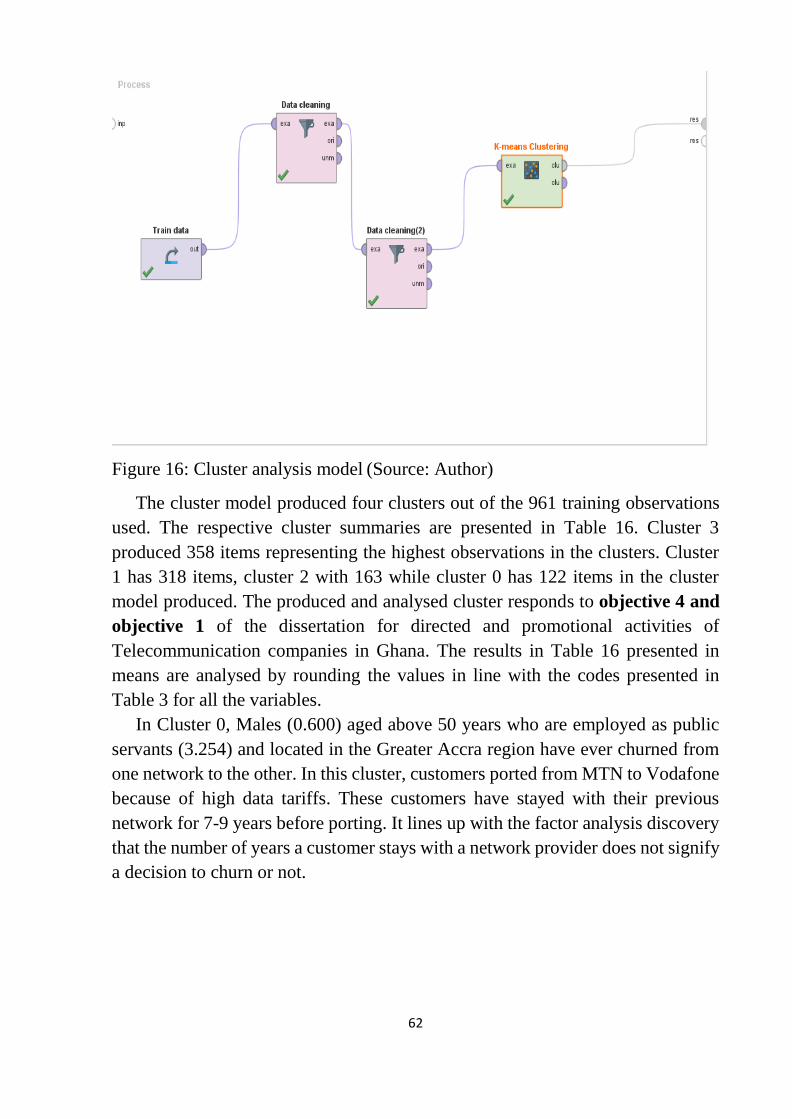
Figure 16: Cluster analysis model ........................................................................ 62
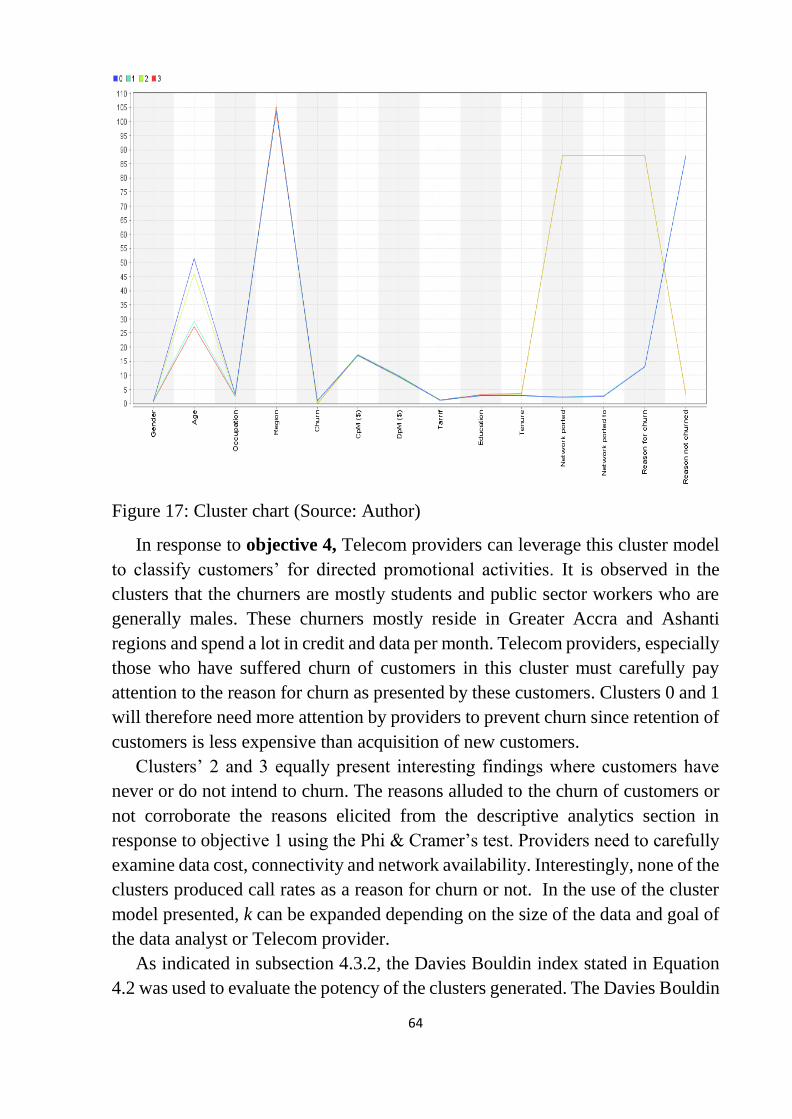
Figure 17: Cluster chart ........................................................................................ 64
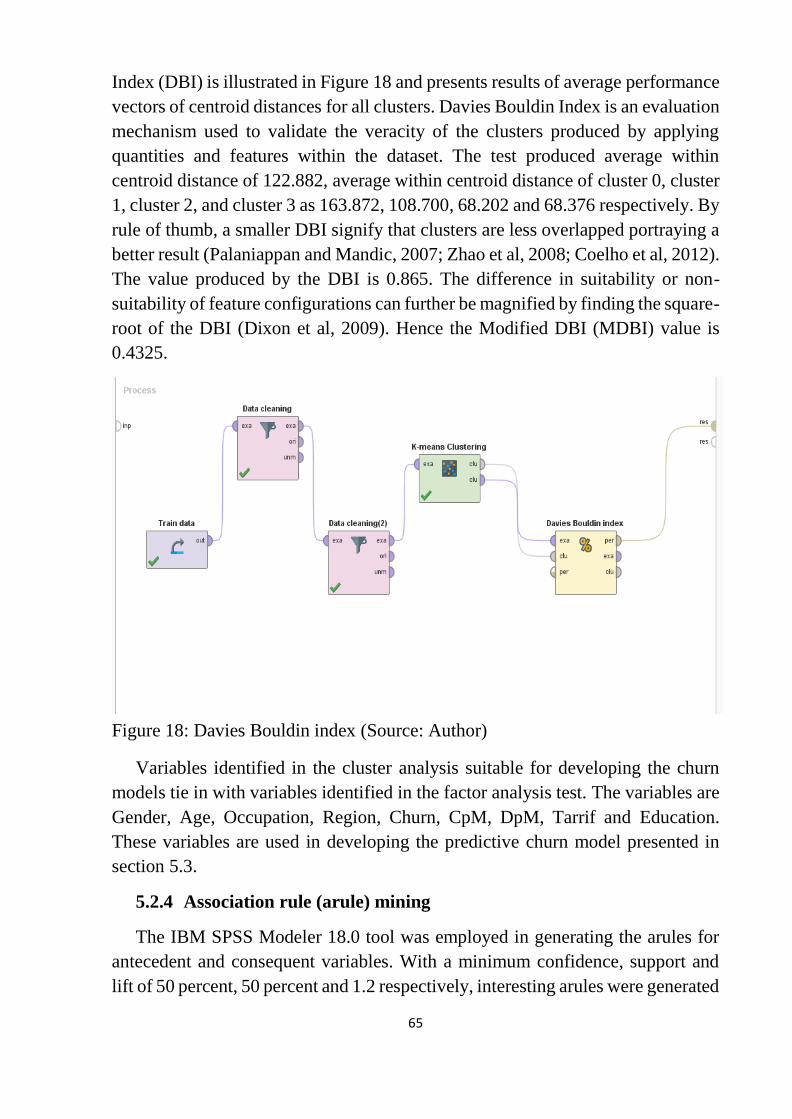
Figure 18: Davies Bouldin index .......................................................................... 65
Figure 19: Association rules structure .................................................................. 66
Figure 20: Association rules structure .................................................................. 67
Figure 21: C5.0 algorithm tree model .................................................................. 69
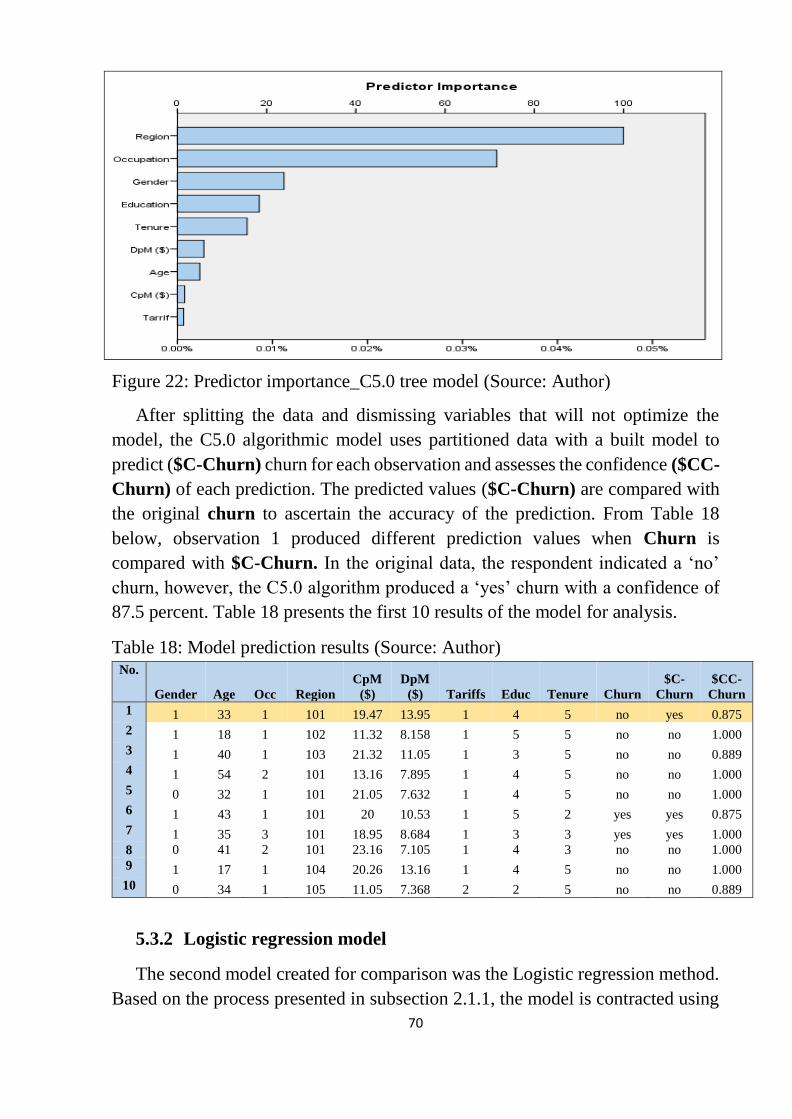
Figure 22: Predictor importance_C5.0 tree model ............................................... 70
Figure 23: Logistic regression model ................................................................... 71
Figure 24: Discriminant analysis model ............................................................... 74
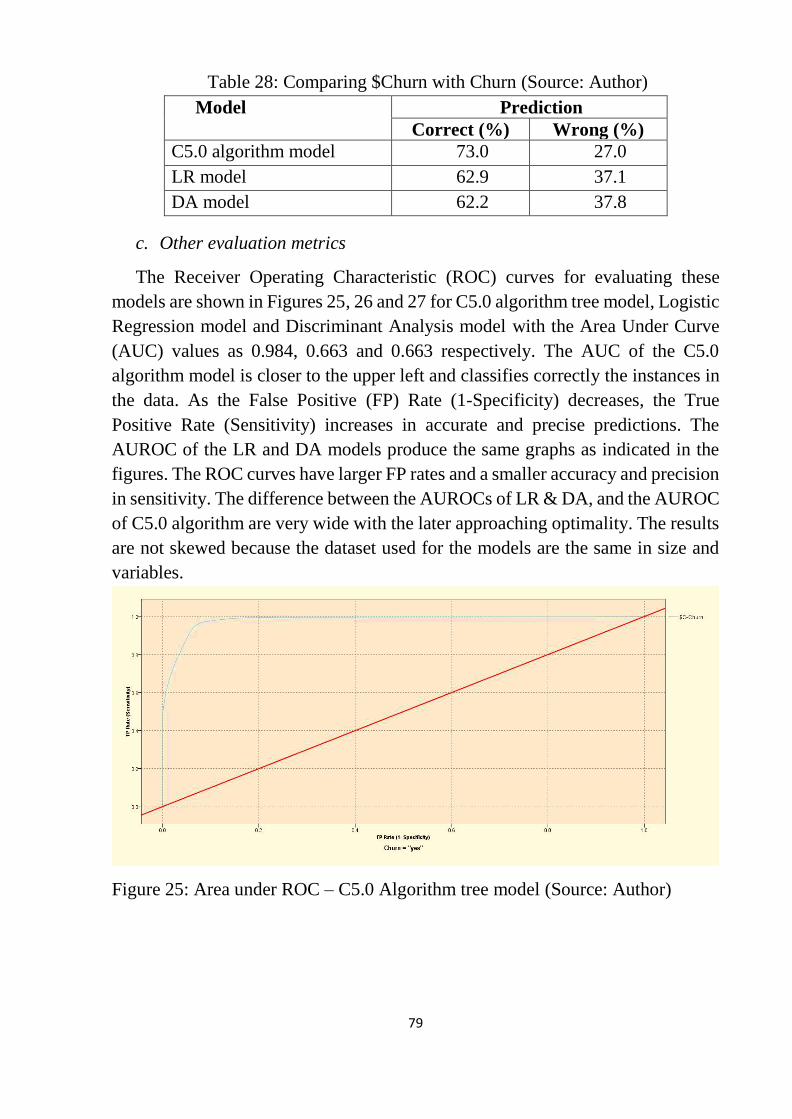
Figure 25: Area under ROC – C5.0 Algorithm tree model .................................. 79
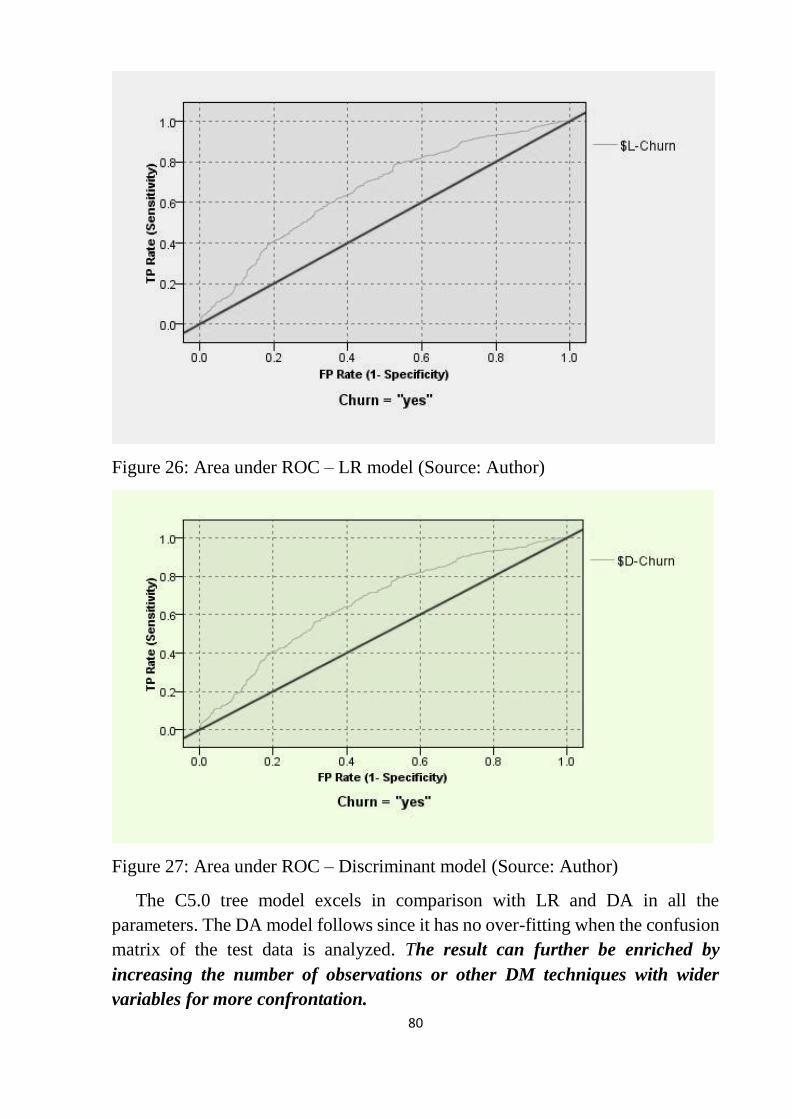
Figure 26: Area under ROC – LR model ............................................................. 80
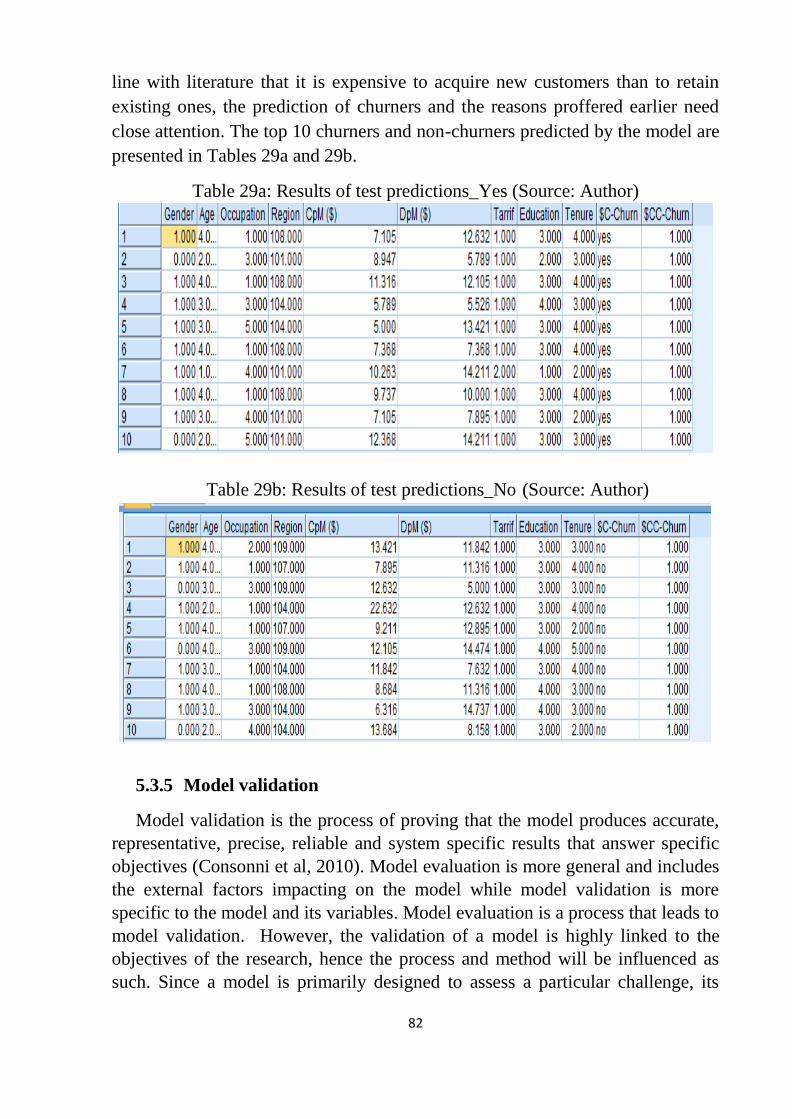
Figure 27: Area under ROC – Discriminant model ............................................. 80
Figure 28: Test model_C5.0 algorithm ................................................................ 81
Page 11
11
LIST OF TABLES
Table 1: Some data mining algorithms and usage ................................................ 17
Table 2: Review of work on customer churn ....................................................... 26
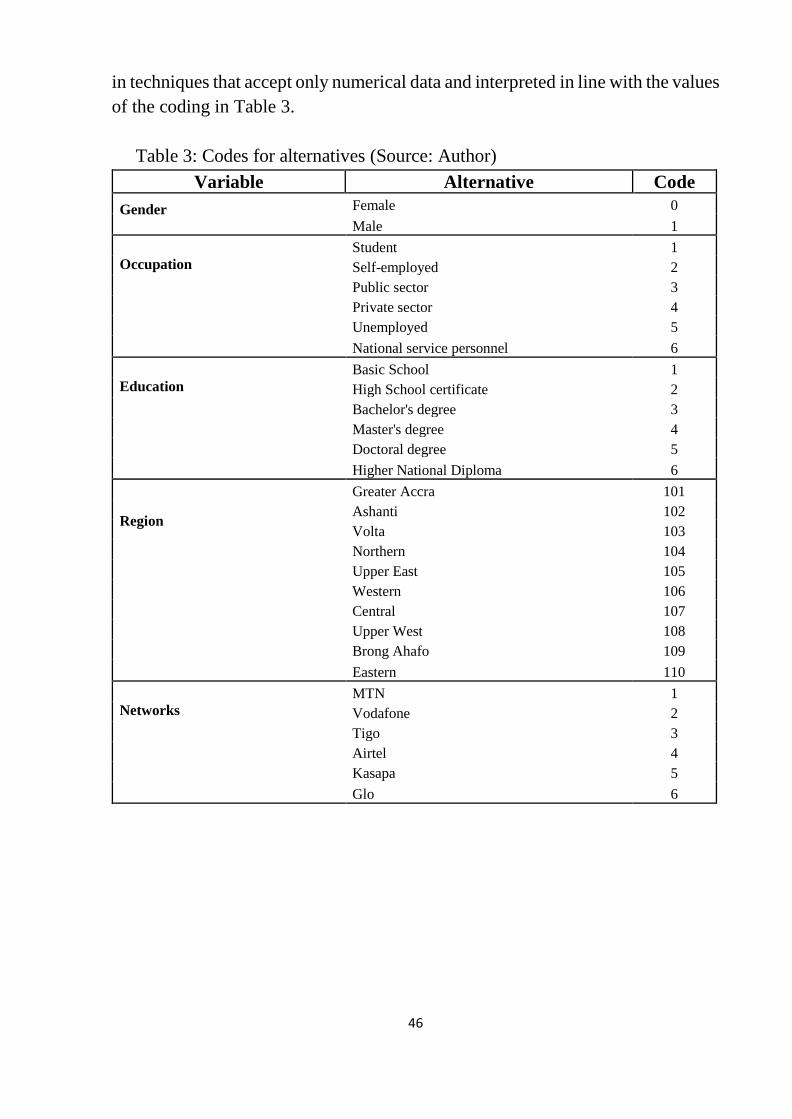
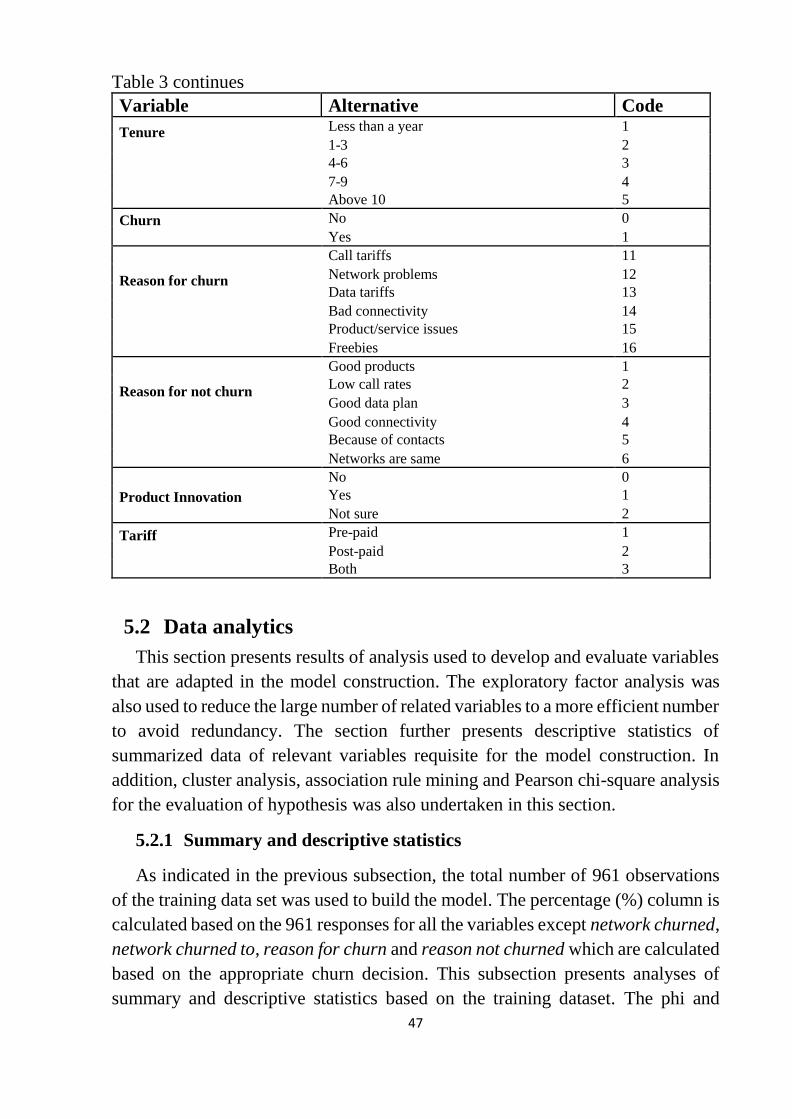
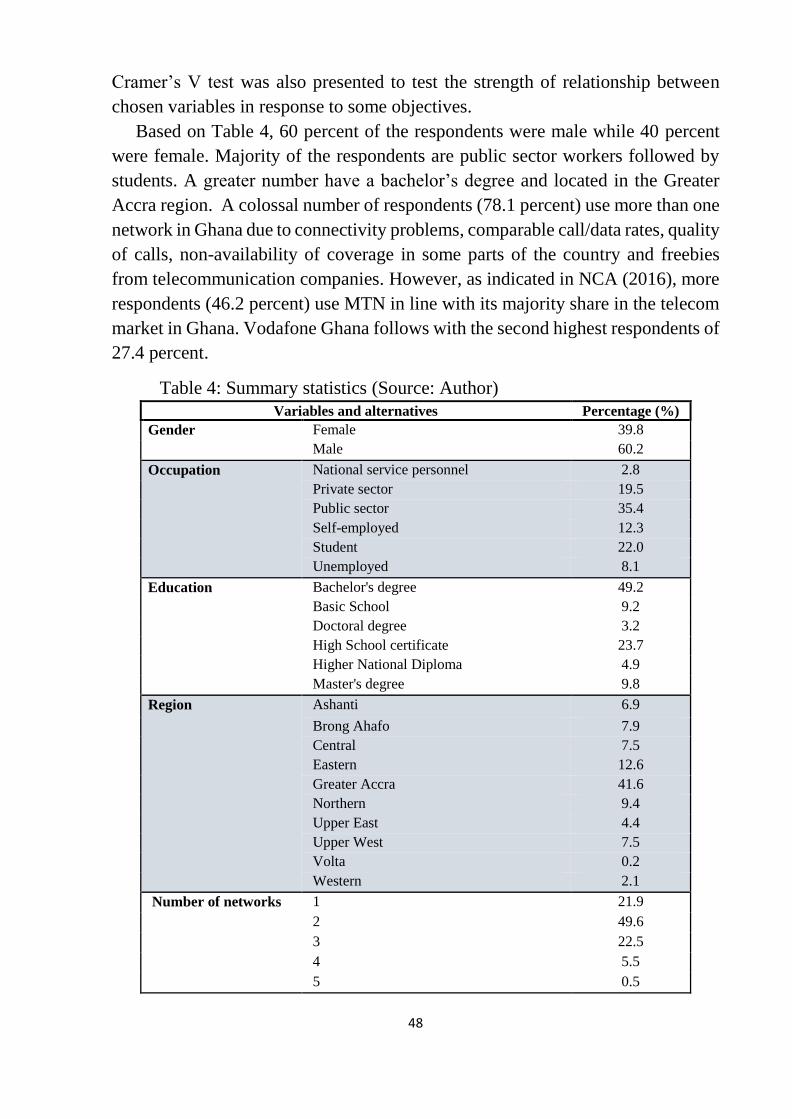
Table 3: Codes for alternatives ............................................................................. 46
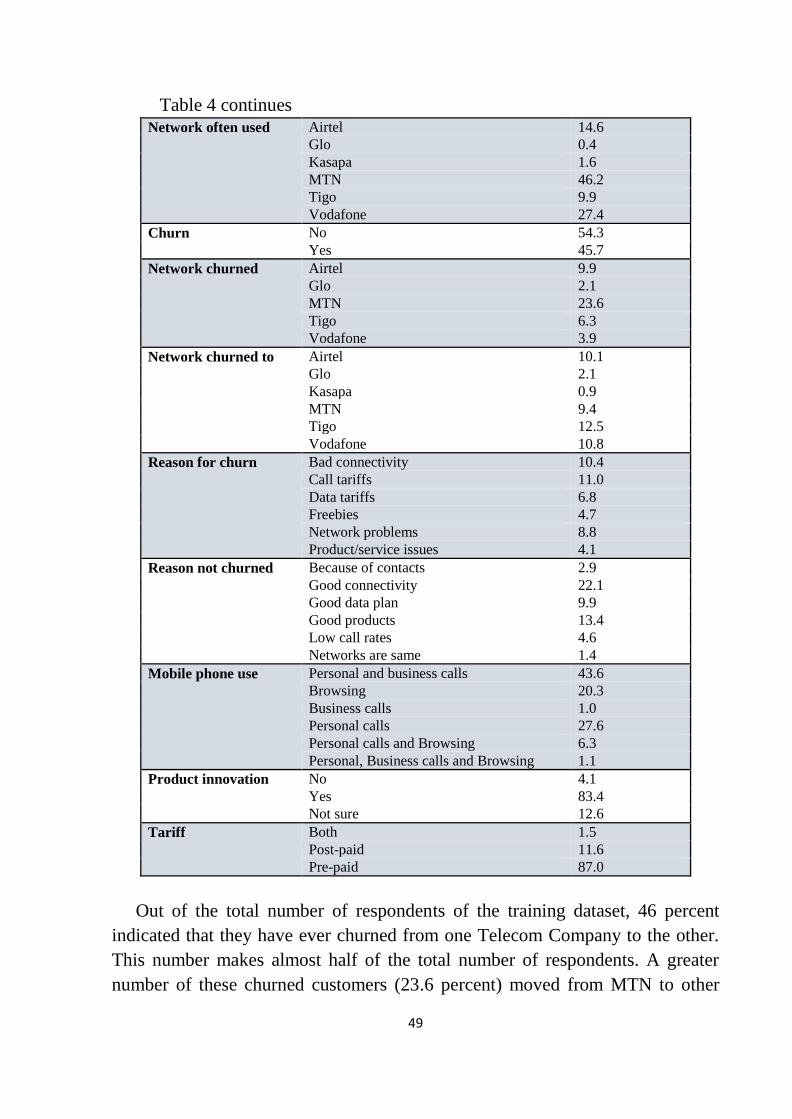
Table 4: Summary statistics .................................................................................. 48
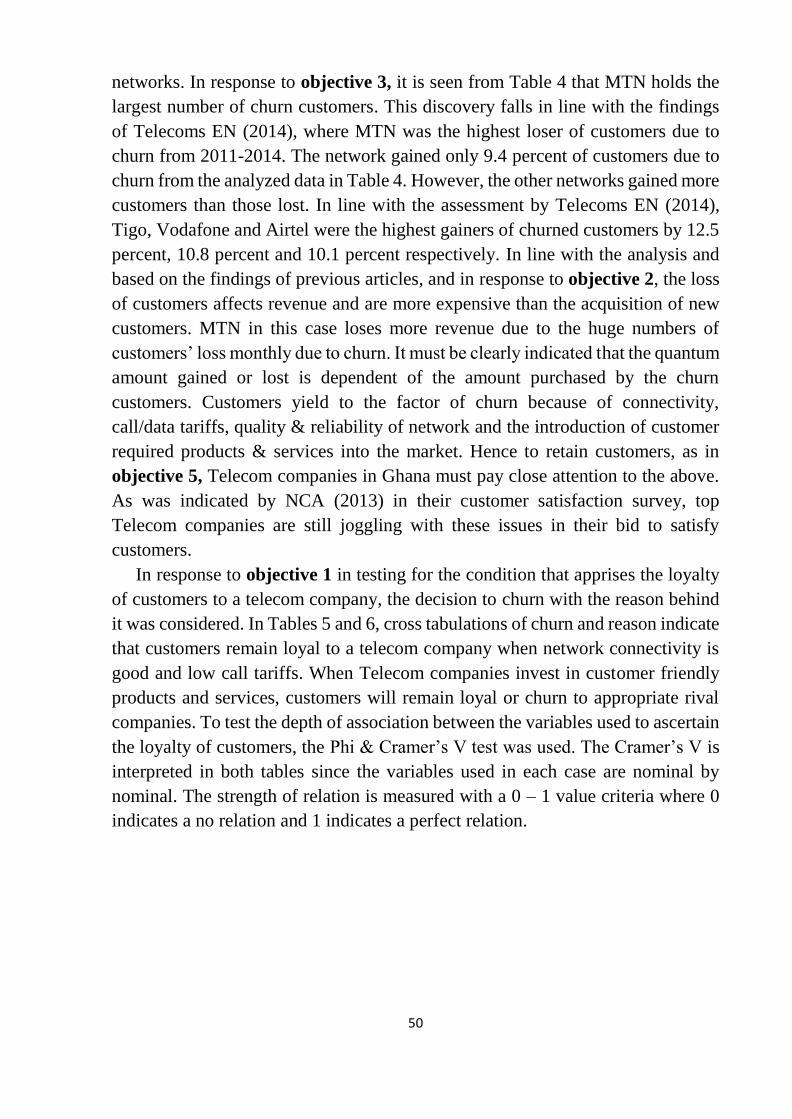
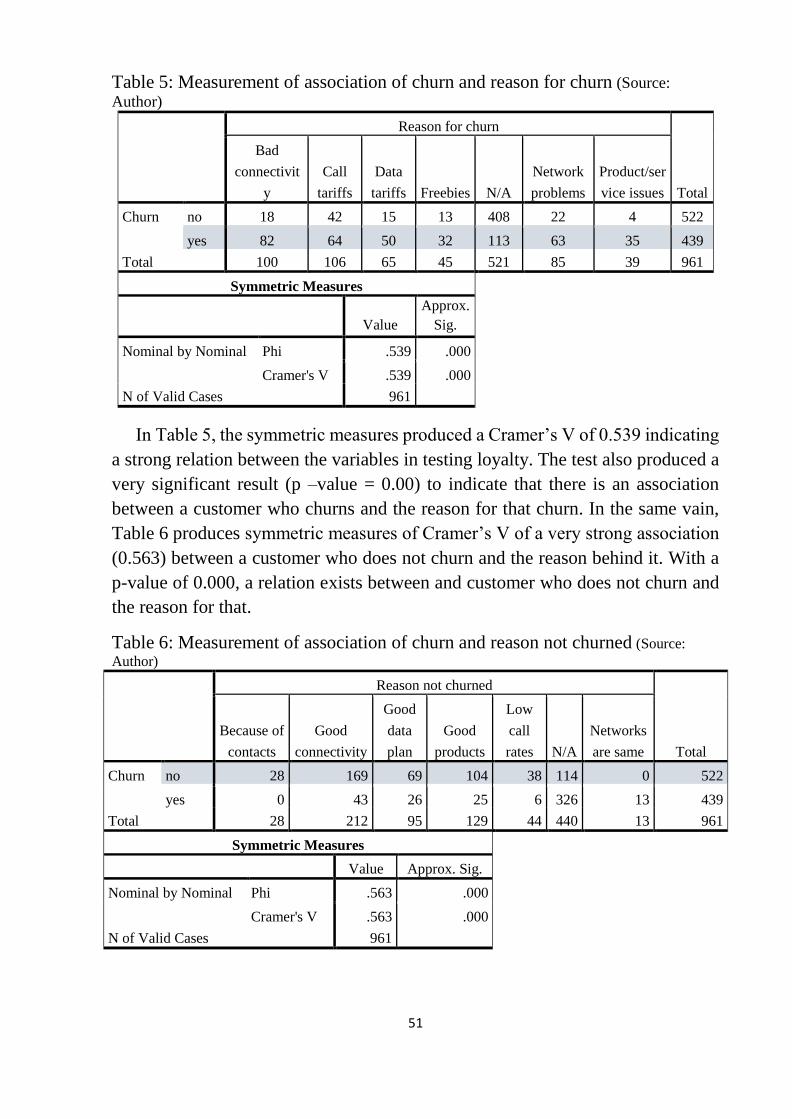
Table 5: Measurement of association of churn and reason for churn .................. 51
Table 6: Measurement of association of churn and reason not churned .............. 51
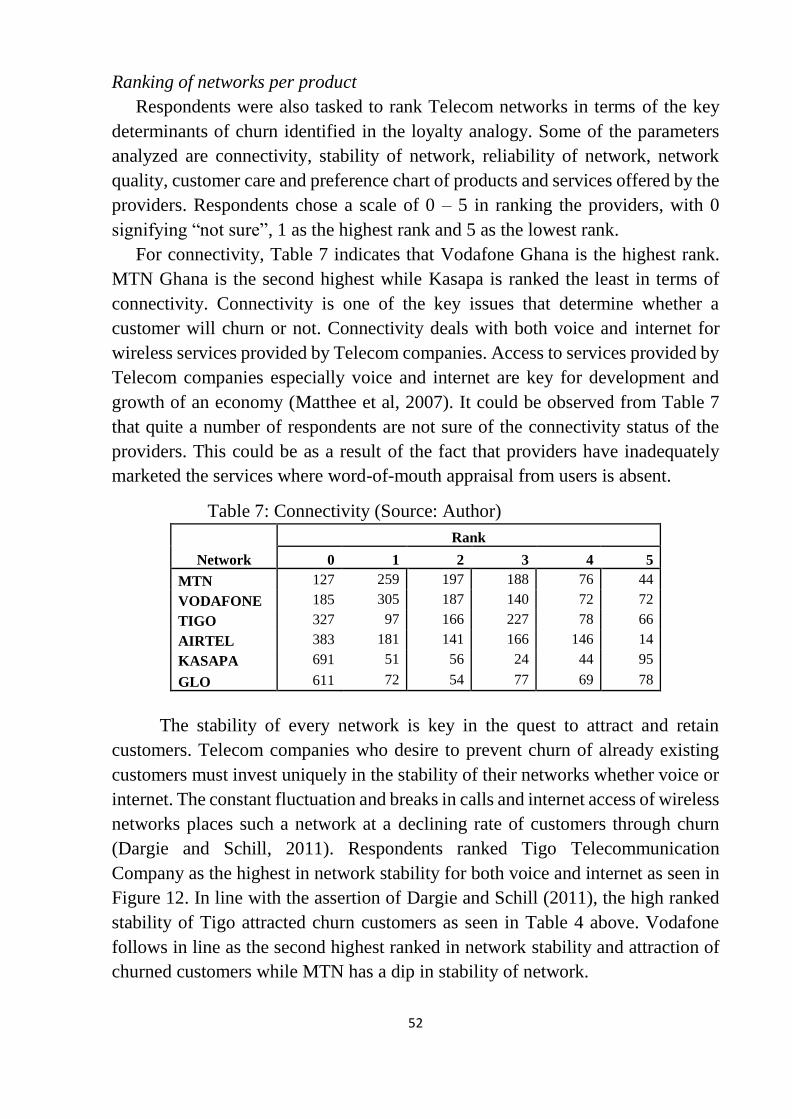
Table 7: Connectivity ........................................................................................... 52
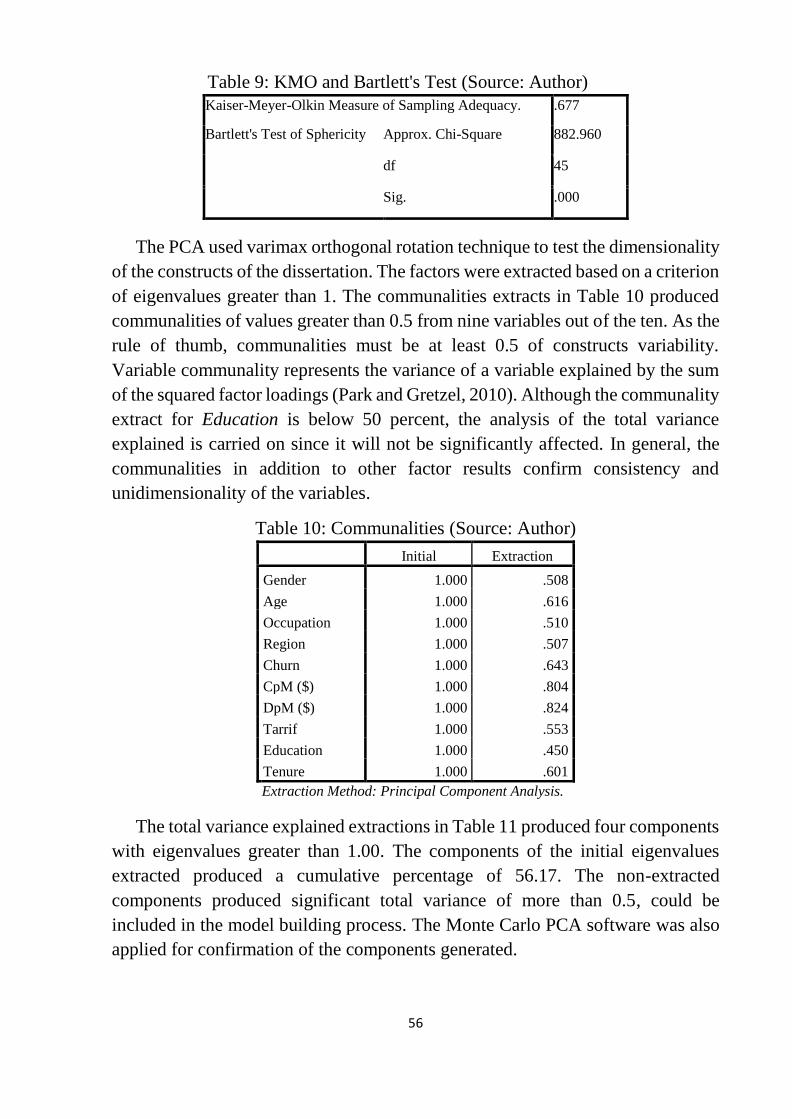
Table 8: Correlation Matrix .................................................................................. 55
Table 9: KMO and Bartlett's Test ......................................................................... 56
Table 10: Communalities ..................................................................................... 56
Table 11: Total Variance Explained ..................................................................... 57
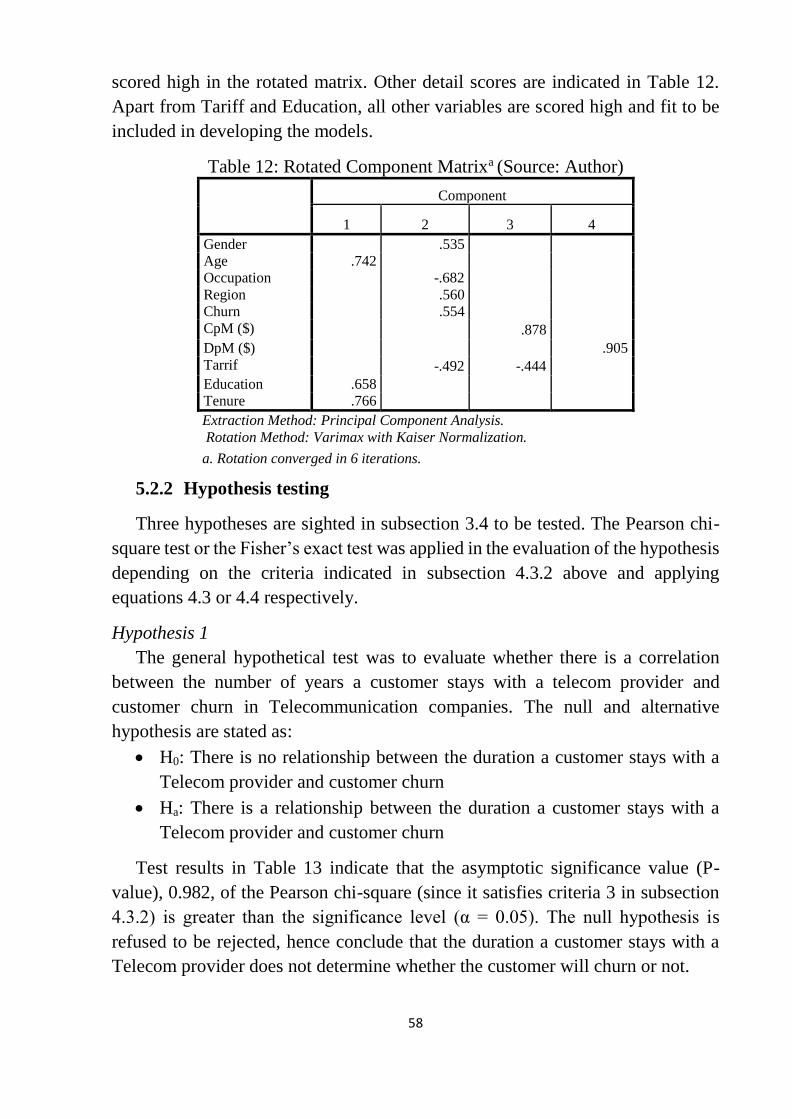
Table 12: Rotated Component Matrixa ................................................................. 58
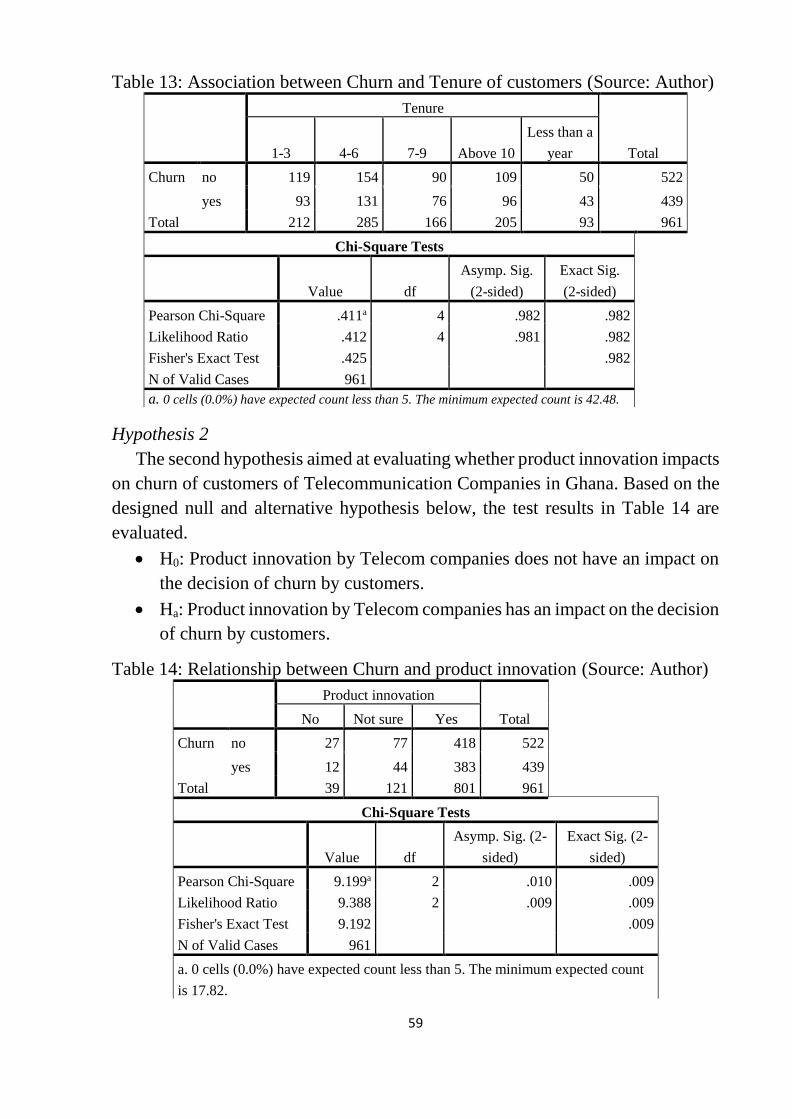
Table 13: Association between Churn and Tenure of customers ......................... 59
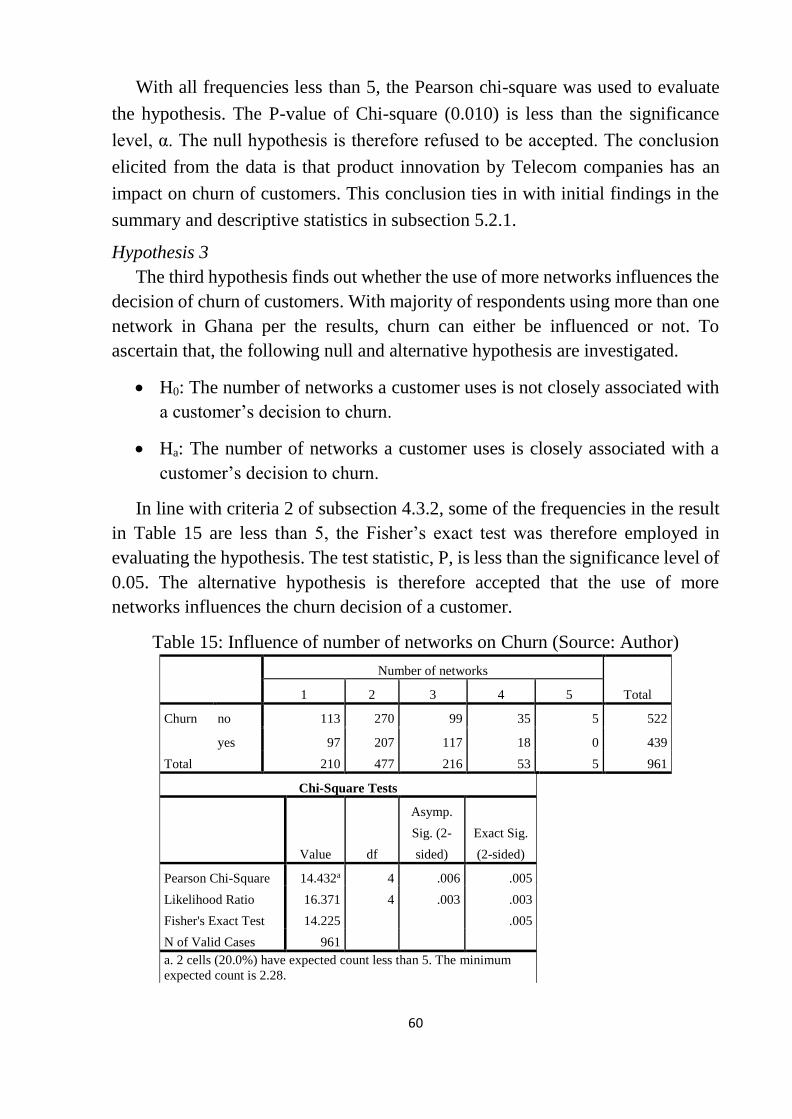
Table 14: Relationship between Churn and product innovation .......................... 59
Table 15: Influence of number of networks on Churn ......................................... 60
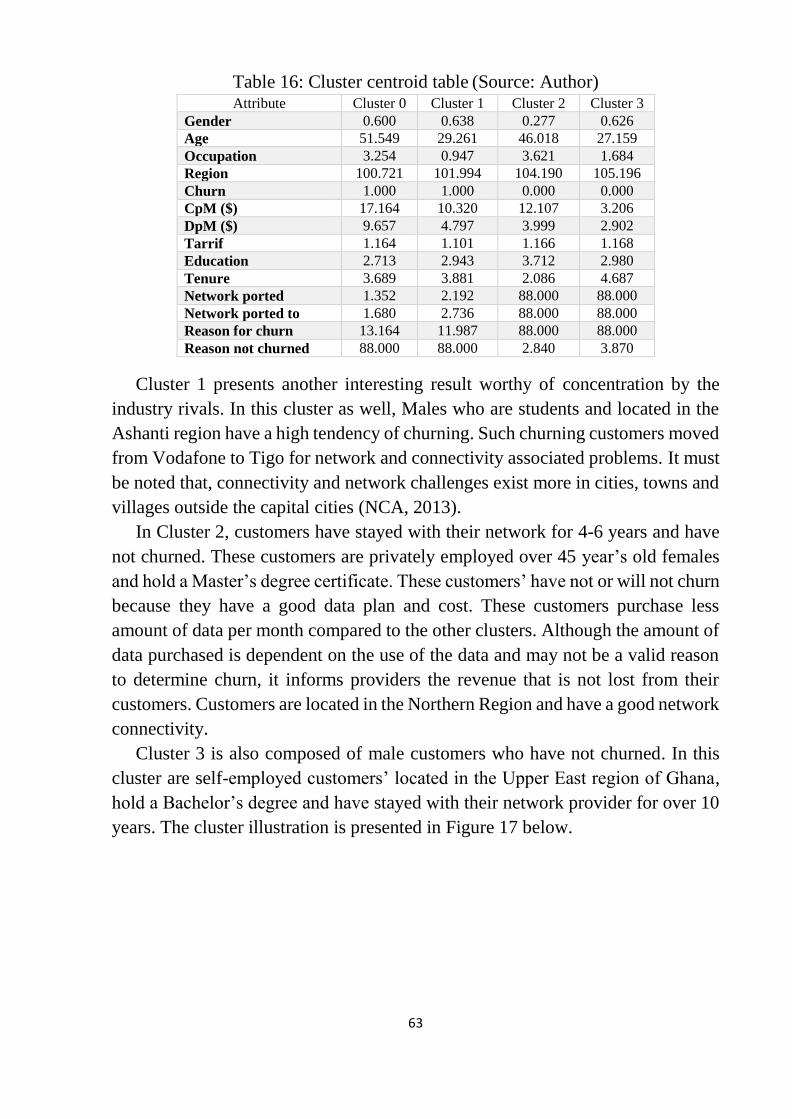
Table 16: Cluster centroid table ........................................................................... 63
Table 17: Top 10 generated Association rules ..................................................... 68
Table 18: Model prediction results ....................................................................... 70
Table 19: Classification Tablea for Logistic regression ....................................... 72
Table 20: Model prediction results ....................................................................... 72
Table 21: Variables in the Logistic equation ........................................................ 73
Table 22: Goodness of fit for model .................................................................... 74
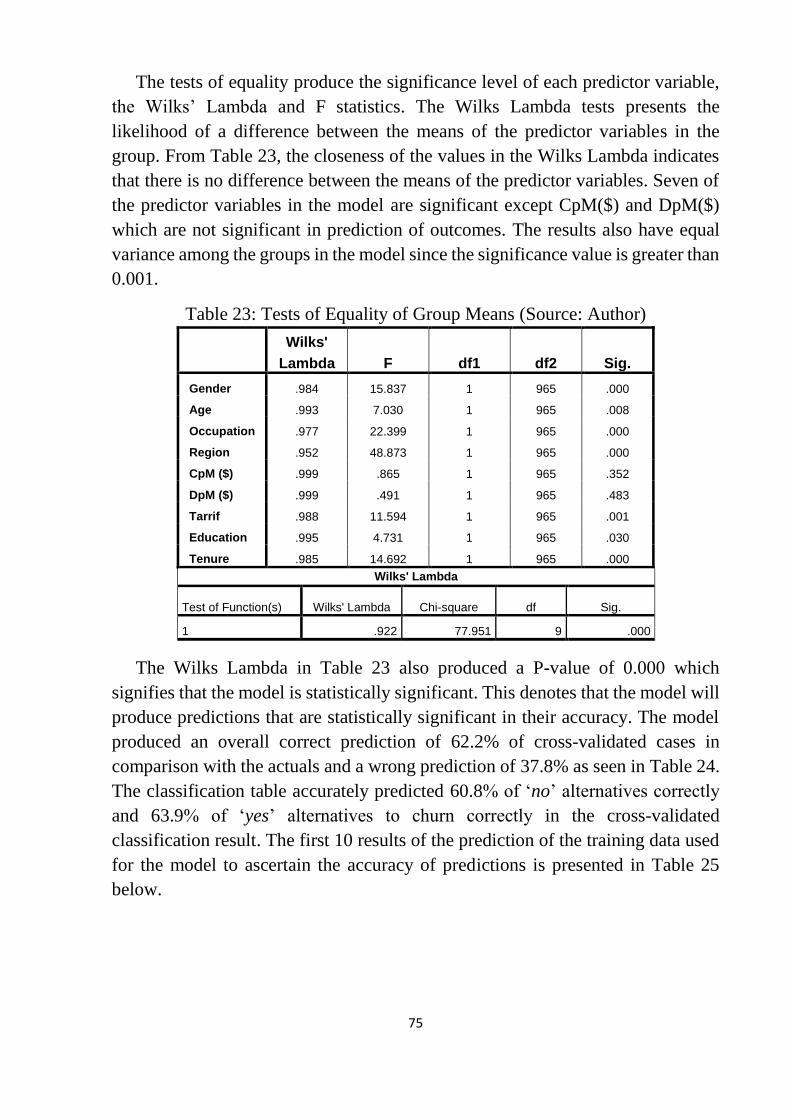
Table 23: Tests of Equality of Group Means ....................................................... 75
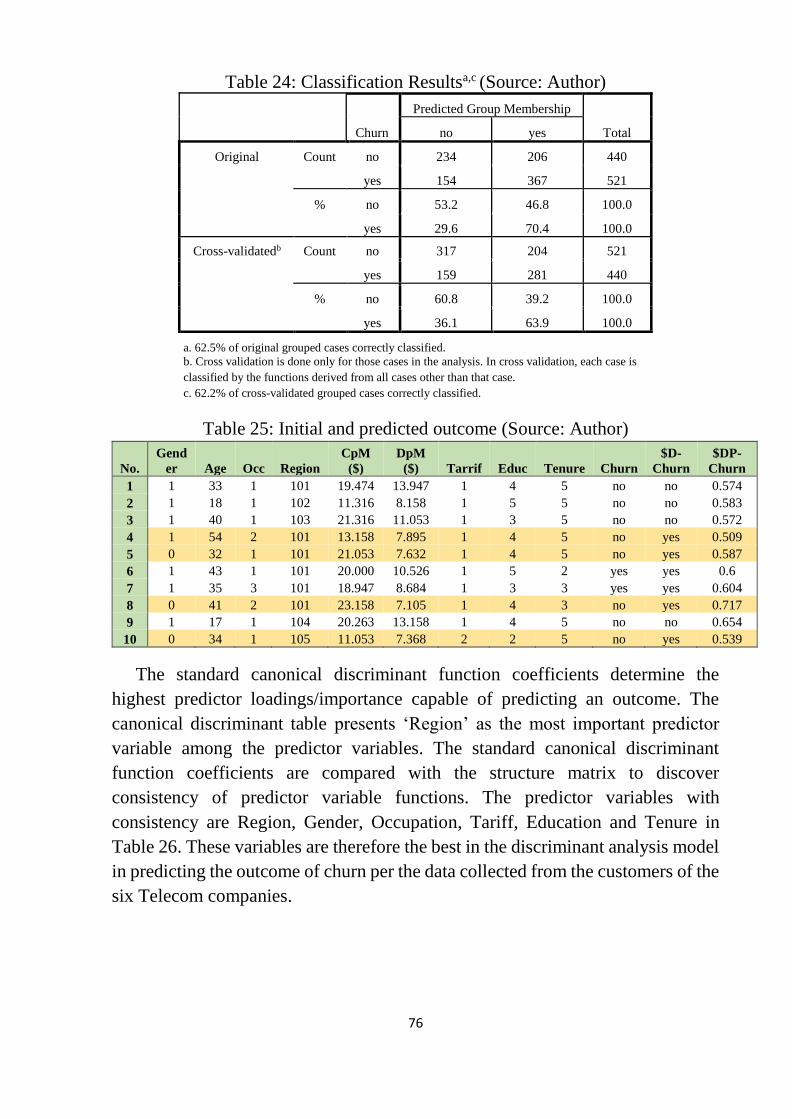
Table 24: Classification Resultsa,c ........................................................................ 76
Table 25: Initial and predicted outcome ............................................................... 76
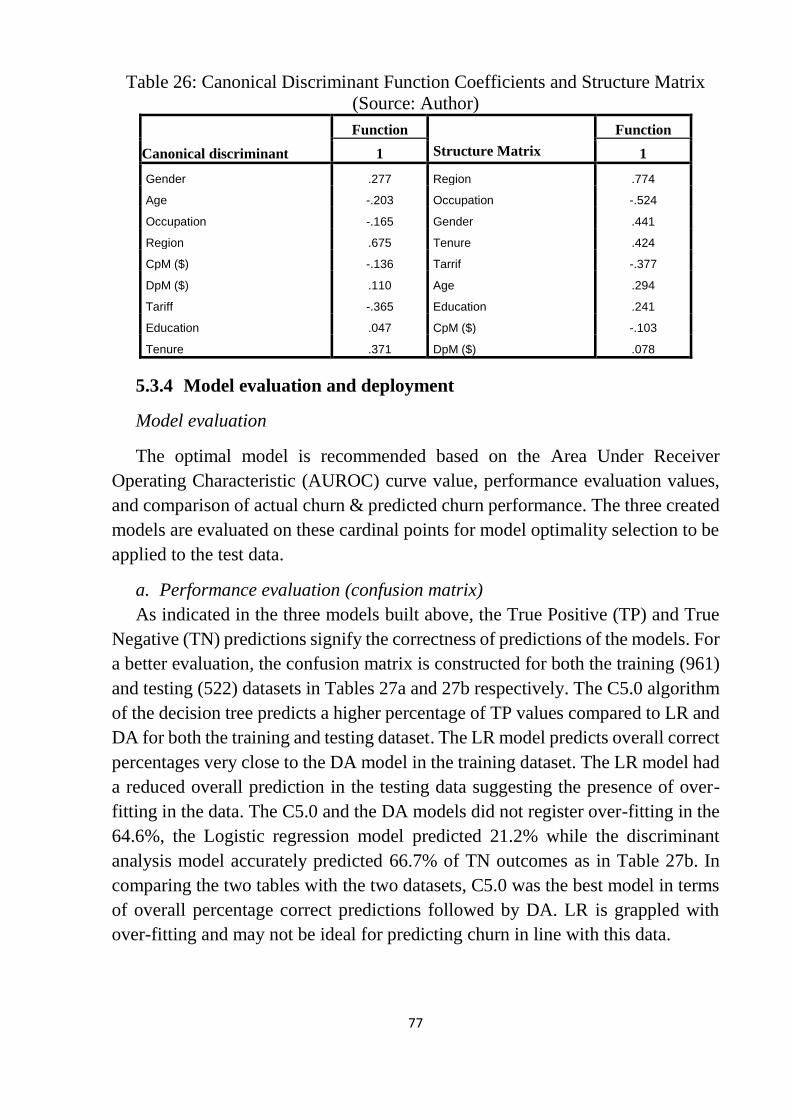
Table 26: Canonical Discriminant Function Coefficients and Structure Matrix . 77
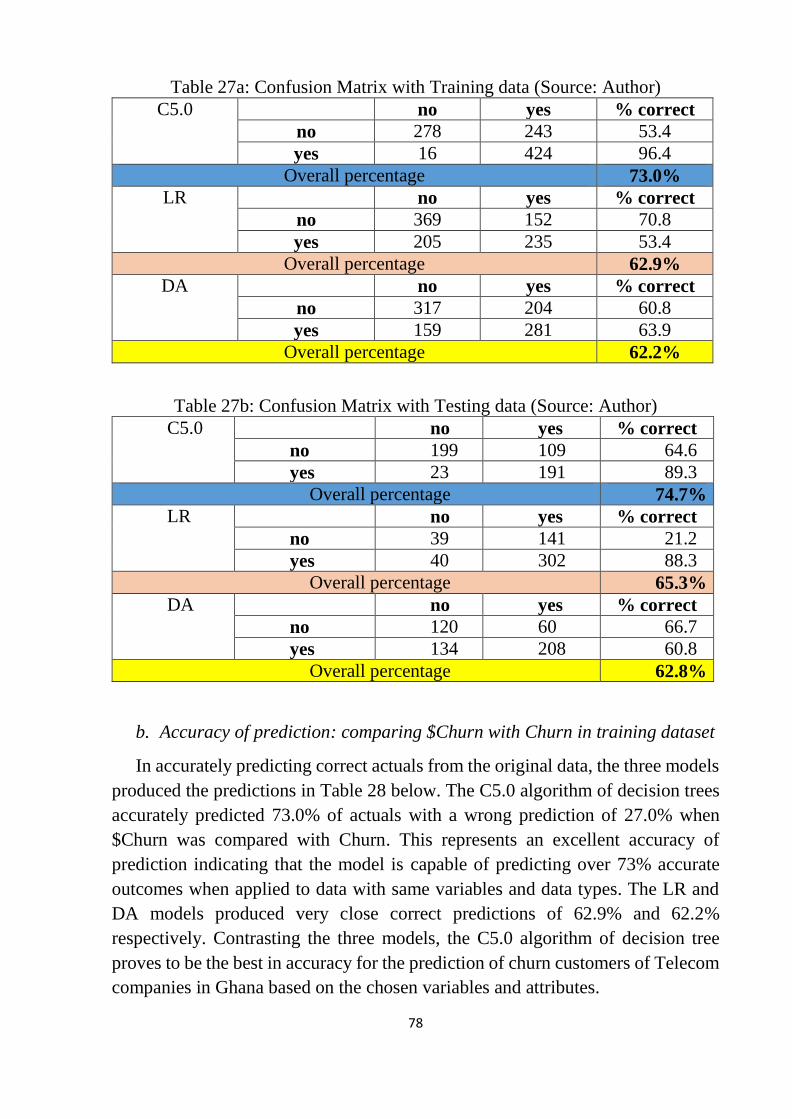
Table 27a: Confusion Matrix with Training data ................................................. 78
Table 27b: Confusion Matrix with Testing data .................................................. 78
Table 28: Comparing $Churn with Churn ............................................................ 79
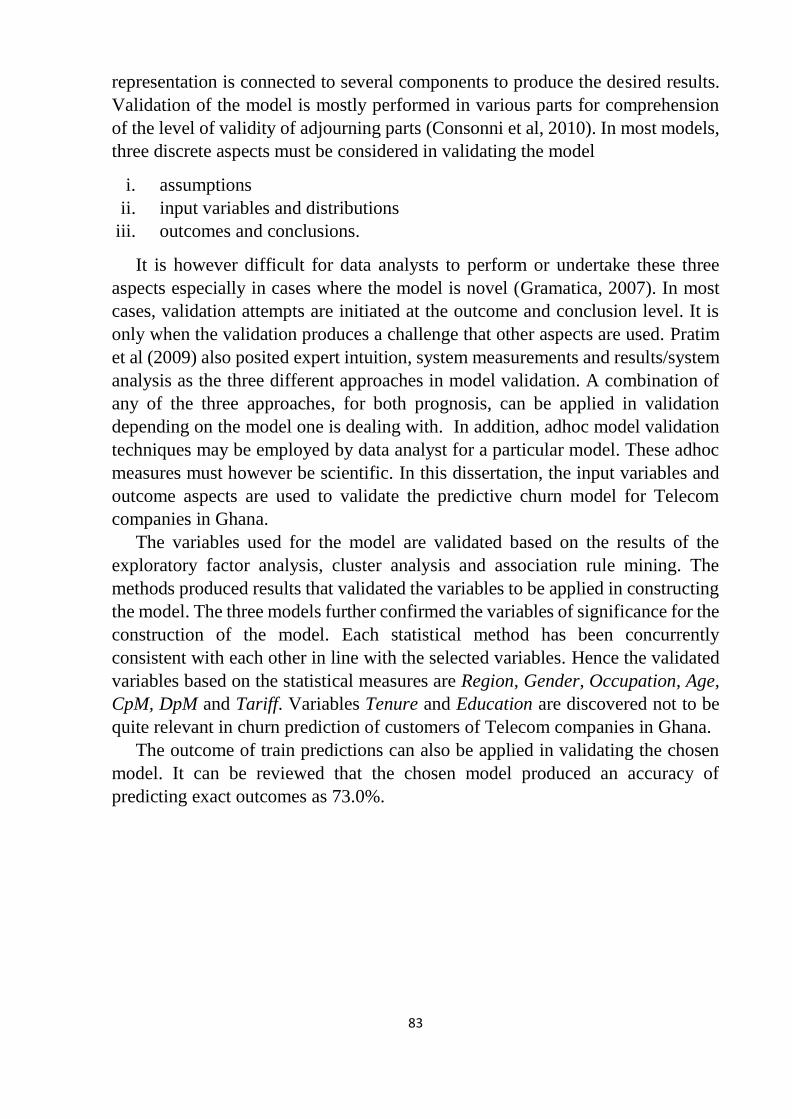
Table 29a: Results of test predictions_Yes .......................................................... 82
Table 29b: Results of test predictions_No ........................................................... 82
Table 30: Publications ........................................................................................ 104
Page 12
12
LIST OF ABBREVIATIONS
AUROC Area Under Receiver Operating Characteristic Curve
CART Classification and Regression Tree
CRM Customer Relationship Management
DA Discriminant Analysis
DBI Davies Bouldin Index
DM Data Mining
DT Decision Trees
EFA Exploratory Factor Analysis
FP-Growth Frequent Pattern Growth
GDP Gross Domestic Product
KM Knowledge Management
LMIE Lower Middle Income Economies
LR Logistic Regression
MNP Mobile Network Portability
MRAR Multi-Relational Association Rule
NBC Naïve Bayesian Classifiers
NCA National Communications Authority
NN Neural Networks
PCA Principal Component Analysis
SOM Self-Organising Maps
SVM Support Vector Machine
UNCTAD United Nations Conference on Trade and Development
Page 13
13
1 INTRODUCTION
Organizations are endowed with huge amounts of data that can be used for
varied purposes. The data possesses a high potential for different range of analysis
including prediction, classification and other techniques. One reason for the non-
utilization of this potential is the (non-awareness) insufficient knowledge of the
algorithms to be used on such data. Data mining tools and algorithms can be used
to exploit the potential in the data when the data is synthesized efficiently. The
non-cohesion of data scattered in different databases with varied structures makes
it difficult for users to apply analytics. The advent of data mining algorithms and
the development of software and hardware have led to an ease in analyzing huge
and complex data.
The dissertation employs some algorithms of data mining, based on machine
learning and statistical computing, to develop a predictive model for customer
churn in the Ghanaian Telecommunication industry. Cluster and association rules
are mined from quality data collected directly from customers to provide business
intelligence for the companies.
The dissertation contains seven (7) chapters. The first four (4) chapters consist
of the introduction, state of the art, objectives and selected processing methods
respectively. The fifth chapter has the main results while the remaining two
chapters detail contribution to science and practice, and conclusion with
limitations. An exhaustive introduction detailing the theory of data mining is
presented. The introduction is followed by the state of the art presenting the cracks
of predictive modelling, a review of the algorithms used in predictive modelling
in line with customer churn and an analysis of the Ghanaian Telecommunication
sector. Based on the review of the sector in Ghana on predictive analytics, the
research problem that identifies the gap is posed. Research objectives, hypothesis,
questions and a conceptual framework is designed to address the gap. A detailed
methodology in chapter four (4) consisting of the research design, sampling, data
collection and tools for analysis is presented. The main results that have a cluster
analysis, association rules and the generated predictive model is presented in the
succeeding chapter. Contribution of the dissertation to science and practice,
limitations, a summary of the dissertation in the conclusion as well as the
recommendation for future work are then presented chronologically.
Page 14
14
1.1 Theoretical foundation of data mining
With the invention of machines, most labour intensive, strenuous, regular or
complex mathematical calculations are done with the aid of calculators while
finding specific information in a large database is achieved by machines (Han et
al., 2011). Different types of machines are used for respective calibres of work
such as information storage, information retrieval, scheduling of appointment,
among others. The increase in the size of industrial data has given rise to an
increase in computer storage devices and capacities. This vast data needs to be
analysed, thus Han et al. (2011) indicated that as data increase immensely,
processes are developed for results upon the enactment of a query. Olson and Shi
(2007) posited that these tools can be used to perform only regular tasks but not
automatic classifications and other machine intelligence algorithms. The creation
and introduction of machine intelligence algorithms became eminent as they can
perform tasks supplied by humans and make decisions without human intervention
(Kantardzic, 2011; Freitas, 2013; Aggarwal and Philip, 2008). Data mining
emanated from the evolution of machine intelligence. In data mining, algorithms
create patterns and rules within the data. Algorithms can automatically classify the
data based on the similarities of rules and patterns obtained between the training
on the testing data set (Verma et al., 2012; Han et al., 2011; Afful-Dadzie et al.,
2014).
Michalski et al (2013), described machine learning as the study of
computations using algorithms to iteratively unearth hidden patterns in data.
Machine learning is applied in developing systems resulting in increased
efficiency and effectiveness. Two significant areas in machine intelligence are
knowledge discovery and Classification & Prediction (Kotsiantis, 2007). Patterns
that are extracted using machine intelligence can predict the class a particular data
falls under. A decision support system is similar to a machine learning system; it
is a system that suggests decisions based on the patterns found in the data
(Nabareseh et al, 2015). Data mining is as a result of machine intelligence that
identifies significant patterns for prediction. The processes in data mining are
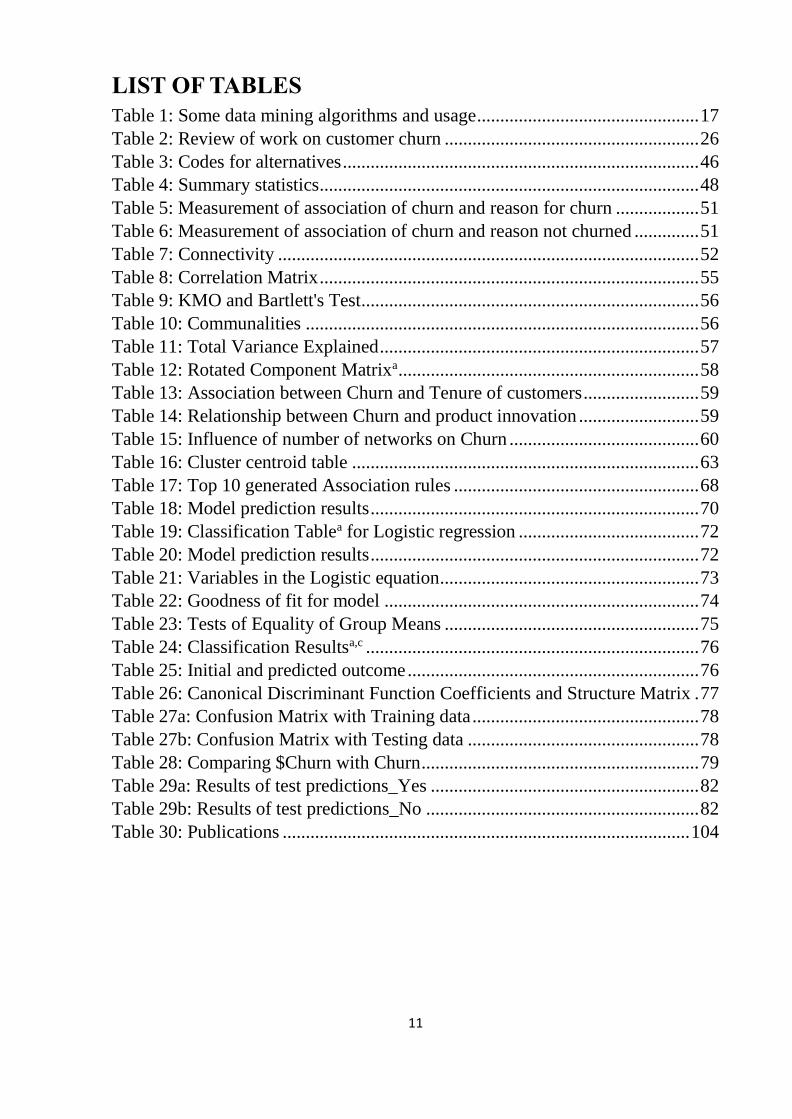
selection, pre-processing, transformation and visualization as shown in Figure 1
below.
Page 15
15
Figure 1: Data mining process (Source: Han et al, 2011)
In this information era, knowledge is becoming a crucial organizational
resource that provides competitive advantage and gives rise to knowledge-based
management (KM) initiatives (Ajmal et al, 2010). Chaiken et al (2008) stated that
the advancement in data collection technology like barcode scanners for
commercial purposes, sensors in scientific and industrial sectors among others
have led to the generation of huge amounts of data each day. The evolution of data
mining algorithms to mine these relevant patterns to create knowledge for decision
making has become paramount in the contemporary world. The management of
mined knowledge goes through creation, storage, transfer and application
processes (Jennex and Olfam, 2008; King, 2009; Rezgui, 2007). The application
of data mining is practical in services, industries and Government. Data mining
algorithms applied in these areas vary depending on the region, country or
industry.
Data Mining represents a multifaceted range of technologies that are rooted in
disciplines like mathematics, statistics, computer science and engineering among
others (Koh and Tan, 2011; Shmueli et al, 2016; Li et al, 2016, Wu et al, 2014).
According to Peng et al. (2008), data mining involves the process of exploring and
modelling large datasets to elicit useful results and patterns. Data mining is rooted
in three sections: classical statistics, machine learning and artificial intelligence
(AI) (Han et al., 2011). Data mining uses algorithms like artificial neural networks,
time series analysis, association rules, clustering, regression, classification, and
many others to mine relevant information for decision making and prediction
(Chattamvelli, 2011). Ahmed (2004) defined classification as the way to discover
various characteristics in management, association as rules of affinity among
Page 16
16
collected data and clustering as a process of segmentation. Bação (2008) proffered
that the developed world has had a full grasp of these algorithms, however, the
developing world is still grappling with defunct methods of data analysis and is
yet to take full advantage of this advance methodology.
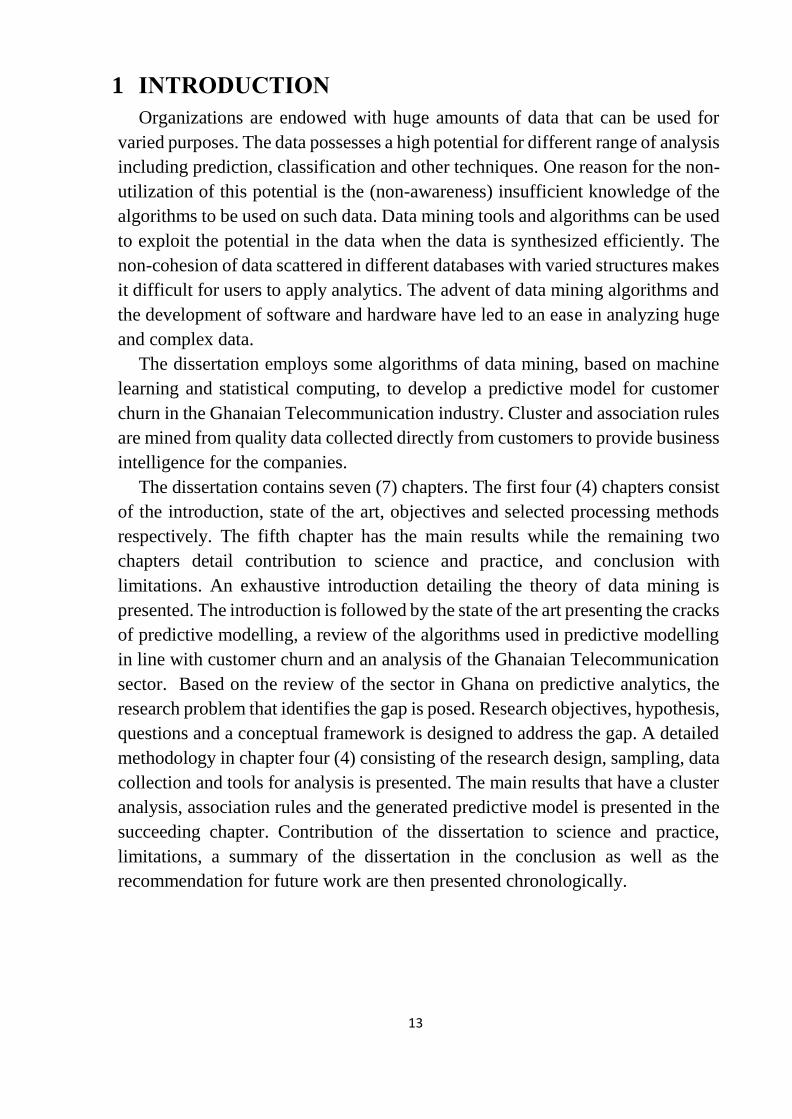
Data mining can be analyzed in two forms: predictive and descriptive.
Descriptive analysis deals with classification data into sequence, patterns and
trends for decision making. Predictive mining uses classified data to forecast for
the future using various algorithms. The details of the processes and types of
analysis on data mining is indicated in Figure 2 below.
Figure 2: Forms of Data mining (Source: Author)
Data mining techniques mostly used in Customer Relationship Management
(CRM) are decision trees, neural networks, association rules, sequence discovery
among others (Hung et al., 2011). The tools and methodologies of data mining are
designed primarily to discover hidden patterns to aid in decision making. The
algorithms’ applied in data mining are particularly used with other techniques such
as statistics, computational mathematics and visualization to predict future
occurrence based on reliable data (Linoff and Berry, 2011).
The definitive goal of data mining is prediction (Xiuhong et al., 2011).
Predictive analytics is a data mining algorithm mostly used by industry players for
forecasting (Waller and Stanley, 2013; Siegel, 2013; Hazen et al., 2014).
Predictive analytics is an algorithm in data mining that mines relevant knowledge
from data for forecasting (Bação, 2008). According to Han et al (2011), predictive
analytics algorithm in data mining also categorizes new, useful and explainable
patterns and correlations in existing data. Predictive analytics algorithm is useful
Association Sequence discovery
DESCRIPTIVE
DATA
MINING
PREDICTIVE
Time series analysis Regression Neural Networks
Clustering
Page 17
17
to predict economic growth, interest rates and inflation, household income,
education standards, trends in crime, climate change (Han et al., 2011), behaviour
of customer, customer interest (Reichheld, 2006), bankruptcy prediction, fraud
detection, network effect (Madhuri, 2013), production (supply and demand) and
sales (Siegel, 2013).
1.2 Data mining vs. the economic sector
Data mining and predictive analytics have been applied in several areas in the
economic sector. Linoff and Berry (2011) presented data mining in advertising
coupled with web usage for discovery and applications for usage patterns. Ngai et
al (2009), Hippner & Wilde, (2008) and Thearling, (2009) carefully analysed data
mining in CRM in predicting customer behaviour. Other data mining and
predictive analytics applicable areas tackled by various authors in the economic
and service sectors include Marketing (Madhuri, 2013), Telecommunications and
Fraud Detection (Pareek, 2006; Phua et al., 2010; Hung et al., 2011; Olson and
Delen, 2008 and others), Entertainment, Manufacturing, eCommerce,
Investment/Securities, Health Care, and Sports (Jensen et al, 2012; Han et al, 2011;
Bação, 2008; Koh and Tan, 2011; Harding et al., 2006 and others). Reichheld
(2006) indicates that the increase in government revenue and economic stability
largely depends on a vibrant data and predictive analytics.
The application of data mining in the respective disciplines are performed by
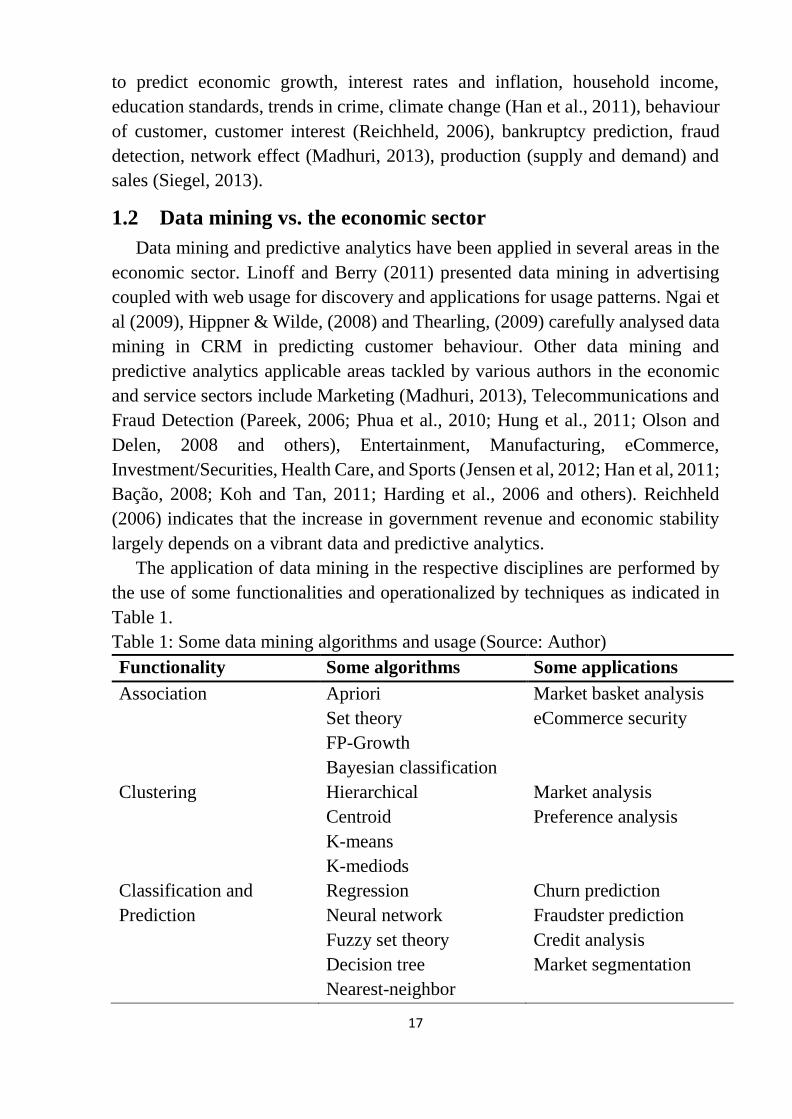
the use of some functionalities and operationalized by techniques as indicated in
Table 1.
Table 1: Some data mining algorithms and usage (Source: Author)
Functionality Some algorithms Some applications
Association Apriori
Set theory
FP-Growth
Bayesian classification
Market basket analysis
eCommerce security
Clustering Hierarchical
Centroid
K-means
K-mediods
Market analysis
Preference analysis
Classification and
Prediction
Regression
Neural network
Fuzzy set theory
Decision tree
Nearest-neighbor
Churn prediction
Fraudster prediction
Credit analysis
Market segmentation
Page 18
18
Association deals with discovering rules of frequency of occurrence of
attributes in a dataset (Greenwald et al, 2009; Wu et al, 2011). Algorithms such as
Bayesian classifiers, Set Theory, FP-Growth and Apriori methods are used in
association mining and applied in many fields such as marketing, eCommerce,
market basket analysis, politics and Governance among others (Nabareseh et al,
2014; Treinen and Thurimella, 2006; Changzheng and Shuo, 2012). Association
rules work significantly on transactional data but can also be applied on other
relevant data. Association rules must always be based on frequent item-set, support
and confidence (Nabareseh et al., 2014). The higher the support and confidence,
the better the result in analysis. Support and confidence are defined in Eqns 1.1
and 1.2 below.
( )Support P A B (1.1),
meaning the proportion of transactions containing A or B out of the total number
of transactions.
( )( \ )
( )
P A BConfidence P A B
P A
(1.2),
meaning the proportion of transactions containing A or B out of the number of
transactions containing A. Strong rules must always be more than minimum set up
support or confidence.
Cluster analysis is the most used descriptive data mining functionality. It is
used to cluster variables into homogeneous and heterogeneous groups internally
and externally respectively. Clustering is either done hierarchically or non-
hierarchically. Hierarchical clustering is when cluster are in succession from the
simplest to the more complex (Suzuki and Shimodaira, 2006) while non-
hierarchical method combines number of observations into previous clusters
(Giudici and Figini, 2009). Cluster analysis is applied in Human Resource
Management, warehouse item Region, eCommerce, water and sanitation,
customer preferences among others (Nabareseh et al, 2016; Anderberg, 2014;
Nabareseh et al, 2015; Hosseini et al, 2010; Miyamoto, 2012). Mostly, the
Euclidean distance among data records is used in clustering as indicated in Eqn
1.3.
2( , ) ( )d
i i
i
Euclidean x y x y (1.3),
where x = x1, x2,…, xn, and y = y1, y2,…, yn represent n values of two observations.
Page 19
19
Classification assigns variables to targets based on attributes for prediction. The
classification is done on similarity of attributes in variables. To predict attributes
of the future, some statistical and computational mathematical algorithms such as
regression, neural network, decision tree and nearest-neighbour (Nabareseh et al,
2016; Han et al, 2011; Ngai et al, 2011; Bhardwaj and Pal, 2012; Srinivas et al,
2010). Classification and prediction functionalities are conducted in churn
management, fraud analysis, credit risk, heart attack among others. The algorithms
are applied in all sectors of the economy.
In a manufacturing or production setup, concerns of supply chain management,
optimizing the process, job scheduling, quality control, planning of materials
needed, ERP for lean management, and cell organization are encountered. The
application of predictive analytics and other data mining algorithms can assist in
extracting the right and interesting patterns in data of these areas for prediction and
decision making (Bhardwaj and Pal, 2012). The service sector has become the
main factor to innovation and business success and growth (Changzheng and Shuo,
2012). In most developed economies, the service sector has become the engine of
growth overcoming the agricultural and industrial sectors. While this sector
powers more than 70% of the economy and creates more than half of all jobs in
developed countries, its contribution tends to be substantially lower in developing
economies (UNCTAD, 2012). The daily influx of data on customers, sales,
complaints, and staff, in service sectors as insurance, banking and
Telecommunication, among others need real time analysis. The analysis of data on
customers in relation to customer behaviour, attraction and retention of customers
and customer churn prediction are clear areas in this sector that need careful
analysis for pattern recognition to enhance decision making in Lower Middle
Income Economies (LMIE). The need for more robust tools for analysing these
data is cogent in these countries such as Ghana.
Page 20
20
2 STATE OF THE ART
The results from any well analysed data gives a basis to an increase in the quality
of decisions made by Management of companies and establishments. This can be
traced to efficient and effective knowledge derived from enhancement in the
analysis. The daily loss of customers by companies portrays lack of indepth
knowledge on the needs of the customers so as to retain them. Telecommunication
companies have therefore found themselves in this category of firms. The need for
data mining and its algorithms to create this cogent knowledge for decision making
is apparent.
2.1 Predictive modelling
The increasing levels of fraudulent tendencies in the behavior of customers’
damages companies in the service industry especially Telecommunication
companies (Farvaresh and Sepehri, 2011). Subscription fraud has constantly been
a leading fraudulent activity faced by Telecommunication companies and
constantly predicted by data miners. Customer churn prediction is another
interesting area that attracts predictive modelling for management purposes
(Farvaresh and Sepehri, 2011). The enormous volume of data constantly generated
by Telecommunication companies with millions of variables and attributes gives
rise to predictive modelling. Notwithstanding the quantum of data produced, a
number of the companies, especially in developed countries, dig into this data for
knowledge and prediction for decision making. The activity is however copiously
absent in most developing countries.
Predictive modelling is therefore a data mining algorithm that digs into
untapped data, re-organizes and categorizes it to make a forecast that will feed into
decision making. These predictive analytics areas result in classifiers to create
predictive models for application on testing data. Companies plan for the future,
therefore predictive analytics is an estimator of values of business variables for
that future. Predictive analytics is employed in various fields such as
Telecommunication, retail, healthcare, finance, transportation, actuarial science,
and insurance, among others. Various authors have tackled predictive modelling
in different ways as discussed earlier. The following data mining techniques have
been used by data miners for predictive modelling some of which are explored in
this dissertation.
Page 21
21
2.1.1 Logistic regression
Logistic regression is a predictive modelling technique where there is a
correlation between the probability of a result and its predictor variables as seen
in equation 2.1.
0 1 1 2 2log ...(1 )
ii i k ik
i
X X X
(2.1)
where
πi is the probability of the outcome,
β1, …, βk are coefficients,
X1, …, Xik are predictor variables.
The β coefficients are transformed into odds ratios with the degree of
importance of predictors well known. The Hosmer-Lemeshow statistic is accepted
extensively in assessing the goodness of fit of developed models in logistic
regression with a dichotomous outcome (Hosmer et al, 2013). In a specific manner,
logistic regression details the linear function of observed attributes for endogenous
variables as the fitted probability of event. The fitted probability, logit (πi), is
defined as
logit( ) log(1 )
ii
i
(2.2), the
logarithm of odds, which is the natural log of the probability of success and failure.
Logistic regression has been used by many authors to create predictive models
in healthcare (Raghupathi and Raghupathi, 2014; Koh and Tan, 2011; Srinivas et
al, 2010), preparing landslide susceptible maps (Nefeslioglu et al, 2008),
prediction of fraud (Ngai et al, 2011; Phua et al, 2010), among others.
2.1.2 Decision tree analysis
Decision trees are classification techniques (which are explicit) that partition
data in a recursive manner into smaller divisions based on some algorithms. One
advantage of decision tree analysis is that they are nonparametric and no
assumptions are used in relation to input data (Nabareseh et al, 2015; Tso and Yau,
2007). Decision trees are able to handle nonlinear data, missing values, numeric
and categorical data (Schmid, 2013) that makes it idyllic for predictive modelling
for churn management since primary data from customers are used. Decision trees
are formulated using key variables related to previous variables in training models
to predict future outcomes, churn intentions of customers and forecast revenue
effect of companies (Tso and Yau, 2007). Decision trees are used in structuring
Page 22
22
and training linear functions (Oliver and Hand, 2016), judgement analysis by
management (Buntine, 2016) and prediction of consumption of electricity (Tso
and Yau, 2007).
One key method used in measuring leaf and node ‘worthiness’ is the
Classification and Regression Tree (CART) algorithm. The method was
introduced in 1984 by Leo Breiman and other authors. CART produces binary
decision trees having two branches for decision nodes. Considering Eqn 2.3 below
#
1
( \ ) 2 ( \ ) ( \ )classes
L R L R
j
s t P P P j t P j t
(2.3)
where ϕ(s\t) is the measure of ‘worthiness’ of a variable split s at node t
tL is the left leave node of node t
tR is the right leave node of node t
PL is the number of records at tL out of the number of records in the
training set
PR is the number of records at tR out of the number of records in the
training set
P(j\ tL) is the number of class j at tL out of the number of records at t and
P(j\ tR) is the number of class j at tR out of the number of records at t, the
optimal split is the one that maximizes the measure of ‘worthiness’ over
all potential splits at node t.
Another currently used algorithm is the C5.0 algorithm. The classifier first
classifies back data which generates a decision tree. The C5.0 algorithm builds on
the inadequacies of the C4.5 algorithm. C4.5 follows in the ideals and rules of the
D3 algorithm. The C5.0 algorithm is therefore hinged on the following features:
The option of viewing decision trees by use of rules for better
understanding and interpretation. The rules consist of fewer errors with
unseen outcomes
The algorithm exposes the picture on noise and missing values in a
dataset.
The C5.0 algorithm solves pruning and over fitting discrepancies in the
model.
In terms of classifying attributes, the C5.0 algorithm can easily
determine relevant and non-relevant attributes (Pandya and Pandya,
2015). The technique also supports boosting in the construction and
combination of classifiers.
C5.0 algorithm runs faster than C4.5 and is more efficient on the use of
memory the C4.5 algorithm.
Page 23
23
The C5.0 algorithm also produces smaller decision trees when contrasted
with C4.5 algorithm.
In line with the above features, the C5.0 algorithm therefore crops out very
accurate and precise results in prediction. The algorithm can accurately predict
relevant attributes for classification. The C5.0 algorithm has been applied in
different disciplines such as text mining in varied fields (Nanda et al, 2011),
evaluation of credits by banks (Pang and Gong, 2009) and the classification of
network traffics (Bujlow et al, 2012).
2.1.3 Neural networks
Neural networks are used for descriptive and predictive data mining. Neural
network is the linking of neurons (computed units) with respect to their weights
(Pham et al, 2014). Artificial neural networks computes based on input signals and
importance weight just as the brain does computations (Nefeslioglu et al, 2008).
The input signals conduct a combination function with the weights and threshold
value, and activated by the activation function to produce an output signal as seen
in Eqn 2.4.
0
( , ) ( )n
j j j i ij
i
y f x w f P f x w
(2.4)
where j is a generic neuron, x is the input signals, wj are the weights, Pj is the
potential and yj the output signal.
Neural networks fit non-linear functions very well in addition to recognizing
patterns. The algorithm is used in a wide range of fields such as aerospace,
automotive, banking, defense, electronics, entertainment, financial, insurance,
manufacturing, oil and gas, robotics, telecommunications, and transportation
industries (Tso and Yau, 2007; Pham et al, 2014; Kohn et al, 2014; Gregor et al,
2015).
2.1.4 Nearest-neighbour models
The k-nearest neighbour is a data mining algorithm mostly used for
classification. The algorithm can also be used for estimation and prediction (Muja
and Lowe, 2009; Garcia et al, 2008; Jiang et al, 2012). The k in the model
determines the number of variables included in the neighborhoods. If there are
continuous response variables, the nearest neighbour value given to each variables
response (yi) is determined by Eqn 2.5 below.
Page 24
24
( )
1ˆ
j i
i j
x N x
y yk
(2.5)
where x corresponds to the to the neighbouhood of xi, N(xi) and k is a fixed
constant.
Nearest-neighbour has two methods: the distance function and the
cardinality k. The distance method has been discussed in details in section 1.2 Eqn
1.3 above. The cardinality k signifies the importance and complexity of the
nearest-neighbour (Jiang et al, 2012). When k is higher in value, then the model is
less adaptive. In some instances, the k value can be used for goodness of fit.
2.1.5 Discriminant analysis
Discriminant analysis (DA) is a generalized linear modelling technique used in
machine learning and pattern recognition for the linear combination or separation
of categories of objects (Han et al., 2011). DA is also applied in determining the
variable that distinguishes two or more categories that helps in prediction. The
normality of the explanatory variables in DA is assumed and applied in the
prediction. A discriminant function is used to dichotomize the two groups in DA
as seen in equations 2.6 and 2.7.
1
1 1
1 ( )xP
x e
(2.6)
where α and β coefficients are
1
1 0
111 0 1 0
0
( )
1log ( ) ( )
2
T
T
(2.7)
where π0 and π1 are prior probabilities,
µ0 and µ1 are the means of the distributions.
2.2 Customer churn prediction
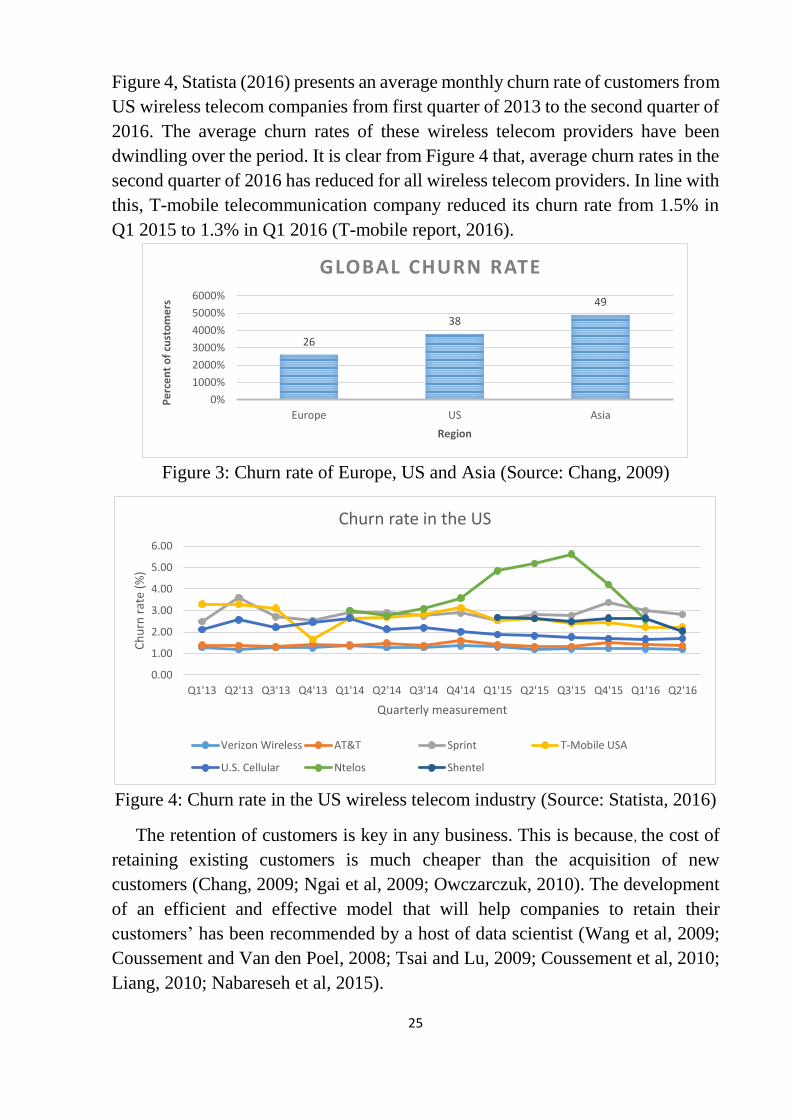
Customer churn creates a huge anxiety in highly competitive service sectors
especially the Telecommunications sector (Hilas and Mastorocostas, 2008; Hong
et al, 2009). The churn prediction of the mobile Telecommunication industry is on
the average of 2.2% according to marketing researchers (Chang, 2009). The churn
rate of customers in Europe, Asia and the US in the Telecommunication industry
is presented in Figure 3 below. It can clearly be seen that there is a higher churn
rate of customers in Asia than in the US and Europe. The higher rate may be
aligned to the population of customers for telecom companies in Asia. Also in
Page 25
25
Figure 4, Statista (2016) presents an average monthly churn rate of customers from
US wireless telecom companies from first quarter of 2013 to the second quarter of
2016. The average churn rates of these wireless telecom providers have been
dwindling over the period. It is clear from Figure 4 that, average churn rates in the
second quarter of 2016 has reduced for all wireless telecom providers. In line with
this, T-mobile telecommunication company reduced its churn rate from 1.5% in
Q1 2015 to 1.3% in Q1 2016 (T-mobile report, 2016).
Figure 3: Churn rate of Europe, US and Asia (Source: Chang, 2009)
Figure 4: Churn rate in the US wireless telecom industry (Source: Statista, 2016)
The retention of customers is key in any business. This is because, the cost of
retaining existing customers is much cheaper than the acquisition of new
customers (Chang, 2009; Ngai et al, 2009; Owczarczuk, 2010). The development
of an efficient and effective model that will help companies to retain their
customers’ has been recommended by a host of data scientist (Wang et al, 2009;
Coussement and Van den Poel, 2008; Tsai and Lu, 2009; Coussement et al, 2010;
Liang, 2010; Nabareseh et al, 2015).
26
38
49
0%
1000%
2000%
3000%
4000%
5000%
6000%
Europe US Asia
Pe
rce
nt
of
cust
om
ers
Region
GLOBAL CHURN RATE
0.00
1.00
2.00
3.00
4.00
5.00
6.00
Q1'13 Q2'13 Q3'13 Q4'13 Q1'14 Q2'14 Q3'14 Q4'14 Q1'15 Q2'15 Q3'15 Q4'15 Q1'16 Q2'16
Ch
urn
rat
e (%
)
Quarterly measurement
Churn rate in the US
Verizon Wireless AT&T Sprint T-Mobile USA
U.S. Cellular Ntelos Shentel
Page 26
26
A number of researchers have used varied techniques to address churn in
various fields. In the churn analysis and modelling of the telecommunication
industry, very common algorithms deployed include Decision Trees (DT),
Logistic Regression (LR), Neural Networks (NN), Naïve Bayesian Classifiers
(NBC), Support Vector Machine (SVM), Linear Discriminant Analysis (LDA),
Self-Organising Maps (SOM), among others. The details of these, in addition to
the topic and the data type adapted for the modelling is given in Table 2. These
techniques are applied in predicting both qualitative and quantitative data and the
interpretation of the predictive models created. Some of these techniques such as
naïve Bayesian classifiers, clustering and decision trees do not give any assurance
on precision of the constructed models large data and time series data. This is cured
by other techniques which are strongly robust and very precise in churn modelling
such as LR, SOM, NN and LDA (Xhemali et al, 2009).
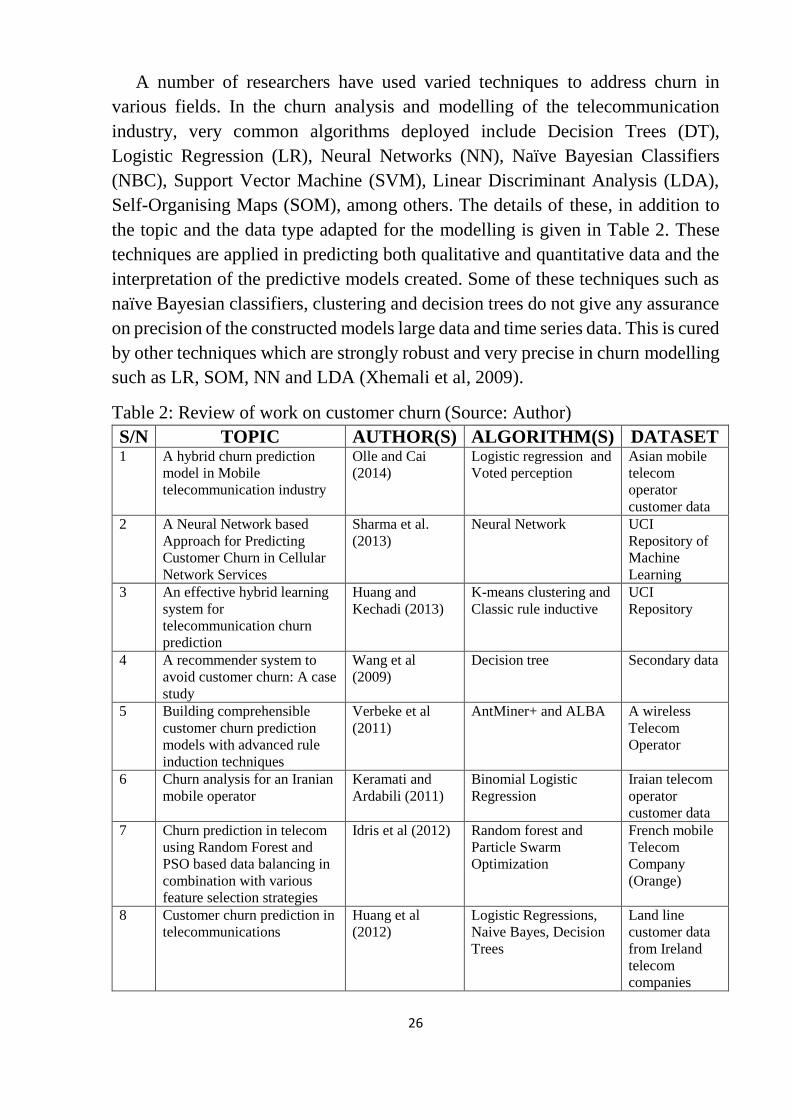
Table 2: Review of work on customer churn (Source: Author)
S/N TOPIC AUTHOR(S) ALGORITHM(S) DATASET 1 A hybrid churn prediction
model in Mobile
telecommunication industry
Olle and Cai
(2014)
Logistic regression and
Voted perception
Asian mobile
telecom
operator
customer data
2 A Neural Network based
Approach for Predicting
Customer Churn in Cellular
Network Services
Sharma et al.
(2013)
Neural Network UCI
Repository of
Machine
Learning
3 An effective hybrid learning
system for
telecommunication churn
prediction
Huang and
Kechadi (2013)
K-means clustering and
Classic rule inductive
UCI
Repository
4 A recommender system to
avoid customer churn: A case
study
Wang et al
(2009)
Decision tree Secondary data
5 Building comprehensible
customer churn prediction
models with advanced rule
induction techniques
Verbeke et al
(2011)
AntMiner+ and ALBA A wireless
Telecom
Operator
6 Churn analysis for an Iranian
mobile operator
Keramati and
Ardabili (2011)
Binomial Logistic
Regression
Iraian telecom
operator
customer data
7 Churn prediction in telecom
using Random Forest and
PSO based data balancing in
combination with various
feature selection strategies
Idris et al (2012) Random forest and
Particle Swarm
Optimization
French mobile
Telecom
Company
(Orange)
8 Customer churn prediction in
telecommunications
Huang et al
(2012)
Logistic Regressions,
Naive Bayes, Decision
Trees
Land line
customer data
from Ireland
telecom
companies
Page 27
27
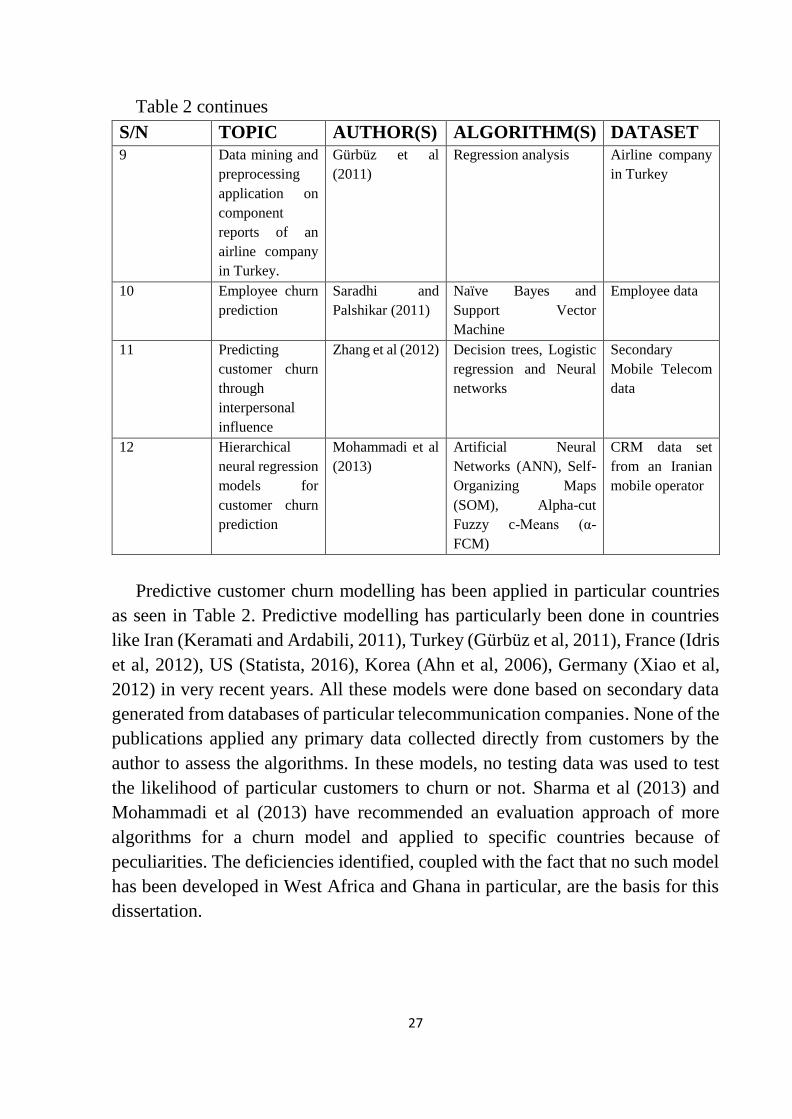
Table 2 continues
S/N TOPIC AUTHOR(S) ALGORITHM(S) DATASET
9 Data mining and
preprocessing
application on
component
reports of an
airline company
in Turkey.
Gürbüz et al
(2011) Regression analysis Airline company
in Turkey
10 Employee churn
prediction Saradhi and
Palshikar (2011) Naïve Bayes and
Support Vector
Machine
Employee data
11 Predicting
customer churn
through
interpersonal
influence
Zhang et al (2012) Decision trees, Logistic
regression and Neural
networks
Secondary
Mobile Telecom
data
12 Hierarchical
neural regression
models for
customer churn
prediction
Mohammadi et al
(2013) Artificial Neural
Networks (ANN), Self-
Organizing Maps
(SOM), Alpha-cut
Fuzzy c-Means (α-
FCM)
CRM data set
from an Iranian
mobile operator
Predictive customer churn modelling has been applied in particular countries
as seen in Table 2. Predictive modelling has particularly been done in countries
like Iran (Keramati and Ardabili, 2011), Turkey (Gürbüz et al, 2011), France (Idris
et al, 2012), US (Statista, 2016), Korea (Ahn et al, 2006), Germany (Xiao et al,
2012) in very recent years. All these models were done based on secondary data
generated from databases of particular telecommunication companies. None of the
publications applied any primary data collected directly from customers by the
author to assess the algorithms. In these models, no testing data was used to test
the likelihood of particular customers to churn or not. Sharma et al (2013) and
Mohammadi et al (2013) have recommended an evaluation approach of more
algorithms for a churn model and applied to specific countries because of
peculiarities. The deficiencies identified, coupled with the fact that no such model
has been developed in West Africa and Ghana in particular, are the basis for this
dissertation.
Page 28
28
2.3 The Ghanaian Telecommunication Industry
Ghana is one of the first countries in Sub-Sahara Africa to launch mobile
cellular network in 1992 (Tchao et al, 2013). The Country liberalized and
deregulated the Telecom industry in the year 1996, one of the leaders in Sub-
Sahara Africa. The deregulation witnessed the penetration of more providers in the
industry. Currently, there are six Telecom providers for both voice and data. The
National Communications Authority (NCA) was legally institutionalized to
regulate the industry and other communication bodies, Act of 1996, Act 524.
Below is a brief description of the providers.
Millicom Ghana Limited, under the trading name Tigo, was the first mobile
cellular network in Ghana and most especially Sub-Sahara Africa. The network
was incorporated in 1990 under the name Mobitel. The network started providing
service in 1992, introduced GSM in 2002 and rebranded its name to Tigo in 2006.
The network currently provides both voice and data services with other added on
services. MTN-Ghana is incorporated as Scancom limited and following the
acquisition of Investcom. The mobile network provider is the biggest in the
Country in terms of subscriber base and infrastructure. The network provides
variety of products including pre and post-paid services. The network covers all
the ten regions in the country and has a 14,000 kilometer-long submarine cable in
the continent for broadband. Vodafone Ghana is the second largest mobile
network in the Country. The network operated earlier as Ghana
Telecommunication Company Limited before majority shares (70%) was sold to
Vodafone Group Plc in 2008. The company is the largest provider of fixed
telephony in Ghana. Airtel Ghana is the fourth largest in Ghaan per market share.
The company took over from Zain in 2010. Zain acquired Western Telecoms
Limited (Westel) in 2008. The company provides voice, data, fixed telephony and
other services. Expresso is the last in market share. The company, however, was
the second cellular telephony in the country, incorporated in 1995 under the name
Celltel. Hutchison Telecom acquired 80% of the company in 1998 and rebranded
it to Kasapa telecom in 2003, the only locally branded telecom. In 2008, Expresso
Telecom acquired 100% of the Kasapa’s shares. Glo Mobile Ghana Limited is the
sixth mobile network company in Ghana. The company is a subsidiary of Glo
Mobile, owned by a Nigerian. The Company was licenced in 2008 but however
commenced business in 2012. The detailed market share of all the six mobile
network companies for voice and data as at August 2016 are presented in Figures
5 and 6 below.
Page 29
29
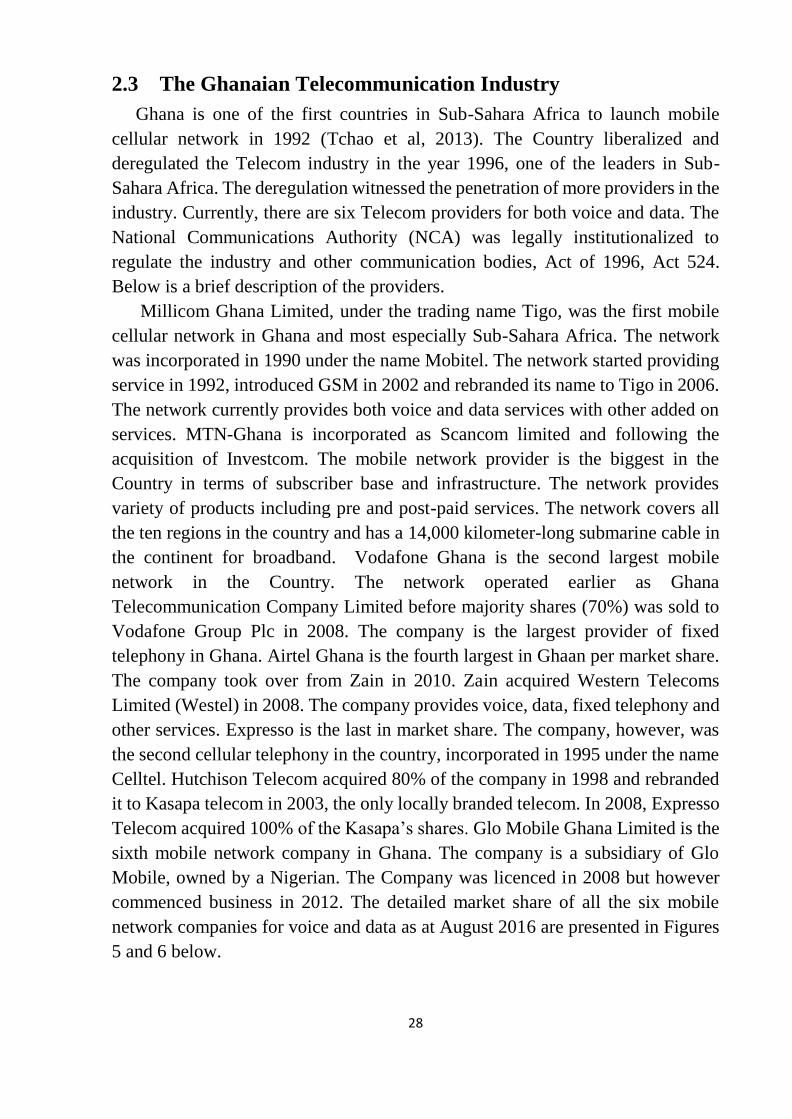
Figure 5: Voice Market share of telecoms (Source: NCA, 2016)
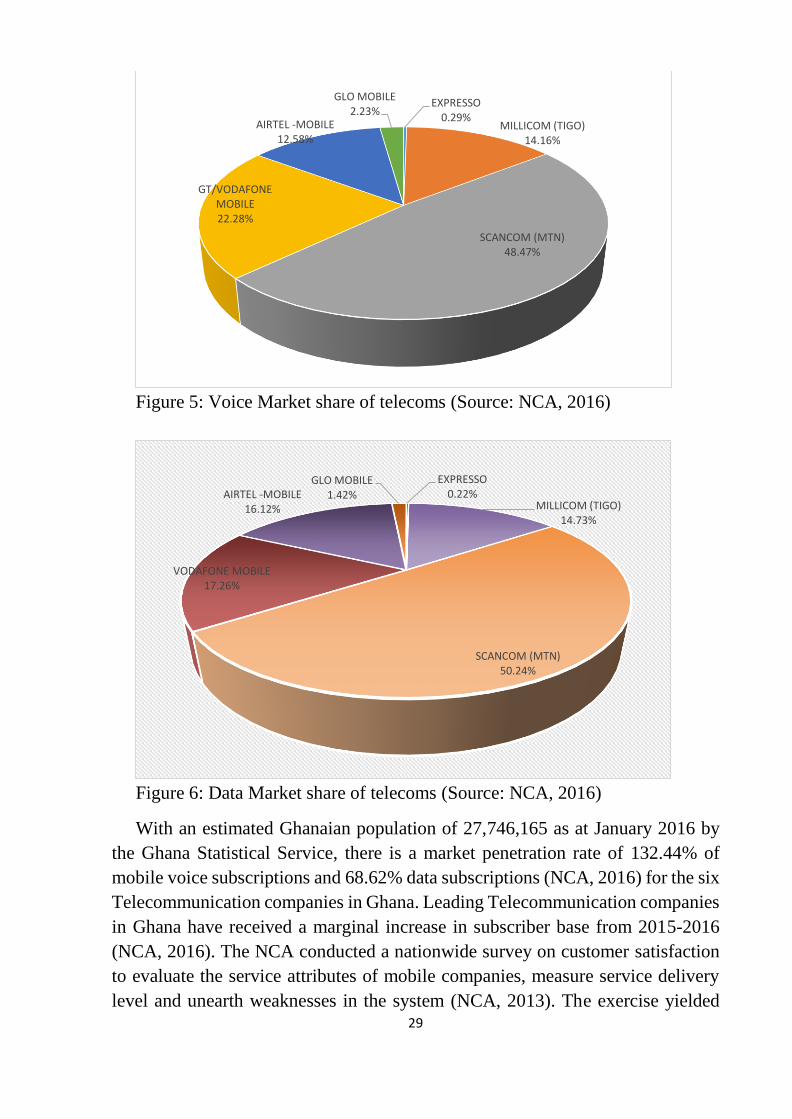
Figure 6: Data Market share of telecoms (Source: NCA, 2016)
With an estimated Ghanaian population of 27,746,165 as at January 2016 by
the Ghana Statistical Service, there is a market penetration rate of 132.44% of
mobile voice subscriptions and 68.62% data subscriptions (NCA, 2016) for the six
Telecommunication companies in Ghana. Leading Telecommunication companies
in Ghana have received a marginal increase in subscriber base from 2015-2016
(NCA, 2016). The NCA conducted a nationwide survey on customer satisfaction
to evaluate the service attributes of mobile companies, measure service delivery
level and unearth weaknesses in the system (NCA, 2013). The exercise yielded
EXPRESSO0.29%
MILLICOM (TIGO)14.16%
SCANCOM (MTN)48.47%
GT/VODAFONE MOBILE22.28%
AIRTEL -MOBILE12.58%
GLO MOBILE2.23%
EXPRESSO0.22%
MILLICOM (TIGO)14.73%
SCANCOM (MTN)50.24%
VODAFONE MOBILE17.26%
AIRTEL -MOBILE16.12%
GLO MOBILE1.42%
Page 30
30
findings which indicate that some customers of certain companies were
dissatisfied, hence churning to other providers. The results further indicated that
although subscriber value has gone up, the leading companies are still bedeviled
with quality, connectivity, service availability (network coverage) and cost issues
(NCA, 2013).
2.4 Predictive analytics in Ghana
Developing countries are still far plunged in the use of traditional statistical
analytic methods for knowledge in the various sectors of the economy. With the
service sector growing rapidly and contributing hugely to Gross Domestic Product
(GDP) (UNCTAD, 2012), together with the massive daily creation of data by
sector players, the use of data mining algorithms to discover knowledge for
decision making and growth is vital (Eckerson, 2007) in developing economies.
Vast volumes and dimensions of data as call details, network, and airtime
purchases are generated daily from various systems of Telecommunication
companies. Predictive analytics in the service sector essentially relies on three
factors: the available data, primary data collected from customers and the business
objectives to be achieved by the data mining algorithm (Madhuri, 2013). Four
main challenges faced by Telecommunication companies according to Pareek
(2006) are Customer service, Commoditization, Competition and Consolidation.
Madhuri (2013) indicated that data on fraud detection and network fault
identification must be processed in real time, which is a challenge faced by
companies in the industry. The desire to address these challenges has placed the
Telecommunication industry in the lead on the research area of Predictive
Analytics (Aggarwal, 2007). Tracking the patterns of customer data is the bone to
CRM practices in business. Analysis of the huge customer data generated by
Telecommunications companies can be done easily by data mining algorithms
rather than traditional statistical methods (Idris et al., 2012).
Telecommunication companies in Ghana are operating in a highly competitive
and challenging market environment. With the introduction of the Mobile Network
Portability (MNP) in 2011 by the NCA due to customer complaints, a number of
voice and data subscribers had the leverage of churning from one subscriber to the
other (Agyekum et al, 2013). According to NCA (2014) report, a cumulative figure
of 1,655,404 porting/churn requests was executed in 2014. The number far exceeds
churn request in sub-Sahara Africa. The net effect ranges between 3% and 6% on
each operator, resulting in a corresponding revenue loss. The largest provider,
MTN, suffered a great deal of loss of customers from 2011-2014. MTN lost
402,244 subscribers, a net loss of 3% while its rivals Vodafone and Tigo gained
Page 31
31
228,183 (3.4%) and 249,725 (6.2%) subscribers respectively over the same period
(Telecoms EN, 2014). Monthly port/churn request ranges between 50,000 to
85,000. The main challenge of providers lies in the inability to predict potential
churn customers, where they are churning to and the reason for the churn.
The concept of identifying new customers as a marketing strategy by Ghanaian
Telecommunication companies is much hectic than the retention of existing ones.
However, it has also become quite a challenge for these companies to identify
potential churn customers to respond to their needs for retention. Modelling
customer life time value is therefore one way to detect, compute customer value
and predict potential customer churn (Mohammadi et al, 2013). Customer
information and call details can be used to establish customer behavior and
categorize the opportunities to support customer base expansion while reducing
churn. Association rules, classification, clustering, sequential patterns and
prediction can be applied in solving the challenges and problems faced by the
Ghanaian Telecommunication companies through the use of surveyed data.
This dissertation carefully looked at direct customer responses to professional
questions used to predict the churn likelihood of customers in the
Telecommunication companies which is a grey area in predictive modelling in
Ghana. Currently, there is no research in terms of scientific paper, industrial paper
or an academic report that has treated the modelling of a predictive model for
customer churn in Ghana. This dissertation is therefore novel in the country. It
used primary data from customers’, collected using questionnaire, which has never
been done by any publication, models and test the model, identifies operators
likely to be beneficiaries of churn customers and the presents the reason behind
the churn. The findings are unequivocally beneficial to industry and other partners.
The dissertation surveys a sample of customers of all the six Telecommunication
companies in Ghana to build a predictive model, train and test (predict) the churn
rate of customers.
Page 32
32
3. OBJECTIVES
This chapter presents the core of the dissertation. It brings out the research
problem identified based on the literature review, the questions that beg for
answers, the objectives carved to answer the questions and hypotheses to help
resolve the research problem. The chapter also presents a novel and detailed
framework that guided the methodology and data analysis.
3.1 Research Problem
The services sector has an enormous potential to induce growth in
developing countries such as Ghana. Over the years, the service sector remains
the largest sector in the Ghanaian economy contributing 50.6% to GDP (Ghana
Statistical Service, 2013). The sector contributed enormously to employment and
government revenue impacting on GDP growth. The Telecommunication
industry produces enormous quantities of data and is bedeviled with a vast array
of imperfect customer information that decision makers need to deal with.
Customers regularly port their mobile numbers from one Telecommunication
provider to the other thereby making the companies lose large amount of
revenue. Ghanaian Telecommunication companies have had a herculean task in
predicting expected churn customers using modern computing statistical tools.
The absence of a simple predictive model for the prediction of potential churn
customers using primary data from customers has been a worry in the sector.
3.2 Research Questions
The under-listed key research questions are addressed:
1 What apprises the loyalty of customers in Telecommunication companies in
Ghana?
2 How does customer churn rate of Telecommunication companies in Ghana
affect the revenues of the companies?
3 Which Telecommunication Company in Ghana has the highest churn rate
and the reasons associated with the phenomenon?
4 How can customers be classified into categories for directed promotional
activities by Telecommunication companies in Ghana?
5 Which product(s) is/are significant in maintaining customers of
Telecommunication companies in Ghana?
6 How can Telecommunication companies in Ghana predict customer churn
rate?
Page 33
33
3.3 Research Objectives
The main objective of the research is to produce a predictive model with better
sensitivity and specificity that assesses customer churn rate of telecommunication
companies in Ghana using the predictive analytics algorithm of data mining. The
supporting objectives explored are to:
1. Cluster customer interest areas that inform customer loyalty
2. Mine the relevant patterns imbedded in collected data that have a huge
influence on the revenues and growth of the Telecommunication companies.
3. Produce a comparative framework that identifies the Telecommunication
Company with the highest churn rate.
4. Classify customers into various categories to enhance marketing and
promotional activities.
5. Rank products/services per the interest and preference of customers.
6. Design a predictive model that predicts customer churn rate for Telecoms
in Ghana with higher accuracy and reliability.
3.4 Research Hypotheses
The under-listed hypotheses are verified:
H1: There is a correlation between the number of years a customer stays
with a telecom provider and customer churn rate in Telecommunication
companies.
H2: Product innovation impacts on churn of customers of Ghanaian
Telecommunication Companies.
H3: The number of networks a customer subscribes to influences churn.
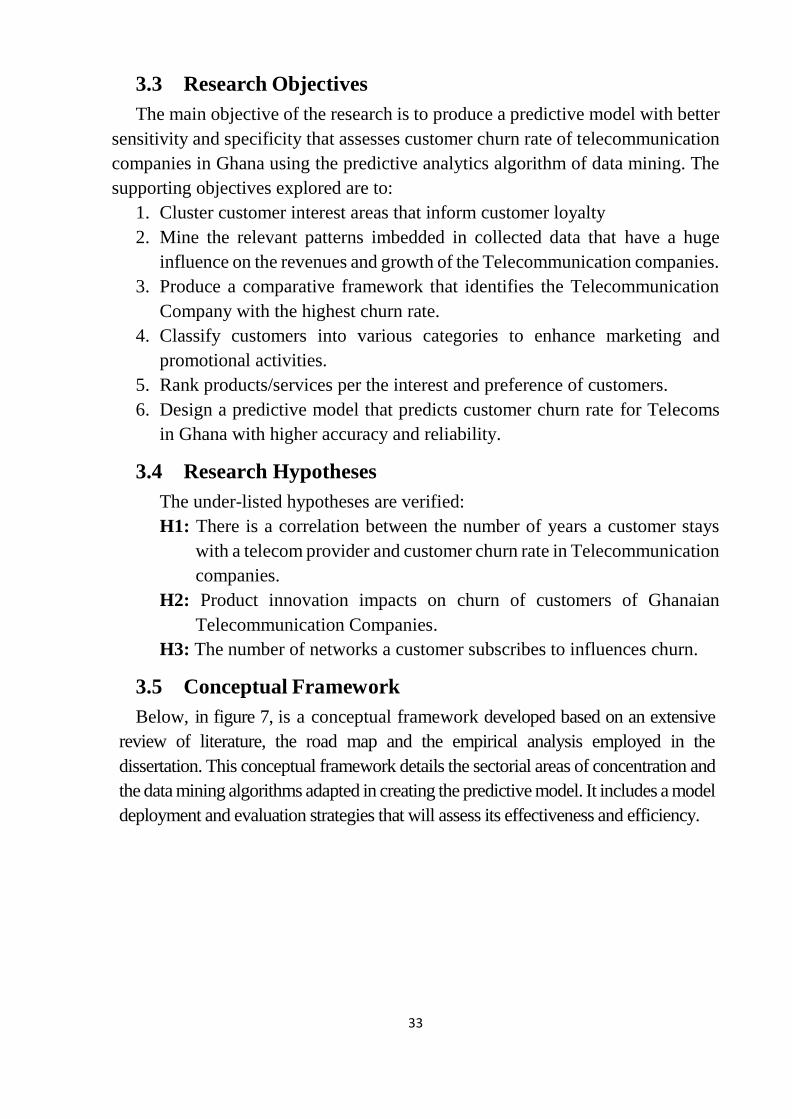
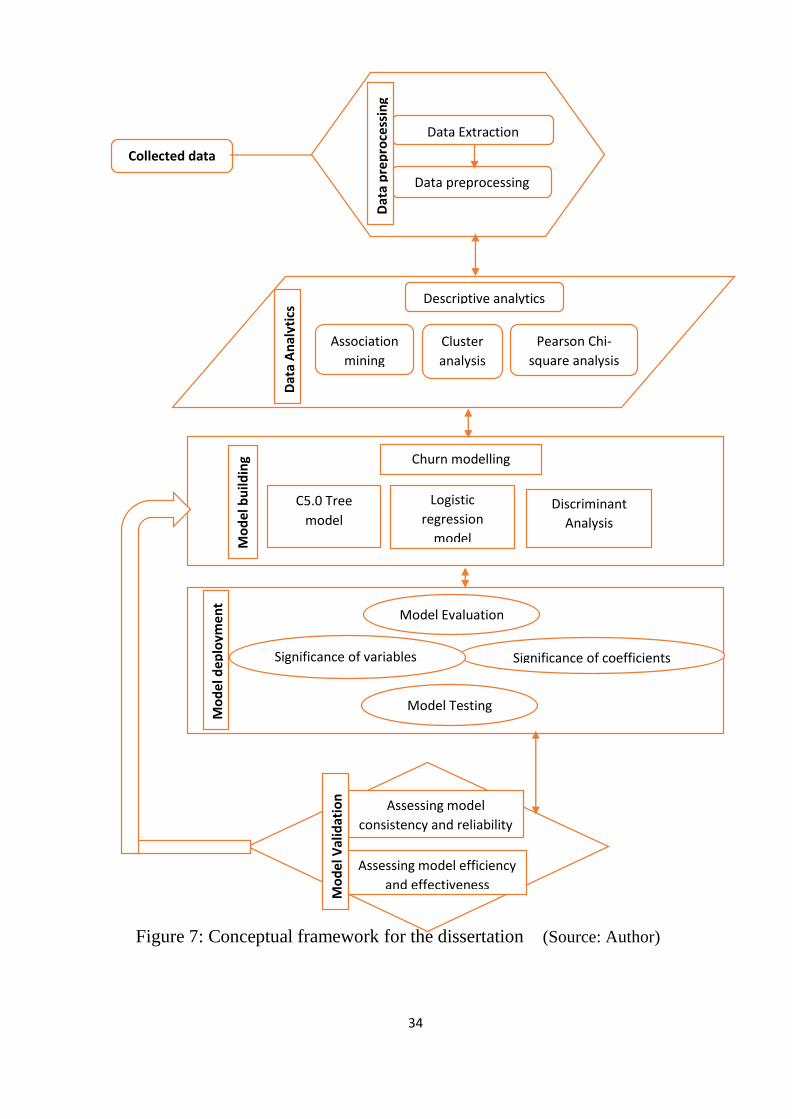
3.5 Conceptual Framework
Below, in figure 7, is a conceptual framework developed based on an extensive
review of literature, the road map and the empirical analysis employed in the
dissertation. This conceptual framework details the sectorial areas of concentration and
the data mining algorithms adapted in creating the predictive model. It includes a model
deployment and evaluation strategies that will assess its effectiveness and efficiency.
Page 34
34
Figure 7: Conceptual framework for the dissertation (Source: Author)
Collected data
Descriptive analytics
Association
mining
Cluster
analysis
Pearson Chi-
square analysis
Dat
a A
nal
ytic
s
Churn modelling
C5.0 Tree
model
Logistic
regression
model
Discriminant
Analysis
Mo
del
bu
ildin
g
Model Testing
Model Evaluation
Significance of coefficients Significance of variables
Mo
del
dep
loym
en
t
Assessing model
consistency and reliability
Assessing model efficiency
and effectiveness
Mo
del
Val
idat
ion
Data Extraction
Data preprocessing
Dat
a p
rep
roce
ssin
g
Page 35
35
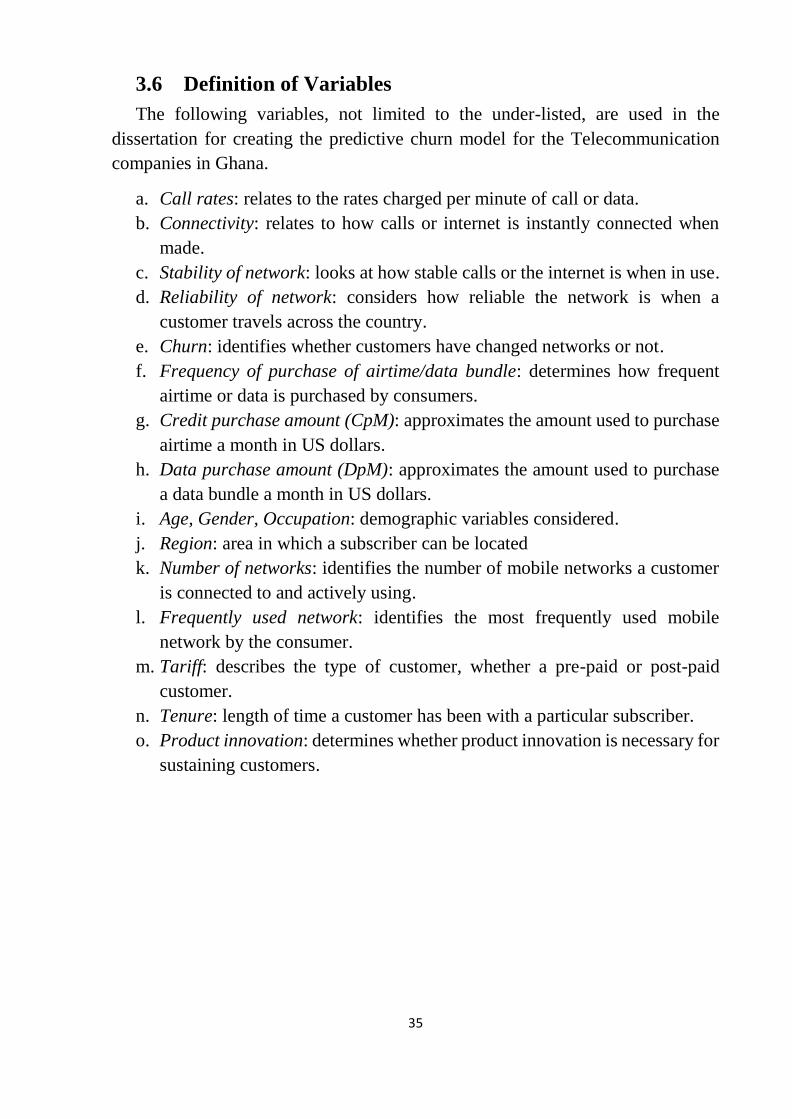
3.6 Definition of Variables
The following variables, not limited to the under-listed, are used in the
dissertation for creating the predictive churn model for the Telecommunication
companies in Ghana.
a. Call rates: relates to the rates charged per minute of call or data.
b. Connectivity: relates to how calls or internet is instantly connected when
made.
c. Stability of network: looks at how stable calls or the internet is when in use.
d. Reliability of network: considers how reliable the network is when a
customer travels across the country.
e. Churn: identifies whether customers have changed networks or not.
f. Frequency of purchase of airtime/data bundle: determines how frequent
airtime or data is purchased by consumers.
g. Credit purchase amount (CpM): approximates the amount used to purchase
airtime a month in US dollars.
h. Data purchase amount (DpM): approximates the amount used to purchase
a data bundle a month in US dollars.
i. Age, Gender, Occupation: demographic variables considered.
j. Region: area in which a subscriber can be located
k. Number of networks: identifies the number of mobile networks a customer
is connected to and actively using.
l. Frequently used network: identifies the most frequently used mobile
network by the consumer.
m. Tariff: describes the type of customer, whether a pre-paid or post-paid
customer.
n. Tenure: length of time a customer has been with a particular subscriber.
o. Product innovation: determines whether product innovation is necessary for
sustaining customers.
Page 36
36
4. SELECTED PROCESSING METHOD
This chapter describes vividly the methodology used for the dissertation. It
clearly presents details on how the research is designed, the population identified
for the work, the sampling method and sample size, the research type, how data is
collected and analyzed, and the tools involved in the collection and analysis of the
data.
4.1 Research design and sampling
4.1.1 Research design
The research was based practically on empirical analysis in line with the
framework outlined in figure 7 above. Questionnaire were formulated out of the
research objectives and hypothesis, and administered to sampled Telecom
customers in Ghana. The responses have been analysed with modern statistical,
data mining software and algorithms as per the framework. The research, to a large
extent, used quantitative approach since data is collected through questionnaire for
creating the predictive churn model and testing of hypotheses. The entire design
of the research (framework) has been explained in details from section 4.3 below.
4.1.2 Population and Sampling method
All the six Telecommunication companies in Ghana are included in the
research. The population for the dissertation is both voice and data users in Ghana
that stands at 132.44% and 68.62% respectively of 27,746,165 total estimated
population of Ghana for 2016 (NCA, 2016). In view of the increase in the number
of people currently on voice and data subscription, simple random and purposive
sampling techniques were employed. The sampling has also been made in such a
way that it is representative and includes all relevant respondents especially
covering all the Telecommunication companies. In using the purposive and
random sampling, all members within the population have equal chances of being
selected. With a population above 1 million, a known margin of error and
probability for selecting respondents, a minimum 384 respondents is anticipated
based on Equation 4.1 below
2
2
. (1 )t p pn
m
(4.1)
where
n is the sample size,
Page 37
37
t is 95% confidence level,
p is the percentage of probability for selecting respondent,
m is the margin of error at + 5% used for two tailed test.
The dissertation sampled one thousand respondents (1,000) across the six
Telecommunication companies in Ghana for creating the predictive customer
churn model and 600 respondents for testing the churn model. Out of the sample
of 1,000 for creating the predictive model, 969 mobile network users across the six
mobile network operators in all the ten (10) regions of Ghana responded to the
questionnaire given a response rate of 96.9%. A response rate of 88.2% was
realized for the testing data. The respondents cut across demographic attributes
which removes the element of bias in the data. The validity and reliability of the
model has been enhanced by the greater response rate received in both cases.
4.1.3 Quantitative Research
Quantitative research method was adopted for this research work. This was
selected because it is a valid method for researching specific subjects and a
precursor to dealing with generalisation, prediction and explanation.
Questionnaire are developed to primarily contain the research questions,
objectives and hypotheses with cognisance to the variables needed for creating the
predictive churn model and responses to other research outlines. Using closed and
open-ended questions, the instruments are designed to obtain relevant information
on the dissertation from the target population sample. Questions spanning
adequacy assessment, appropriateness, excellence, adherence and agreeableness
are asked. Quantitative research presents a number of advantages as it provides a
very multifaceted approach in dealing with the subject matter. Although a
quantitative research method is applied, the open-ended questions give room for
some qualitative data as responses to allow for some level of data triangulation.
4.2 Data collection
Questionnaire was used as the tool to collect the data primarily from customers
of the six Telecommunication companies in Ghana across the ten (10) regions. The
questionnaire targeted both voice and data subscribers made up of domestic and
industrial users. The questionnaires are open and closed ended and in duplicate.
One set was used for the model while the other set was for testing the model.
The Google drive plug-in was used to design the questionnaire. The
questionnaire were administered by forwarding them to the emails of some
respondents and a greater percentage were directly administered in hard copy to
subscribers in Ghana. Preceding the questionnaire design was an interview session
Page 38
38
with relevant people from the respective Telecommunication companies and
responses were fed into the design of the questionnaire.
To ensure the accuracy and appropriateness of the questionnaire, a pre-test was
done on potential respondents. This was very effective since vagueness and
ambiguity of questions was detected and corrected. The pre-test was done on 80
respondents in Ghana.
4.3 Data Analysis, Modelling, Deployment and Evaluation
Data mining and statistical algorithms were used in the data analysis, model
development, model deployment and evaluation of the model in this dissertation.
The details of the analysis and the tools used are described below. The SPSS
Modeler and RapidMiner were analytical tools used in respective analysis and
mining process.
4.3.1 Data preprocessing
It is always evident in every data collected that some anomalies exist ranging
from missing data, repeated data, and inconsistent data. Data scrubbing was one
technique adopted in handling missing data, reducing observations and attributes,
and handling inconsistent data featured in the collected data. The RapidMiner tool
is used at this stage to preprocess the data for analysis and mining.
4.3.2 Data analysis
The data analysis started with a descriptive analysis to ascertain variable
responses and a summary of the data. The exploratory factor analysis was
conducted to ascertain attribute significance to be used in the model formulation.
The Kaiser-Meyer-Olkin (KMO) Measure of Sampling Adequacy and the
Bartlett's Test of Sphericity were applied in the test. The Principal Component
Analysis (PCA) was used to check the suitability of the data. The scree plot
contributed in determining the efficiency of the variances. Using the IBM SPSS
modeler, the multi-relational association rule (MRAR) mining with the FP-Growth
component was conducted to identify interestingness patterns and trends between
variables and item-sets. The confidence, support and lift measures are used in
assessing the effectiveness of the rules (Nabareseh et al., 2014). In the MRAR
mining, let 1 2{ , ,..., }nR r r r represent a set of n attributes, 1 2{ , ,..., }mS u u u and
1 2{v , v ,..., v }mT be a set of S and T outcomes. An MRAR relation may be
Y X Z where , ,X Y Z R and X Y Z . The FP-growth algorithms are
used build the association rule pattern or framework.
Page 39
39
To respond to key research questions and objectives in this research, the K-
means clustering algorithm was used to partition the observations into a number
of clusters (k) using the nearest mean. This method groups observations and
variables into clusters with similar orientation. Hence the interest areas, purpose
of usage of the mobile network, innovations and other parameters had interesting
results in the cluster analysis. The cluster results were evaluated using the Davies-
Bouldin index in equation 4.2.
11
1max
(c , )
ni j
ji i j
DBn d c
(4.2)
where
n is the number of clusters,
cx is the centroid of cluster x,
σx is the mean distance of all elements in cluster x to the centroid,
d(ci,cj) is the distance between the centroids.
The Pearson Chi-square test in equation 4.3 or the Fisher’s exact test in
equation 4.4 with SPSS were used to ascertain the variance of the two categorical
variables. The acceptability or otherwise of the hypothesis was determined by the
criteria stated below.
Based on the number of observations (n) of 961 and a significance level (α) of
95% (0.05), if the test statistic (p) is less than the significance level (α), the null
hypothesis (H0) is refused to be accepted while the alternative hypothesis (Ha) is
accepted.
A more detailed test statistic applied in analyzing the hypotheses is hinged on
the criteria below:
1. If n > 40 → χ2 test ,
(4.3)
2. If n ∈ 20;40 and some frequencies are less than 5, Fisher test is applied
3. If n ∈ 20;40 and all frequencies are less than 5, chi-square test is applied
4. If n ≤ 20 → Fisher test
(4.4)
))()()((
2
2
dccbcaba
bcadnx
!!!!!
!!!!
dcban
dbcadcbapi
Page 40
40
where
x2 is the chi square,
a and d are the observed values,
b and c are the expected values.
A well cleaned and structured data was obtained for building the predictive
churn model using C5.0 tree algorithm, logistic regression and discriminant
analysis.
4.3.3 Model building
Two data mining tools are used in creating the predictive churn model for the
Telecommunication companies in Ghana. The IBM SPSS modeler 18.0 statistical
tool and RapidMiner studio 7.3 software are outstanding tools used by most data
scientist in creating models for predictive analytics. The C5.0 tree algorithm,
logistic regression and discriminant analysis algorithms of data mining were used
to create the model. The Quest-style univariate splitting was first used to split the
data for modelling. The best terminal node was selected with a cut-off value by
the algorithm. The chi-square test was used with p-values computed for
significance test. The smallest p-value of the predictor variable was taken to split
the next node.
The C5.0 tree model was applied to the collected data with the predictor
variable being whether the customer has ported/churned before. The data was
partitioned into small units in nodes and leaves. The nodes and leaves serve as
predictor and variables related to the predicted variable respectively. The IBM
SPSS modeler 18.0 tool was used to create the C5.0 tree churn model.
The next algorithm used in creating the churn model was the logistic regression
algorithm. The variable churn was used as the predictor/label variable with other
explanatory variables identified. Logistic regression is a classification
probabilistic model used to predict the outcome of categorical variable based on
some explanatory variables. The predictor variables, using the logistic function
enables the probabilities to be modeled for application. The Hosmer-Lemeshow
statistic and the Omnibus Tests of Model Coefficients were also used for the
goodness of fit of the logistic model for predicting churn.
The DA was used to create the third predictive churn model. Using the same
predictor variable (churn), the model was created with the same explanatory
variables used in the previous algorithms.
Page 41
41
4.3.4 Model deployment and evaluation
The three models created in the model building stage were compared and
evaluated for deployment. A careful look at the error term in all the models assisted
in the evaluation of the models. Also the p-values of all the models were compared
and the better value selected.
The chosen predictive churn model was tested using the test data collected from
customers. Predictions are then made to indicate which customers are likely to
churn and those that are not. The predictor variable and explanatory variables
(coefficients) used in building the predictive churn model were tested for
significance.
The three models are evaluated by testing the significance of the predictive
model generated. The performance metrics of all the models were compared for
optimal performance using Area Under Receiver Operating Characteristic Curve
(AUROC) test statistic. The variables were equally tested for validity and
reliability. Validity of the model indicates that it measures what it is intended for
while reliability test produces consistent results. The tests assessed the efficiency
and effectiveness of the model in predicting customer churn for
Telecommunication companies in Ghana
4.3.5 Model validation
The model is validated using industry approved processes and statistical tests.
The validation of the model takes into consideration the consistency and reliability
of the results based on the variables used. In addition, the efficiency and
effectiveness of the model in testing the construct is one key area completely
emphasized in the validation process.
Page 42
42
5 MAIN RESULTS
This chapter produces and analyses data from the sampled population in line
with objectives and hypotheses of the dissertation. The chapter deals with
preprocessing of data, data analysis in line with the framework in Figure 7,
creating and testing of the model, the evaluation of the model and text mining as
presented in Figure 8. Two sets of questionnaires were developed as indicated
earlier for training and testing of the churn model. A total of 969 responses were
received from respondents on the questionnaire for the churn model representing
a response rate of 96.9%. The test data produced 88.2% response rate representing
528 respondents out of a sample of 600. The data was collected during the summer
break (June – September) of 2016 after earlier interviews with industry players.
5.1 Data preprocessing
The data is extracted from responses of the questionnaire in responded too in
Google drive. The responses to the manually administered questionnaire were also
captured in Excel and merged with the responses extracted from Google drive. The
preprocessing aims at streamlining the data, removing duplicated data values,
correcting errors in the data, replacing missing values and non-needed values,
cleansing noisy data and streamlining inconsistent data. The data preprocessing is
done in three phases; data exploration, data blending and data cleansing, using the
RapidMiner data mining software. RapidMiner presents the dataset/observations
as ExampleSet, columns as attributes and rows as examples.
Data exploration
Data exploration helps to discover the data by the use of simple descriptive
statistics, charts and graphs. In RapidMiner, a simple statistics table is shown
summarizing the variables, type of data, whether there are missing values statistics
of minimum, maximum and values of the data presented. A summary of both the
training and testing datasets are presented in Figures 8 and 9 for exploration.
Page 43
43
Figure 8: Summarized statistics for training dataset (Source: Author)
From Figure 8 above, it can be observed that, the Age variable has a minimum
age of 5 and a maximum age of 79. The minimum age that was set in the
questionnaire is 16-years since with cognizance to the age of marriage laws in
Ghana. There was no upper limit set for age. It is clear that a 5-year old cannot use
a mobile phone and thus makes the data noisy. It is also seen in Figure 8 some
missing values for Tariff and Tenure which needs to be cleaned. Network contains
one Not Applicable (N/A) observation. Since this dissertation is focused on
customers who are using any of the six networks in Ghana. Dome data
inconsistency was also realized in the summary statistics. It was observed that
respondents who claim not to use any network purchase monthly credit and data
since a N/A response is not seen in those variables.
From Figure 9 below, the testing dataset presents a lower age of 13 in the Age
variable observations. The value is below the set value of 16 as the minimum age
for this dissertation. There are two (2) N/A observations in the network variable
which needs to be filtered out before using the data to test the model. There are
also some inconsistencies in the data since respondents who claim not to use any
of the networks buy data and call credits monthly.
Page 44
44
Figure 9: Summarized statistics for test dataset (Source: Author)
Data blending and cleansing
Data blending is concerned with filtering out attributes that are inconsistent and
not relevant for modelling and other data mining techniques, conversion of data
type to appropriate format for mining techniques and the attribute selection for the
various methods to be used in data analysis and predictive modelling. In this
process, the N/A responses in the network variable for both Training and Testing
dataset are filtered out since the responses are not relevant for this dissertation.
Filtering was also done for the age variable to eliminate the lower age categories
that are not needed for modelling and other mining techniques. The filter examples
operator is adapted in the filtering process while the replace missing values
operator is used to replace cleanse the missing values in Figure 8 above. Other
outliers and the inconsistent values are also removed in the data cleansing
preprocessing stage. The processed data is presented in Figures 10 and 11 below
for the training and testing data respectively. After the data cleaning, 961
observations were left in the training data set while the testing data set had 522
observations.
Page 45
45
Figure 10: Processed statistics for training dataset (Source: Author)
Figure 11: Processed statistics for test dataset (Source: Author)
Coding of dataset
The alternatives for both training and testing dataset are coded to be used in
specific analyses. In doing cluster analysis, Pearson chi-square, logistic regression
and linear discriminant analysis, the data type needed is numerical. The variables
and respective alternatives are coded and presented in Table 3. The coding is used
Page 46
46
in techniques that accept only numerical data and interpreted in line with the values
of the coding in Table 3.
Table 3: Codes for alternatives (Source: Author)
Variable Alternative Code
Gender
Female 0
Male 1
Occupation
Student 1
Self-employed 2
Public sector 3
Private sector 4
Unemployed 5
National service personnel 6
Education
Basic School 1
High School certificate 2
Bachelor's degree 3
Master's degree 4
Doctoral degree 5
Higher National Diploma 6
Region
Greater Accra 101
Ashanti 102
Volta 103
Northern 104
Upper East 105
Western 106
Central 107
Upper West 108
Brong Ahafo 109
Eastern 110
Networks
MTN 1
Vodafone 2
Tigo 3
Airtel 4
Kasapa 5
Glo 6
Page 47
47
Table 3 continues
Variable Alternative Code
Tenure
Less than a year 1
1-3 2 4-6 3
7-9 4 Above 10 5
Churn
No 0
Yes 1
Reason for churn
Call tariffs 11
Network problems 12 Data tariffs 13
Bad connectivity 14 Product/service issues 15
Freebies 16
Reason for not churn
Good products 1 Low call rates 2
Good data plan 3
Good connectivity 4 Because of contacts 5
Networks are same 6
Product Innovation
No 0 Yes 1
Not sure 2
Tariff
Pre-paid 1
Post-paid 2 Both 3
5.2 Data analytics
This section presents results of analysis used to develop and evaluate variables
that are adapted in the model construction. The exploratory factor analysis was
also used to reduce the large number of related variables to a more efficient number
to avoid redundancy. The section further presents descriptive statistics of
summarized data of relevant variables requisite for the model construction. In
addition, cluster analysis, association rule mining and Pearson chi-square analysis
for the evaluation of hypothesis was also undertaken in this section.
5.2.1 Summary and descriptive statistics
As indicated in the previous subsection, the total number of 961 observations
of the training data set was used to build the model. The percentage (%) column is
calculated based on the 961 responses for all the variables except network churned,
network churned to, reason for churn and reason not churned which are calculated
based on the appropriate churn decision. This subsection presents analyses of
summary and descriptive statistics based on the training dataset. The phi and
Page 48
48
Cramer’s V test was also presented to test the strength of relationship between
chosen variables in response to some objectives.
Based on Table 4, 60 percent of the respondents were male while 40 percent
were female. Majority of the respondents are public sector workers followed by
students. A greater number have a bachelor’s degree and located in the Greater
Accra region. A colossal number of respondents (78.1 percent) use more than one
network in Ghana due to connectivity problems, comparable call/data rates, quality
of calls, non-availability of coverage in some parts of the country and freebies
from telecommunication companies. However, as indicated in NCA (2016), more
respondents (46.2 percent) use MTN in line with its majority share in the telecom
market in Ghana. Vodafone Ghana follows with the second highest respondents of
27.4 percent.
Table 4: Summary statistics (Source: Author)
Variables and alternatives Percentage (%)
Gender Female 39.8
Male 60.2
Occupation National service personnel 2.8
Private sector 19.5
Public sector 35.4
Self-employed 12.3
Student 22.0
Unemployed 8.1
Education Bachelor's degree 49.2
Basic School 9.2
Doctoral degree 3.2
High School certificate 23.7
Higher National Diploma 4.9
Master's degree 9.8
Region Ashanti 6.9
Brong Ahafo 7.9
Central 7.5
Eastern 12.6
Greater Accra 41.6
Northern 9.4
Upper East 4.4
Upper West 7.5
Volta 0.2
Western 2.1
Number of networks 1 21.9
2 49.6
3 22.5
4 5.5
5 0.5
Page 49
49
Table 4 continues Network often used Airtel 14.6
Glo 0.4
Kasapa 1.6
MTN 46.2
Tigo 9.9
Vodafone 27.4
Churn No 54.3
Yes 45.7
Network churned Airtel 9.9
Glo 2.1
MTN 23.6
Tigo 6.3
Vodafone 3.9
Network churned to Airtel 10.1
Glo 2.1
Kasapa 0.9
MTN 9.4
Tigo 12.5
Vodafone 10.8
Reason for churn Bad connectivity 10.4
Call tariffs 11.0
Data tariffs 6.8
Freebies 4.7
Network problems 8.8
Product/service issues 4.1
Reason not churned Because of contacts 2.9
Good connectivity 22.1
Good data plan 9.9
Good products 13.4
Low call rates 4.6
Networks are same 1.4
Mobile phone use Personal and business calls 43.6
Browsing 20.3
Business calls 1.0
Personal calls 27.6
Personal calls and Browsing 6.3
Personal, Business calls and Browsing 1.1
Product innovation No 4.1
Yes 83.4
Not sure 12.6
Tariff Both 1.5
Post-paid 11.6
Pre-paid 87.0
Out of the total number of respondents of the training dataset, 46 percent
indicated that they have ever churned from one Telecom Company to the other.
This number makes almost half of the total number of respondents. A greater
number of these churned customers (23.6 percent) moved from MTN to other
Page 50
50
networks. In response to objective 3, it is seen from Table 4 that MTN holds the
largest number of churn customers. This discovery falls in line with the findings
of Telecoms EN (2014), where MTN was the highest loser of customers due to
churn from 2011-2014. The network gained only 9.4 percent of customers due to
churn from the analyzed data in Table 4. However, the other networks gained more
customers than those lost. In line with the assessment by Telecoms EN (2014),
Tigo, Vodafone and Airtel were the highest gainers of churned customers by 12.5
percent, 10.8 percent and 10.1 percent respectively. In line with the analysis and
based on the findings of previous articles, and in response to objective 2, the loss
of customers affects revenue and are more expensive than the acquisition of new
customers. MTN in this case loses more revenue due to the huge numbers of
customers’ loss monthly due to churn. It must be clearly indicated that the quantum
amount gained or lost is dependent of the amount purchased by the churn
customers. Customers yield to the factor of churn because of connectivity,
call/data tariffs, quality & reliability of network and the introduction of customer
required products & services into the market. Hence to retain customers, as in
objective 5, Telecom companies in Ghana must pay close attention to the above.
As was indicated by NCA (2013) in their customer satisfaction survey, top
Telecom companies are still joggling with these issues in their bid to satisfy
customers.
In response to objective 1 in testing for the condition that apprises the loyalty
of customers to a telecom company, the decision to churn with the reason behind
it was considered. In Tables 5 and 6, cross tabulations of churn and reason indicate
that customers remain loyal to a telecom company when network connectivity is
good and low call tariffs. When Telecom companies invest in customer friendly
products and services, customers will remain loyal or churn to appropriate rival
companies. To test the depth of association between the variables used to ascertain
the loyalty of customers, the Phi & Cramer’s V test was used. The Cramer’s V is
interpreted in both tables since the variables used in each case are nominal by
nominal. The strength of relation is measured with a 0 – 1 value criteria where 0
indicates a no relation and 1 indicates a perfect relation.
Page 51
51
Table 5: Measurement of association of churn and reason for churn (Source:
Author)
Reason for churn
Total
Bad
connectivit
y
Call
tariffs
Data
tariffs Freebies N/A
Network
problems
Product/ser
vice issues
Churn no 18 42 15 13 408 22 4 522
yes 82 64 50 32 113 63 35 439
Total 100 106 65 45 521 85 39 961
Symmetric Measures
Value
Approx.
Sig.
Nominal by Nominal Phi .539 .000
Cramer's V .539 .000
N of Valid Cases 961
In Table 5, the symmetric measures produced a Cramer’s V of 0.539 indicating
a strong relation between the variables in testing loyalty. The test also produced a
very significant result (p –value = 0.00) to indicate that there is an association
between a customer who churns and the reason for that churn. In the same vain,
Table 6 produces symmetric measures of Cramer’s V of a very strong association
(0.563) between a customer who does not churn and the reason behind it. With a
p-value of 0.000, a relation exists between and customer who does not churn and
the reason for that.
Table 6: Measurement of association of churn and reason not churned (Source:
Author)
Reason not churned
Total
Because of
contacts
Good
connectivity
Good
data
plan
Good
products
Low
call
rates N/A
Networks
are same
Churn no 28 169 69 104 38 114 0 522
yes 0 43 26 25 6 326 13 439
Total 28 212 95 129 44 440 13 961
Symmetric Measures
Value Approx. Sig.
Nominal by Nominal Phi .563 .000
Cramer's V .563 .000
N of Valid Cases 961
Page 52
52
Ranking of networks per product
Respondents were also tasked to rank Telecom networks in terms of the key
determinants of churn identified in the loyalty analogy. Some of the parameters
analyzed are connectivity, stability of network, reliability of network, network
quality, customer care and preference chart of products and services offered by the
providers. Respondents chose a scale of 0 – 5 in ranking the providers, with 0
signifying “not sure”, 1 as the highest rank and 5 as the lowest rank.
For connectivity, Table 7 indicates that Vodafone Ghana is the highest rank.
MTN Ghana is the second highest while Kasapa is ranked the least in terms of
connectivity. Connectivity is one of the key issues that determine whether a
customer will churn or not. Connectivity deals with both voice and internet for
wireless services provided by Telecom companies. Access to services provided by
Telecom companies especially voice and internet are key for development and
growth of an economy (Matthee et al, 2007). It could be observed from Table 7
that quite a number of respondents are not sure of the connectivity status of the
providers. This could be as a result of the fact that providers have inadequately
marketed the services where word-of-mouth appraisal from users is absent.
Table 7: Connectivity (Source: Author)
Network
Rank
0 1 2 3 4 5
MTN 127 259 197 188 76 44
VODAFONE 185 305 187 140 72 72
TIGO 327 97 166 227 78 66
AIRTEL 383 181 141 166 146 14
KASAPA 691 51 56 24 44 95
GLO 611 72 54 77 69 78
The stability of every network is key in the quest to attract and retain
customers. Telecom companies who desire to prevent churn of already existing
customers must invest uniquely in the stability of their networks whether voice or
internet. The constant fluctuation and breaks in calls and internet access of wireless
networks places such a network at a declining rate of customers through churn
(Dargie and Schill, 2011). Respondents ranked Tigo Telecommunication
Company as the highest in network stability for both voice and internet as seen in
Figure 12. In line with the assertion of Dargie and Schill (2011), the high ranked
stability of Tigo attracted churn customers as seen in Table 4 above. Vodafone
follows in line as the second highest ranked in network stability and attraction of
churned customers while MTN has a dip in stability of network.
Page 53
53
Figure 12: Ranking network stability, quality and reliability (Source: Author)
For quality and reliability of calls and internet, the highest ranked in respective
terms are Vodafone and MTN as observed in Figure 12. The highest combined
performance in terms of speed, stability, quality and reliability for calls, data and
text messages is Vodafone Ghana per the views of respondents as indicated in
Figure 12.
The manner in which staff associate with their clients has a momentous impact
on the will to stay or leave a Telecom Company. Good customer service enhances
customer loyalty. Customer satisfaction and loyalty is predisposed by the manner
in which providers relate with their clients in addressing concerns (Han and Ryu,
2009). Creating and maintaining loyalty of customers emanate partially from
customer service to reduce marketing cost and enhance customer loyalty. From
Figure 13, respondents indicated that Vodafone Ghana has the highest rank in
customer services. The gain of churn customers and the lower churn customers of
Vodafone may not be any accident but partially contributed by good customer
service. For good customer services, Telecom companies must be prepared with
the relevant information customers seek, value the time of customers, be pleasant
to customers and always relate the truth to customers (Santouridis and Trivellas,
2010).
0
50
100
150
200
250
300
350
MTN VODAFONE TIGO AIRTEL KASAPA GLOTota
l ran
k b
y re
spo
nd
ents
Telecom companies
Ranking of products
Network stability Network Quality Network reliability
Page 54
54
Figure 13: Quality of customer service of Telecom Companies (Source: Author)
With a list of products and services, respondents were tasked to rank the
products and services according to preference. The range given was 1 for low
preference and 5 for very high preference. The preference of products and services
contributes greatly to the decision of a customer to churn or not (Sirgy, 2015). As
seen in Figure 14, the products that significantly contribute in maintaining
customers were ranked by respondents. Data bundle cost is ranked top in line of
products, followed by roaming charges, cost of voice calls, broadband charges in
that order. In furtherance to the response to objective 5, Telecom companies in
Ghana must respond positively to the preference order factored by respondents to
win their loyalty for churn deterrence.
Figure 14: Preference chart for products and services (Source: Author)
Exploratory Factor Analysis
Exploratory Factor Analysis (EFA) is a data reduction method explored by
social scientist to determine variables of strong inter-correlations to be applied in
further analysis (Koval et al, 2016). The use of EFA reduces redundancy of
0
50
100
150
200
250
300
350
M T N V O D A F O N E T I G O A I R T E L K A S A P A G L O
Tota
l ran
ks b
y re
spo
nd
en
ts
Telecom companies
CUSTOMER SERVICE QUALITY
0
100
200
300
400
500Voice calls
Data bundles
Mobile money
RoamingBackup
Broadband
Promotions
Page 55
55
variables by extracting relevant variables in factor loadings for the purpose of this
dissertation. Factor analysis theorizes concepts that underline preliminary
investigations to either validate or otherwise the findings of those analysis
(Osborne and Costello, 2009). The Principal Component Analysis (PCA) is mostly
adopted by analyst to reduce data to preferable size calculated by the use of
variance included in the patent variables.
The dissertation employed the EFA to analyze variables with strong
correlations, eigenvalues and factor loadings for creating the churn model and
cluster components. The influence of demographic variables in churn decision is
clearly revealed since the construct emphasizes the influencers. In using the EFA,
the suitability of the data is first evaluated with criteria allowed in social sciences.
In the criteria, variables in the correlation matrix must have a correlation more than
0.30, a Kaiser-Meyer-Olkin (KMO) measure of 0.6 or higher, a Bartlett’s test
P<0.50 and no multicollinearity of variables. The initial criteria is ascertained
before the factor extraction and analysis is carried out.
Based on the initial analysis to ascertain the suitability of the data for factor
analysis, the correlations of variables yielded values above 0.30 with no
multicollinearity observed as indicated in the correlation matrix in Table 8.
Further, a KMO measure produced a value of 0.677, above the 0.60 criteria limit,
signifying the appropriateness of the data for factor analysis. The Bartlett’s test of
sphericity is also significant at P<0.05 as seen in Table 9. With the initial criteria
met for factor extraction, the PCA method of factor extraction was then applied
based on Eigenvalues greater than 1, a scree plot extraction, a maximum iteration
for convergence and a varimax factor rotation with Kaiser Normalization.
Table 8: Correlation Matrix (Source: Author) Gender Age *Occ’n Region Churn CpM ($) DpM ($) Tariff Edu Tenure
Correlation Gender 1.000
Age .324 1.000
*Occ’n .000 .000 1.000
Region .000 .428 .000 1.000
Churn .423 .304 .000 .000 1.000
CpM ($) .071 .201 .179 .323 .176 1.000
DpM ($) .080 .406 .132 .162 .242 .176 1.000
Tariff .001 .421 .000 .456 .336 .027 .468 1.000
Edu .014 .000 .000 .000 .015 .072 .366 .265 1.000
Tenure .057 .023 .000 .175 .000 .194 .467 .223 .000 1.000
*Occu’n = Occupation
Page 56
56
Table 9: KMO and Bartlett's Test (Source: Author)
Kaiser-Meyer-Olkin Measure of Sampling Adequacy. .677
Bartlett's Test of Sphericity Approx. Chi-Square 882.960
df 45
Sig. .000
The PCA used varimax orthogonal rotation technique to test the dimensionality
of the constructs of the dissertation. The factors were extracted based on a criterion
of eigenvalues greater than 1. The communalities extracts in Table 10 produced
communalities of values greater than 0.5 from nine variables out of the ten. As the
rule of thumb, communalities must be at least 0.5 of constructs variability.
Variable communality represents the variance of a variable explained by the sum
of the squared factor loadings (Park and Gretzel, 2010). Although the communality
extract for Education is below 50 percent, the analysis of the total variance
explained is carried on since it will not be significantly affected. In general, the
communalities in addition to other factor results confirm consistency and
unidimensionality of the variables.
Table 10: Communalities (Source: Author)
Initial Extraction
Gender 1.000 .508
Age 1.000 .616
Occupation 1.000 .510
Region 1.000 .507
Churn 1.000 .643
CpM ($) 1.000 .804
DpM ($) 1.000 .824
Tarrif 1.000 .553
Education 1.000 .450
Tenure 1.000 .601
Extraction Method: Principal Component Analysis.
The total variance explained extractions in Table 11 produced four components
with eigenvalues greater than 1.00. The components of the initial eigenvalues
extracted produced a cumulative percentage of 56.17. The non-extracted
components produced significant total variance of more than 0.5, could be
included in the model building process. The Monte Carlo PCA software was also
applied for confirmation of the components generated.
Page 57
57
Table 11: Total Variance Explained (Source: Author)
Component
Initial Eigenvalues
Extraction Sums of
Squared Loadings
Rotation Sums of Squared
Loadings
Total
% of
Variance
Cumulativ
e % Total
% of
Varian
ce
Cumulat
ive % Total
% of
Variance
Cumulati
ve %
Gender 2.268 22.682 22.682 2.268 22.682 22.682 1.826 18.265 18.265
Age 1.276 12.759 35.441 1.276 12.759 35.441 1.694 16.939 35.203
Occupation 1.071 10.709 46.150 1.071 10.709 46.150 1.063 10.627 45.831
Region 1.002 10.016 56.166 1.002 10.016 56.166 1.033 10.335 56.166
Churn .907 9.074 65.240
CpM ($) .886 8.862 74.101
DpM ($) .800 8.001 82.102
Tariff .757 7.572 89.674
Education .566 5.662 95.336
Tenure .466 4.664 100.000
Extraction Method: Principal Component Analysis.
The eigenvalues are graphically indicated in the scree plot in Figure 15. The
scree plot graphically represents the Kaiser-criterion of eigenvalues greater than 1
at the flattening (elbow criterion) of the graph. The optimal values of four factors
are indicated in the graph, however, it can be argued for eight factor solutions since
the elbow criterion jumps significantly at this explained variance.
Figure 15: Scree plot (Source: Author)
The rotated component matrix in Table 12 extracted by the PCA method and
Varimax with Kaiser Normalization rotation method indicating the correlation
coefficient among variables and factors. By rule of thumb, the factor loadings
should be greater than 0.4. In component 1, Age, Education and Tenure are all
Page 58
58
scored high in the rotated matrix. Other detail scores are indicated in Table 12.
Apart from Tariff and Education, all other variables are scored high and fit to be
included in developing the models.
Table 12: Rotated Component Matrixa (Source: Author)
Component
1 2 3 4
Gender .535
Age .742
Occupation -.682
Region .560
Churn .554
CpM ($) .878
DpM ($) .905
Tarrif -.492 -.444
Education .658
Tenure .766
Extraction Method: Principal Component Analysis.
Rotation Method: Varimax with Kaiser Normalization.
a. Rotation converged in 6 iterations.
5.2.2 Hypothesis testing
Three hypotheses are sighted in subsection 3.4 to be tested. The Pearson chi-
square test or the Fisher’s exact test was applied in the evaluation of the hypothesis
depending on the criteria indicated in subsection 4.3.2 above and applying
equations 4.3 or 4.4 respectively.
Hypothesis 1
The general hypothetical test was to evaluate whether there is a correlation
between the number of years a customer stays with a telecom provider and
customer churn in Telecommunication companies. The null and alternative
hypothesis are stated as:
H0: There is no relationship between the duration a customer stays with a
Telecom provider and customer churn
Ha: There is a relationship between the duration a customer stays with a
Telecom provider and customer churn
Test results in Table 13 indicate that the asymptotic significance value (P-
value), 0.982, of the Pearson chi-square (since it satisfies criteria 3 in subsection
4.3.2) is greater than the significance level (α = 0.05). The null hypothesis is
refused to be rejected, hence conclude that the duration a customer stays with a
Telecom provider does not determine whether the customer will churn or not.
Page 59
59
Table 13: Association between Churn and Tenure of customers (Source: Author)
Tenure
Total 1-3 4-6 7-9 Above 10
Less than a
year
Churn no 119 154 90 109 50 522
yes 93 131 76 96 43 439
Total 212 285 166 205 93 961
Chi-Square Tests
Value df
Asymp. Sig.
(2-sided)
Exact Sig.
(2-sided)
Pearson Chi-Square .411a 4 .982 .982
Likelihood Ratio .412 4 .981 .982
Fisher's Exact Test .425 .982
N of Valid Cases 961
a. 0 cells (0.0%) have expected count less than 5. The minimum expected count is 42.48.
Hypothesis 2
The second hypothesis aimed at evaluating whether product innovation impacts
on churn of customers of Telecommunication Companies in Ghana. Based on the
designed null and alternative hypothesis below, the test results in Table 14 are
evaluated.
H0: Product innovation by Telecom companies does not have an impact on
the decision of churn by customers.
Ha: Product innovation by Telecom companies has an impact on the decision
of churn by customers.
Table 14: Relationship between Churn and product innovation (Source: Author)
Product innovation
Total No Not sure Yes
Churn no 27 77 418 522
yes 12 44 383 439
Total 39 121 801 961
Chi-Square Tests
Value df
Asymp. Sig. (2-
sided)
Exact Sig. (2-
sided)
Pearson Chi-Square 9.199a 2 .010 .009
Likelihood Ratio 9.388 2 .009 .009
Fisher's Exact Test 9.192 .009
N of Valid Cases 961
a. 0 cells (0.0%) have expected count less than 5. The minimum expected count
is 17.82.
Page 60
60
With all frequencies less than 5, the Pearson chi-square was used to evaluate
the hypothesis. The P-value of Chi-square (0.010) is less than the significance
level, α. The null hypothesis is therefore refused to be accepted. The conclusion
elicited from the data is that product innovation by Telecom companies has an
impact on churn of customers. This conclusion ties in with initial findings in the
summary and descriptive statistics in subsection 5.2.1.
Hypothesis 3
The third hypothesis finds out whether the use of more networks influences the
decision of churn of customers. With majority of respondents using more than one
network in Ghana per the results, churn can either be influenced or not. To
ascertain that, the following null and alternative hypothesis are investigated.
H0: The number of networks a customer uses is not closely associated with
a customer’s decision to churn.
Ha: The number of networks a customer uses is closely associated with a
customer’s decision to churn.
In line with criteria 2 of subsection 4.3.2, some of the frequencies in the result
in Table 15 are less than 5, the Fisher’s exact test was therefore employed in
evaluating the hypothesis. The test statistic, P, is less than the significance level of
0.05. The alternative hypothesis is therefore accepted that the use of more
networks influences the churn decision of a customer.
Table 15: Influence of number of networks on Churn (Source: Author)
Number of networks
Total 1 2 3 4 5
Churn no 113 270 99 35 5 522
yes 97 207 117 18 0 439
Total 210 477 216 53 5 961
Chi-Square Tests
Value df
Asymp.
Sig. (2-
sided)
Exact Sig.
(2-sided)
Pearson Chi-Square 14.432a 4 .006 .005
Likelihood Ratio 16.371 4 .003 .003
Fisher's Exact Test 14.225 .005
N of Valid Cases 961
a. 2 cells (20.0%) have expected count less than 5. The minimum
expected count is 2.28.
Page 61
61
5.2.3 Cluster analysis
According to Anderberg (2014), cluster analysis is used to discover groups with
identical features in a dataset. These groups contain in-depth meanings that are
interrelated by characteristics. Clustering unveils these interestingness
relationships existing in the unstructured dataset to elicit meaningful analysis.
Mined clusters may either be useful or meaningful (Nabareseh et al, 2014) with
reference to the goal of the data analysis. The clusters are meaningful if applied in
real life situations and useful when adapted as a precursor to further analytics or
predictive modelling (Nabareseh et al, 2014). In this dissertation, the clusters are
both meaningful and useful since they inform a real life analogy of customers’
intentions and interest in Telecom companies, and equally serve as a variable
selection method for creating a churn model for Telecom companies in Ghana.
In this dissertation, the k-means clustering was adapted to decipher the data
into the respective clusters. K-means groups item-sets of similarities in meaning
using natural grouping to elicit the interrelations in variables to propel the decision
of churn in the six Telecom companies in Ghana. The k number in the K-means
clustering is a priori chosen with a given dataset. The k largely depends on the
dataset and the level of evaluation results sought by the data analyst. The k can
however be chosen by the ‘elbow method’, the information criterion approach, the
information theoretic approach or the silhouette method. The silhouette method
was employed in choosing the number of clusters (k) for this dissertation. As
indicated in Figure16 in the cluster analysis model, the chosen k was four (4). In
developing and producing clusters for analysis and detection of congruent
variables for use in creating the predictive model, a cluster model was designed
with RapidMiner studio 7.3 as presented in Figure 16. The model produced four
clusters by doing a comparison of attribute values with means of observations of
other attributes.
Page 62
62
Figure 16: Cluster analysis model (Source: Author)
The cluster model produced four clusters out of the 961 training observations
used. The respective cluster summaries are presented in Table 16. Cluster 3
produced 358 items representing the highest observations in the clusters. Cluster
1 has 318 items, cluster 2 with 163 while cluster 0 has 122 items in the cluster
model produced. The produced and analysed cluster responds to objective 4 and
objective 1 of the dissertation for directed and promotional activities of
Telecommunication companies in Ghana. The results in Table 16 presented in
means are analysed by rounding the values in line with the codes presented in
Table 3 for all the variables.
In Cluster 0, Males (0.600) aged above 50 years who are employed as public
servants (3.254) and located in the Greater Accra region have ever churned from
one network to the other. In this cluster, customers ported from MTN to Vodafone
because of high data tariffs. These customers have stayed with their previous
network for 7-9 years before porting. It lines up with the factor analysis discovery
that the number of years a customer stays with a network provider does not signify
a decision to churn or not.
Page 63
63
Table 16: Cluster centroid table (Source: Author)
Attribute Cluster 0 Cluster 1 Cluster 2 Cluster 3
Gender 0.600 0.638 0.277 0.626
Age 51.549 29.261 46.018 27.159
Occupation 3.254 0.947 3.621 1.684
Region 100.721 101.994 104.190 105.196
Churn 1.000 1.000 0.000 0.000
CpM ($) 17.164 10.320 12.107 3.206
DpM ($) 9.657 4.797 3.999 2.902
Tarrif 1.164 1.101 1.166 1.168
Education 2.713 2.943 3.712 2.980
Tenure 3.689 3.881 2.086 4.687
Network ported 1.352 2.192 88.000 88.000
Network ported to 1.680 2.736 88.000 88.000
Reason for churn 13.164 11.987 88.000 88.000
Reason not churned 88.000 88.000 2.840 3.870
Cluster 1 presents another interesting result worthy of concentration by the
industry rivals. In this cluster as well, Males who are students and located in the
Ashanti region have a high tendency of churning. Such churning customers moved
from Vodafone to Tigo for network and connectivity associated problems. It must
be noted that, connectivity and network challenges exist more in cities, towns and
villages outside the capital cities (NCA, 2013).
In Cluster 2, customers have stayed with their network for 4-6 years and have
not churned. These customers are privately employed over 45 year’s old females
and hold a Master’s degree certificate. These customers’ have not or will not churn
because they have a good data plan and cost. These customers purchase less
amount of data per month compared to the other clusters. Although the amount of
data purchased is dependent on the use of the data and may not be a valid reason
to determine churn, it informs providers the revenue that is not lost from their
customers. Customers are located in the Northern Region and have a good network
connectivity.
Cluster 3 is also composed of male customers who have not churned. In this
cluster are self-employed customers’ located in the Upper East region of Ghana,
hold a Bachelor’s degree and have stayed with their network provider for over 10
years. The cluster illustration is presented in Figure 17 below.
Page 64
64
Figure 17: Cluster chart (Source: Author)
In response to objective 4, Telecom providers can leverage this cluster model
to classify customers’ for directed promotional activities. It is observed in the
clusters that the churners are mostly students and public sector workers who are
generally males. These churners mostly reside in Greater Accra and Ashanti
regions and spend a lot in credit and data per month. Telecom providers, especially
those who have suffered churn of customers in this cluster must carefully pay
attention to the reason for churn as presented by these customers. Clusters 0 and 1
will therefore need more attention by providers to prevent churn since retention of
customers is less expensive than acquisition of new customers.
Clusters’ 2 and 3 equally present interesting findings where customers have
never or do not intend to churn. The reasons alluded to the churn of customers or
not corroborate the reasons elicited from the descriptive analytics section in
response to objective 1 using the Phi & Cramer’s test. Providers need to carefully
examine data cost, connectivity and network availability. Interestingly, none of the
clusters produced call rates as a reason for churn or not. In the use of the cluster
model presented, k can be expanded depending on the size of the data and goal of
the data analyst or Telecom provider.
As indicated in subsection 4.3.2, the Davies Bouldin index stated in Equation
4.2 was used to evaluate the potency of the clusters generated. The Davies Bouldin
Page 65
65
Index (DBI) is illustrated in Figure 18 and presents results of average performance
vectors of centroid distances for all clusters. Davies Bouldin Index is an evaluation
mechanism used to validate the veracity of the clusters produced by applying
quantities and features within the dataset. The test produced average within
centroid distance of 122.882, average within centroid distance of cluster 0, cluster
1, cluster 2, and cluster 3 as 163.872, 108.700, 68.202 and 68.376 respectively. By
rule of thumb, a smaller DBI signify that clusters are less overlapped portraying a
better result (Palaniappan and Mandic, 2007; Zhao et al, 2008; Coelho et al, 2012).
The value produced by the DBI is 0.865. The difference in suitability or non-
suitability of feature configurations can further be magnified by finding the square-
root of the DBI (Dixon et al, 2009). Hence the Modified DBI (MDBI) value is
0.4325.
Figure 18: Davies Bouldin index (Source: Author)
Variables identified in the cluster analysis suitable for developing the churn
models tie in with variables identified in the factor analysis test. The variables are
Gender, Age, Occupation, Region, Churn, CpM, DpM, Tarrif and Education.
These variables are used in developing the predictive churn model presented in
section 5.3.
5.2.4 Association rule (arule) mining
The IBM SPSS Modeler 18.0 tool was employed in generating the arules for
antecedent and consequent variables. With a minimum confidence, support and
lift of 50 percent, 50 percent and 1.2 respectively, interesting arules were generated
Page 66
66
with variables used in the cluster analysis and the training data of 961 observations.
In creating the model, the Frequent Pattern Growth (FP-Growth) algorithm was
used. The algorithm counts the occurrence of itemsets in the observations and
stored to the header. Based on the minimum confidence, support and lift set, the
rules generated that are below the set limits are automatically filtered out. The
main interest in using the arules in this dissertation is to mine associations between
variables that result in a churn decision with particular interest and focus on
confidence. The generated model is presented in Figure 19.
Figure 19: Association rules structure (Source: Author)
In generating the rules, the FP-Growth algorithm uses the FP-Tree to count and
recount nodes and branches in producing the arules by denoting a node as an item
and a branch as a different association. Because of the use of the FP-Tree,
calculation of the counted pairs is eliminated which increases the speed and
accuracy in producing arules using the identified variables in this dissertation for
churn management by all six Telecom operators in Ghana. With the arules
generated, a web circle layout graph (see Figure 20) is produced to pictorially
present the rules. Significant rules with high confidence are in bold lines using
seven variables. The decision of churn can also be seen to be link boldly with
several responses from the antecedent variables.
Page 67
67
Figure 20: Association rules structure (Source: Author)
The arules generated in Figure 20 were selected based on the first ten (10) rules
and sorted in descending order in line with confidence. The sorted rules have a
maximum confidence of 80 percent and a minimum of 56.41 percent. The rules
were generated with churn as the consequence and education, gender, network
often used, network ported, occupation and Region as antecedents. Rule 1 in Table
17 signifies an 80 percent confidence that items in the premise and conclusion are
highly linked to the itemsets in the conclusion. Rule 1 declares that there is an 80
percent confidence, 8.325 percent support and a 1.751 lift that respondent who has
churned, is a public sector worker and the network ported is MTN. Based on this
rule, it can be concluded with some iota of reservation that most public sector
respondents who churn do so with the MTN network. This rule ties in with cluster
results produced in subsection 5.2.3. The network may work assiduously to revert
this rule by paying attention to the cluster of public sector workers described in the
previous section. In rule 5, if a respondent lives in the Eastern region, works in the
private sector and often uses MTN as the network is not likely to churn with a
71.43 percent confidence. The rule signifies that respondents in the Eastern region
who use MTN network and with the private sector have a reason for not churning.
These categories of respondents are found in the reasons for not churning category
in the previous sector.
Page 68
68
Table 17: Top 10 generated Association rules (Source: Author)
When a customer uses Tigo network and works in the private sector, the
customer will not churn with a 65.42 percent certainty. The Tigo network has been
identified as the network with a less churn negative rate but a gainer of churn
customers. More other rules are indicated in Table 17 above. Although some of
the generated arules may appear debatable, the subject still hinges on the fact that
the churn of customers hugely associates with key demographic factors such as
region, occupation and gender.
5.3 Predictive Model
This section deals with the building of three predictive churn models for
customer churn prediction in the six Telecom companies in Ghana. Using the valid
variables identified in the factor and cluster analysis, the three models are created
with IBM SPSS Modeler 18.0 data mining software. The three classification
modelling techniques; C5.0 tree, Logistic regression and Discriminant analysis,
are used to create respective models and evaluated to determine the optimal model.
The optimal model is recommended based on individual models and performance
metrics. The chosen optimal model is tested with the test data and results with
variables validated for industrial use. This subsection answers Objective 6 of this
dissertation.
5.3.1 C5.0 algorithm tree model
In creating the model, the training data set of 961 respondents was used based
on the cleaned dataset from subsection 5.1. The C5.0 model splits the dataset based
on the variable that delivers a maximum information gain. The split process
recurrently continuous until no further splits can be done in all fields. The
algorithm then identifies the split subsets with meaningful contribution to the
Antecedent Consequent Support % Confidence % Lift
1 Network ported = MTN and Occupation = Public sector Churn = yes 8.325 80 1.751
2 Network ported = Airtel and Network often used = MTN Churn = yes 7.492 79.167 1.733
3 Network ported = MTN and Gender = F Churn = yes 12.695 78.689 1.723
4 Network ported = MTN and Region = Greater Accra Churn = yes 12.487 75.833 1.66
5 Region = Eastern and Occupation = Private sector and Network often used = MTN Churn = no 8.012 71.429 1.564
6 Region = Eastern and Occupation = Private sector Churn = no 10.406 66 1.445
7 Occupation = Private sector and Network often used = Tigo Churn = no 11.134 65.421 1.432
8 Region = Greater Accra and Network often used = MTN Churn = yes 13.84 60.902 1.333
9 Network often used = Airtel and Network ported = MTN Churn = yes 7.388 60.563 1.326
10 Region = Ashanti and Occupation = Public sector and Gender = M Churn = no 8.117 56.41 1.235
Page 69
69
model and eliminates them from the model. In the created C5.0 tree model in
Figure 21, an auto classifier was applied to test whether the chosen C.5.0 algorithm
will be identified as one of the optimal algorithms to create the predictive model.
The C5.0 algorithm was listed in the suggested churn algorithms which was
applied to the data. The algorithm created the churn model which was analyzed
with an analysis output. The results of the model in Figure 21 are carefully
explained.
Figure 21: C5.0 algorithm tree model (Source: Author)
The model first ranks all the variables in the dataset according to the best
predictor variable. The predictor variables are then assessed based on their
importance in predicting the target variable. The model produced “Region” as the
best predictor variable of importance, followed by education and Gender in that
order. The predictor variable importance to the prediction of the target variable
produced in Figure 22 identifies “tariff” as the least important variable to the
prediction model. The expectation of these variables is to produce a highly
confident prediction based on the testing data.
Page 70
70
Figure 22: Predictor importance_C5.0 tree model (Source: Author)
After splitting the data and dismissing variables that will not optimize the
model, the C5.0 algorithmic model uses partitioned data with a built model to
predict ($C-Churn) churn for each observation and assesses the confidence ($CC-
Churn) of each prediction. The predicted values ($C-Churn) are compared with
the original churn to ascertain the accuracy of the prediction. From Table 18
below, observation 1 produced different prediction values when Churn is
compared with $C-Churn. In the original data, the respondent indicated a ‘no’
churn, however, the C5.0 algorithm produced a ‘yes’ churn with a confidence of
87.5 percent. Table 18 presents the first 10 results of the model for analysis.
Table 18: Model prediction results (Source: Author) No.
Gender Age Occ Region
CpM
($)
DpM
($) Tariffs Educ Tenure Churn
$C-
Churn
$CC-
Churn
1 1 33 1 101 19.47 13.95 1 4 5 no yes 0.875
2 1 18 1 102 11.32 8.158 1 5 5 no no 1.000
3 1 40 1 103 21.32 11.05 1 3 5 no no 0.889
4 1 54 2 101 13.16 7.895 1 4 5 no no 1.000
5 0 32 1 101 21.05 7.632 1 4 5 no no 1.000
6 1 43 1 101 20 10.53 1 5 2 yes yes 0.875
7 1 35 3 101 18.95 8.684 1 3 3 yes yes 1.000
8 0 41 2 101 23.16 7.105 1 4 3 no no 1.000
9 1 17 1 104 20.26 13.16 1 4 5 no no 1.000
10 0 34 1 105 11.05 7.368 2 2 5 no no 0.889
5.3.2 Logistic regression model
The second model created for comparison was the Logistic regression method.
Based on the process presented in subsection 2.1.1, the model is contracted using
Page 71
71
a training data of 961 observations with IBM SPSS modeler 18.0. The data is
partitioned for creating the model. Using the logistic function, the logistic
regression was saved as the predicted values in probabilities, residuals in logit and
influence in DfBeta(s) to measure the impact of each observation on predictor
variables. The probability for stepwise was entered at 0.05 and removed at 0.10, a
classification cut off at 0.05 and 20 maximum iterations. The confidence interval
for the odds ratio (CI for Exp(B)) was set at 95% given that the predictor variables
in the model contribute to the target variable in line with the referent group. The
logistic regression algorithm generates the Logistic regression model in Figure 23
based on the parameters set in the model generation function. The model was then
analyzed to ascertain the correctness of prediction, AUC and Gini index. The
model produced the coefficients of the independent variables, providing the
importance of each variable (walds value) and the degree of significance of each
predictor variable when the other variables remain in the equation.
Figure 23: Logistic regression model (Source: Author)
The model, based on the classification, predicted 70.8% of ‘no’ alternatives
correctly and 53.4% of ‘yes’ alternatives to churn correctly. A cumulative accurate
correct prediction of 62.9% is produced while 37.1% wrong predictions were
produced in tandem with the attributes in the training data as in Figure 24.
Page 72
72
Table 19: Classification Tablea for Logistic regression (Source: Author)
Observed
Predicted
Churn
Percentage Correct no yes
Step 1 Churn no 369 152 70.8
yes 205 235 53.4
Overall Percentage 62.9
a. The cut value is .500
In selecting the first 10 predicted values from the training data, the predicted
responses ($L-Churn) is compared with the original churn decision (Churn) and
assessed by the confidence ($LP-Churn) in the prediction as presented in Table
20. Out of the 10 observations selected, two were not correctly predicted with
confidence of 0.545 and 0.683 for observations 5 and 8 respectively. The highest
confidence produced for correct prediction in the prediction results in Table 19 is
0.691 which is close to the correct predictive confidence of 62.9%.
Table 20: Model prediction results (Source: Author)
No. Gender Age Occupation Region
CpM ($)
DpM ($) Tarrif Educ Tenure Churn
$L-Churn
$LP-Churn
1 1 33 1 101 19.474 13.947 1 4 5 no no 0.616
2 1 18 1 102 11.316 8.158 1 5 5 no no 0.623
3 1 40 1 103 21.316 11.053 1 3 5 no no 0.612
4 1 54 2 101 13.158 7.895 1 4 5 no no 0.532
5 0 32 1 101 21.053 7.632 1 4 5 no yes 0.545
6 1 43 1 101 20.000 10.526 1 5 2 yes yes 0.561
7 1 35 3 101 18.947 8.684 1 3 3 yes yes 0.563
8 0 41 2 101 23.158 7.105 1 4 3 no yes 0.683
9 1 17 1 104 20.263 13.158 1 4 5 no no 0.691
10 0 34 1 105 11.053 7.368 2 2 5 no no 0.502
The variables in the equation table in Table 21 contain regression coefficients
(B), significance values from Wald’s chi-square and the exponents of the
regression coefficients (Exp (B)). The regression coefficients are the change in log
odds/logits for each unit change in the corresponding predictor variable. The
positive coefficients in Table 21 signify that as values increase on the predictor
variables, the probability of producing a ‘yes’ churn for the dependent variable
increases. The negative coefficients yield the opposite of the positive coefficients.
For example, a gender variable with a coefficient of -0.330 indicates that there is
a decrease in likelihood of a case falling in the ‘yes’ churn of the target group. It
can be identified that, the variables with the negative coefficients are variables
identified to be important in the creation of the model discovered in the factor and
cluster analysis. Predictors in the Wald’s criterion are Region, Tarrif, Tenure,
Page 73
73
Gender, Age, Occupation, CpM($), DpM($) and Education in chronological order
of importance.
Table 21: Variables in the Logistic equation (Source: Author)
In interpreting the regression coefficients, the significance of the predictor
variables is highly considered. For every one unit of disclosure for ‘Age’, there is
an increase likelihood that the customer will churn but the predictor is not
statistically significant. Statistically significant predictor variables are Gender,
Region, Tariff, and Tenure. With odds ratios, Exp(B) >1, it indicates that the odds
are increasing for every unit change on the predicator variable. If Exp(B) <1,
means the odds are decreasing for every unit on the predictor variable. The
Logistic Regression model is produced below using Equation 2.1 stated above.
log(1 )
i
i
= 11.83 –0.33*Gender +0.12*Age +0.58*Occupation –0.119*Region
+0.18*CpM($) –0.023*DpM($) +0.554*Tariff –0.23*Education – .173*Tenure
In testing the goodness of fit of the above model, the Hosmer and Lemeshow
test was computed. With the test statistic not being significant, it fulfils the criteria
of the Hosmer and Lemeshow test that the model is fit. In addition, since the
Hosmer and Lemeshow test is inundated with disagreements by data scientist, the
Omnibus Tests of Model Coefficients was further calculated to confirm the
goodness of fit of the coefficients. The general model produced a chi-square of
77.900 and a p-value of 0.000 (see Table 22), confirming that the model
coefficients are significant.
B S.E. Wald df Sig. Exp(B)
Step 1a Gender -.330 .143 5.329 1 .021 .719
Age .120 .081 2.206 1 .137 1.128
Occupation .058 .046 1.592 1 .207 1.060
Region -.119 .023 26.842 1 .000 .888
CpM ($) .018 .015 1.394 1 .238 1.018
DpM ($) -.023 .024 .903 1 .342 .977
Tariff .554 .183 9.145 1 .002 1.740
Education -.023 .064 .125 1 .723 .977
Tenure -.173 .062 7.726 1 .005 .841
Constant 11.826 2.400 24.277 1 .000 136804.735
a. Variable(s) entered on step 1: Gender, Age, Occupation, Region, CpM ($), DpM ($), Tarrif, Education, Tenure.
Page 74
74
Table 22: Goodness of fit for model (Source: Author)
Omnibus Tests of Model Coefficients
Chi-square df Sig.
Step 1 Step 77.900 9 .000
Block 77.900 9 .000
Model 77.900 9 .000
Hosmer and Lemeshow Test
Step Chi-square df Sig.
1 9.790 8 .280
5.3.3 Discriminant analysis model
In line with the process in creating the Logistic regression model, the
discriminant analysis model is built with the same set of training data and data
mining tool. The variants selected produce descriptive statistics as means, Box’s
M, Function coefficients and classification results. The statistical significance of
the generated model is further produced and assessed. The model in Figure 24
represents the Discriminant model generated that can be applied to test data to
produce likely churn customers from the six Telecom companies in Ghana. The
model is analyzed to produce the significance and accuracy in the prediction of
outcomes. The results of the predictive model created using discriminant analysis
are analyzed systematically in Figure 24 below. In addition, equations 2.6 and 2.7
were also considered in building the model.
Figure 24: Discriminant analysis model (Source: Author)
Page 75
75
The tests of equality produce the significance level of each predictor variable,
the Wilks’ Lambda and F statistics. The Wilks Lambda tests presents the
likelihood of a difference between the means of the predictor variables in the
group. From Table 23, the closeness of the values in the Wilks Lambda indicates
that there is no difference between the means of the predictor variables. Seven of
the predictor variables in the model are significant except CpM($) and DpM($)
which are not significant in prediction of outcomes. The results also have equal
variance among the groups in the model since the significance value is greater than
0.001.
Table 23: Tests of Equality of Group Means (Source: Author)
Wilks'
Lambda F df1 df2 Sig.
Gender .984 15.837 1 965 .000
Age .993 7.030 1 965 .008
Occupation .977 22.399 1 965 .000
Region .952 48.873 1 965 .000
CpM ($) .999 .865 1 965 .352
DpM ($) .999 .491 1 965 .483
Tarrif .988 11.594 1 965 .001
Education .995 4.731 1 965 .030
Tenure .985 14.692 1 965 .000
Wilks' Lambda
Test of Function(s) Wilks' Lambda Chi-square df Sig.
1 .922 77.951 9 .000
The Wilks Lambda in Table 23 also produced a P-value of 0.000 which
signifies that the model is statistically significant. This denotes that the model will
produce predictions that are statistically significant in their accuracy. The model
produced an overall correct prediction of 62.2% of cross-validated cases in
comparison with the actuals and a wrong prediction of 37.8% as seen in Table 24.
The classification table accurately predicted 60.8% of ‘no’ alternatives correctly
and 63.9% of ‘yes’ alternatives to churn correctly in the cross-validated
classification result. The first 10 results of the prediction of the training data used
for the model to ascertain the accuracy of predictions is presented in Table 25
below.
Page 76
76
Table 24: Classification Resultsa,c (Source: Author)
Churn
Predicted Group Membership
Total no yes
Original Count no 234 206 440
yes 154 367 521
% no 53.2 46.8 100.0
yes 29.6 70.4 100.0
Cross-validatedb Count no 317 204 521
yes 159 281 440
% no 60.8 39.2 100.0
yes 36.1 63.9 100.0
a. 62.5% of original grouped cases correctly classified.
b. Cross validation is done only for those cases in the analysis. In cross validation, each case is
classified by the functions derived from all cases other than that case.
c. 62.2% of cross-validated grouped cases correctly classified.
Table 25: Initial and predicted outcome (Source: Author)
No.
Gend
er Age Occ Region
CpM
($)
DpM
($) Tarrif Educ Tenure Churn
$D-
Churn
$DP-
Churn
1 1 33 1 101 19.474 13.947 1 4 5 no no 0.574
2 1 18 1 102 11.316 8.158 1 5 5 no no 0.583
3 1 40 1 103 21.316 11.053 1 3 5 no no 0.572
4 1 54 2 101 13.158 7.895 1 4 5 no yes 0.509
5 0 32 1 101 21.053 7.632 1 4 5 no yes 0.587
6 1 43 1 101 20.000 10.526 1 5 2 yes yes 0.6
7 1 35 3 101 18.947 8.684 1 3 3 yes yes 0.604
8 0 41 2 101 23.158 7.105 1 4 3 no yes 0.717
9 1 17 1 104 20.263 13.158 1 4 5 no no 0.654
10 0 34 1 105 11.053 7.368 2 2 5 no yes 0.539
The standard canonical discriminant function coefficients determine the
highest predictor loadings/importance capable of predicting an outcome. The
canonical discriminant table presents ‘Region’ as the most important predictor
variable among the predictor variables. The standard canonical discriminant
function coefficients are compared with the structure matrix to discover
consistency of predictor variable functions. The predictor variables with
consistency are Region, Gender, Occupation, Tariff, Education and Tenure in
Table 26. These variables are therefore the best in the discriminant analysis model
in predicting the outcome of churn per the data collected from the customers of the
six Telecom companies.
Page 77
77
Table 26: Canonical Discriminant Function Coefficients and Structure Matrix
(Source: Author)
Canonical discriminant
Function
Structure Matrix
Function
1 1
Gender .277 Region .774
Age -.203 Occupation -.524
Occupation -.165 Gender .441
Region .675 Tenure .424
CpM ($) -.136 Tarrif -.377
DpM ($) .110 Age .294
Tariff -.365 Education .241
Education .047 CpM ($) -.103
Tenure .371 DpM ($) .078
5.3.4 Model evaluation and deployment
Model evaluation
The optimal model is recommended based on the Area Under Receiver
Operating Characteristic (AUROC) curve value, performance evaluation values,
and comparison of actual churn & predicted churn performance. The three created
models are evaluated on these cardinal points for model optimality selection to be
applied to the test data.
a. Performance evaluation (confusion matrix)
As indicated in the three models built above, the True Positive (TP) and True
Negative (TN) predictions signify the correctness of predictions of the models. For
a better evaluation, the confusion matrix is constructed for both the training (961)
and testing (522) datasets in Tables 27a and 27b respectively. The C5.0 algorithm
of the decision tree predicts a higher percentage of TP values compared to LR and
DA for both the training and testing dataset. The LR model predicts overall correct
percentages very close to the DA model in the training dataset. The LR model had
a reduced overall prediction in the testing data suggesting the presence of over-
fitting in the data. The C5.0 and the DA models did not register over-fitting in the
64.6%, the Logistic regression model predicted 21.2% while the discriminant
analysis model accurately predicted 66.7% of TN outcomes as in Table 27b. In
comparing the two tables with the two datasets, C5.0 was the best model in terms
of overall percentage correct predictions followed by DA. LR is grappled with
over-fitting and may not be ideal for predicting churn in line with this data.
Page 78
78
Table 27a: Confusion Matrix with Training data (Source: Author)
C5.0 no yes % correct
no 278 243 53.4
yes 16 424 96.4
Overall percentage 73.0%
LR no yes % correct
no 369 152 70.8
yes 205 235 53.4
Overall percentage 62.9%
DA no yes % correct
no 317 204 60.8
yes 159 281 63.9
Overall percentage 62.2%
Table 27b: Confusion Matrix with Testing data (Source: Author)
C5.0 no yes % correct
no 199 109 64.6
yes 23 191 89.3
Overall percentage 74.7%
LR no yes % correct
no 39 141 21.2
yes 40 302 88.3
Overall percentage 65.3%
DA no yes % correct
no 120 60 66.7
yes 134 208 60.8
Overall percentage 62.8%
b. Accuracy of prediction: comparing $Churn with Churn in training dataset
In accurately predicting correct actuals from the original data, the three models
produced the predictions in Table 28 below. The C5.0 algorithm of decision trees
accurately predicted 73.0% of actuals with a wrong prediction of 27.0% when
$Churn was compared with Churn. This represents an excellent accuracy of
prediction indicating that the model is capable of predicting over 73% accurate
outcomes when applied to data with same variables and data types. The LR and
DA models produced very close correct predictions of 62.9% and 62.2%
respectively. Contrasting the three models, the C5.0 algorithm of decision tree
proves to be the best in accuracy for the prediction of churn customers of Telecom
companies in Ghana based on the chosen variables and attributes.
Page 79
79
Table 28: Comparing $Churn with Churn (Source: Author)
Model Prediction
Correct (%) Wrong (%)
C5.0 algorithm model 73.0 27.0
LR model 62.9 37.1
DA model 62.2 37.8
c. Other evaluation metrics
The Receiver Operating Characteristic (ROC) curves for evaluating these
models are shown in Figures 25, 26 and 27 for C5.0 algorithm tree model, Logistic
Regression model and Discriminant Analysis model with the Area Under Curve
(AUC) values as 0.984, 0.663 and 0.663 respectively. The AUC of the C5.0
algorithm model is closer to the upper left and classifies correctly the instances in
the data. As the False Positive (FP) Rate (1-Specificity) decreases, the True
Positive Rate (Sensitivity) increases in accurate and precise predictions. The
AUROC of the LR and DA models produce the same graphs as indicated in the
figures. The ROC curves have larger FP rates and a smaller accuracy and precision
in sensitivity. The difference between the AUROCs of LR & DA, and the AUROC
of C5.0 algorithm are very wide with the later approaching optimality. The results
are not skewed because the dataset used for the models are the same in size and
variables.
Figure 25: Area under ROC – C5.0 Algorithm tree model (Source: Author)
Page 80
80
Figure 26: Area under ROC – LR model (Source: Author)
Figure 27: Area under ROC – Discriminant model (Source: Author)
The C5.0 tree model excels in comparison with LR and DA in all the
parameters. The DA model follows since it has no over-fitting when the confusion
matrix of the test data is analyzed. The result can further be enriched by
increasing the number of observations or other DM techniques with wider
variables for more confrontation.
Page 81
81
The C5.0 test model
The optimal model based on the results of the evaluation is tested on the dataset
designed to test the model. The C5.0 algorithm model was used to test the data
since it was discovered as the most optimal among the models. The testing dataset
that was preprocessed in subsection 4.3.1 was applied to the model. The test data
has 522 observations, 9 variables and coded the same as the coding in Table 3. The
distribution of the dataset is along all the regions, age brackets, gender, occupation
and the other demographic and operational variables used to develop the model.
The test data is applied by mapping the dataset to the model designed by the
C5.0 algorithm as indicated in Figure 28. Further model screening and applications
are undertaken to define the output in determining the likelihood of churn. The
results are sieved to produce the top 10 ‘yes’ and ‘no’ churners in Tables 29a and
29b. The source of the test data set can be connected to the database or server of
the company to produce real time output of churn results for decision making.
Figure 28: Test model_C5.0 algorithm (Source: Author)
Out of the 522 observations, the model predicted that 191 customers will churn
with confidence from 100% to 66.7%. It was further discovered from the results
that over 94% of the churn customers have a confidence of above 80%. The churn
customers are mostly from MTN, Vodafone and Airtel networks. The results also
indicate that the churn customers purchase monthly credit and data substantially,
hence the affected networks will lose a great amount of revenue. In addition, in
Page 82
82
line with literature that it is expensive to acquire new customers than to retain
existing ones, the prediction of churners and the reasons proffered earlier need
close attention. The top 10 churners and non-churners predicted by the model are
presented in Tables 29a and 29b.
Table 29a: Results of test predictions_Yes (Source: Author)
Table 29b: Results of test predictions_No (Source: Author)
5.3.5 Model validation
Model validation is the process of proving that the model produces accurate,
representative, precise, reliable and system specific results that answer specific
objectives (Consonni et al, 2010). Model evaluation is more general and includes
the external factors impacting on the model while model validation is more
specific to the model and its variables. Model evaluation is a process that leads to
model validation. However, the validation of a model is highly linked to the
objectives of the research, hence the process and method will be influenced as
such. Since a model is primarily designed to assess a particular challenge, its
Page 83
83
representation is connected to several components to produce the desired results.
Validation of the model is mostly performed in various parts for comprehension
of the level of validity of adjourning parts (Consonni et al, 2010). In most models,
three discrete aspects must be considered in validating the model
i. assumptions
ii. input variables and distributions
iii. outcomes and conclusions.
It is however difficult for data analysts to perform or undertake these three
aspects especially in cases where the model is novel (Gramatica, 2007). In most
cases, validation attempts are initiated at the outcome and conclusion level. It is
only when the validation produces a challenge that other aspects are used. Pratim
et al (2009) also posited expert intuition, system measurements and results/system
analysis as the three different approaches in model validation. A combination of
any of the three approaches, for both prognosis, can be applied in validation
depending on the model one is dealing with. In addition, adhoc model validation
techniques may be employed by data analyst for a particular model. These adhoc
measures must however be scientific. In this dissertation, the input variables and
outcome aspects are used to validate the predictive churn model for Telecom
companies in Ghana.
The variables used for the model are validated based on the results of the
exploratory factor analysis, cluster analysis and association rule mining. The
methods produced results that validated the variables to be applied in constructing
the model. The three models further confirmed the variables of significance for the
construction of the model. Each statistical method has been concurrently
consistent with each other in line with the selected variables. Hence the validated
variables based on the statistical measures are Region, Gender, Occupation, Age,
CpM, DpM and Tariff. Variables Tenure and Education are discovered not to be
quite relevant in churn prediction of customers of Telecom companies in Ghana.
The outcome of train predictions can also be applied in validating the chosen
model. It can be reviewed that the chosen model produced an accuracy of
predicting exact outcomes as 73.0%.
Page 84
84
6 CONTRIBUTION TO SCIENCE, THEORY AND
PRACTICE
This section elicits the relevance of the dissertation to science, theory and
practice. It further indicates the novel issue that has been added to the wealth of
knowledge in academia and industry.
6.1 Gains for Science
The findings of the dissertation contributes significantly in the development of
products and services by Telecommunication companies in Ghana and mostly
developing countries. The knowledge of potential churn customers is a weapon for
competition. Getting to understand the independent variables that lead to churn
will call to fore a directed human resource training and product specific
enhancement for competitive advantage.
The results of the dissertation are an opener to more related studies in the area
by students and researchers. Students and other academicians may use this as a
bane to research into employee churn which has a low research output in Africa in
general and Ghana in particular. The model can also be enhanced by researchers
and applied in other sectors. The findings of the dissertation contribute
significantly to science by providing a clue that helps strengthen the Ghanaian
Telecommunication industry and lead to the increase in customer satisfaction.
6.2 Gains for theory
Data mining is currently a new area in academic circles in Ghana. This
dissertation will ignite a positive debate and interest in the area and stimulate the
enactment of data mining courses in the universities. While the teaching of data
mining courses is virtually absent in the institutes of learning in Ghana, this
dissertation will serve as a reference material for drafting data mining course
materials and other academic work. Industry will also find this piece of work
handy and beneficial in reference to predictor variables on churn of customers and
how to prevent same. Investors in the Telecommunication industry and other areas
in the service sector will also find this dissertation helpful as it will guide them in
designing their products and services. The findings of the dissertation serve as a
theory of knowledge for both researchers in academia and industry.
6.3 Gains for Practice
The results in the dissertation helps Telecommunication companies to
reposition their products to make it more user-specific. Practical steps can be
adopted by companies to halt or reduce the churn of customers based on the
predictor variables. The dissertation also enhances the analytic features of the
Page 85
85
companies since the generated model serves as an easy and quicker way to
identify churn customers. The source of data input in the model can be the
company server instead of table as used in the model. Variables and data structure
will be in line with what is used in the dissertation for real time results on likely
churners. Decision making by the Telecommunication companies is also
enhanced since the model gives empirical evidence for decisions on customer
retention, product improvement and call/data tariff adjustments.
Since most corporate organizations find it difficult to release data, this
dissertation presents a model that accommodates surveyed data and makes
provisions for adjustments in variable use. Research and educational institutions
can apply this model to surveyed data if corporate data is not provided.
Page 86
86
7 CONCLUSION, LIMITATIONS AND FUTURE
RESEARCH
This chapter summarizes the dissertation in a conclusion. It brings to fore major
findings in the dissertation with recommendations, unearths the limitations of the
work and identifies appropriate areas that can be developed by future researchers.
7.1 Conclusion
Data mining is a significant tool in the Telecommunication industry that can
utilize the large volume of data generated for pattern analysis. The recent
increasing embrace of predictive algorithm of data mining has given room for
companies to assess their future success, challenges and targets.
The dissertation brings to fore the relevant untapped customer data and
knowledge for churn prediction and customer classification for better decision
making and customer management in Ghana and most developing countries. Even
though the Telecommunication industry is applied in this research, the
quality/value relationship obtained is quite suggestive of results that can be derived
for more sectors, hence the model can be used by companies in the service sector
for both customer and employee churn analysis with same predictor variables.
Applying this technique in predicting the behaviour of the most valuable asset
(customers) in the Telecommunication industry in Ghana and the implementation
of the developed model, guarantees a higher level of customer assessment,
customer management and customer profiling for continuous growth in the sector.
The dissertation has unearthed the grey areas that are overlooked by service
providers which have a direct bearing on the satisfaction and retention of
customers.
The dissertation was basically organized in three sections. The first section
explored the subject area and digested the state of the art of predictive analytics.
Grey areas identified were further investigated to ascertain grounds for the purpose
of the dissertation. In this same section, the Ghanaian Telecommunications
industry was reviewed and juxtaposed with predictive analytics. Customer churn
in the industry was further explored to justify the objectives and relevance of the
study. The results in the exploration indicated that very little or no research had
been conducted in predictive analytics and churn management being it in the
scientific, industrial or academic space in Ghana and the sub-region as a whole.
Predictive analytics of churn is not new in the Telecommunication industry.
However, the review in the first section revealed that all the works carried out
depended on secondary data from company databases to generate the model. In
addition, only a handful of scientific manuscripts tested their model with test data.
Page 87
87
Again such studies never delved into intra-company comparisons to determine
churn statistics with respect to magnitude and direction of churn among the
Telecoms and deduce associated causalities.
The second section dealt with the objectives, hypotheses, research problem and
questions, and the methodology used to achieve the goals. Six research questions
were proffered with six objectives to answer them. A comprehensive conceptual
framework was designed to facilitate the process and deal specifically with the
objectives of the dissertation. The framework consisted of five parts. The first part
dealt with data preprocessing to clean the data for analysis and modelling. The
second part focused on statistical data analysis using descriptive statistics, factor
analysis, association rule mining and cluster analysis to structure the data and
discover relevant variables ideal for modelling. The Pearson-chi square was also
used in this part to respond to the hypotheses. The third part was directly on
building the model using three classification modelling techniques: Decision tree
C5.0 algorithm, Logistic regression and Discriminant analysis. The three
predictive models were theme evaluated by assessing the significance of the
predictor variables in part four. The accuracy of prediction, AUROC, performance
of the models and ROC curve were factored in the evaluation process. The C5.0
algorithm model which produced the best results was then tested using the test
dataset. The last part in the conceptual framework validated the chosen model by
assessing consistency and reliability of results and further diagnosing results
efficiency and effectiveness.
The third section consisted of the main findings of the dissertation. The findings
are summarized in line with the objectives and hypotheses for a better grasp of the
work. The objectives of the dissertation were achieved with very significant novel
results.
Cluster customer interest areas that inform customer loyalty
Clustering customers was developed in the dissertation to elicit the key
variables that inform the loyalty of customers. In addition to the cluster analysis,
the Phi & Cramer’s V test was used to test the magnitude of association between
variables from the cluster that inform loyalty. Customers who have stayed with
particular networks for years have refused to churn because the network has good
connectivity, a better data plan, rewarding products and low call tariffs. Customers
churned basically because of high data tariffs and network connectivity related
issues. Majority of the churned customers reside out of the capital where network
connectivity is a major concern (NCA, 2013).
Using the Phi & Cramer’s V to test the depth of association of loyalty and the
reasons for it, the result produced a very strong relation between loyalty and the
Page 88
88
variables. In the two cases of loyalty and decision to churn, the value of the test
was over 0.5 which signifies a very high association between loyalty and the
interest areas that inform that loyalty. This finding is key in the desire for customer
retention and will be handy for companies in the sector to reposition their products
to hold on to existing customers. It must be indicated that none of the academic
articles reviewed considered this component in their work.
Mine the relevant patterns imbedded in collected data that have a huge influence on the revenues and growth of the Telecommunication companies.
When observed in the respondents, key revenue and growth related variables
are significant predictors of churn among the Telecom companies. These predictor
variables included connectivity, quality & reliability of network, call/data tariffs
and product innovation. A quick glance at customer behavior signify that most of
the churned customers purchased substantive credit/data per month which has a
strong direct effect on company revenues. The predictor variables listed control
the decision to churn or not with the collected training data. In the researched
literature, the value of the predictor variables to revenue lost has not been assessed.
This is a novel addition to the body of knowledge where telecommunication
companies in Ghana can refer to know the predictor variables customers are very
concerned about that has a direct linkage to revenue when key customers churn.
Produce a comparative framework that identifies the Telecommunication
Company with the highest churn rate.
MTN network recorded the highest churn rate by losing 23.6 percent of the
total churned customers and only gaining 9.4 percent. Tigo, Vodafone and Airtel
companies gained the highest number of churned customers per the results by 12.5
percent, 10.8 percent and 10.1 percent respectively. The result and finding was in
line with a study of ported customers by Telecom EN (2014) which identified
MTN as the network that loses more customers in comparison with the others. This
result is however informing since it lists all the six networks with their percentage
of loss and gain customers due to churn. Table 4 contains the comparative figures
of the churn of customers of the respective networks per the collected data.
Classify customers into various categories to enhance marketing and promotional activities.
To produce the classification of categories for marketing and promotional
activities, a cluster analysis with four centroids was developed. The various
clusters contained attributes such as age, gender, occupation, region, churn status,
credit and data purchase, and the reason for churn or not. The clusters were
Page 89
89
developed using the K-means algorithm of cluster analysis. The developed clusters
are very informative and an important result for providers. Clusters 0 and 1
contained customers who have churned while Clusters 2 and 3 had non-churn
customers. The clusters have associated demographic variables and other predictor
variables.
Customers who churned in clusters 0 and 1 are from the Greater Accra and
Ashanti regions, who are males, public servants and students, and have stayed
longer with the churned network. The customers churned because of high data
tariffs and poor network connectivity. These customers equally purchase the
highest call and data tariffs per month, hence the network companies loses a lot of
revenue when such customers are lost. Targeted and directed marketing and
promotional activities can easily be channeled to these customers by reducing data
tariffs and improving network for customer retention.
Clusters 2 and 3 are customers who have not churned. These are both male and
female customers, over 45 years old, with Master’s and Bachelor’s degrees and
from the Northern part of the Country. Customers in this category have not
churned because of better data tariffs and low call rates. Providers can stratify these
customers and maintain the standard in call and data promotions with an improved
version to keep them.
It must be indicated that, these findings and method is novel in the industry
when reviewed academic work is taken into consideration. The results from the
cluster analysis for promotional and marketing purpose presents a ready guide for
marketing strategies in the industry.
Rank products/services per the interest and preference of customers.
According to Sirgy (2015), the preference of products and services ignites the
churn decision by customers. The most significant product to customers is data
bundle charges. With the increase in mobile telephony in Africa, Ghana has over
the years witnessed a consistent rise in the number of mobile phone users and
social media patronage. This gives reason for the preference of data bundles to
voice call rates. Network quality, reliability, stability and customer service were
keen areas identified to influence the decisions of customers to churn or not. These
services have been corroborated by Han & Ryu (2009) and Santouridis &
Trivellas, (2010). The ranking of products/services has been provided in Figures
13-15. Promotional activities did not appear to be significant to customers, hence
companies must perform targeted and results driven promotional activities.
Page 90
90
Design a predictive model that predicts customer churn rate for Telecoms
in Ghana with higher accuracy and reliability.
Three modelling algorithms were employed and compared for the most optimal
that predicts accurately and is reliable. With the models developed, the C5.0
decision tree algorithm produced very accurate TP and TN predictions. With the
performance of the model, all the three algorithms were quite close in their
prediction of TP and TN outcomes. A further accuracy test was performed to
identify the best model. While C5.0 algorithm model correctly predicted 73.00
percent of training data accurately, the LR and DA algorithms only accurately
predicted 62.9 percent and 62.2 percent respectively. The ROC curve was further
employed to test the best model. Once again, the C5.0 algorithm produced a curve
that was almost 1 with the others below 0.4.
The C5.0 algorithm model of decision tree has been recommended for churn
management and analysis followed by the discriminant analysis model since they
registered no over-fitting of data. The models can readily be used by industry with
the IBM SPSS Modeler or any other appropriate tool with the same algorithm. The
Telecommunication companies can connect the models directly to their servers or
database to produce real time results.
The hypotheses were also carefully analyzed with the following significant
results that contributes relevant knowledge to academia and industry. The
hypotheses were tested using the Pearson Chi-square test or Fisher’s exact test in
IBM SPSS statistics.
H1: There is a correlation between the number of years a customer stays
with a telecom provider and customer churn rate in
Telecommunication companies.
The null hypothesis in this category was supported due to the result produced
by the test. The duration a customer stays with a Telecom provider suggest whether
the customer will stay or leave the network. Although key products and services
contribute in determining the decision, duration of loyalty to a Telecom provider
also feeds into the decision to churn or not. This finding is largely corroborated by
the results in the cluster analysis.
H2: Product innovation impacts on churn of customers of Ghanaian
Telecommunication Companies.
Using the Pearson Chi-square to evaluate this hypothesis, it was discovered that
product innovation has a significant impact on decision to churn by customers.
Tying to the fact that connectivity, data cost, call rates, reliability and stability of
calls are significant to consumers of Mobile networks, constant innovation of such
products to meet customer demand will lessen the rate of churn of customers.
Page 91
91
Mobile networks who ride on innovation of products will gain competitive
advantage over other industry players.
H3: The number of networks a customer uses influences churn.
Most individuals in Ghana use more than one network due to a host of reasons.
Cardinal among those reasons is the instability or non-availability of network in
some places. To investigate whether the availability of alternatives lead to churn,
the Fisher’s exact test was used due to the fact that some frequencies are less than
5. The results therefore confirm that the existence of more mobile network
companies influence the decision to churn. Mobile companies must leverage on
this finding and work to maintain their clientele.
In all, the dissertation was very successful. All objectives were achieved and
research questions answered. Hypotheses were responded to and a dynamic
conceptual framework was modelled to guide the dissertation. The ultimate goal
of modelling an accurate, reliable, consistent, efficient and effective predictive
model for Telecommunication companies (Mobile networks) in Ghana was
achieved.
7.2 Limitations of the Dissertation
Primary data from customers of six Ghanaian Telecommunication companies
are used in this dissertation. The response rate was not 100% for the sample size
which could be an ideal situation. However, the response rate of the study was
significantly high (96.9%) and fell within accepted global statistical index and
therefore adds to the validity and outcomes/results of the study.
The behaviour and interest of customers in Ghana varies from that of Czech
Republic or other countries. Due to different cultures, companies may have
different approaches and services; hence customer complaints or value may differ
significantly. The applied techniques may therefore yield different results in these
countries; however, the data mining algorithms used to extract the knowledge are
largely to remain the same. The model must therefore be edited appropriately
before use in such instances.
Another limitation of the study is the inability of the researcher to use a larger
sample size out of the population of mobile network users due to limited resources.
Big data cannot be applied due to data flow approach. However, variables can be
expanded with the use of different tools and permutation test.
7.3 Suggestions for future research
This dissertation and the findings therein serve as a benchmark for future
research in the area. Interested researchers can investigate employee churn in the
service industry which is very prolific in the media and banking sectors. The
queuing models and Business process modelling may also be applied to determine
Page 92
92
the movement of customers among the Telecommunication companies. Other
Machine learning models for classification such as random forest, naïve Bayes,
Neural Networks among others can be applied in future research.
Page 93
93
Bibliography
AFFUL-DADZIE, Eric, Stephen NABARESEH, and Zuzana Komínková
OPLATKOVÁ. "Patterns and Trends in the Concept of Green Economy: A
Text Mining Approach." In Modern Trends and Techniques in Computer
Science, pp. 143-154. Springer International Publishing, 2014.
AGGARWAL, Charu C. Data streams: models and algorithms. Vol. 31. Springer
Science & Business Media, 2007. ©2010. ISBN 10: 0-387-28759-0.
Available
at:http://scholar.google.com/scholar?hl=en&q=Data+Streams%3A+Models
+and+Algorithms&btnG=&as_sdt=1%2C5&as_sdtp=
AGGARWAL, Charu C., and S. Yu PHILIP. "A general survey of privacy-
preserving data mining models and algorithms." Privacy-preserving data
mining. Springer US, 2008. 11-52.
AGYEKUM, Kwame AP, Eric T. TCHAO, and Emmanuel AFFUM. "Evaluation
of Mobile Number Portability Implementation in Ghana." International
Journal of Computer Science and Telecommunications 4 (2013): 30-33.
AHN, Jae-Hyeon, Sang-Pil HAN, and Yung-Seop LEE. "Customer churn
analysis: Churn determinants and mediation effects of partial defection in the
Korean mobile telecommunications service industry." Telecommunications
policy 30, no. 10 (2006): 552-568.
AJMAL, Mian, Petri HELO, and Tauno KEKÄLE. "Critical factors for knowledge
management in project business." Journal of knowledge management 14, no.
1 (2010): 156-168.
ANDERBERG, Michael R. Cluster analysis for applications: probability and
mathematical statistics: a series of monographs and textbooks. Vol. 19.
Academic press, 2014.
BAÇÃO, F. Data Mining and Knowledge Discovery Technologies. Online
Information Review, 2008, vol. 32, no. 6, pp. 866-867.
BHARDWAJ, Brijesh Kumar, and Saurabh PAL. "Data Mining: A prediction for
performance improvement using classification." arXiv preprint
arXiv:1201.3418 (2012).
BUJLOW, Tomasz, Tahir RIAZ, and Jens Myrup PEDERSEN. "A method for
classification of network traffic based on C5. 0 Machine Learning
Algorithm." In Computing, Networking and Communications (ICNC), 2012
International Conference on, pp. 237-241. IEEE, 2012.
BUNTINE, Wray. "Learning classification rules using Bayes." In Proceedings of
the sixth international workshop on Machine learning, pp. 94-98. 2016.
Page 94
94
CHAIKEN, Ronnie, Bob JENKINS, Per-Åke LARSON, Bill RAMSEY, Darren
SHAKIB, Simon WEAVER, and Jingren ZHOU. SCOPE: easy and efficient
parallel processing of massive data sets. Proceedings of the VLDB
Endowment, 2008, vol. 1, no. 2, pp. 1265-1276, ACM 978-1-60558-306-
8/08/08.
CHANG, Yu-Teng. “Applying data mining to telecom churn management.”
International Journal of Reviews in Computing, 6-331x (2009), 67-77.
CHANGZHENG, Z. H. A. N. G., and W. A. N. G. SHUO. "Application of Data
Mining in Urban Traffic Accidents Governance Based on Association Rules."
Advances in Information Sciences & Service Sciences 4, no. 19 (2012).
CHATTAMVELLI, R. Data mining algorithms. Alpha science international
(2011).
COELHO, Guilherme P., Celso C. BARBANTE, Levy BOCCATO, Romis RF
ATTUX, José R. OLIVEIRA, and Fernando J. Von ZUBEN. "Automatic
feature selection for BCI: an analysis using the davies-bouldin index and
extreme learning machines." In The 2012 international joint conference on
neural networks (IJCNN), pp. 1-8. IEEE, 2012.
CONSONNI, Viviana, Davide BALLABIO, and Roberto TODESCHINI.
"Evaluation of model predictive ability by external validation techniques."
Journal of chemometrics 24, no. 3‐4 (2010): 194-201.
COUSSEMENT, Kristof, and Dirk VAN DEN POEL. "Churn prediction in
subscription services: An application of support vector machines while
comparing two parameter-selection techniques." Expert systems with
applications 34, no. 1 (2008): 313-327.
COUSSEMENT, Kristof, Dries F. BENOIT, and Dirk VAN DEN POEL.
"Improved marketing decision making in a customer churn prediction context
using generalized additive models." Expert Systems with Applications 37, no.
3 (2010): 2132-2143.
DARGIE, Waltenegus, and Alexander SCHILL. "Stability and performance
analysis of randomly deployed wireless networks." Journal of Computer and
System Sciences 77, no. 5 (2011): 852-860.
DIXON, Sarah J., Nina HEINRICH, Maria HOLMBOE, Michele L. SCHAEFER,
Randall R. REED, Jose TrEVEJO, and Richard G. BRERETON. "Use of
cluster separation indices and the influence of outliers: application of two new
separation indices, the modified silhouette index and the overlap coefficient
to simulated data and mouse urine metabolomic profiles." Journal of
Chemometrics 23, no. 1 (2009): 19-31.
Page 95
95
ECKERSON, Wayne W. Predictive analytics–Extending the value of your data
warehousing investment. TDWI Best Practices Report, 2007, vol. 1, pp. 1-36.
FARVARESH, Hamid, and Mohammad Mehdi SEPEHRI. A data mining
framework for detecting subscription fraud in telecommunication.
Engineering Applications of Artificial Intelligence, 2011, vol. 24, no. 1, pp.
182-194, doi:10.1016/j.engappai.2010.05.009.
FEINERER, Ingo. "Introduction to the tm Package Text Mining in R." 2013-12-
01]. http://www, dainf, ct. utfpr, edu. br/-kaestner/Min-
eracao/RDataMining/tm, pdf (2015).
FREITAS, Alex A. Data mining and knowledge discovery with evolutionary
algorithms. Springer Science & Business Media, 2013.
GARCIA, Vincent, Eric DEBREUVE, and Michel BARLAUD. "Fast k nearest
neighbor search using GPU." In Computer Vision and Pattern Recognition
Workshops, 2008. CVPRW'08. IEEE Computer Society Conference on, pp. 1-
6. IEEE, 2008.
GHANA Statistical Service [online]. (2013). Financial Services Survey. © 2013
[viewed 03/06/2014]. Available at:
http://www.statsghana.gov.gh/nada/index.php/catalog/central.
GIUDICI, Paolo, and Silvia FIGINI. Front Matter. John Wiley & Sons, Ltd, 2009.
GRAMATICA, Paola. "Principles of QSAR models validation: internal and
external." QSAR & combinatorial science 26, no. 5 (2007): 694-701.
GREENWALD, Anthony G., T. Andrew POEHLMAN, Eric Luis UHLMANN,
and Mahzarin R. BANAJI. "Understanding and using the Implicit Association
Test: III. Meta-analysis of predictive validity." Journal of personality and
social psychology 97, no. 1 (2009): 17.
GREGOR, Karol, Ivo DANIHELKA, Alex GRAVES, Danilo Jimenez
REZENDE, and Daan WIERSTRA. "DRAW: A recurrent neural network for
image generation." arXiv preprint arXiv:1502.04623 (2015).
GÜRBÜZ, Feyza, Lale ÖZBAKIR, and Hüseyin YAPICI. "Data mining and
preprocessing application on component reports of an airline company in
Turkey." Expert Systems with Applications 38, no. 6 (2011): 6618-6626.
HAN, Heesup, and Kisang RYU. "The roles of the physical environment, price
perception, and customer satisfaction in determining customer loyalty in the
restaurant industry." Journal of Hospitality & Tourism Research 33, no. 4
(2009): 487-510.
HAN, Jiawei, Jian PEI, and Micheline KAMBER. Data mining: concepts and
techniques. Elsevier, 2011.
Page 96
96
HARDING, J. A., M. SHAHBAZ, and A. KUSIAK. Data mining in
manufacturing: a review. Journal of Manufacturing Science and Engineering,
2006, vol. 128, no. 4, pp. 969-976.
HAZEN, Benjamin T., Christopher A. BOONE, Jeremy D. EZELL, and L. Allison
JONES-FARMER. "Data quality for data science, predictive analytics, and
big data in supply chain management: An introduction to the problem and
suggestions for research and applications." International Journal of
Production Economics 154 (2014): 72-80.
HILAS, Constantinos S., and Paris As MASTOROCOSTAS. "An application of
supervised and unsupervised learning approaches to telecommunications
fraud detection." Knowledge-Based Systems 21, no. 7 (2008): 721-726.
HIPPNER, Dipl-Wirt-Inf Hajo, and Klaus D. WILDE. "Data Mining im CRM."
In Effektives customer relationship management, pp. 205-225. Gabler, 2008.
HONG, Tzung-Pei, Chyan-Yuan HORNG, Chih-Hung WU, and Shyue-Liang
WANG. "An improved data mining approach using predictive itemsets."
Expert Systems with Applications 36, no. 1 (2009): 72-80.
HOSMER Jr, David W., Stanley LEMESHOW, and Rodney X. STURDIVANT.
Applied logistic regression, 2013, Vol. 398. John Wiley & Sons.
HOSSEINI, Seyed Mohammad SEYED, Anahita MALEKI, and Mohammad Reza
GHOLAMIAN. "Cluster analysis using data mining approach to develop
CRM methodology to assess the customer loyalty." Expert Systems with
Applications 37, no. 7 (2010): 5259-5264.
HUANG, Bingquan, Mohand Tahar KECHADI, and Brian BUCKLEY.
"Customer churn prediction in telecommunications." Expert Systems with
Applications 39, no. 1 (2012): 1414-1425.
HUANG, Ying, and Tahar KECHADI. "An effective hybrid learning system for
telecommunication churn prediction." Expert Systems with Applications 40,
no. 14 (2013): 5635-5647.
IDRIS, Adnan, Muhammad RIZWAN, and Asifullah KHAN. "Churn prediction
in telecom using Random Forest and PSO based data balancing in
combination with various feature selection strategies." Computers &
Electrical Engineering 38, no. 6 (2012): 1808-1819.
JENNEX, Murray E., and Lorne OLFMAN. "A model of knowledge management
success." Strategies for knowledge management success. Exploring
organizational efficacy (2008): 14-31.
JENSEN, Peter B., Lars J. JENSEN, and Søren BRUNAK. "Mining electronic
health records: towards better research applications and clinical care." Nature
Reviews Genetics 13, no. 6 (2012): 395-405.
Page 97
97
JIANG, Shengyi, Guansong PANG, Meiling WU and Limin KUANG. "An
improved K-nearest-neighbor algorithm for text categorization." Expert
Systems with Applications 39, no. 1 (2012): 1503-1509.
KANTARDZIC, Mehmed. Data mining: concepts, models, methods, and
algorithms. John Wiley & Sons, 2011.
KERAMATI, Abbas, and Seyed MS ARDABILI. "Churn analysis for an Iranian
mobile operator." Telecommunications Policy 35, no. 4 (2011): 344-356.
KING, William R. Knowledge management and organizational learning. Springer
US, 2009.
KOH, Hian Chye, and Gerald TAN. Data mining applications in healthcare.
Journal of healthcare information management, 2011, vol. 19, no. 2, pp. 65.
KOHN, Nils, Simon B. EICKHOFF, M. SCHELLER, Angela R. LAIRD, Peter T.
FOX, and Ute HABEL. "Neural network of cognitive emotion regulation—
an ALE meta-analysis and MACM analysis." Neuroimage 87 (2014): 345-
355.
KOTSIANTIS, Sotiris B., I. ZAHARAKIS, and P. PINTELAS. "Supervised
machine learning: A review of classification techniques." (2007): 3-24.
KOVAL, Oksana, Stephen NABARESEH, Petr KLIMEK, and Felicita
CHROMJAKOVA. "Demographic preferences towards careers in shared
service centers: A factor analysis." Journal of Business Research (2016),
http://dx.doi.org/10.1016/j.jbusres.2016.04.033.
LI, Deren, Shuliang WANG, and Deyi LI. Spatial Data Mining: Theory and
Application. Springer, 2016.
LIANG, Yi-Hui. "Integration of data mining technologies to analyze customer
value for the automotive maintenance industry." Expert systems with
Applications 37, no. 12 (2010): 7489-7496.
LINOFF, Gordon S., and Michael JA BERRY. Data mining techniques: for
marketing, sales, and customer relationship management. John Wiley &
Sons, 2011.
MADHURI V. J. Data Mining and Business Intelligence Applications in
Telecommunication. Industry International Journal of Engineering and
Advanced Technology (IJEAT), 2013, vol. 2, no. 3, pp. 525-528.
MATTHEE, K. W., Gregory MWEEMBA, Adrian V. PAIS, Gertjan Van STAM,
and Marijn RIJKEN. "Bringing Internet connectivity to rural Zambia using a
collaborative approach." In Information and Communication Technologies
and Development, 2007. ICTD 2007. International Conference on, pp. 1-12.
IEEE, 2007.
Page 98
98
MICHALSKI, Ryszard S., Jaime G. Carbonell, and Tom M. MITCHELL, eds.
Machine learning: An artificial intelligence approach. Springer Science &
Business Media, 2013.
MIYAMOTO, Sadaaki. Fuzzy sets in information retrieval and cluster analysis.
Vol. 4. Springer Science & Business Media, 2012.
MOHAMMADI, Golshan, Reza TAVAKKOLI-MOGHADDAM, and Mehrdad
MOHAMMADI. "Hierarchical neural regression models for customer churn
prediction." Journal of Engineering 2013 (2013).
MORANDAT, Floréal, Brandon HILL, Leo OSVALD, and Jan VITEK.
"Evaluating the design of the R language." In European Conference on
Object-Oriented Programming, pp. 104-131. Springer Berlin Heidelberg,
2012.
MUJA, Marius, and David G. LOWE. "Fast Approximate Nearest Neighbors with
Automatic Algorithm Configuration." VISAPP (1) 2, no. 331-340 (2009): 2.
NABARESEH, Stephen, Christian Nedu OSAKWE, Eric AFFUL-DADZIE, Petr
KLÍMEK, and Miloslava CHOVANCOVÁ. Exploring roles of females in
contemporary socio-politico-economic governance: An association rule
approach. Mediterranean Journal of Social Sciences, 2014, vol. 5, no. 23, pp.
2178.
NABARESEH, Stephen, Eric AFFUL-DADZIE and Petr KLÍMEK. "Security on
Electronic Transactions in Developing Countries: A Cluster and Decision
Tree Mining Approach." In Proceedings of the 5th International Conference
on IS Management and Evaluation 2015: ICIME 2015, p. 85. Academic
Conferences Limited, 2015.
NABARESEH, Stephen, Eric AFFUL-DADZIE, Michael A. KWARTENG, Petr
KLÍMEK, and Michal PILÍK. “Clustering and Predicting Electronic
Commerce Security Concerns of Developing Countries.” In Proceedings of
the 3rd International Conference on Finance and Economics 2016: ICFE
2016, p. 353. Tomas Bata University in Zlin, 2016.
NANDA, Sohag Sundar, Soumya MISHRA, and Sanghamitra MOHANTY.
"Oriya Language Text Mining Using C5. 0 Algorithm." IJCSIT) International
Journal of Computer Science and Information Technologies 2, no. 1 (2011):
551-554.
NCA 2013. “Cellular mobile consumer satisfaction survey 2012/13,” issued in
September 2013. Available at: http://www.nca.org.gh/industry-data-
2/reports-2/research-reports-2/, accessed 1/11/2016.
Page 99
99
NCA 2016. “Industry information: Telecom subscriptions for August 2016,”
issued on October 10, 2016. Available at: http://www.nca.org.gh/industry-
data-2/market-share-statistics-2/voice-2/, accessed 30/10/2016.
NCA-Ghana [online]. “Mobile Number Portability at three years”. ©2014.
Available at: http://www.nca.org.gh/73/34/News.html?item=387, accessed
5/10/2014.
NEFESLIOGLU, H. A., C. GOKCEOGLU, and H. SONMEZ. An assessment on
the use of logistic regression and artificial neural networks with different
sampling strategies for the preparation of landslide susceptibility maps.
Engineering Geology, 2008, vol. 97, no. 3, pp. 171-191.
NGAI, E. W. T., Yong HU, Y. H. WONG, Yijun CHEN, and Xin SUN. "The
application of data mining techniques in financial fraud detection: A
classification framework and an academic review of literature." Decision
Support Systems 50, no. 3 (2011): 559-569.
NGAI, Eric WT, Li XIU, and Dorothy CK CHAU. "Application of data mining
techniques in customer relationship management: A literature review and
classification." Expert systems with applications 36, no. 2 (2009): 2592-2602.
OLIVER, Jonathan J., and David J. HAND. "On pruning and averaging decision
trees." In Machine Learning: Proceedings of the Twelfth International
Conference, pp. 430-437. 2016.
OLLE, Georges D. Olle, and Shuqin CAI. "A hybrid churn prediction model in
Mobile telecommunication industry." International Journal of e-Education,
e-Business, e-Management and e-Learning 4, no. 1 (2014): 55.
OLSON, David L., and Dursun DELEN. Advanced data mining techniques.
Springer Science & Business Media, 2008.
OLSON, David Louis, and Yong SHI. Introduction to business data mining. Vol.
10. Englewood Cliffs: McGraw-Hill/Irwin, 2007.
OSBORNE, Jason W., and Anna B. COSTELLO. "Best practices in exploratory
factor analysis: Four recommendations for getting the most from your
analysis." Pan-Pacific Management Review 12, no. 2 (2009): 131-146.
OWCZARCZUK, Marcin. "Churn models for prepaid customers in the cellular
telecommunication industry using large data marts." Expert Systems with
Applications 37, no. 6 (2010): 4710-4712.
PALANIAPPAN, Ramaswamy, and Danilo P. MANDIC. "EEG based biometric
framework for automatic identity verification." The Journal of VLSI Signal
Processing Systems for Signal, Image, and Video Technology 49, no. 2
(2007): 243-250.
Page 100
100
PANDYA, Rutvija, and Jayati PANDYA. "C5. 0 algorithm to improved decision
tree with feature selection and reduced error pruning." International Journal
of Computer Applications 117, no. 16 (2015).
PANG, Su-lin, and Ji-zhang GONG. "C5. 0 classification algorithm and
application on individual credit evaluation of banks." Systems Engineering-
Theory & Practice 29, no. 12 (2009): 94-104.
PARK, Young A., and Ulrike GRETZEL. "Influence of consumers' online
decision-making style on comparison shopping proneness and perceived
usefulness of comparison shopping tools." Journal of Electronic Commerce
Research 11, no. 4 (2010): 342.
PENG, Yi, Gang KOU, Yong SHI, and Zhengxin CHEN. "A descriptive
framework for the field of data mining and knowledge discovery."
International Journal of Information Technology & Decision Making 7, no.
04 (2008): 639-682.
PHAM, Viet-Thanh, C. VOLOS, S. JAFARI, Xiong WANG, and Sundarapandian
VAIDYANATHAN. "Hidden hyperchaotic attractor in a novel simple
memristive neural network." Optoelectronics and Advanced Materials, Rapid
Communications 8, no. 11-12 (2014): 1157-1163.
PHUA, Clifton, Vincent LEE, Kate SMITH, and Ross GAYLER. "A
comprehensive survey of data mining-based fraud detection research." arXiv
preprint arXiv:1009.6119 (2010).
PRATIM Roy, Partha, Somnath PAUL, Indrani MITRA, and Kunal ROY. "On
two novel parameters for validation of predictive QSAR models." Molecules
14, no. 5 (2009): 1660-1701.
RAGHUPATHI, Wullianallur, and Viju RAGHUPATHI. "Big data analytics in
healthcare: promise and potential." Health Information Science and Systems
2, no. 1 (2014): 1.
REICHHELD, Fred. The microeconomics of customer relationships. MIT Sloan
Management Review, 2006, vol. 47, no. 2, pp. 73-78.
REZGUI, Yacine. "Knowledge systems and value creation: an action research
investigation." Industrial Management & Data Systems 107, no. 2 (2007):
166-182.
SANTOURIDIS, Ilias, and Panagiotis TRIVELLAS. "Investigating the impact of
service quality and customer satisfaction on customer loyalty in mobile
telephony in Greece." The TQM Journal 22, no. 3 (2010): 330-343.
SARADHI, V. Vijaya, and Girish Keshav PALSHIKAR. "Employee churn
prediction." Expert Systems with Applications 38, no. 3 (2011): 1999-2006.
Page 101
101
SCHMID, Helmut. "Probabilistic part-ofispeech tagging using decision trees." In
New methods in language processing, p. 154. Routledge, 2013.
SHARMA, Anuj, Dr PANIGRAHI, and Prabin KUMAR. "A neural network
based approach for predicting customer churn in cellular network services."
arXiv preprint arXiv:1309.3945 (2013).
SHMUELI, Galit, Nitin R. PATEL, and Peter C. BRUCE. Data Mining for
Business Analytics: Concepts, Techniques, and Applications in XLMiner.
John Wiley & Sons, 2016.
SIEGEL, Eric. Predictive analytics: The power to predict who will click, buy, lie,
or die. John Wiley & Sons, 2013.
SIRGY, M. Joseph. "The Self-concept in relation to product preference and
purchase intention." In Marketing Horizons: A 1980's Perspective, pp. 350-
354. Springer International Publishing, 2015.
SMITH, D. (2012). R Tops Data Mining Software Poll, Java Developers Journal.
(Available at: http://java.sys-con.com/node/2288420, accessed on 14/05/16).
SRINIVAS, K., B. Kavihta RANI, and A. GOVRDHAN. "Applications of data
mining techniques in healthcare and prediction of heart attacks."
International Journal on Computer Science and Engineering (IJCSE) 2, no.
02 (2010): 250-255.
STATISTA, the statistics portal. “Average monthly churn rate for wireless carriers
in the United States from 1st quarter 2013 to 2nd quarter 2016.” Available at:
https://www.statista.com/statistics/283511/average-monthly-churn-rate-top-
wireless-carriers-us/, (2016), accessed on 30/10/2016.
SUZUKI, Ryota, and Hidetoshi SHIMODAIRA. "Pvclust: an R package for
assessing the uncertainty in hierarchical clustering." Bioinformatics 22, no.
12 (2006): 1540-1542.
TCHAO, E. T., Willie K. OFOSU, and Kwesi DIAWUO. "Radio Planning and
Field Trial Measurement of a Deployed 4G WiMAX Network in an Urban
Sub-Saharan African Environment." International Journal of
Interdisciplinary Telecommunications and Networking (IJITN) 5, no. 3
(2013): 1-10.
TELECOMS EN. “Ghana’s Mobile Number Portability scheme outstrips South
Africa, Kenya and Nigeria.” Issue no 721 29th August 2014, available at:
http://www.balancingact-africa.com/news/telecoms-en/31526/ghanas-
mobile-number-portability-scheme-outstrips-south-africa-kenya-and-
nigeria, accessed on 01/11/2016.
THEARLING, Kurt. "Data Mining for CRM." In Data Mining and Knowledge
Discovery Handbook, pp. 1181-1188. Springer US, 2009.
Page 102
102
T-MOBILE, “Q1 2016: T-Mobile announces satisfactory results.” Available at:
https://www.t-press.cz/en/press-releases/press-news-archive/q1-2016-t-
mobile-announces-satisfactory-results.html, (2016), accessed on 30/10/2016.
TOLL, D. B., K. J. M. JANSSEN, Y. VERGOUWE, and K. G. M. MOONS.
"Validation, updating and impact of clinical prediction rules: a review."
Journal of clinical epidemiology 61, no. 11 (2008): 1085-1094.
TREINEN, James J., and Ramakrishna THURIMELLA. "A framework for the
application of association rule mining in large intrusion detection
infrastructures." In International Workshop on Recent Advances in Intrusion
Detection, pp. 1-18. Springer Berlin Heidelberg, 2006.
TSAI, Chih-Fong, and Yu-Hsin LU. "Customer churn prediction by hybrid neural
networks." Expert Systems with Applications 36, no. 10 (2009): 12547-12553.
TSO, Geoffrey KF, and Kelvin KW YAU. Predicting electricity energy
consumption: A comparison of regression analysis, decision tree and neural
networks. Energy, 2007, vol. 32, no. 9, pp. 1761-1768.
UNCTAD [online]. Services sector holds key to developing countries’ growth.
©2012 [viewed 18/04/2014]. Available at:
http://unctad.org/en/pages/newsdetails.aspx?OriginalVersionID=68.
VERBEKE, Wouter, David MARTENS, Christophe MUES, and Bart BAESENS.
"Building comprehensible customer churn prediction models with advanced
rule induction techniques." Expert Systems with Applications 38, no. 3 (2011):
2354-2364.
VERMA, Manish, Mauly SRIVASTAVA, Neha CHACK, Atul Kumar DISWAR,
and Nidhi GUPTA. "A comparative study of various clustering algorithms in
data mining." International Journal of Engineering Research and
Applications (IJERA) 2, no. 3 (2012): 1379-1384.
WALLER, Matthew A., and Stanley E. FAWCETT. "Data science, predictive
analytics, and big data: a revolution that will transform supply chain design
and management." Journal of Business Logistics 34, no. 2 (2013): 77-84.
WANG, Yi-Fan, Ding-An CHIANG, Mei-Hua HSU, Cheng-Jung LIN, and I-
Long LIN. "A recommender system to avoid customer churn: A case study."
Expert Systems with Applications 36, no. 4 (2009): 8071-8075.
WU, Michael C., Seunggeun LEE, Tianxi CAI, Yun LI, Michael BOEHNKE, and
Xihong LIN. "Rare-variant association testing for sequencing data with the
sequence kernel association test." The American Journal of Human Genetics
89, no. 1 (2011): 82-93.
Page 103
103
WU, Xindong, Xingquan ZHU, Gong-Qing WU, and Wei DING. "Data mining
with big data." IEEE transactions on knowledge and data engineering 26, no.
1 (2014): 97-107.
XHEMALI, Daniela, Chris J. HINDE, and Roger G. STONE. "Naive Bayes vs.
decision trees vs. neural networks in the classification of training web pages."
(2009).
XIA, Guo-en, and Wei-dong JIN. Model of customer churn prediction on support
vector machine. Systems Engineering-Theory & Practice, 2008, vol. 28, no.
1, pp. 71-77.
XIAO, Jin, Ling XIE, Changzheng HE, and Xiaoyi JIANG. "Dynamic classifier
ensemble model for customer classification with imbalanced class
distribution." Expert Systems with Applications 39, no. 3 (2012): 3668-3675.
XIUHONG, L. I., Jennifer M. BUECHNER, Patrick M. TARWATER, and Alvaro
MUnoz. Statistical Computing and Graphics. The American Statistician,
2003, vol. 57, no. 3, pp.1, DOI: 10.1198/0003130031883
ZHANG, Xiaohang, Ji ZHU, Shuhua XU, and Yan WAN. "Predicting customer
churn through interpersonal influence." Knowledge-Based Systems 28 (2012):
97-104.
ZHAO, Qinpei, Ville HAUTAMAKI, and Pasi FRÄNTI. "Knee point detection in
BIC for detecting the number of clusters." In International Conference on
Advanced Concepts for Intelligent Vision Systems, pp. 664-673. Springer
Berlin Heidelberg, 2008.
Page 104
104
List of Publications
The following section presents a summary of the researcher’s publication
activities. In Table 30 is a breakdown of the author’s number of publications in
impacted journals indexed in Web of Science (ISI) and Scopus, together with
book chapters and conference papers. In addition is a full list of all the selected
publications.
The following is the list of selected publications in reference format.
Complete overview
Table 30: Publications as at 31.01.2017
Impacted journals 4
Scopus Journals 6
Conference papers 13
Book chapters 3
Total 26
Impacted journals
Afful-Dadzie, Eric, Stephen NABARESEH, Anthony Afful-Dadzie, and Zuzana
Komínková Oplatková. "A fuzzy TOPSIS framework for selecting fragile
states for support facility." Quality & Quantity 49, no. 5 (2015): 1835-1855.
Afful-Dadzie, Anthony, Eric Afful-Dadzie, Stephen NABARESEH, and Zuzana
Komínková Oplatková. "Tracking progress of African Peer Review
Mechanism (APRM) using fuzzy comprehensive evaluation method."
Kybernetes 43, no. 8 (2014): 1193-1208.
Koval, Oksana, Stephen NABARESEH, Petr Klimek, and Felicita Chromjakova.
"Demographic preferences towards careers in shared service centers: A
factor analysis." Journal of Business Research (2016).
Afful‐Dadzie, Eric, Stephen NABARESEH, Zuzana Komínková Oplatková, and
Petr Klímek. "Model for Assessing Quality of Online Health Information:
A Fuzzy VIKOR Based Method." Journal of Multi‐Criteria Decision
Analysis (2015).
Scopus journals
NABARESEH, Stephen, and Christian Nedu Osakwe. "Can business-to-
Consumer electronic commerce be a game-changer in Anglophone West
African countries? Insights from secondary data and consumers'
Page 105
105
perspectives." World Applied Sciences Journal 30, no. 11 (2014): 1515-
1525.
NABARESEH, Stephen, Christian Nedu Osakwe, Petr Klímek, and Miloslava
Chovancová. "A comparative study of consumers’ readiness for internet
shopping in two African emerging economies: Some preliminary Findings."
Mediterranean Journal of Social Sciences 5, no. 23 (2014): 1882.
NABARESEH, Stephen, Christian Nedu Osakwe, Eric Afful-Dadzie, Petr
Klímek, and Miloslava Chovancová. "Exploring Roles of Females in
Contemporary Socio-Politico-Economic Governance: An Association Rule
Approach." Mediterranean Journal of Social Sciences 5, no. 23 (2014):
2178.
Afful-Dadzie, Eric, Zuzana Komínková Oplatková, and Stephen NABARESEH.
"Selecting Start-Up Businesses in a Public Venture Capital Financing using
Fuzzy PROMETHEE." Procedia Computer Science 60 (2015): 63-72.
Saha, Anusua, and Stephen NABARESEH. "Communicating Corporate Social
Responsibilities: Using Text Mining for a Comparative Analysis of Banks
in India and Ghana." Mediterranean Journal of Social Sciences 6, no. 3 S1
(2015): 11.
Afful-Dadzie, Eric, Stephen NABARESEH, Zuzana Komínková Oplatková, and
Peter Klimek. "Using Fuzzy PROMETHEE to Select Countries for
Developmental Aid." Studies in Computational Intelligence 650, (2016):
109-132.
Conference papers
NABARESEH, Stephen, Eric Afful-Dadzie, Michael Adu Kwarteng, Petr
Klímek. A bibliometric study of the research output of visegrad countries.
In Proceedings of the 13th International Conference on Applied Computing
2016, 13(8), pp. 171-178. IADIS, 2016.
Afful-Dadzie, Eric, Stephen NABARESEH, and Zuzana Komínková Oplatková.
"Fuzzy VIKOR approach: Evaluating quality of internet health
information." In Computer Science and Information Systems (FedCSIS),
2014 Federated Conference on, pp. 183-190. IEEE, 2014.
Afful-Dadzie, Eric, Stephen NABARESEH, Zuzana Komínková Oplatková, and
Petr Klímek. "Enterprise Competitive Analysis and Consumer Sentiments
on Social Media."
NABARESEH, Stephen, and Eric Afful Dadzie and Petr Klímek. "Security on
Electronic Transactions in Developing Countries: A Cluster and Decision
Tree Mining Approach." In Proceedings of the 5th International Conference
Page 106
106
on IS Management and Evaluation 2015: ICIME 2015, p. 85. Academic
Conferences Limited, 2015.
NABARESEH, Stephen, Vladyslav Vlasov, Petr Klimek and Felicita
Chromjakova. “Mining interestingness patterns on lean six sigma for
process and product optimisation." In proceedings of the 3rd international
Conference on Finance and Economics, Vietnam 2016, Vol. 3, pp. 380 –
393. Tomas Bata University in Zlin, 2016.
NABARESEH, Stephen, Eric Afful-Dadzie, Zuzana Komínková Oplatková, and
Peter Klimek. "Selecting countries for developmental aid programs using
fuzzy PROMETHEE." In SAI Intelligent Systems Conference (IntelliSys),
2015, pp. 239-244. IEEE, 2015.
NABARESEH, Stephen, Eric Afful-Dadzie, Michael Adu Kwarteng, Petr
Klimek and Michal Pilik. “Clustering and predicting electronic commerce
security concerns of developing countries.” In Proceedings of the 3rd
international Conference on Finance and Economics, Vietnam 2016, Vol.
3, pp. 353 – 378. Tomas Bata University in Zlin, 2016.
Afful-Dadzie, Eric, Stephen NABARESEH, Petr Klímek, and Zuzana
Komínková Oplatková. "Ranking fragile states for support facility: A fuzzy
topsis approach." In Fuzzy Systems and Knowledge Discovery (FSKD),
2014 11th International Conference on, pp. 255-261. IEEE, 2014.
Agu, Monica N., Stephen NABARESEH, and Christian Nedu Osakwe.
"Investigating Web Based Marketing in the Context of Micro and Small-
Scale Enterprises (MSEs): A Decision Tree Classification Technique."
NABARESEH, Stephen, Oksana Koval, Petr Klimek and Felicita Chromjakova.
“Does brand value influence attitudes towards careers in shared service
companies? A study of students in the czech republic.” In Proceedings of
the 3rd international Conference on Finance and Economics, Vietnam
2016, Vol. 3, pp. 366 – 379. Tomas Bata University in Zlin, 2016.
NABARESEH, Stephen, and Petr KLÍMEK. “Developing a hybrid model for
data mining, holistic and knowledge management to enhance business
administration.” In DOKBAT 2015: 11th Annual DOKBAT – International
Bata Conference for Ph.D. Students and Young Researchers, 2015.
Afful-Dadzie, Eric, Stephen NABARESEH, Zuzana Komínková Oplatková, and
Petr Klímek. "Framing Media Coverage of the 2014 Sony Pictures
Entertainment Hack: A Topic Modelling Approach." In 11th International
Conference on Cyber Warfare and Security: ICCWS2016, p. 1. Academic
Conferences and publishing limited, 2016.
Page 107
107
Koval Oksana Petrivna, NABARESEH Stephen. “Czech Students’ Perceptions
of Careers in the Shared Services Industry.” In International Conference on
Industrial Engineering and Operations Management, 2016, pp. 258-266.
Afful-Dadzie, Eric, Zuzana Komínková Oplatková, Stephen NABARESEH, and
Roman Šenkeřík. "Selecting Start-up Businesses in a Public Venture Capital
with Intuitionistic Fuzzy TOPSIS." In Proceedings of the World Congress
on Engineering and Computer Science, vol. 1. 2015.
Book chapter
Afful-Dadzie, Eric, Stephen NABARESEH, and Zuzana Komínková Oplatková.
"Patterns and Trends in the Concept of Green Economy: A Text Mining
Approach." In Modern Trends and Techniques in Computer Science, pp.
143-154. Springer International Publishing, 2014.
Afful-Dadzie, Eric, Zuzana Komínková Oplatková, Stephen NABARESEH, and
Michael Adu-Kwarteng. "Development aid decision making framework
based on hybrid MCDM." In Intelligent Decision Technologies 2016, pp.
255-266. Springer International Publishing, 2016.
Page 108
108
Curriculum Vitae
Personal data First name / Surname Stephen Nabareseh
Address Nam. T.G Masaryka 3050, 76001-Zlin Telephone(s) +420 777 317137 (personal) Email(s) [email protected] (personal)
[email protected] (work)
Nationality Ghanaian
Education and training
Dates 2013 – present
Title of qualification awarded Ph.D.
Principal subject
Name of educational institution
Data mining
Tomas Bata University in Zlín, Faculty of Management and
Economics, Department of Statistics and Quantitative Methods
Dates June 2016 to July 2016
Title of qualification awarded Certificate
Principal subjects Tax Analysis and Revenue Forecasting
Name of educational institution Duke University, United States of America
Dates 2011 – 2013 Title of qualification awarded Ing. (MSc.)
Principal subjects
Name of educational institution
Systems Engineering and Informatics
Czech University of Life Sciences Prague
(Česká zemědělská univerzita v Praze)
Dates 2009 – 2013 Title of qualification awarded MBA
Principal subject General Management
Name of educational institution Central University – Ghana
Dates Title of qualification awarded
Principal subject
Name of educational institution
Work/professional
experience Dates
Establishment Activity
2001 – 2005
B.Ed
Mathematics
University of Education, Winneba – Ghana
Feb. 2014 to date
Tomas Bata University, Faculty of Management and Economics
Lecturer for Managerial Decision Making
Page 109
109
Dates 2006 - 2012
Establishment Ghana Revenue Authority Activity Tax administrator
Software knowledge R software RapidMiner Stata Statistica IBM SPSS Modeler and statistics SAS Gretl
Language proficiency English Reading – Advanced Writing – Advanced Speaking - Advanced
References Doc. Ing. Petr Klimek, PhD
PhD Supervisor, Faculty of Management and Economics Department of Statistics and Quantitative Methods Tomas Bata University in Zlin, Czech Republic Email: [email protected] Ing. Ulman Milos, PhD Faculty of Economics and Management Deputy Head, Information Technology Department CZU, Prague Email: [email protected] Doc. Ing Adriana Knapkova, PhD Vice Rector Social Services Tomas Bata University in Zlin, Czech Republic Email: [email protected]
.
Page 110
110
Appendices
Appendix A: Training Questionnaire
*Required
1. Gender * Mark only one
a. Male
b. Female
2. Age (please state) *
………………………………….
3. Occupation * Mark only one
a. Student
b. Self-employed
c. Public sector
d. Private sector
e. Unemployed
f. Other:…………………………
4. Highest educational level * High school certificate is whether Junior or Senior High school
Mark only one
a. Basic School
b. High School certificate
c. Bachelor's degree
d. Master's degree
e. Doctoral degree
f. Other:…………………….
5. In which region are you located? * Mark only one
a. Greater Accra
b. Ashanti
c. Volta
d. Northern
e. Upper East
f. Western
g. Central
h. Upper West
i. Brong Ahafo
Page 111
111
j. Eastern
6. How many mobile networks are you connected to? * Mark only one
a. 1
b. 2
c. 3
d. 4
e. Other:…………………….
7. Which of the mobile networks do you use often? * Mark only one
a. MTN
b. Vodafone
c. Tigo
d. Airtel
e. Glo
f. Kasapa
8. How long have you been using this network? * Mark only one
a. Less than a year
b. 1 - 3
c. 4 - 6
d. 7 - 9
e. Above 10
9. Do you use the same network for both voice and data? * Mark only one
a. Yes
b. No
10. Have you ever ported/changed your network? * Mark only one
a. Yes Skip to question 11.
b. No Skip to question 14.
Answer this section if YES to question 10
11. If Yes, which of the networks did you port (leave)? Mark only one
a. MTN
b. Vodafone
c. Tigo
d. Airtel
Page 112
112
e. Kasapa
f. Glo
12. If Yes, Which network did you port to? Mark only one
a. MTN
b. Vodafone
c. Tigo
d. Airtel
e. Kasapa
f. Glo
13. If Yes, why did you port/change your network? Mark only one
a. Because of high call tariffs (costs)
b. Because of call drops (network problems)
c. Because of high data charges (costs)
d. Because i don't get network connection in some places
e. Because the mobile network does not have the product/service i need
f. Because the new network gives a lot of freebies
g. Other:…………………………………..
Answer this section if NO to question 10
14. If No, Why have you not ported/changed your network? Mark only one
a. The products are good
b. The call rates are low
c. The data plan is good for me
d. Network connection is everywhere
e. Other:………………………………..
15. If No, what will propel you to port your number? Mark only one
a. New product promotion by another company
b. Offer of low call tariffs (costs) by another company
c. Offer of low internet data tariffs (costs) by another company
d. Offer of relatively better customer service
e. Offer of relatively better call service (network problems)
f. The corporate image of the new company
g. Other:………………………………..
Continue on next section
Page 113
113
16. How often do you buy call credit? * Mark only one
a. Daily
b. Weekly
c. Monthly
d. Other:…………………………..
17. How often do you buy data bundles? * Mark only one
a. Daily
b. Weekly
c. Monthly
d. Other:……………………………
18. How much approximately do you spend on call credit a month? (Please state in
GH¢)*
………………………………………………………………
19. How much approximately do you spend on data bundle a month? (Please state
in GH¢) *
………………………………………………………………
20. What do you mostly use your mobile phone for? * Mark only one
a. Personal calls
b. Business calls
c. Both personal and business calls
d. Browsing
e. Other:……………………………
Rank the Telcos using 0 as not sure, 1 as the highest rank and 5 the lowest rank
Mark only one box per row.
21. Connectivity *
0 1 2 3 4 5
MTN
Vodafone
Tigo
Airtel
Kasapa
Glo
Page 114
114
22. Call rates (cost) *
0 1 2 3 4 5
MTN
Vodafone
Tigo
Airtel
Kasapa
Glo
23. Stability of network *
0 1 2 3 4 5
MTN
Vodafone
Tigo
Airtel
Kasapa
Glo
24. Reliability of network *
0 1 2 3 4 5
MTN
Vodafone
Tigo
Airtel
Kasapa
Glo
25. Roaming charges *
0 1 2 3 4 5
MTN
Vodafone
Tigo
Airtel
Kasapa
Glo
Page 115
115
26. Quality of calls *
0 1 2 3 4 5
MTN
Vodafone
Tigo
Airtel
Kasapa
Glo
27. Customer service *
0 1 2 3 4 5
MTN
Vodafone
Tigo
Airtel
Kasapa
Glo
28. Which of the following products/services do you prefer? * Please rank them by order of preference (1 - low preference, 5 - Very high preference)
Mark only one box per row.
1 2 3 4 5
Voice call plans
Data bundles
Mobile money Roaming
Backup service
Fixed broadband
Promotions
29. Is product innovation necessary for your loyalty to a telecommunication
network? * Mark only one
a. Yes
b. No
c. Not sure
Page 116
116
30. Which type of customer are you to the network you use often? * Mark only one
a. Pre-paid
b. Post-paid
c. Other:……………………………….
31. What is your general view of services rendered by mobile networks in Ghana?
*
………………………………………………………………………………………
………………………………………………………………………………………
………………………………………………………………………………………
Page 117
117
Appendix B: Testing Questionnaire
*Required
1. Gender * Mark only one
c. Male
d. Female
2. Age (please state) *
………………………………….
3. Occupation * Mark only one
g. Student
h. Self-employed
i. Public sector
j. Private sector
k. Unemployed
l. Other:…………………………
4. Highest educational level * High school certificate is whether Junior or Senior High school
Mark only one
g. Basic School
h. High School certificate
i. Bachelor's degree
j. Master's degree
k. Doctoral degree
l. Other:…………………….
5. In which region are you located? * Mark only one
k. Greater Accra
l. Ashanti
m. Volta
n. Northern
o. Upper East
p. Western
q. Central
r. Upper West
s. Brong Ahafo
t. Eastern
Page 118
118
6. How many mobile networks are you connected to? * Mark only one
f. 1
g. 2
h. 3
i. 4
j. Other:…………………….
7. Which of the mobile networks do you use often? * Mark only one
g. MTN
h. Vodafone
i. Tigo
j. Airtel
k. Glo
l. Kasapa
8. How long have you been using this network? * Mark only one
f. Less than a year
g. 1 - 3
h. 4 - 6
i. 7 - 9
j. Above 10
9. Do you use the same network for both voice and data? * Mark only one
c. Yes
d. No
10. How often do you buy call credit? * Mark only one
e. Daily
f. Weekly
g. Monthly
h. Other:…………………………
11. How often do you buy data bundles? * Mark only one
e. Daily
f. Weekly
g. Monthly
h. Other:…………………………….
Page 119
119
12. How much approximately do you spend on call credit a month? (Please state in
GH¢)*
………………………………………………………………
13. How much approximately do you spend on data bundle a month? (Please state
in GH¢) *
………………………………………………………………
14. What do you mostly use your mobile phone for? * Mark only one
f. Personal calls
g. Business calls
h. Both personal and business calls
i. Browsing
j. Other:………………………….
Rank the Telcos using 0 as not sure, 1 as the highest rank and 5 the lowest rank
Mark only one box per row.
15. Connectivity *
0 1 2 3 4 5
MTN
Vodafone
Tigo
Airtel
Kasapa
Glo
16. Call rates (cost) *
0 1 2 3 4 5
MTN
Vodafone
Tigo
Airtel
Kasapa
Glo
Page 120
120
17. Stability of network *
0 1 2 3 4 5
MTN
Vodafone
Tigo
Airtel
Kasapa
Glo
18. Reliability of network *
0 1 2 3 4 5
MTN
Vodafone
Tigo
Airtel
Kasapa
Glo
19. Roaming charges *
0 1 2 3 4 5
MTN
Vodafone
Tigo
Airtel
Kasapa
Glo
20. Quality of calls *
0 1 2 3 4 5
MTN
Vodafone
Tigo
Airtel
Kasapa
Glo
Page 121
121
21. Customer service *
0 1 2 3 4 5
MTN
Vodafone
Tigo
Airtel
Kasapa
Glo
22. Which of the following products/services do you prefer? * Please rank them by order of preference (1 - low preference, 5 - Very high preference)
Mark only one box per row.
1 2 3 4 5
Voice call plans
Data bundles
Mobile money Roaming
Backup service
Fixed broadband
Promotions
23. Is product innovation necessary for your loyalty to a telecommunication
network? * Mark only one
d. Yes
e. No
f. Not sure
24. Which type of customer are you to the network you use often? * Mark only one
d. Pre-paid
e. Post-paid
f. Other:……………………………..
25. What is your general view of services rendered by mobile networks in Ghana?
*
………………………………………………………………………………………
………………………………………………………………………………………
………………………………………………………………………………………
Page 122
122
Declaration:
I do here by declare that all the information given by me above is true and correct.
Place Zlin, Czech Republic
Date 31.01.2017 (Stephen Nabareseh)
Page 123
Ing. Stephen Nabareseh
Predictive analytics: a data mining technique in customer churn
management for decision making
Prediktivní analytika: technika data miningu pro rozhodování s
využitím v řízení odchodu zákazníků
Doctoral Thesis
Published by: Tomas Bata University in Zlín, nám.
T. G. Masaryka 5555, 760 01 Zlín.
Number of copies:
Typesetting by: Ing. Stephen Nabareseh
This publication underwent no proof reading or editorial review.
Publication year: 2017
ISBN 978-80-…………….