S]i|f,ei;agev Lalj^atdry, S ^ i ? ? | ^ , l|||^fiage, l i l f e 111 1TH fe i : Stevenage (0438) 2444
WRC ENGINEERING CiNfRE Empire House, P O (Box 85, Clarence Street, Swindon, Wilts. SN1 W&
WMGHSmn^wSf^S-.
X5J-1nM-7<}3
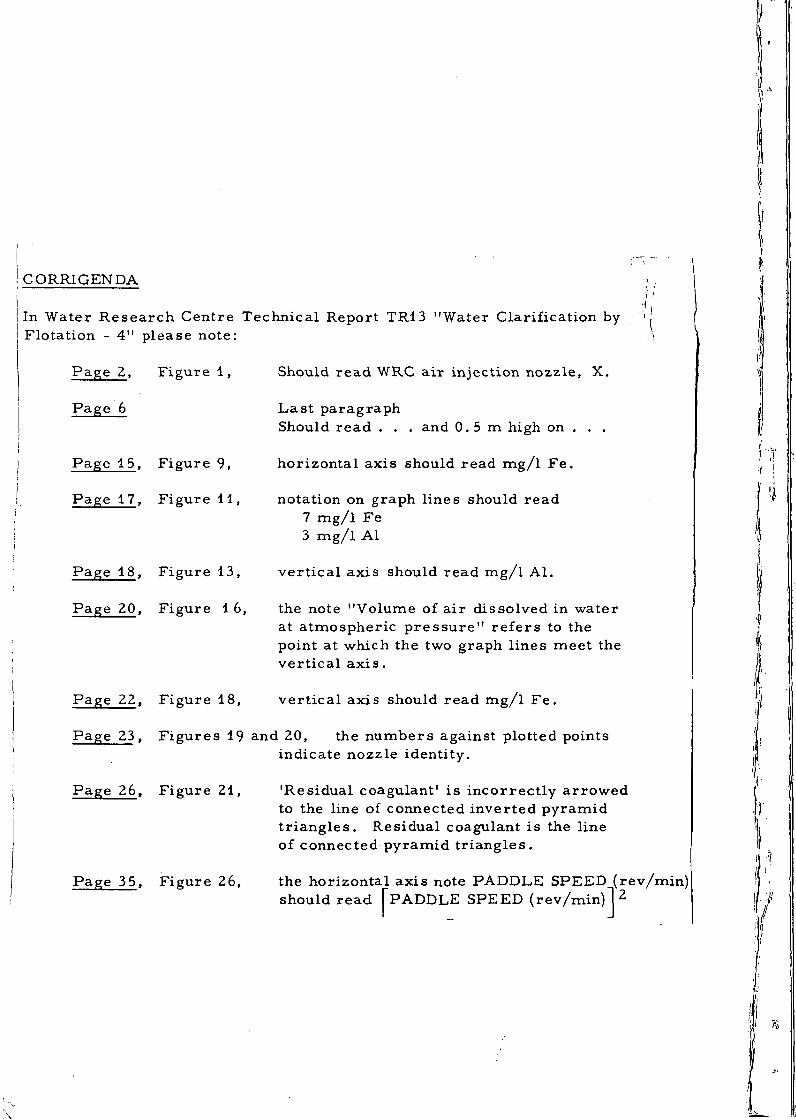
I CORRIGENDA
In Water R e s e a r c h Centre Technical Report TR13 "Water Clarification by-Flotation - 4" please note:
Page 2, F igure 1,
Page 6
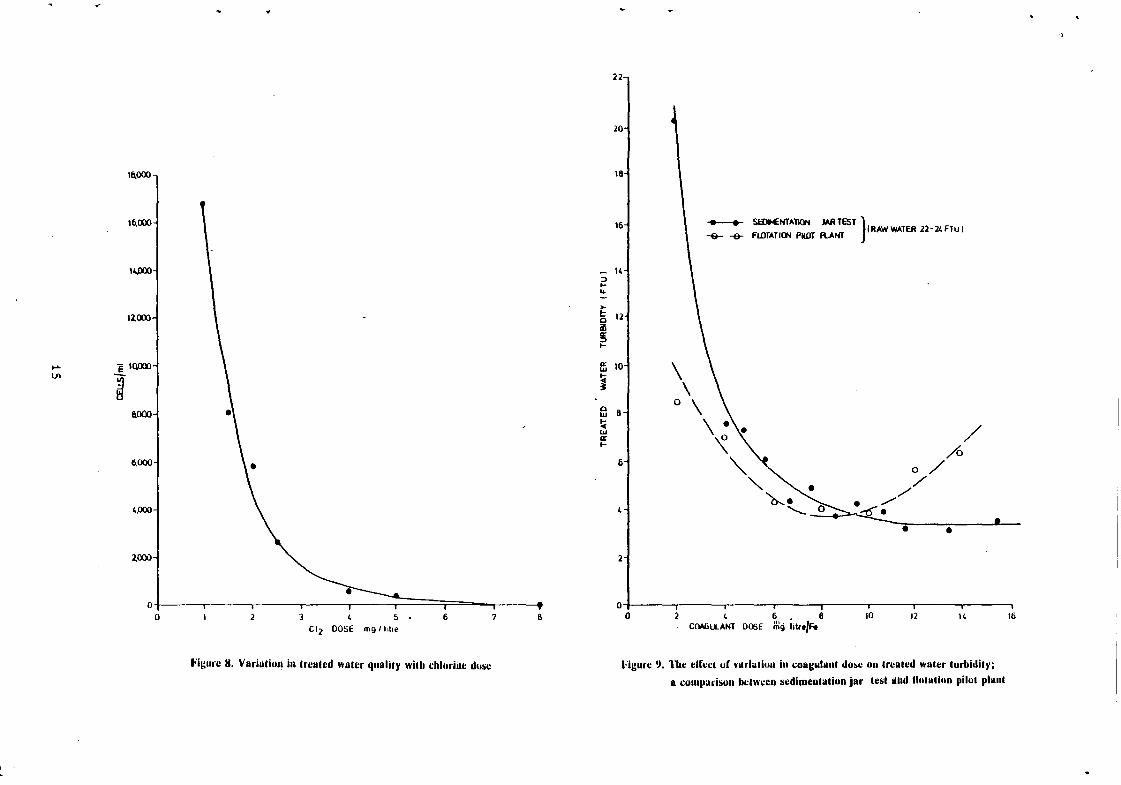
Page 15, F igure 9,
Page 17, F igure 11 ,
Page 18, F igure 13,
Page 20, F igure 1 6,
Should r ead WRC air injection nozzle, X.
Las t paragraph Should r ead . . . and 0.5 m high on . . .
hor izontal axis should read m g / l F e .
notation on graph lines should read 7 m g / l Fe 3 m g / l Al
ver t i ca l axis should read m g / l Al .
the note "Volume of a i r dissolved in water at a tmospher ic p r e s s u r e " re fe r s to the point at which the two graph l ines meet the ver t i ca l a x i s .
Page 22, F igure 18, ver t i ca l axis should read m g / l F e .
Page 23 , F igu re s 19 and 20, the number s against plotted points indicate nozzle identi ty.
Page 26, F igure 21 ,
Page 35, F igure 26,
'Residual coagulant ' is incor rec t ly a r rowed to the line of connected inver ted pyramid t r i ang l e s . Residual coagulant is the line of connected pyramid t r i ang le s .
the horizontal axis note PADDLE SPEED (rev/min) should r ead fPADDLE SPEED (rev/min) 1 2
1 if •I !
II
Technical Report TR 13 November 1975
WATER CLARIFICATION BY FLOTATION—4 Design and experimental studies on a dissolved-air flotation pilot plant treating 8.2 m3/h of River Thames water
by
R. A. Hyde, BSc, MSc Treatment Division Water Research Centre
Stevenage Laboratory, Medmenham Laboratory, Elder Way p O- B o x '6. Medmenham, Stevenaee, Herts. SGI 1TH Marlow, Bucks. SL7 2HD 0438 2444 O49 ' 6 6 531
The contents of this report are the copyright of the Water Research Centre and
may not be reproduced in part or in whole without pr ior written consent.
Page 2 Fig. 1. Should read WRC air injection nozzle, X.
Page 6 Last paragraph should read and 0.5m high on
Page 15 Fig. 9. horizontal axis should read mg/1 Fe
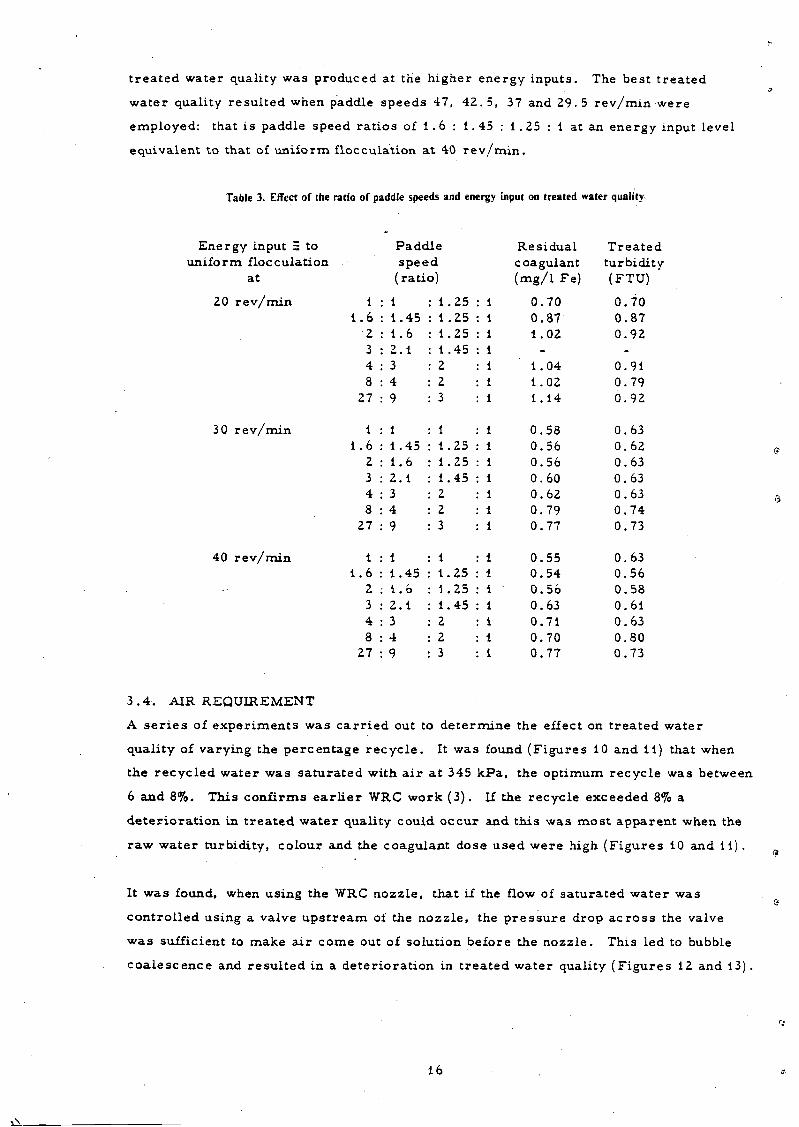
Page 17 Fig. 11. notation on graph lines should read 7 mg/1 Fe 3 mg/1 Al
Page 18 Fig. 13. vertical axis should read mg/1 Al
Page 20 Fig. 16. the note "Volume of air dissolved in water at atmospheric pressure" refers to the point at which the two graph lines meet the vertical axis.
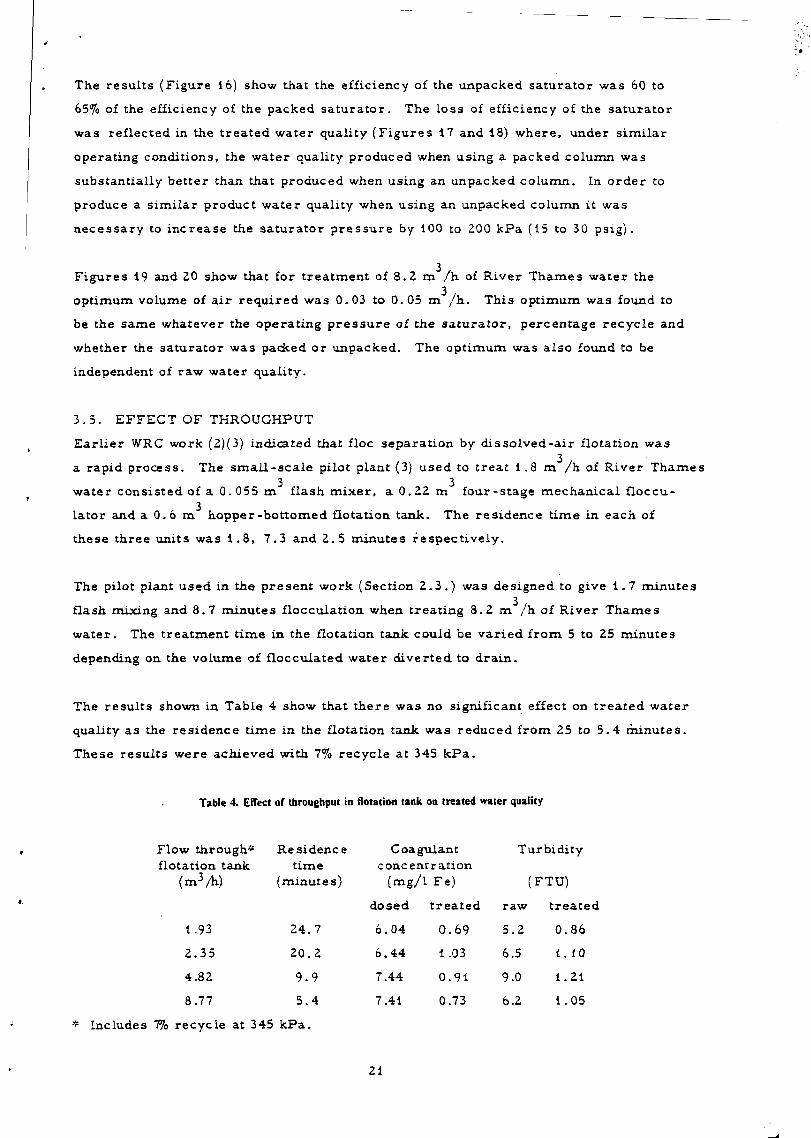
Page 22 Fig. 18. vertical axis should read mg/1 Fe
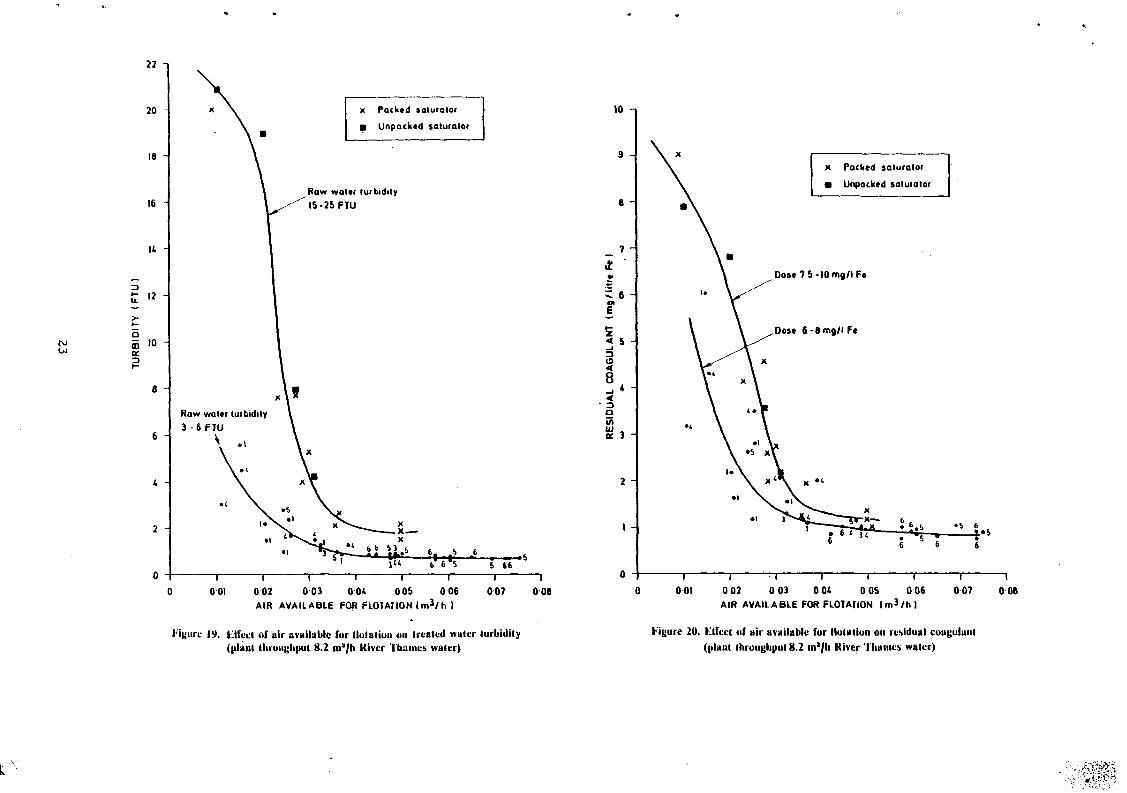
Page 23 Figs 19 & 20 the numbers against plotted points indicate nozzle identity
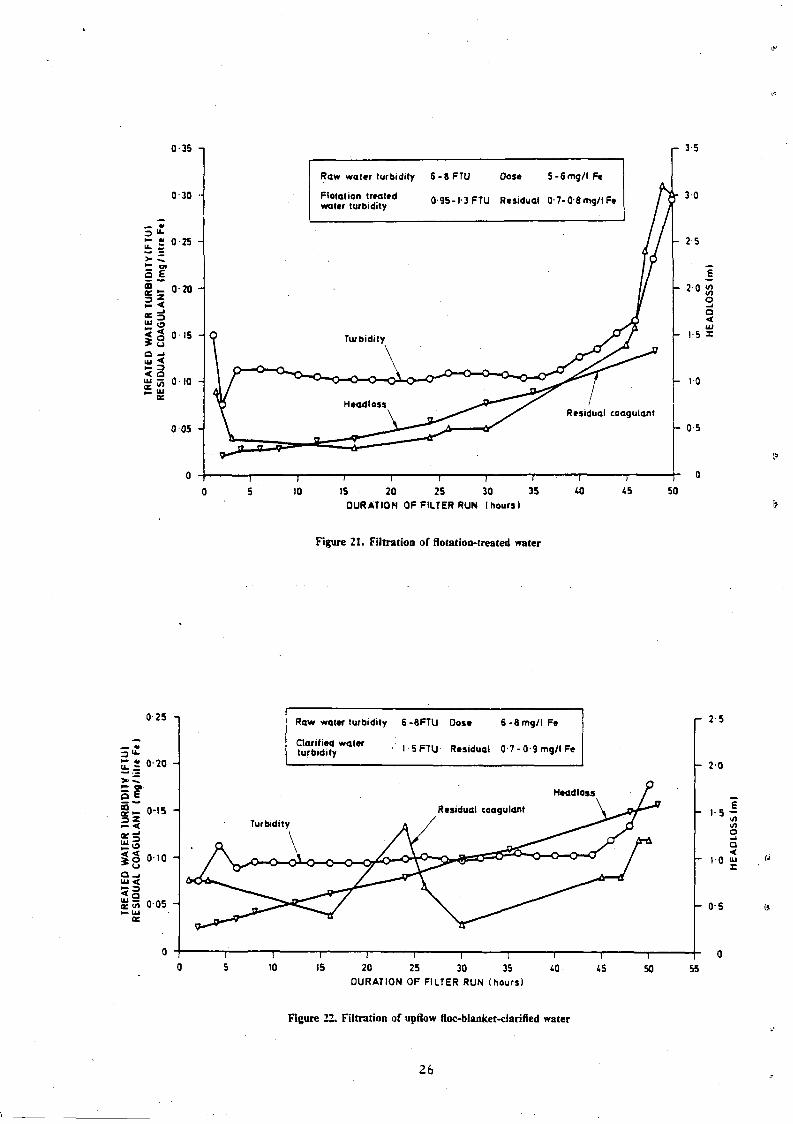
Page 26 Fig. 21. 'Residual coagulant* is incorrectly arrowed to the line of connected inverted pyramid triangles Residual coagulant is the line of connected pyramid triangles.
Page 35 Fig. 26. the horizontal axis note PADDLE SPEED (Rev/min) should read [PADDLE SPEED](rev/min) 2
Page 38 Ref. 4. STANDER, C.J. should read STANDER, G.J. VAN BLERK, S.N.V. should read VAN BLERK, S.H.V.
Page 39 Ref. 12. the date of this reference should read 1962
CONTENTS
Page
1. INTRODUCTION 1
2. EXPERIMENTAL 4
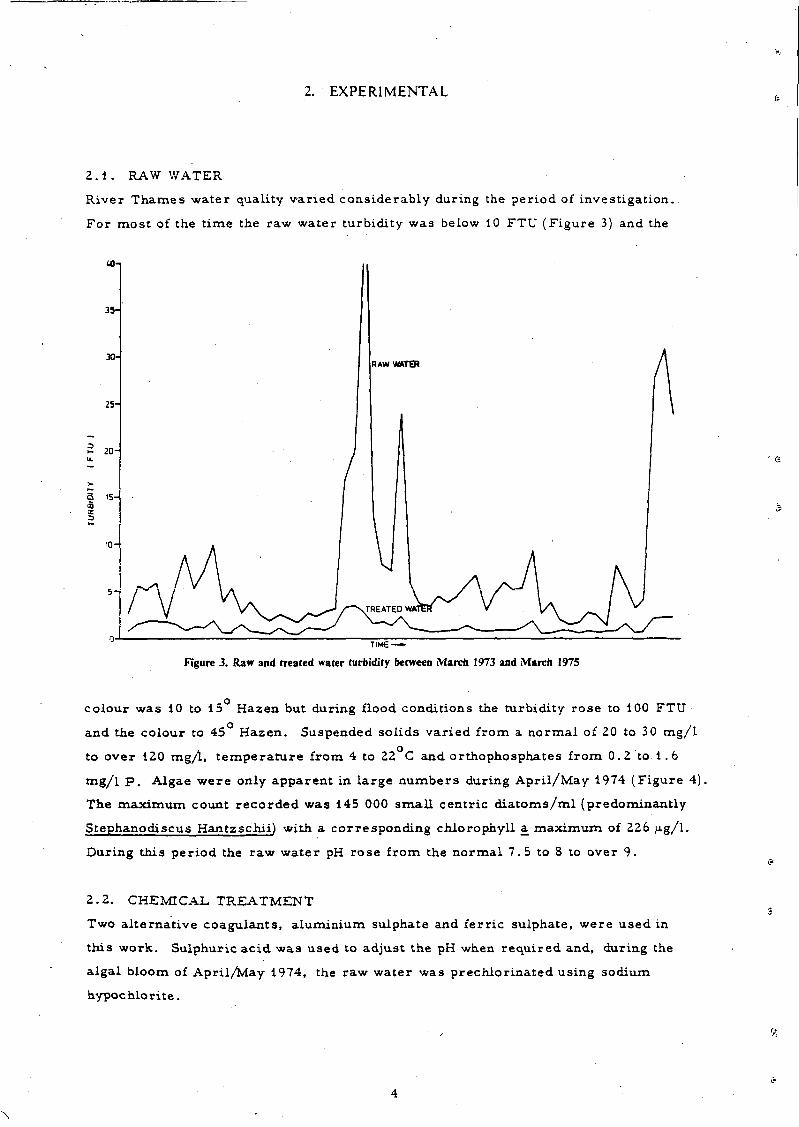
2 . 1 . RAW WATER 4
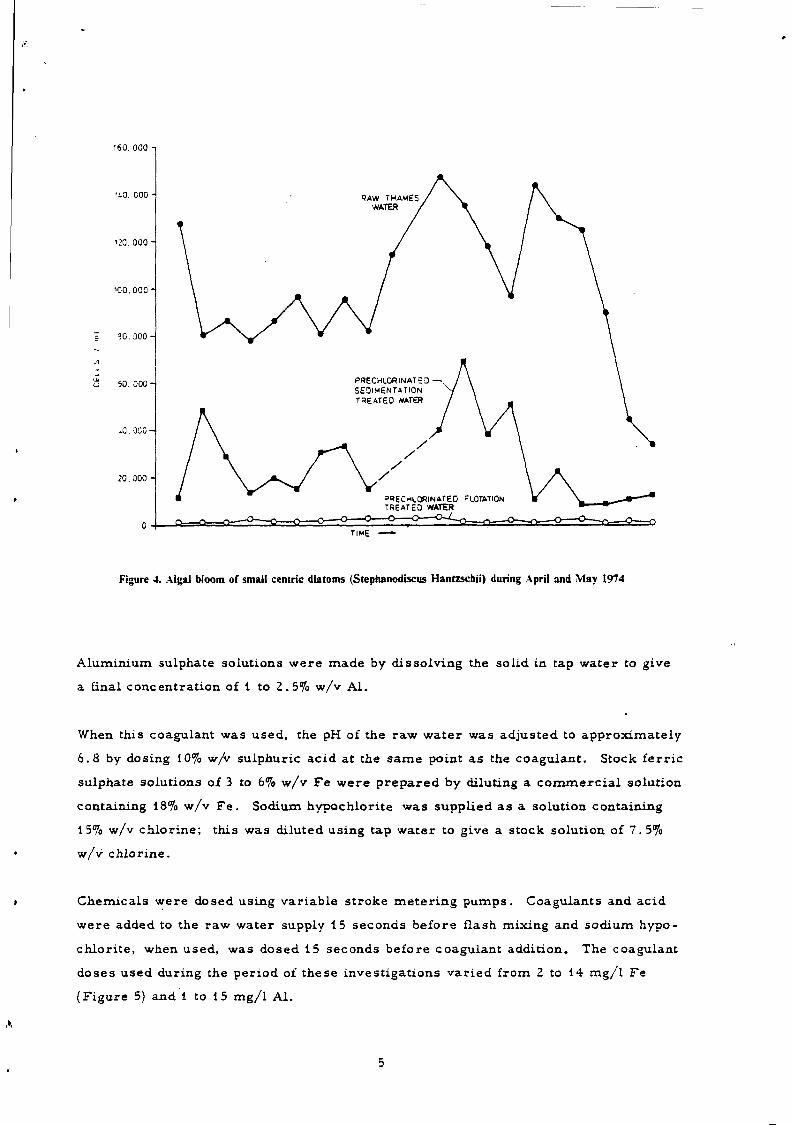
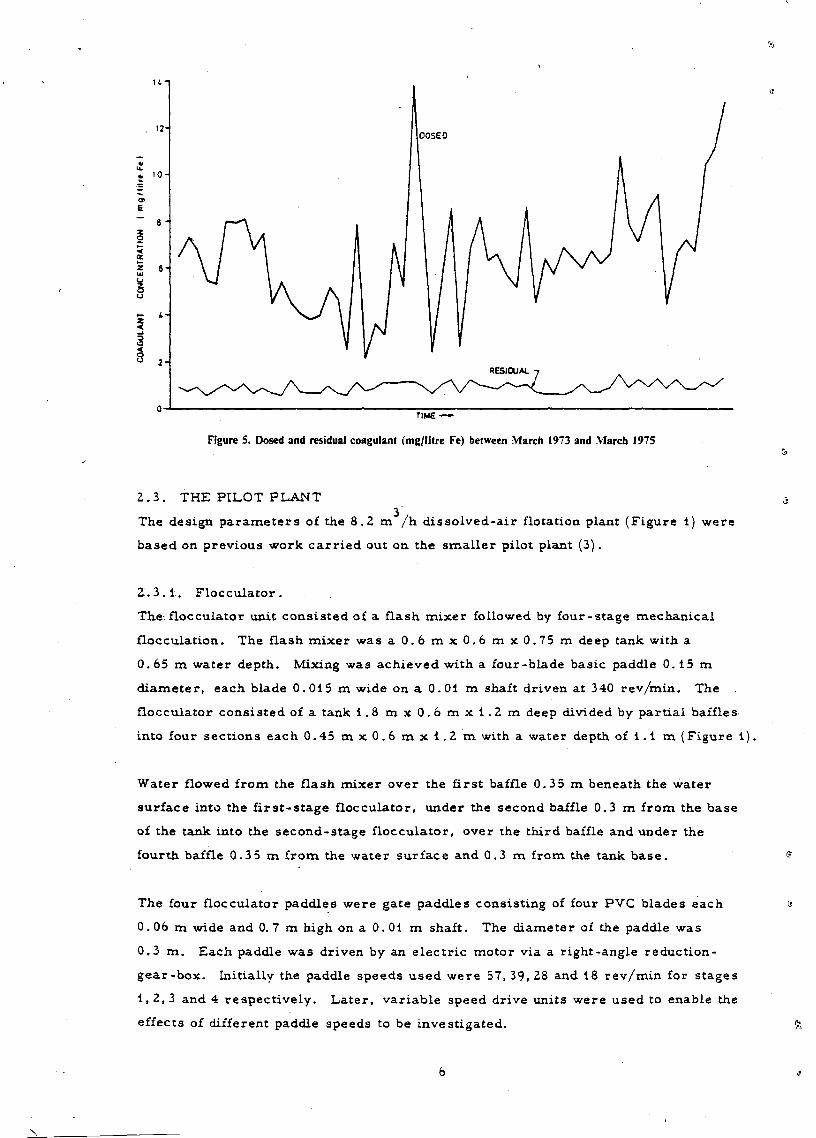
2 . 2 . CHEMICAL T R E A T M E N T 4
2 . 3 . THE PILOT PLANT 6
2 . 3 . 1 . F l o c c u l a t o r . 6
2 . 3 . 2 . F lo ta t ion t ank . 7
2 . 3 . 3 . F i l t e r . 7
2 . 3 . 4 . S a t u r a t o r s y s t e m . 7
2 . 4 . OPERATION O F THE PILOT P L A N T 8
2 . 4 . 1 . S t a r t - u p and c o n t r o l . 10
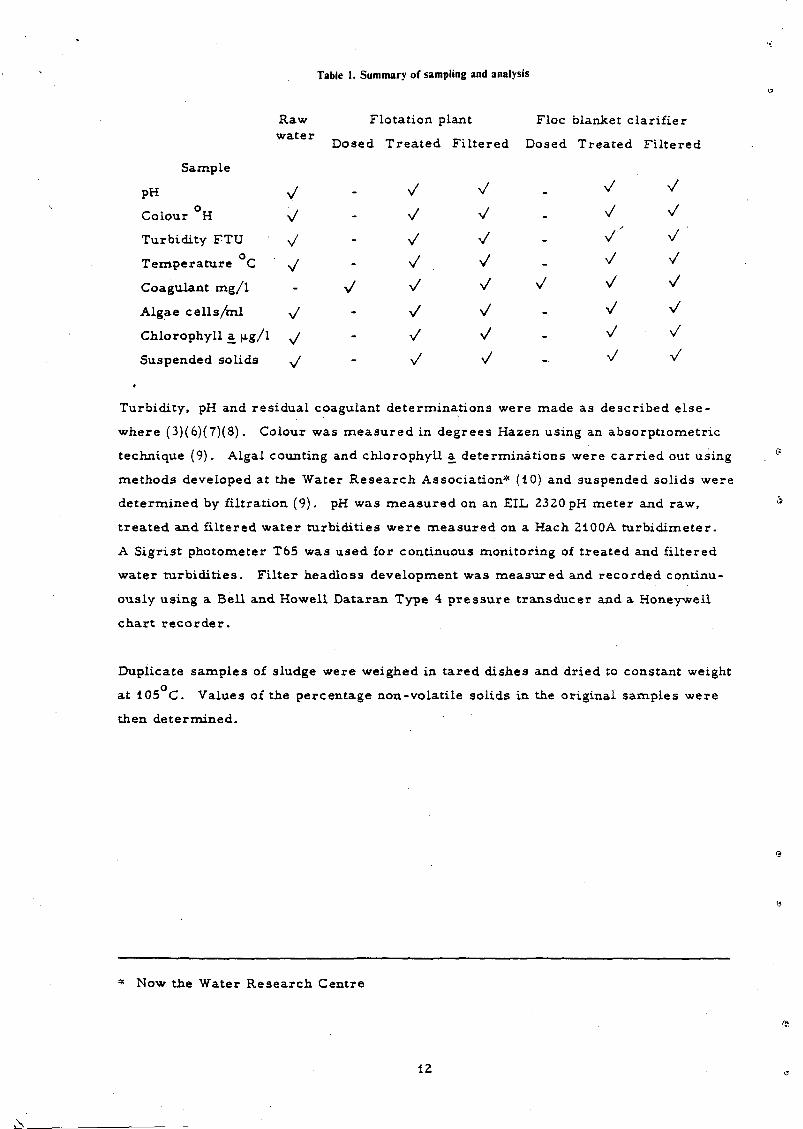
2 . 4 . 2 . Sampling and a n a l y s i s . 11
3. RESULTS ' 13
3 . 1 . E F F E C T O F RAW WATER QUALITY 13
3 . 2 . COAGULANT DOSE 14
3 . 3 . FLOCCULATION 14
3 . 4 . AIR REQUIREMENT 16
3 . 5 . E F F E C T OF THROUGHPUT 21
3 . 6 . FLOTATION TANK INTERNAL ARRANGEMENT 24
3 . 7 . FILTRATION 25
3 . 8 . E F F E C T O F SLUDGE REMOVAL ON WATER QUALITY 27
3 . 9 . SLUDGE 28
4. DISCUSSION 3 0
5. CONCLUSIONS 33
APPENDIX A. FLOCCULATOR POWER REQUIREMENT 3 5
REFERENCES 38
1. INTRODUCTION
A detailed review of the l i terature (1) provided sufficient evidence of the potential
value of dissolved-air flotation to warrant further study of the p rocess . Subsequent
laboratory investigations (2) confirmed the technical feasibility of floating many
different types of water clarification floe, including those resulting from the coagu
lation of waters heavily laden with algae, coloured waters and turbid waters with a
very low organic content. With all these natural waters , flotation was achieved with
out the addition of any chemicals other than those normally used in coagulation.
Following this work, a pilot-scale flotation plant was constructed for the treatment 3
of 1.8 m /h of River Thames water (3). A round conical-bottomed flotation tank,
similar to that employed by van Vuuren (4) for water reclamation studies in South
Africa, was used and its performance was studied from June 1971 until June 1972.
These investigations showed that dissolved-air flotation was a technically feasible
alternative to sedimentation for the clarification of a lowland river water such as the
Thames. The chemical t reatment for flotation was basically the same as for sedi
mentation and no special additives were required. In contrast to upflow sedimentation,
however, dissolved-air flotation required a separate prel iminary flocculation stage.
Efficient flotation was found to require the addition to the flocculated water of 4 to 6%
by volume of water saturated with air at 345 kPa . The efficiency of water clarification
by flotation as judged by colour, turbidity and residual coagulant concentrations was
shown to be as good as that from a well operated sedimentation tank, and algal removal
was bet ter .
Flotation was a much more rapid process than sedimentation, even when the time for
flocculation was taken into account. An additional advantage of flotation was the
production of a sludge having a much higher solids content than that obtained directly
from a sedimentation tank. Solids contents ranging from 2 to 10% were obtained,
depending on raw water quality and the method of sludge removal .
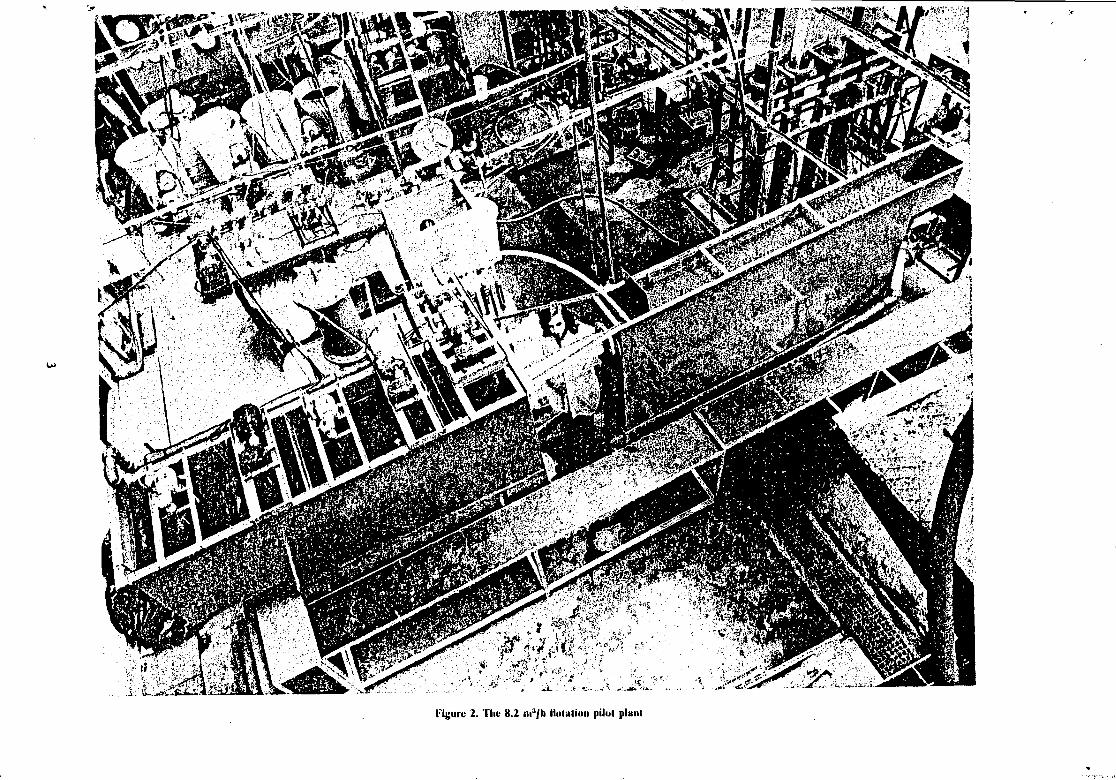
A second pilot plant, treating 8.2 m / h of River Thames water, has been used to
study the effect of flocculation, dissolved-air addition, coagulant dose, plant through
put and raw water quality on treated water quality. The flocculation and aeration
systems were of similar design to those of the first pilot plant but a rectangular, flat-
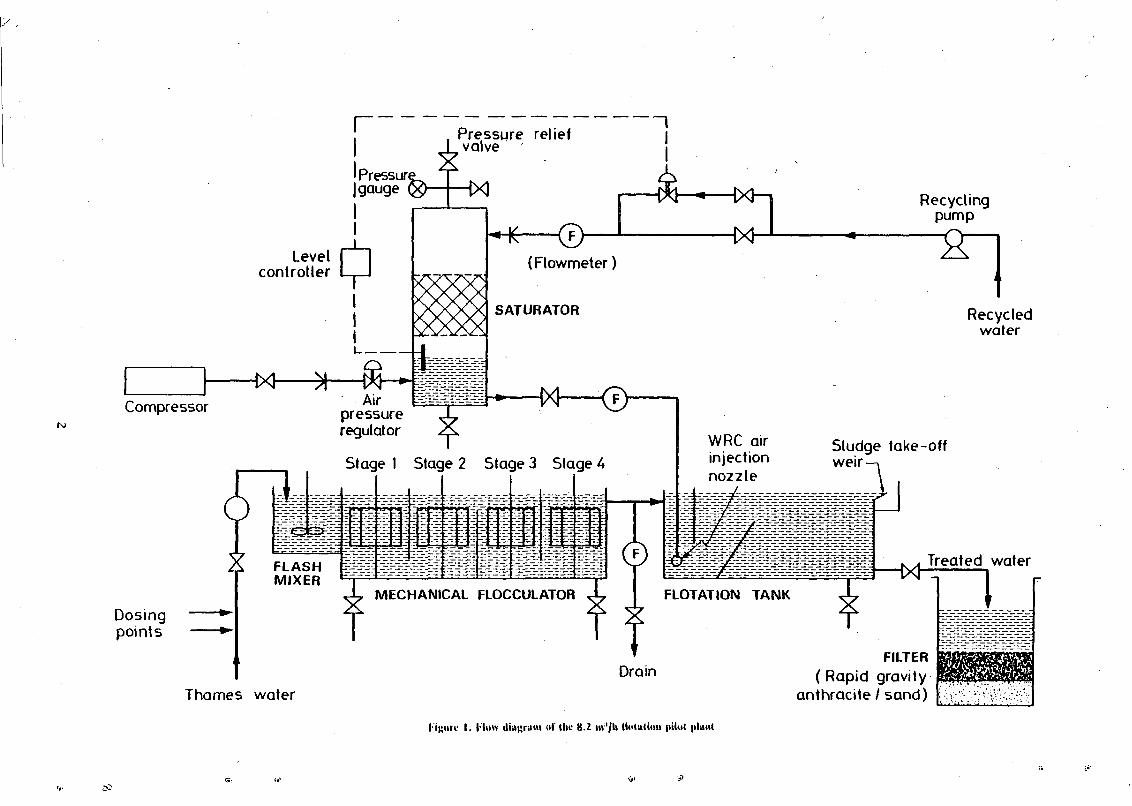
bottomed flotation tank was used (Figures 1 and 2) in order to simplify scaling-up
the design of future plant. The resul ts of these investigations over the period March
1973 to March 1975 are the subject of this repor t .
A s e r i e s of e x p e r i m e n t s was c a r r i e d out to d e t e r m i n e the effect on t r e a t e d w a t e r
qua l i ty of va ry ing the p e r c e n t a g e r e c y c l e . It was found ( F i g u r e s 10 and 11) that when
the r e c y c l e d w a t e r was s a t u r a t e d with a i r a t 345 k P a , the op t imum r e c y c l e was between
6 and 8%. Th i s c o n f i r m s e a r l i e r WRC w o r k (3 ) . If the r e c y c l e exceeded 8% a
d e t e r i o r a t i o n in t r e a t e d w a t e r qual i ty could o c c u r and th is was m o s t a p p a r e n t when the
r a w w a t e r tu rb id i ty , co lour and the coagulan t dose u s e d w e r e high ( F i g u r e s 10 and 11).
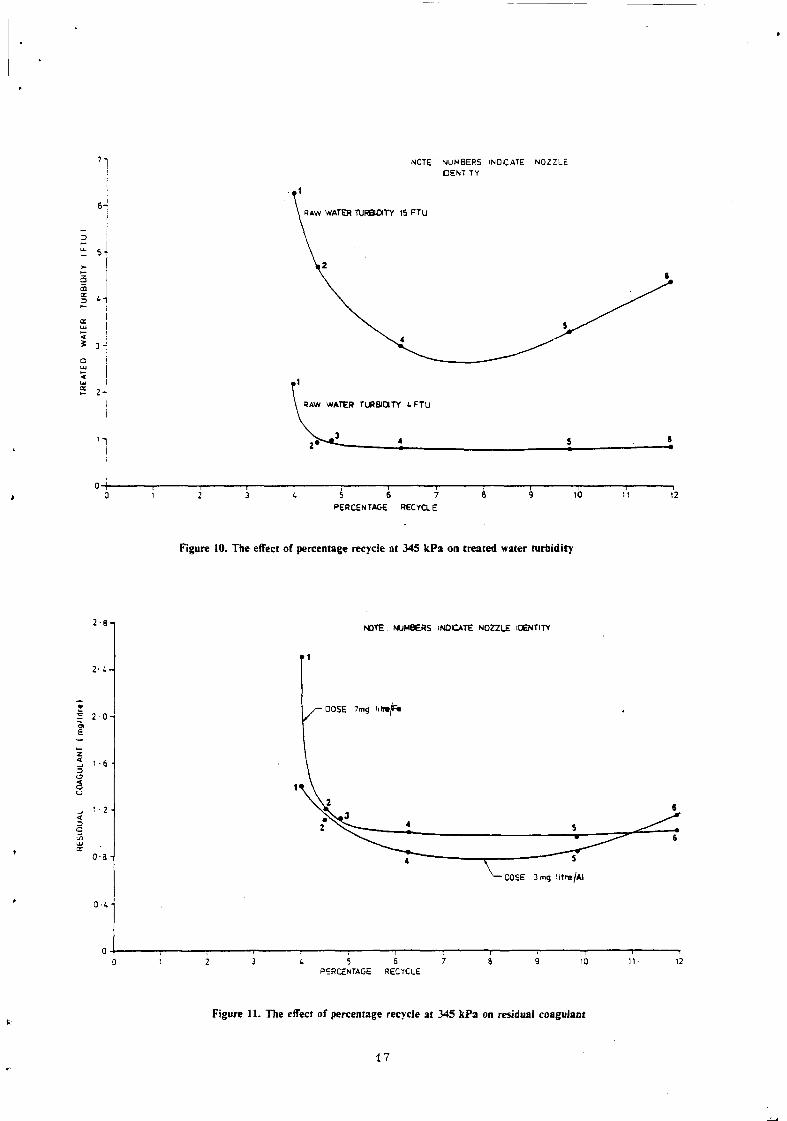
It w a s found, when us ing the WRC n o z z l e , tha t if the flow of s a t u r a t e d w a t e r was
c o n t r o l l e d us ing a valve u p s t r e a m of the n o z z l e , the p r e s s u r e d rop a c r o s s the valve
w a s sufficient to make a i r come out of so lu t ion before the n o z z l e . This led to bubble
c o a l e s c e n c e and r e s u l t e d in a d e t e r i o r a t i o n in t r e a t e d w a t e r qual i ty ( F i g u r e s 12 and 13) .
16
71 NOTE NUMBERS INDICATE NOZZLE IDENTITY
6 -. RAW WATER TURBDITY IS FTU
5 i
3-i
RAW WATER TURBIQTY i F T u
T -10 5 6 7
PERCENTAGE RECYCLE
n 12
Figure 10. The effect of percentage recycle at 345 kPa on treated water turbidity
2-M
2 - 4 -
V O
s
1 -6 •
_, 1 2
0 3 -
0<.-
NOTE NUMBERS INDICATE NOZZLE IDENTITY
/— 00SE 7m9 U\mJF»
1 \ \ •
>^^-_L ~v_ r— ^ — •
\ N—COSE 3mq litre/Al
! ! 1 1 ! 1 1 1 1 1
t
6
I i
5 6 7 PERCENTAGE RECYCLE
11 12
Figure 11. The effect of percentage recycle at 345 kPa on residual coagulant
17
\y
20-,
16-
12-
10-
8-
NOIE : NUMBERS INDICAIE NOZZLE IDENTITY
NO FLOW CONTROL UPSTREAM Of WRC NOZZLE
2-
"7 i r~ PERCENTAGE RECYCLE
u s- u
Figure 12. Treated »valcr turbidity vs percentage recycle at 345 kl'a; elfcct of controlling recycle How upstream of WKC nozzle
"J-2 - 2 -
2 0 -
1 6 -
< 7 '-'1
<
§ io-
I
NOTE NUMBERS INDICATE NOZZLE IDENTITY
0-8 -NO FLOW CONTROL UPSTREAM OF WHC NOZZLE
0 - 6 -
1 PERCENTAGE RECYCLE
12 U
Figure 13. Kesidual coagulant vs percentage recycle at 345 kl'a;
elfcct of controlling recycle How upstream of WKC nozzle
iB V
4 0 - ,
3 5
3 0
u.
> 2 5 H o m oc 2 2 0 H or UJ »— < Q 1 5 UJ »— < UJ
10
0 5 -
NOTE NUMBERS INDICATE NOZZLE IDENTITY
215 kPa
345kPa
1
2 1 4
1 1 1 6 8 10
PERCENTAGE RECYCLE
1 12
1 14
Figure 14. Treated water turbidity vs percentage recycle; clicet of saturalor pressure
4 0 -i
3 5
_ 3 0
•5,2 5 E
2 0 -z <
< O U -• 1 5 < r> o
UJ " 10
0 5
NOTE NUMBERS INDICATE NOZZLE IDENTITY
215kPa
345 k Pa
483kPa
1
0 2
1 1 1 4 6 6
PERCENTAGE RECYCLE
T
10
1 12
1 14
Figure IS. Residual coagulant vs percentage recycle; elfect of saturalor pressure
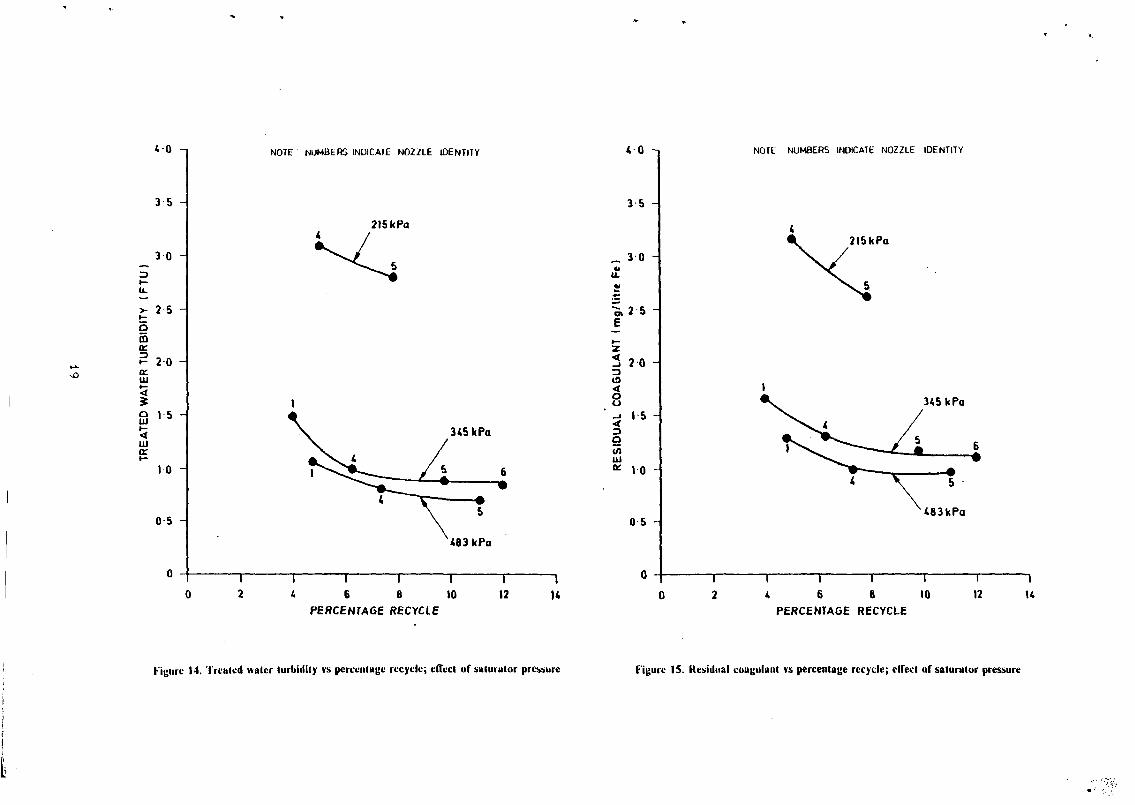
Increasing the saturator pressure from 215 to 483 kPa and thus increasing the air
available for flotation, resulted in an improvement in treated water quality (Figures
14 and 15).
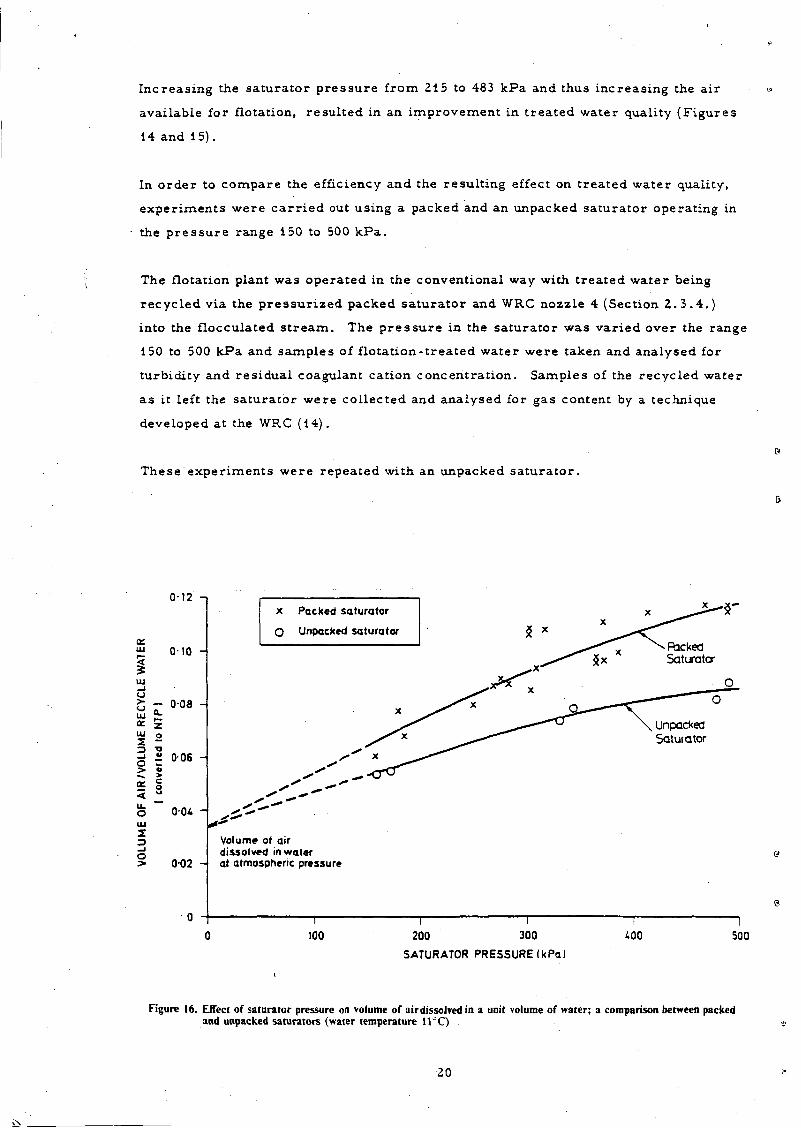
In order to compare the efficiency and the resulting effect on treated water quality,
experiments were carried out using a packed and an unpacked saturator operating
the pressure range 150 to 500 kPa.
in
The flotation plant was operated in the conventional way with treated water being
recycled via the pressurized packed saturator and WRC nozzle 4 (Section 2 .3 .4 . )
into the flocculated stream. The pressure in the saturator was varied over the range
150 to 500 kPa and samples of flotation-treated water were taken and analysed for
turbidity and residual coagulant cation concentration. Samples of the recycled water
as it left the saturator were collected and analysed for gas content by a technique
developed at the WRC (14).
These experiments were repeated with an unpacked saturator.
012 -i
uf Oio
I LU —I
> Z 0-08 111 ^
5 2
< ^ u. o uu 2 a o
0 0 4 "
0-02 -
x Packed saturator
O Unpacked saturator
Volume of air dissolved in water at atmospheric pressure
0 t 0
T T 100 200 300
SATURATOR PRESSURE I k P a )
Unpacked Satu/ator
400 S00
Figure 16. Effect of saturator pressure on volume of air dissolved in a unit volume of water; a comparison between packed and unpacked saturators (water temperature 11 C)
20
The r e s u l t s (F igu re 16) show that the efficiency of the unpacked s a t u r a t o r was 60 to
65% of the efficiency of the packed s a t u r a t o r . The loss of efficiency of the s a t u r a t o r
was re f lec ted in the t r e a t e d w a t e r qual i ty ( F i g u r e s 17 and 18) w h e r e , unde r s i m i l a r
opera t ing condi t ions , the w a t e r qual i ty p roduced when us ing a packed co lumn was
subs tan t ia l ly b e t t e r than that p roduced when us ing an unpacked c o l u m n . In o r d e r to
produce a s i m i l a r p roduc t w a t e r qual i ty when us ing an unpacked co lumn it was
n e c e s s a r y to i n c r e a s e the s a t u r a t o r p r e s s u r e by 100 to ZOO k P a (15 to 30 p s i g ) .
F i g u r e s 19 and 20 show that for t r e a t m e n t of 8 .2 m / h of R i v e r T h a m e s w a t e r the
o p t i m u m volume of a i r r e q u i r e d was 0 .03 to 0 .05 m / h . Th i s o p t i m u m w a s found to
be the s a m e w h a t e v e r the ope ra t i ng p r e s s u r e of the s a t u r a t o r , p e r c e n t a g e r e c y c l e and
whether the s a t u r a t o r w a s packed o r unpacked . The o p t i m u m was a l s o found to be
independent of r aw wa te r qua l i ty .
3 . 5 . E F F E C T OF THROUGHPUT
E a r l i e r WRC work (2)(3) indicated that floe s e p a r a t i o n by d i s s o l v e d - a i r f lotat ion w a s
a r ap id p r o c e s s . The s m a l l - s c a l e pi lot plant (3) u s e d to t r e a t 1.8 m / h of R i v e r T h a m e s 3 3
w a t e r c o n s i s t e d of a 0 .055 m f lash m i x e r , a 0 .22 m f o u r - s t a g e m e c h a n i c a l f loccu-
la tor and a 0 .6 m h o p p e r - b o t t o m e d flotat ion t ank . The r e s i d e n c e t i m e in each of
these t h r ee uni t s was 1 .8 , 7 .3 and 2 . 5 m i n u t e s r e s p e c t i v e l y .
The pilot p lant u s e d in the p r e s e n t work (Sect ion 2 . 3 . ) was des igned to give 1.7 m i n u t e s 3
f lash mixing and 8 .7 m i n u t e s f loccula t ion when t r e a t i n g 8 .2 m / h of R i v e r T h a m e s
w a t e r . The t r e a t m e n t t i m e in the f lotat ion tank could be v a r i e d f r o m 5 to 25 m i n u t e s
depending on the volume of f loccula ted w a t e r d i v e r t e d to d r a i n .
The r e s u l t s shown in Tab le 4 show tha t t h e r e w a s no signif icant effect on t r e a t e d w a t e r
qual i ty a s the r e s i d e n c e t ime in the f lotat ion tank w a s r e d u c e d f rom 25 to 5 .4 m i n u t e s .
T h e s e r e s u l t s w e r e ach i eved with 7% r e c y c l e a t 345 k P a .
Table 4. Effect of throughput in flotation tank on treated water quality
f lotat ion tank (m 3 / n )
1.93
2 . 3 5
4.82
8.77
* Includes 7% r e c y c l e at 345 k P a .
R e s i d e n c e t ime
(minu tes )
2 4 . 7
2 0 . 2
9 . 9
5 .4
Coagulant concen t r a t i on
( m g / 1
dosed
6 .04
6 .44
7.44
7.41
Fe)
t r e a t e d
0 .69
1.03
0 .91
0.73
T
raw
5.2
6.5
9.0
6.2
u rb id i t y
(FTU)
t r e a t e d
0 .86
1. 10
1.21
1.05
21
3
<
24n
2 0 -
16
PACKED SATURATOR
UNPACKED SATURATOR
— 1 —
400 100 200 300
SATURATOR PRESSURE kPa
500
Figure 17. Effect of saturator pressure on treated water turbidity using WRC nozzle 4; a comparison between packed and unpacked sarurators
10-1
S 8'
z 6-< 3 O <
< Q
* 2
PACKED SATURATOR
UNPACKED SATURATOR
- 1 — 400 100 200
SATURATOR
1
300
PRESSURE kPa
500
Figure 18. Effect of saturator pressure on residual coagulant using WRC nozzle 4; a comparison between packed and unpacked sarurators
22
22
20
18
16
12 -
3
ktd satuialor
acktd saturatoi
5 66 I I I I I I I
001 002 003 004 0 05 0 06 007 AIR AVAILABLE FOR FLOTATION I m 3 / h I
0 06
Figure 19. lilfecl of air available fur Notation on I rented water turbidity (plant throughput 8.2 m'/h Kivcr Thames water)
Lx-
to
9 -
6 -
7 -
6 -
< S _ i 3 O < 8 _. * <
' 3 Q l/> DC 3
2 -
I -
x Packed saturator
• Unpacked satuialor
Dose 7 5 - 1 0 m a / I F»
„Ooje 6 -8mg/ l Fe
— I 1 T 1 1 1 —
001 002 003 004 00S 0 06
AIR AVAILABLE FOR FLOTATION I m ^ / h )
007 I
008
Figure 20. ti l led of air available for Dotation on residual coagulant
(plant throughput 8.2 in1/!! River Thames water)
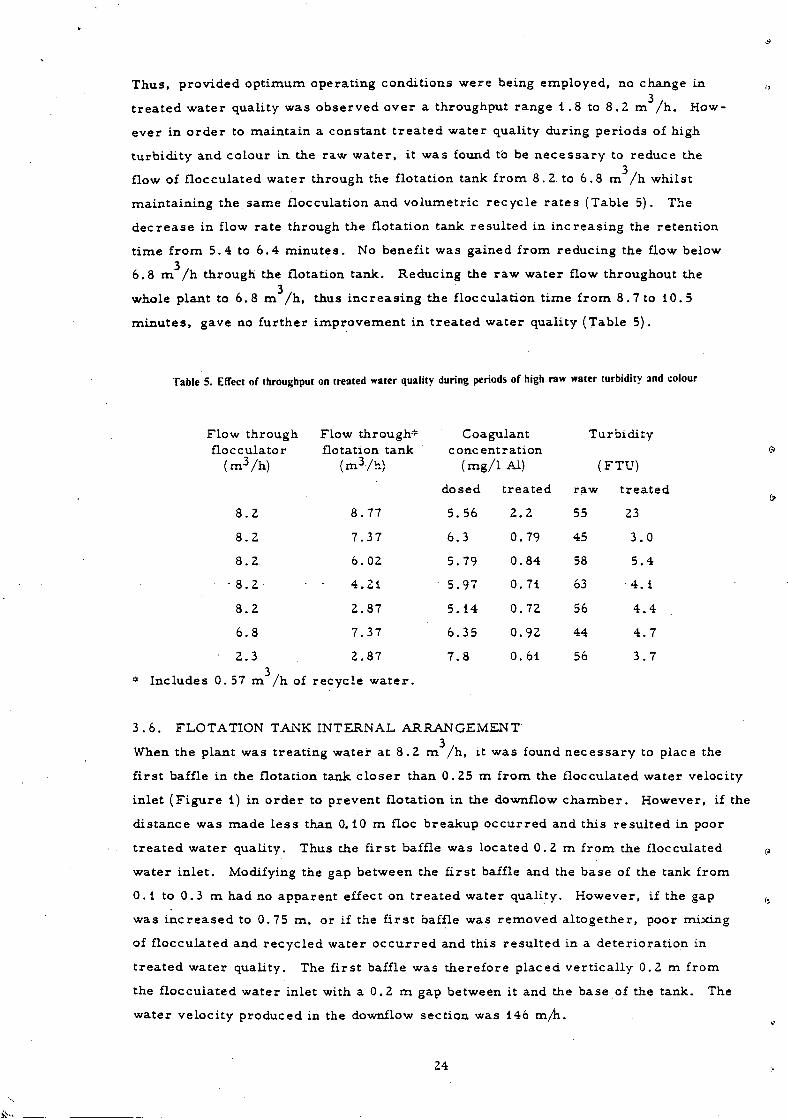
T h u s , p rov ided o p t i m u m opera t ing cond i t ions w e r e being employed , no change in
t r e a t e d w a t e r qual i ty was o b s e r v e d o v e r a throughput r ange 1.8 to 8 .2 m / h . How
eve r in o r d e r to ma in t a in a cons tan t t r e a t e d w a t e r qual i ty dur ing p e r i o d s of high
t u rb id i t y and co lour in the r aw w a t e r , it w a s found to be n e c e s s a r y to r educe the
flow of f loccula ted wa te r through the f lotat ion tank f rom 8. 2 to 6 .8 m / h whi ls t
ma in ta in ing the s a m e f locculat ion and v o l u m e t r i c r e c y c l e r a t e s (Table 5). The
d e c r e a s e in flow r a t e through the f lotat ion tank r e s u l t e d in i n c r e a s i n g the re ten t ion
t i m e f rom 5.4 to 6 .4 m i n u t e s . No benefi t was gained f rom reduc ing the flow below
6 .8 m / h through the flotation tank . Reducing the r a w wa te r flow throughout the
whole plant to 6 .8 m / h , thus i n c r e a s i n g the f locculat ion t ime f rom 8 .7 to 10 . 5
m i n u t e s , gave no fu r the r i m p r o v e m e n t in t r e a t e d w a t e r qual i ty (Table 5) .
Table 5. Effect of throughput on treated water quality during periods of high raw water turbidity and colour
Flow through Flow through* Coagulant Turb id i ty f loccula tor flotation tank concen t r a t i on
( m 3 / h ) ( m 3 / h ) ( m g / l A l ) (FTU)
dosed t r e a t e d raw t r e a t e d
8 .2 8 .77 5 .56 2 . 2 55 23
8 . 2 7 .37 6.3 0 .79 45 3 .0
8 .2 6 .02 5.79 0 .84 58 5 .4
8 . 2 - 4 . 2 1 5 .97 0 .71 63 4 . 1
8 .2 2 .87 5 .14 0 .72 56 4 . 4
6.8 7 .37 6.35 0 .92 44 4 . 7
• 2 .3 2 .87 7 .8 0 .61 56 3 .7
* Inc ludes 0 .57 m / h of r ecyc l e w a t e r .
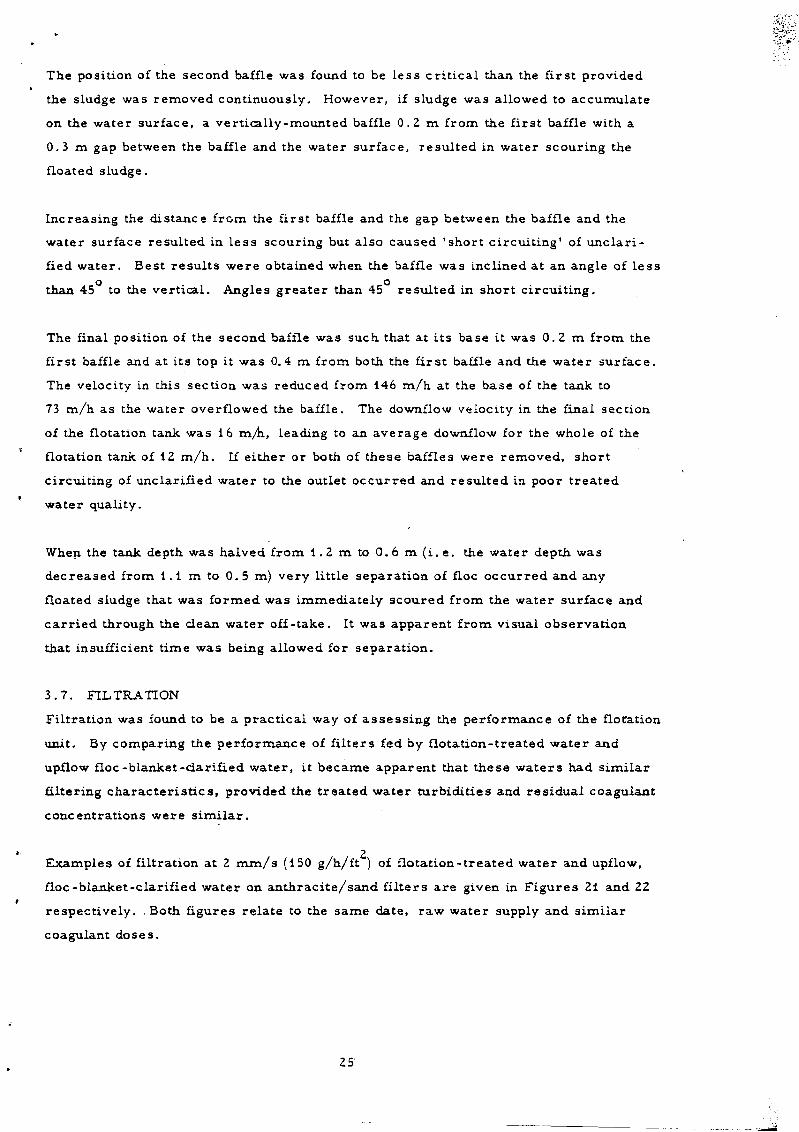
3 . 6 . FLOTATION TANK INTERNAL ARRANGEMENT
When the plant was t r e a t i ng w a t e r at 8 .2 m / h , it w a s found n e c e s s a r y to p lace the
f i r s t baffle in the flotation tank c l o s e r than 0 .25 m f rom the f loccula ted w a t e r veloci ty
in le t ( F i g u r e 1) in o r d e r to p r even t f lo ta t ion in the downflow c h a m b e r . However , if the
d i s t ance was m a d e l e s s than 0.10 m floe b r e a k u p o c c u r r e d and this r e s u l t e d in poor
t r e a t e d w a t e r qual i ty . Thus the f i r s t baffle was loca ted 0 .2 m f rom the f loccula ted
w a t e r i n l e t . Modifying the gap be tween the f i r s t baffle and the base of the tank f rom
0 .1 to 0 .3 m had no appa ren t effect on t r e a t e d wa te r qual i ty . However , if the gap
was i n c r e a s e d to 0 .75 m, or if the f i r s t baffle was r e m o v e d a l toge the r , poor mixing
of f loccula ted and r e c y c l e d wa te r o c c u r r e d and th is r e s u l t e d in a d e t e r i o r a t i o n in
t r e a t e d w a t e r qual i ty . The f i r s t baffle was t h e r e f o r e p laced v e r t i c a l l y 0 .2 m from
the f loccu la ted w a t e r inlet with a 0 .2 m gap between it and the base of the tank. The
wa te r ve loc i ty p roduced in the downflow sec t ion was 146 m / h .
24
The position of the second baffle was found to be Less cr i t ica l than the first provided
the sludge was removed continuously. However, if sludge was allowed to accumulate
on the water surface, a vertically-mounted baffle 0. Z m fr om the first baffle with a
0.3 m gap between the baffle and the water surface, resulted in water scouring the
floated sludge.
Increasing the distance from the first baffle and the gap between the baffle and the
water surface resulted in less scouring but also caused 'short circuiting1 of unclar i -
fied water. Best resul ts were obtained when the baffle was inclined at an angle of less o o
than 45 to the vertical. Angles greater than 45 resulted in short circuit ing.
The final position of the second baffle was such that at its base it was 0 . 2 m from the
first baffle and at its top it was 0, 4 m from both the first baffle and the water surface.
The velocity in this section was reduced from 146 m/h at the base of the tank to
73 m/h as the water overflowed the baffle. The downflow velocity in the final section
of the flotation tank was 16 m/h., leading to an average downflow for the whole of the
flotation tank of 12 m/h . If either or both of these baffles were removed, short
circuiting of unclarified water to the outlet occurred and resulted in poor treated
water quality.
When the tank depth was halved from 1.2 m to 0.6 m ( i . e . the water depth was
decreased from 1.1 m to 0.5 m) very little separation of floe occurred and any
floated sludge that was formed was immediately scoured from the water surface and
car r ied through the clean water off-take. It was apparent from visual observation
that insufficient time was being allowed for separation.
3 .7 . FILTRATION
Filtration was found to be a pract ical way of assessing the performance of the flotation
unit. By comparing the performance of filters fed by flotation-treated water and
upflow floe-blanket-clarified water, it became apparent that these waters had similar
filtering character is t ics , provided the t reated water turbidities and residual coagulant
concentrations were s imi la r .
Examples of filtration at 2 m m / s (150 g/h/ft ) of flotation-treated water and upflow,
floe-blanket-clarified water on anthraci te/sand filters are given in Figures 21 and 22
respectively. . Both figures relate to the same date, raw water supply and similar
coagulant doses.
25
0-35 -i
0 30
S 0 25
'Z «» 5 E
> <J
Ui ^ >- 3 < a £35 0 10 5 S
IS -
0 05 -
r 3-5
Raw water turbidity 5 - 8 F T U Dose 5 -6mg/ IFe
0-95-1-3 FTU Residual 0-7-0-8mg/IFe Flotation treated water turbidity
Residual coagulant
- 1 1 1 1 1 1 • 1 T" 10 IS 20 25 30 35 40 45
OURATION OF FILTER RUN (hours) 50
Figure 21. Filtration of flotation-treated water
0-25 -i
3 1 ' • 0-20 -
s f
n S o 5 3 010 * u ui <
<E c « 005 >-UJ
Raw water turbidity 6-8FTU Oose 6 - 8 m g / I F e
1 5 FTU Residual 0 - 7 - 0 9 mg/l Fe Clarified water turbidity
Turbidity
Headloss
~! 1 1 1 1 1 r-10 IS 20 25 30 35 40
OURATION OF FILTER RUN (hours) 45
2-5
- 2 0
in O
a <
- 10 i"
- 0-5
T " SO 55
Figure 22. Filtration of uprlow tloc-blanket-darified water
26
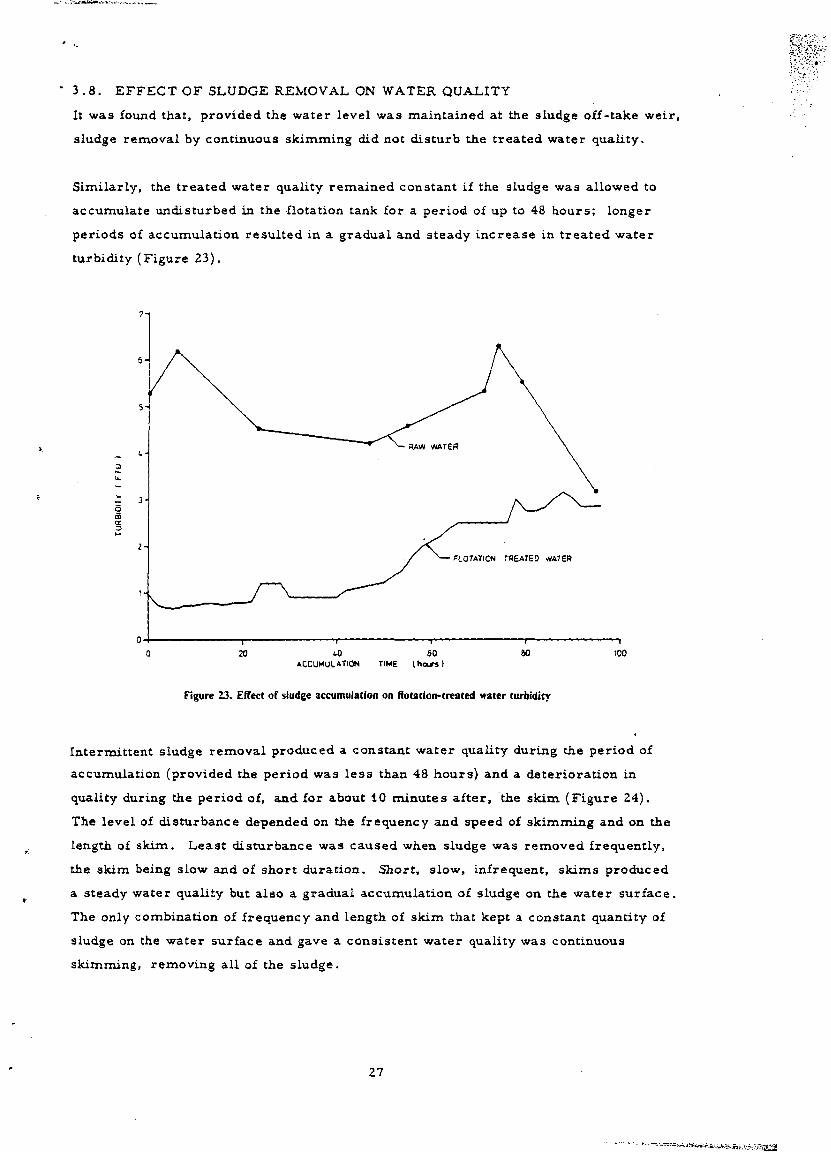
3 . 8 . EFFECT OF SLUDGE REMOVAL ON WATER QUALITY
It was found that, provided the water level was maintained at the 3ludge off-take weir,
sludge removal by continuous skimming did not disturb the treated water quality.
Similarly, the treated water quality remained constant if the sludge was allowed to
accumulate undisturbed in the flotation tank for a period of up to 48 hours; longer
periods of accumulation resulted in a gradual and steady increase in t reated water
turbidity (Figure 23).
Q
5
T tO 60
ACCUMULATION TIME IhOLTs)
Figure 23. Effect of sludge accumulation on flotation-treated water turbidity
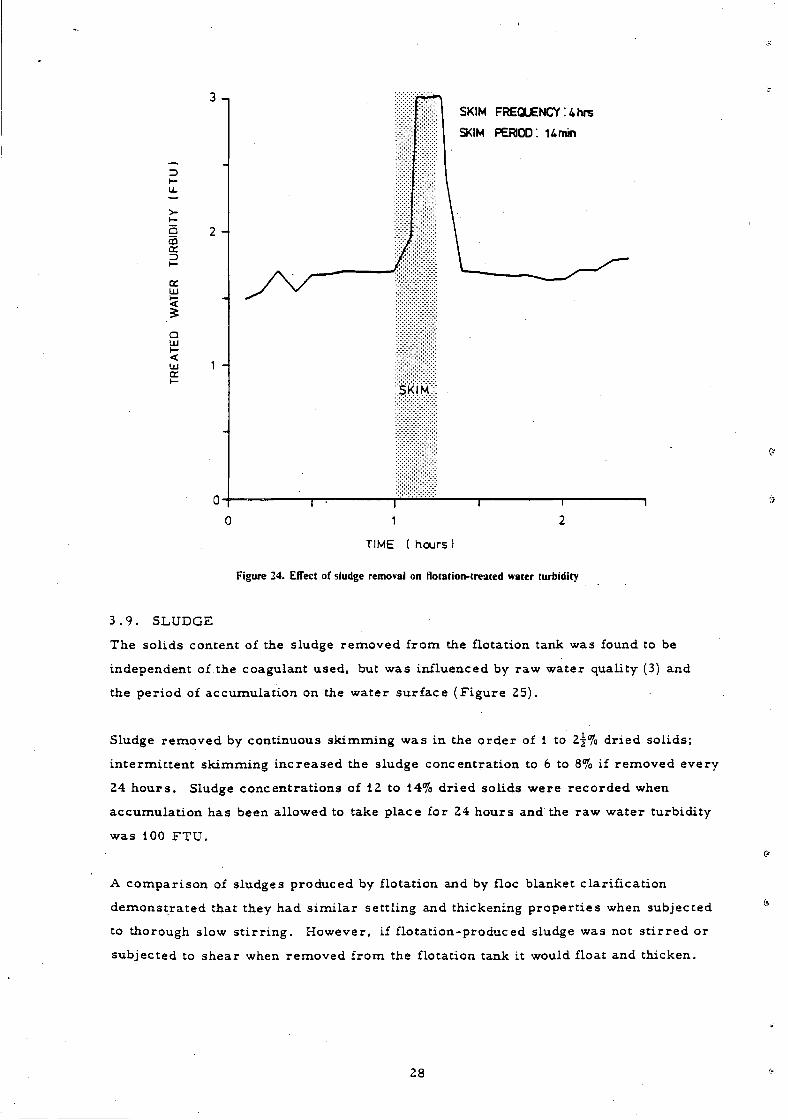
I n t e r m i t t e n t s ludge r e m o v a l p r o d u c e d a cons t an t w a t e r qual i ty dur ing the p e r i o d of
accumula t ion (p rov ided the p e r i o d was l e s s than 48 h o u r s ) a n d a d e t e r i o r a t i o n in
qual i ty during the p e r i o d of, and for about 10 m i n u t e s a f t e r , the s k i m ( F i g u r e 24) .
The l eve l of d i s t u r b a n c e depended on the f requency and speed of s k i m m i n g and on the
length of s k i m . L e a s t d i s t u r b a n c e was c a u s e d when sludge was r e m o v e d f requent ly ,
the sk im being slow and of s h o r t du ra t i on . Shor t , s low, infrequent , s k i m s p r o d u c e d
a s t eady w a t e r qual i ty but a l so a g r a d u a l a c c u m u l a t i o n of s ludge on the w a t e r s u r f a c e .
The only combina t ion of f requency a n d length of sk im that kept a cons tan t quant i ty of
sludge on the w a t e r su r face and gave a c o n s i s t e n t w a t e r qual i ty was cont inuous
sk imming , r emov ing a l l of the s ludge .
27
3 -,
g CD
3
CC UJ
$
a UJ i— < UJ cc
2 -
1 -
SKIM FREQUENCY:4hrs
SKIM PERIOD: Knun
5KIM
T T
TIME ( hours)
Figure 24. Effect of sludge removal on flotation-treated water turbidity
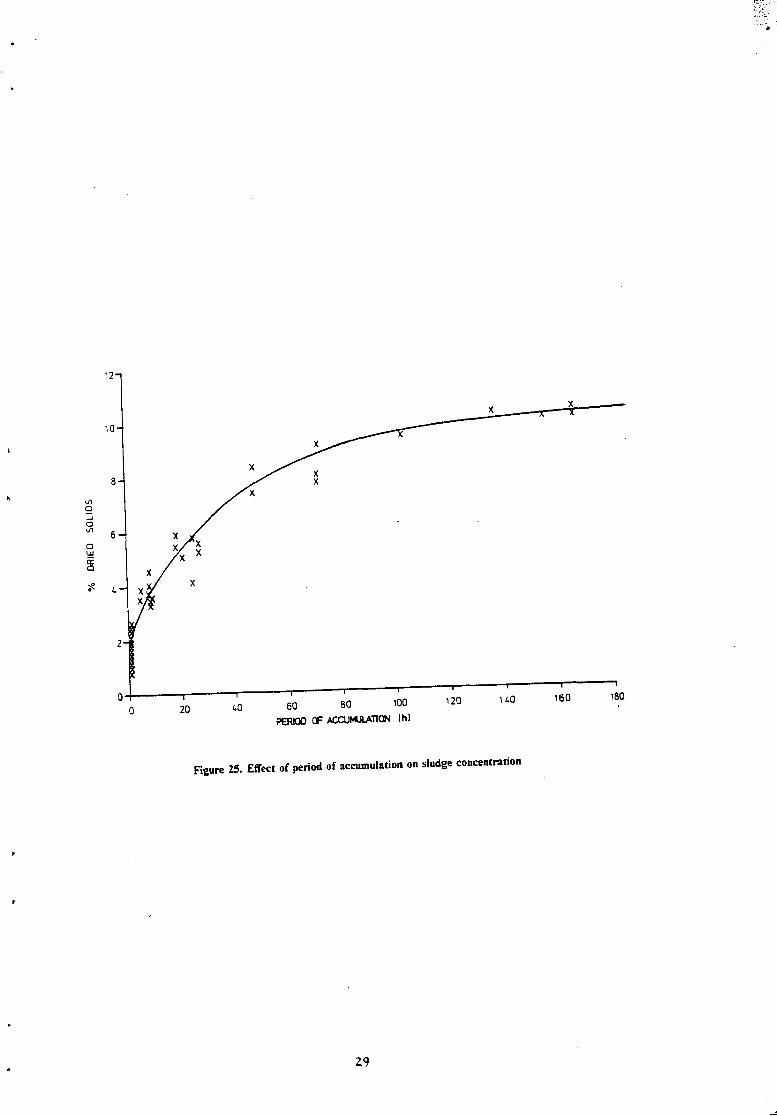
3 . 9 . SLUDGE
The so l ids content of the sludge r e m o v e d f rom the f lotat ion tank was found to be
independent of the coagulant used , but was inf luenced by r aw wa te r qual i ty (3) and
the p e r i o d of accumula t ion on the w a t e r s u r f a c e ( F i g u r e 25).
Sludge r e m o v e d by cont inuous sk imming w a s in the o r d e r of 1 to 2jr% d r i ed so l ids ;
i n t e r m i t t e n t s k i m m i n g i n c r e a s e d the s ludge concen t r a t ion to 6 to 8% if r e m o v e d eve ry
24 h o u r s . Sludge c o n c e n t r a t i o n s of 12 to 14% d r i e d so l ids w e r e r e c o r d e d when
a c c u m u l a t i o n h a s been a l lowed to take p l ace for 24 h o u r s and the r aw w a t e r tu rb id i ty
was 100 F T U .
A c o m p a r i s o n of s ludges p roduced by f lotat ion and by floe blanket c l a r i f i ca t ion
d e m o n s t r a t e d that they had s i m i l a r se t t l ing and thickening p r o p e r t i e s when subjec ted
to thorough slow s t i r r i n g . However , if f l o t a t ion -p roduced sludge was not s t i r r e d or
sub jec ted to s h e a r when r e m o v e d f rom the f lotat ion tank it would float and th icken .
28
a UJ cr a
PSRIOO OF ACCUMULATION (h)
Figure 25. Effect of period of accumulation on sludge concentration
29
4. DISCUSSION
The work ca r r i ed out on this 8.2 m / h flotation pilot plant has, in general, confirmed
the previous WRC findings. There a re , however, a number of points that were not
apparent from the ear l ie r work.
Flotation was found to be a much more rapid process than sedimentation. Under most
raw water conditions it was possible to operate the plant with ij minutes flash mixing,
9 minutes flocculation and 5^ minutes flotation, without causing a deterioration in
t reated water quality. However, under the conditions of high turbidity and colour
which a re experienced on the River Thames for short periods each year it was
necessary to increase the flotation time to 6j minutes in order to maintain t reated
water quality. Because of the rapidity of the process , a steady treated water quality
was produced within 45 minutes of s t a r t -up . Similarly, the full effect of a change of
operating conditions was seen in the t rea ted water quality within 20 to 30 minutes.
The water quality produced by four-stage tapered mechanical flocculation followed by
flotation was comparable with that produced by an efficiently run upflow floe blanket
c lar i f ier . Under conditions of high turbidity and colour, water produced by the
settling process tended to be better than that from flotation, but under low turbidity
conditions and during algal blooms the reverse was t rue . However, it was felt that
given more operating experience with high turbidity waters the performance of the
flotation plant could be further improved.
For clarification of River Thames water by flotation, the optimum volume of water to
be saturated with a i r at 345 kPa and recycled was 6 to 8% of the volume of water to
be t reated. However, it was found that if 8% recycle was exceeded a deterioration in
t reated water quality could occur. This was probably due to floe breakdown as the
turbulence at the point of dissolved a i r introduction increased with increasing percentage
recycle . There was a noticeable deterioration when raw water turbidity, colour and
coagulant dose were high; under these conditions, the floe produced was weaker and
more readily broken down.
It was found inadvisable to control the recycle flow rate by a valve upstream of the
WRC nozzle because the p ressure drop that occurred across the valve caused p re
mature deaeration of the recycled water . This led to bubble coalescence and an inability
of the comparatively large bubbles to attach themselves to the floe. This, in turn,
resulted in a deterioration in t reated water quality. A second factor that may have
led to poor t reated water was the increased turbulence and possible floe breakdown
30 c-
that occurred as a result of the higher r ise rate of the larger bubbles.
In Section 3 .4 . it was shown that if poor flotation resulted because of inadequate
dissolved-air, this could be overcome by increasing the saturator pressure and thus
increasing the volume of air available for flotation. This could be of major importance
if the floe produced was being broken down by turbulence at the point of dissolved-air
injection. An effective method of overcoming the problem may be to reduce the recycle
flow rate to minimize the turbulence and to increase the saturator p ressure sufficiently
to maintain the volume of air available for flotation.
It is a well established chemical engineering fact that in absorption when the main
resistance to mass transfer occurs in the liquid phase (as it does in an a i r /wa te r
system) the most efficient system is a packed column with a large surface a r e a /
volume rat io. A spray tower (unpacked column) is comparatively inefficient. The
work described in Section 3 .4 . showed that, when using an unpacked column for
dissolving air in the recycle s t ream, a higher p ressure was required in order to
produce a similar treated water quality.
In te rms of treated water quality, the optimum volume flow rate of a i r required when
treating 8.Z m / h of River Thames water was 0..03 to 0.05 m /h , ( i . e . 3.7 to 6.1
l i t res a i r / m water was required for efficient t reatment) . The fact that this optimum
was independent of percentage recycle, saturator p ressure and whether a packed or
unpacked saturator was used, indicated that volume of air /volume of water to be
treated was the important parameter . This optimum ai r requirement was found to be
independent of raw water turbidity, however, it was felt that treatment of waters with
higher turbidities than those found during the course of these experiments may require
a larger a i r /water rat io .
As in previous work it was found that laboratory sedimentation jar testing could be
used to predict the optimum dose for dissolved-air flotation. The deterioration in
treated water quality that occurred if the optimum dose was exceeded (Section 3 .2 . )
was due to the production of a weaker floe at high coagulant doses and its breakdown
at the point of air injection in the flotation system.
Sludge produced by flotation varied between 1 and 14% solids depending on raw water
quality and frequency of sludge removal . It became apparent that further investigations
into methods of sludge removal using the present pilot plant would not be relevant to
larger plant. Accumulated sludge adhered to the walls of the flotation tank and when
disturbed by the action of the skimmer a small proportion sank and was car r ied over
to the f i l ters . On a larger scale of flotation tank this wall effect should be proportion -
31
ately l e ss . Fur thermore , whereas it was found necessary to use a skimmer to
remove the float on this 8.2 m /h flotation pilot plant, it may be found that sludge
will freely flow over a sludge off-take weir on a larger scale where the wall effects
will be considerably reduced.
One of the factors greatly influencing flotation-treated water quality and filter perform
ance was flocculation. Work ca r r i ed out confirmed ear l ier WRC work (3), that, in
order to achieve a good treated water quality in t e rms of turbidity and residual
coagulant it was necessary to have adequate pre-flocculation. In order to flocculate
the water sufficiently, it was found that three or four stages of flocculation were
needed. Poor treated water quality occurred as a result of inadequate flocculation
if the paddle speeds, and thus the power input, were low. It was found for this plant,
treating River Thames water, that a power input equivalent to that produced by
uniform flocculation at 30 to 40 rev /min was required for adequate flocculation. The
ratio of the paddle speeds was found to be of paramount importance in producing a
good treated water quality. If the ratios of the paddle speeds were large (e .g . 27:9:
3:1) inadequate flocculation and poor t reated water quality resulted. An improvement
in treated water quality occurred when uniform flocculation was modified to slightly
tapered flocculation (paddle speed ratios 1.6 : 1.45 : 1.25 : 1). This confirmed the
findings of an ear l ier WRC report (15) which states that the requirement for optimum
floe formation is a reduction in shear ra te as the floe size builds up.
Inadequate flocculation resulted if the ratio of paddle speeds was large because the
energy input into the final stages was insufficient to continue the flocculation process .
However, if uniform flocculation was used, the paddle speed in the final stages of
flocculation was such that the shear broke down the floe already produced.
32
5. CONCLUSIONS
5 . 1 .
Adequate flocculation was an essential requirement for efficient flotation. The best
method of flocculation was found to be slightly tapered four-stage mechanical
flocculation, but further research needs to be car r ied out to optimize this stage of
the p roces s .
5 .2 .
For good clarification, it was necessary to recycle 6 to 8% of the t reated water
saturated with air at 345 kPa (50 psig) into the flocculated s t ream. At higher
p ressures lower volumes of recycle could be used. The optimum volume of a i r
available for flotation, in t e rms of t reated water quality, was found to be 3.7 to 6.1 3
l i t res a i r / m Thames water.
5 .3 .
The flow of recycled water and the liberation of dissolved air could be satisfactorily
controlled using a nozzle which was developed for this purpose. If the flow was
controlled by a valve upstream of the nozzle, the p res su re drop across the valve
was sufficient to make air come out of solution before the nozzle. This led to bubble
coalescence and resulted in a deterioration in t reated water quality.
5.4.
If an unpacked saturator was used instead of a packed saturator an increase in p ressure
of 100 to 200 kPa was required in order to achieve a s imilar water quality.
5 .5 .
Sedimentation jar testing could be used to predict the optimum coagulant dose for
flotation, but overdosing could lead to poor t reated water quality.
5.6.
The internal arrangements of the flotation tank were flexible, but care had to be taken
not to cause a reas of high shear which could resul t in floe breakdown.
5 .7 .
A steady water quality was achieved within 45 minutes of s tar t -up and the response
to alterations in operating conditions was rapid (20 to 30 minutes).
33
5 . 8 .
In. order to achieve constant t reated water quality over a wide range of raw water
conditions, the retention t imes in the flash mixer , flocculator and flotation tank were
1-j, 9, and 67 minutes respectively. The lat ter could be reduced to 5-| minutes for
the majority of the t ime.
5.9 .
Provided the optimum coagulant dose, pH, recycle rate and raw water throughput
were employed, flotation treatment of Thames water produced a t reated water quality
comparable with that of an efficiently operated, upflow floe blanket c lar i f ier .
5.10.
Flotation was a more efficient process than upflow floe blanket clarification for the
removal of small centric diatoms from River Thames water.
5 . i i .
Provided treated water turbidity and residual coagulant concentrations were similar ,
flotation-treated and upflow floe-blanket-clarified waters had similar filtering
charac te r i s t i c s .
5 .12.
It was found necessary to use a mechanical skimming device to remove sludge.
Intermittent skimming produced a 'dry ' sludge and a deterioration in treated water
quality for the period of removal . Continuous skimming resulted in lower sludge
concentrations, but no deterioration in t rea ted water quality. Fur ther investigations
of sludge removal methods will be more appropriate on a l a rge r - sca le plant.
5 .13 .
Sludge concentrations produced by flotation were far higher than those from upflow
floe blanket c lar i f iers and could be 1 to 14% depending on raw water quality and
removal methods.
5 .14.
Fur ther investigations a re required to obtain operating experience with different
types of waters .
34
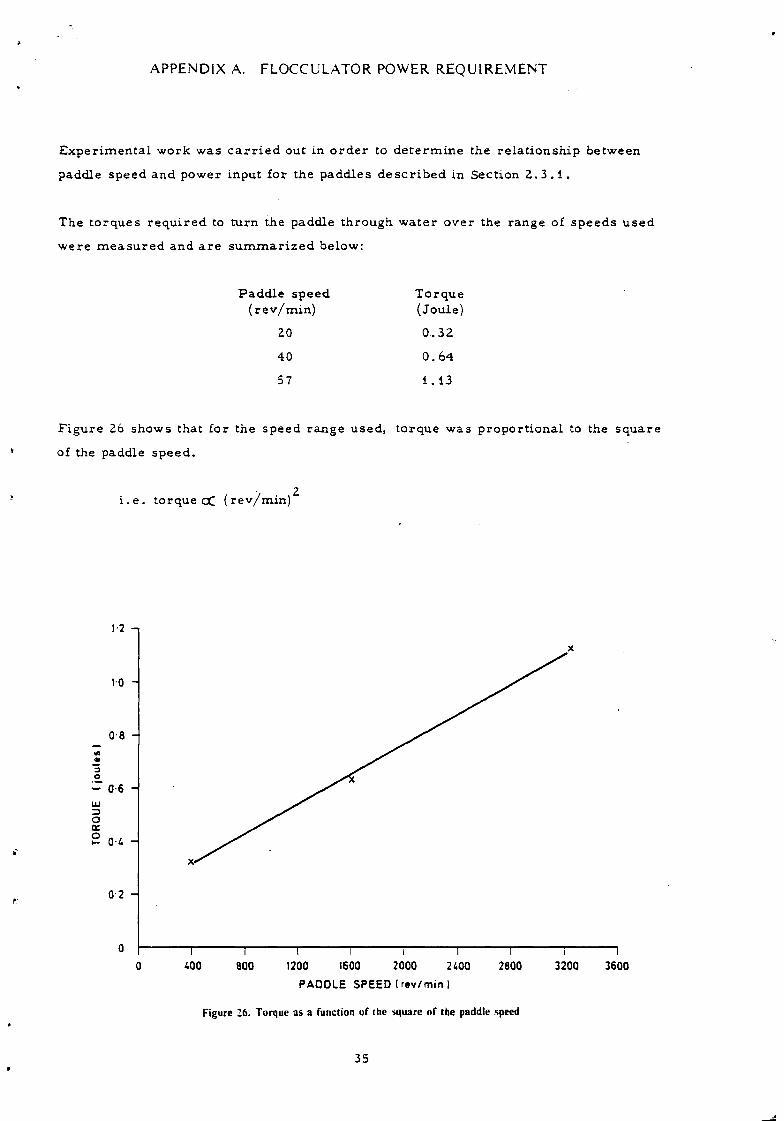
APPENDIX A. FLOCCULATOR POWER REQUIREMENT
E x p e r i m e n t a l work was c a r r i e d out in o r d e r to d e t e r m i n e the r e l a t i o n s h i p between
paddle speed and power input for the paddles d e s c r i b e d in Section 2 . 3 . 1 .
The t o rques r e q u i r e d to turn the paddle through w a t e r over the range of speeds u s e d
were m e a s u r e d and a r e s u m m a r i z e d below:
Padd le speed ( r e v / m i n )
20
40
57
T o r q u e (Joule)
0 .32
0 . 6 4
1.13
F i g u r e 26 shows that for the speed range used, torque was p ropor t i ona l to the s q u a r e
of the paddle speed .
i . e . to rque cC ( r e v / m i n )
1-2 -i
10 -
0-8 -
- 0-6 -LU
o <z o
0-4 -
0 2 -
T T T 1 400 800 1200 1600 2000 2400
PAODLE SPEED (rev/min)
2800 3200 3600
Figure 26. Torque as a Function of the square of the paddle speed
35
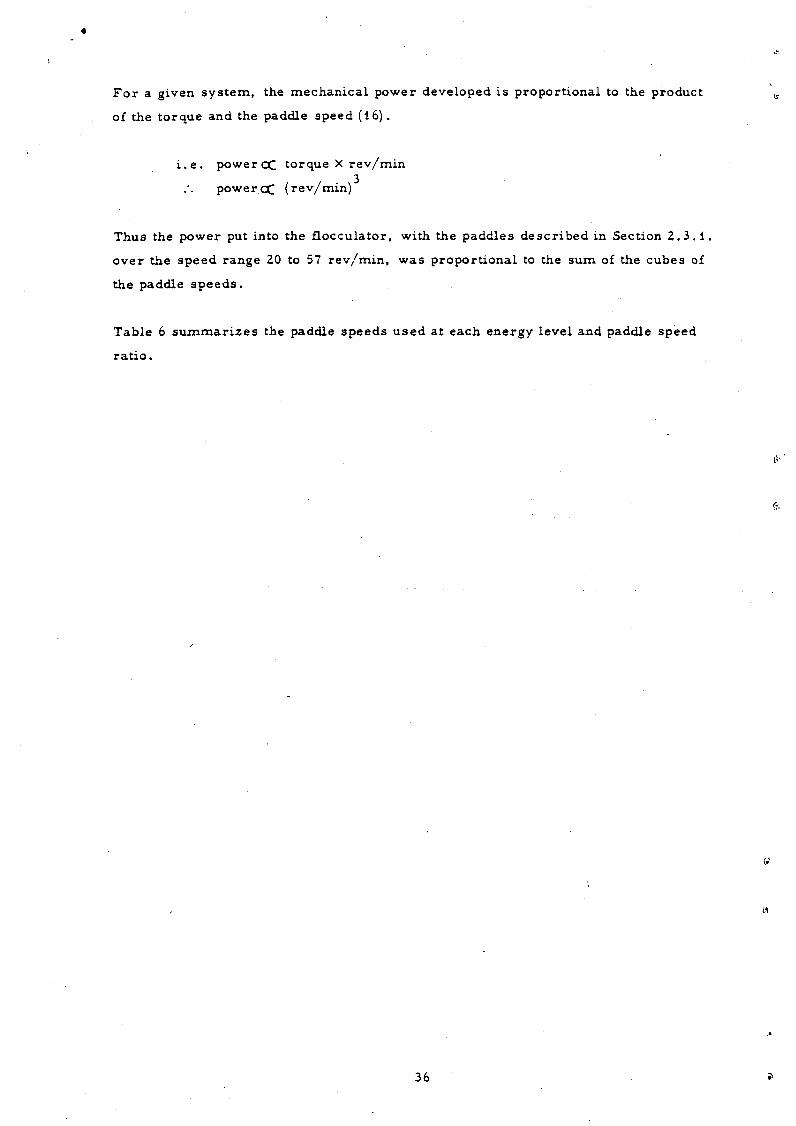
For a given system, the mechanical power developed is proportional to the product
of the torque and the paddle speed (16).
i . e . poweroC torque X rev/min
powercC (rev/min)
Thus the power put into the flocculator, with the paddles described in Section 2 .3 .1
over the speed range 20 to 57 rev/min, was proportional to the sum of the cubes of
the paddle speeds.
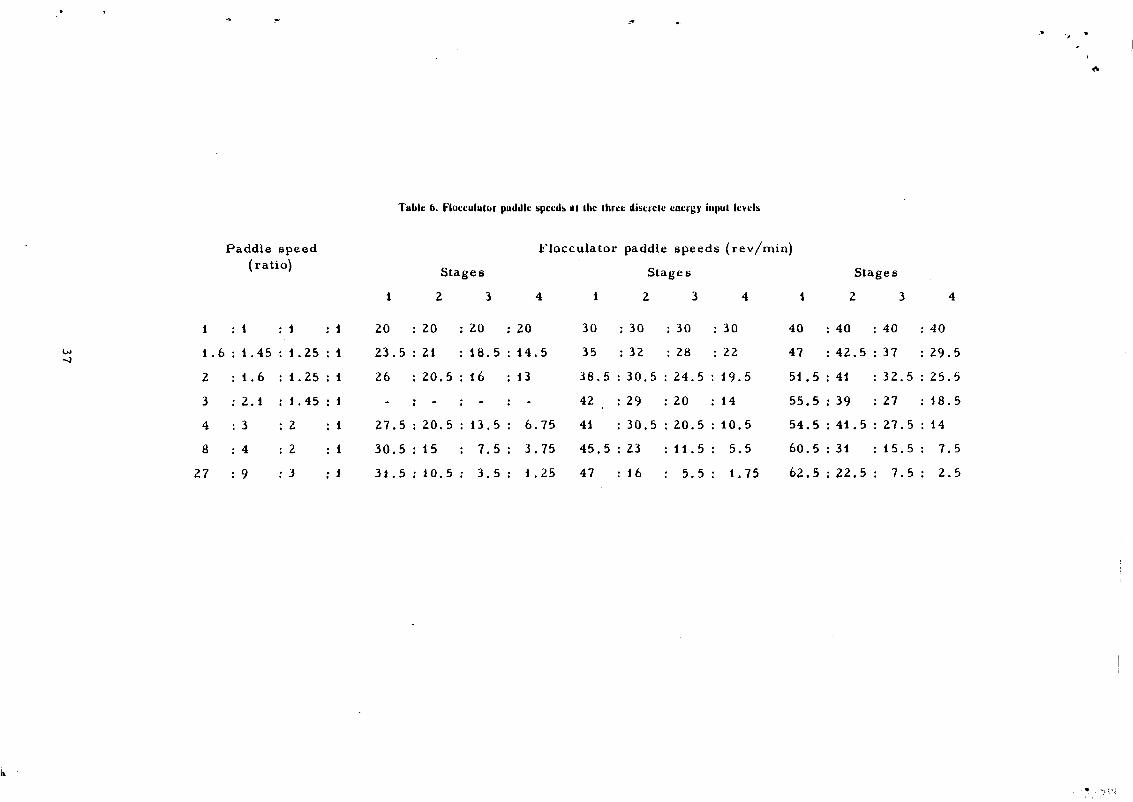
Table 6 summarizes the paddle speeds used at each energy level and paddle speed
ra t io .
36
Paddle speed (ratio)
1
1.6
2
3
4
8
27
1
1.45
1.6
2.1
3
4
9
1 : 1
1.25 : 1
1.25 : 1
1.45 ; 1
2 : 1
2 : 1
3 : 1
Tabic 6. Flocculutor paddle speeds at I he three disercle energy input levels
S t a g e s
2 3
F l o c c u l a t o r paddle s p e e d s ( r e v / m i n )
S t a g e s
2 3
20
23.5
26
27.5
30.5
31.5
20
21
20.5
20.5
15
10.5
20 :
18.5 :
16 :
13.5 :
7.5 :
3.5 :
20
1 4 . 5
13
6 . 7 5
3 . 7 5
1 . 2 5
1
30
35
3 8 . 5
42
41
4 5 . 5
47
: 30
: 32
: 30.5
: 29
: 30.5
: 23
: 16
: 30 :
: 28 :
24.5 :
20 :
20.5 :
11.5 :
5.5 :
4
30
22
19.5
14
10.5
5.5
1.75
1
40
47
51.5
55.5
54.5
60.5
62.5
Stages
2
40
42.5
41
: 39
41.5
: 31
: 22.5
3
40
37
32.5
27
27.5
15.5
7.5
4
40
29.5
25.5
18.5
14
7.5
2.5
REFERENCES
WATER RESEARCH ASSOCIATION Technical Paper TP 87
WATER RESEARCH ASSOCIATION Technical Paper TP 88
Water clarification by flotation - 1. A survey of the l i tera ture; by R . F ; Packham and W.N. Richards . Medmenham, The Association, 1972.
Water clarification by flotation - 2. A laboratory study of the feasibility of floe flotation; by R . F . Packham and W.N. Richards . Medmenham, The Association, 1972.
WATER RESEARCH CENTRE Technical Report TR 2
VAN VUUREN, L . R . J . , -STANDER, C . J . , HENZEN, M.R. , MEIRING, P . G . J , and VAN BLERK, S .N.V.
Water clarification by flotation - 3 . Treatment of Thames water in a pilot-scale flotation plant; by R . F . Packham and W.N. Richards . Medmenham, The Centre, February 1975.
Advanced purification of sewage works effluent, using a combined system of lime softening and flotation. Wat. Res . 1967, 1, 463-474.
WATER RESEARCH ASSOCIATION Technical Paper TP 43
NIELD, A.H.
Water Treatment P roces se s - 1. Pi lo t -scale experiments on the processes used in the treatment of water by chemical coagulation, including qualitative.work on mechanical flocculation, studies of the floe blanket system and initial investigations of sand filtrations; by D.G. Miller, M. Robinson and J . T . West. Medmenham, The Association, May 1965.
Automatic determination of iron in water' using 1:10 phenanthroline. WRA Technical Inquiry Report TIR 199, May 1969, The Association, Medmenham.
VOGEL, A . I . Quantitative Inorganic Analysis . 3rd Edition, Longmans, 1972(1961), p . 372 and p . 43 6.
WATER RESEARCH ASSOCIATION Technical Paper TP 68
Automatic determination of aluminium; by N . J . Nicholson and A .H. Nield. t!
Medmenham, The Association, August 1969.
DEPARTMENT OF THE ENVIRONMENT
WATER RESEARCH ASSOCIATION Technical Memorandum TM 63
Analysis of raw, potable and waste water s .̂ London, HMSO, 1972, p . 2 7 a n d p . 4 0 .
Algal monitoring of water supply reservoi rs and r ivers ; by R. E. Youngman. Medmenha The Association, March 1971.
38
1 1 . RICHARDS, W.N.
12. PACKHAM. R . F .
13 . WATER RESEARCH ASSOCIATION Technical Inquiry Report TIR 248(A)
14. WATER RESEARCH ASSOCIATION Technical Memorandum TM 106
1 5 . WATER RESEARCH ASSOCIATION Technical Paper TP 25
16. HUGHES, E.
Aspects of flotation as a water treatment p roces s . M.Phi l . (London, external) 1975.
A multiple s t i r r e r unit for coagulation t e s t s . Wat. and Wat. Engng, 1961, 66, 105-107.
Technique for laboratory coagulation t e s t s . Medmenham, The Association, October 1973.
The determination of dissolved a i r in water; by R . F . Packham and W.N. Richards . Medmenham, The Centre, March 1975.
Flow design of flocculators; a l i terature survey. Medmenham, The Association, October 1962.