Resultaten en bevindingen van project Groene Methanol: een experimentele benadering Dit rapport is onderdeel van de projectencatalogus energie-innovatie. Tussen 2005 en 2011 kregen ruim 1000 innovatieve onderzoeks- en praktijkprojecten subsidie. Ze delen hun resultaten en bevindingen, ter inspiratie voor nieuwe onderzoeks- en productideeën. De subsidies werden verleend door de energie-innovatieprogramma's Energie Onderzoek Subsidie (EOS) en Innovatie Agenda Energie (IAE). Datum November 2008 Status Definitief BGT Biomass Technology Group B.V., e.a. in opdracht van Agentschap NL Resultaten en bevindingen van project Groene Methanol: een experimentele benadering Dit rapport is onderdeel van de projectencatalogus energie-innovatie. Tussen 2005 en 2011 kregen ruim 1000 innovatieve onderzoeks- en praktijkprojecten subsidie. Ze delen hun resultaten en bevindingen, ter inspiratie voor nieuwe onderzoeks- en productideeën. De subsidies werden verleend door de energie-innovatieprogramma's Energie Onderzoek Subsidie (EOS) en Innovatie Agenda Energie (IAE). Datum November 2008 Status Definitief BGT Biomass Technology Group B.V., e.a. in opdracht van Agentschap NL
Transcript
Resultaten en bevindingen van project
Groene Methanol: een experimentele benadering
Dit rapport is onderdeel van de projectencatalogus energie-innovatie. Tussen 2005 en 2011 kregen ruim 1000 innovatieve onderzoeks- en praktijkprojecten subsidie. Ze delen hun resultaten en bevindingen, ter inspiratie voor nieuwe onderzoeks- en productideeën. De subsidies werden verleend door de energie-innovatieprogramma's Energie Onderzoek Subsidie (EOS) en Innovatie Agenda Energie (IAE).
Datum November 2008 Status Definitief BGT Biomass Technology Group B.V., e.a. in opdracht van Agentschap NL
Colofon
Projectnaam Groene Methanol: een experimentele benadering Programma Energie Onderzoek Subsidie Regeling Nieuw Energie Onderzoek Projectnummer NEOT01008 Contactpersoon BGT Biomass Technology Group B.V. Hoewel dit rapport met de grootst mogelijke zorg is samengesteld kan Agentschap NL geen enkele aansprakelijkheid aanvaarden voor eventuele fouten.
Titel Groene Methanol: een experimentele benadering
Openbaar eindrapport
BTG Biomass Technology Group B.V. RijksUniversiteit Groningen
Datum Nov 2008
Voor SenterNovem
2
Groene Methanol: een experimentele benadering
Colofon Auteurs: R.H. Venderbosch (with contributions of RijksUniversiteit Groningen) BTG Biomass Technology Group BV Postbus 217 7500 AE Enschede Tel. Office +31-53-4861186 Tel. Direct +31-53-4862281 Fax +31-53-4861180 www.btgworld.com [email protected] Het project is uitgevoerd met subsidie van het Ministerie van Economische Zaken, regeling EOS: Nieuw Energieonderzoek, uitgevoerd door SenterNovem. Projectnummer: NEOT01008 Penvoerder: BTG
3
Public Summary Crude glycerine is a by-product of biodiesel from the trans-esterification, with (fossil fuel derived) methanol as a feed. Due to a surplus of glycerine in the near future, its prices will go down significantly. A sustainable outlet for the glycerine is to convert Glycerine into Methanol (‘GtM’), the latter to be used for the trans-esterification reaction. Important considerations here are to develop an economic and energy-efficient GtM process (a) at a scale matching the quantities of crude glycerine produced at small-to-medium scale biodiesel plants and (b) using crude glycerine without the need for extensive upgrading first. In this project, the following activities were carried out:
- Experimental work on the synthesis of methanol from artificial syngas in a packed bed reactor for proof of principle;
- Experimental work on the synthesis of methanol in autoclave experiment ts for the prupose of kinetic modelling;
- Analysis of the methanol samples produced; - Modelling the methanol synthesis at these extreme conditions; - Construction of a supercritical gasification unit coupled with a methanol synthesis
reactor; - Experimental work on the use of glycerine derived syngas in methanol synthesis. - Preparation of a long term research project.
If glycerin is gasified in water under supercritical conditions, synthesis gas (CO + H2) is produced next to various hydrocarbons (CH4, C2
+,…). The hydrocarbons (depending on the process conditions up to 175 kg/t glycerine) are shown inert for methanol synthesis. The yield of methanol is indeed limited to about 250 kg/t glycerine, however these values are dependent on applied reactor conditions and strongly depends on the amount of methane and CO2.produced in the supercritical gasification process. Limited amounts of higher alcohols were produced, and the main by-product is water. Results were successfully compared with theoretical calculations based upon reaction kinetics. Long-term testing is now necessary to determine the deactivation rate and contaminants relevant. A follow-up of the project is now undertaken in a European project SUPERMETHANOL (for further information such as project objectives and summary, see also http://supermethanol.eu/), in which three Dutch partners are participating, viz. BTG Biomass Technology Group, RijksUniversiteit Groningen and Sparqle International.
4
Table of content 1 Summary.......................................................................................................5
1.1.1 Biodiesel production.....................................................................................5 1.1.2 Glycerine......................................................................................................6 1.1.3 Reforming in supercritical water (RSW)........................................................6 1.1.4 Methanol synthesis ......................................................................................9 1.1.5 Reforming in supercritical water and relevance for methanol synthesis......11
3 Results ........................................................................................................17 3.1 Methanol synthesis in a packed bed using artificial gas ..........................17 3.2 Comparison with model calculations.........................................................20 3.3 Analysis of samples produced ...................................................................20
3.3.1 Water analysis ...........................................................................................21 3.3.2 Identification of by-products .......................................................................21 3.3.3 Quantification of main by-products .............................................................22 3.3.4 Analysis .....................................................................................................24
3.4 Elemental Analysis ......................................................................................26 3.5 Methanol synthesis in the kinetic set-up ...................................................27 3.6 Methanol synthesis from glycerine in a SCW set-up ................................28
4 Preparation of a LT-EOS proposal............................................................30 5 Conclusions and recommendations..............................................................31
5
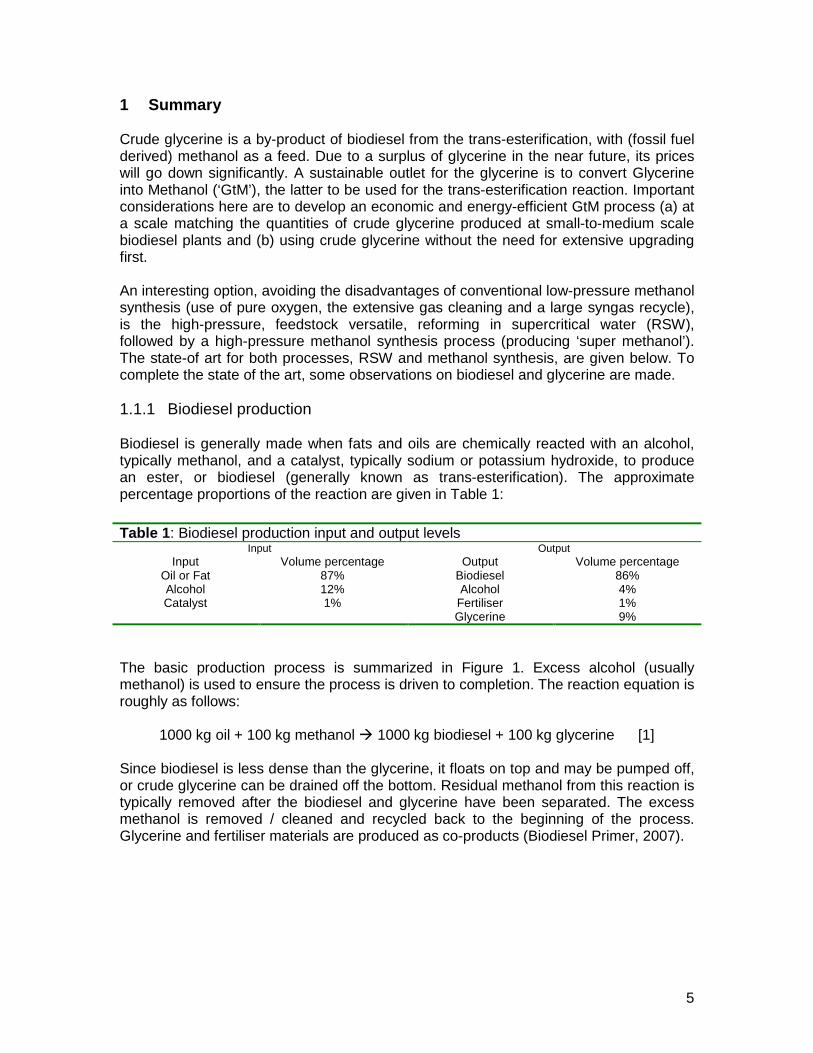
1 Summary Crude glycerine is a by-product of biodiesel from the trans-esterification, with (fossil fuel derived) methanol as a feed. Due to a surplus of glycerine in the near future, its prices will go down significantly. A sustainable outlet for the glycerine is to convert Glycerine into Methanol (‘GtM’), the latter to be used for the trans-esterification reaction. Important considerations here are to develop an economic and energy-efficient GtM process (a) at a scale matching the quantities of crude glycerine produced at small-to-medium scale biodiesel plants and (b) using crude glycerine without the need for extensive upgrading first. An interesting option, avoiding the disadvantages of conventional low-pressure methanol synthesis (use of pure oxygen, the extensive gas cleaning and a large syngas recycle), is the high-pressure, feedstock versatile, reforming in supercritical water (RSW), followed by a high-pressure methanol synthesis process (producing ‘super methanol’). The state-of art for both processes, RSW and methanol synthesis, are given below. To complete the state of the art, some observations on biodiesel and glycerine are made. 1.1.1 Biodiesel production Biodiesel is generally made when fats and oils are chemically reacted with an alcohol, typically methanol, and a catalyst, typically sodium or potassium hydroxide, to produce an ester, or biodiesel (generally known as trans-esterification). The approximate percentage proportions of the reaction are given in Table 1:
Table 1: Biodiesel production input and output levels Input Output
The basic production process is summarized in Figure 1. Excess alcohol (usually methanol) is used to ensure the process is driven to completion. The reaction equation is roughly as follows:
1000 kg oil + 100 kg methanol � 1000 kg biodiesel + 100 kg glycerine [1]
Since biodiesel is less dense than the glycerine, it floats on top and may be pumped off, or crude glycerine can be drained off the bottom. Residual methanol from this reaction is typically removed after the biodiesel and glycerine have been separated. The excess methanol is removed / cleaned and recycled back to the beginning of the process. Glycerine and fertiliser materials are produced as co-products (Biodiesel Primer, 2007).
6
Caustic soda
Methanol
Trans-esterification
Neutralised Oil
Methanol Recovery
Evaporation
Crude glycerol
Glycerine Distillation
Glycerine bleaching
Pharma Glycol Bio-diesel Fatty Acid
Caustic soda
Methanol
Trans-esterification
Neutralised Oil
Methanol Recovery
Evaporation
Crude glycerol
Glycerine Distillation
Glycerine bleaching
Pharma Glycol Bio-diesel Fatty Acid
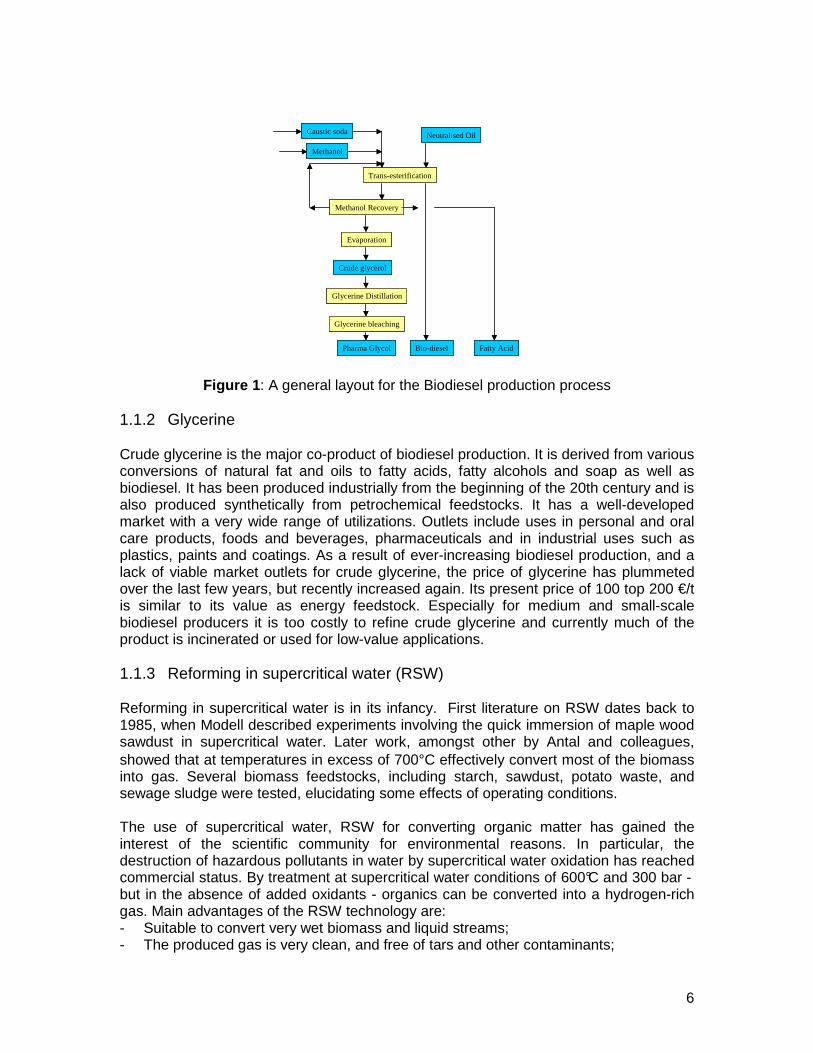
Figure 1: A general layout for the Biodiesel production process 1.1.2 Glycerine Crude glycerine is the major co-product of biodiesel production. It is derived from various conversions of natural fat and oils to fatty acids, fatty alcohols and soap as well as biodiesel. It has been produced industrially from the beginning of the 20th century and is also produced synthetically from petrochemical feedstocks. It has a well-developed market with a very wide range of utilizations. Outlets include uses in personal and oral care products, foods and beverages, pharmaceuticals and in industrial uses such as plastics, paints and coatings. As a result of ever-increasing biodiesel production, and a lack of viable market outlets for crude glycerine, the price of glycerine has plummeted over the last few years, but recently increased again. Its present price of 100 top 200 €/t is similar to its value as energy feedstock. Especially for medium and small-scale biodiesel producers it is too costly to refine crude glycerine and currently much of the product is incinerated or used for low-value applications. 1.1.3 Reforming in supercritical water (RSW) Reforming in supercritical water is in its infancy. First literature on RSW dates back to 1985, when Modell described experiments involving the quick immersion of maple wood sawdust in supercritical water. Later work, amongst other by Antal and colleagues, showed that at temperatures in excess of 700°C effectively convert most of the biomass into gas. Several biomass feedstocks, including starch, sawdust, potato waste, and sewage sludge were tested, elucidating some effects of operating conditions. The use of supercritical water, RSW for converting organic matter has gained the interest of the scientific community for environmental reasons. In particular, the destruction of hazardous pollutants in water by supercritical water oxidation has reached commercial status. By treatment at supercritical water conditions of 600°C and 300 bar - but in the absence of added oxidants - organics can be converted into a hydrogen-rich gas. Main advantages of the RSW technology are: - Suitable to convert very wet biomass and liquid streams; - The produced gas is very clean, and free of tars and other contaminants;
7
- The raw gas is very rich in hydrogen (50 - 60 vol%); - The gas becomes available at high pressure, avoiding the need for expensive
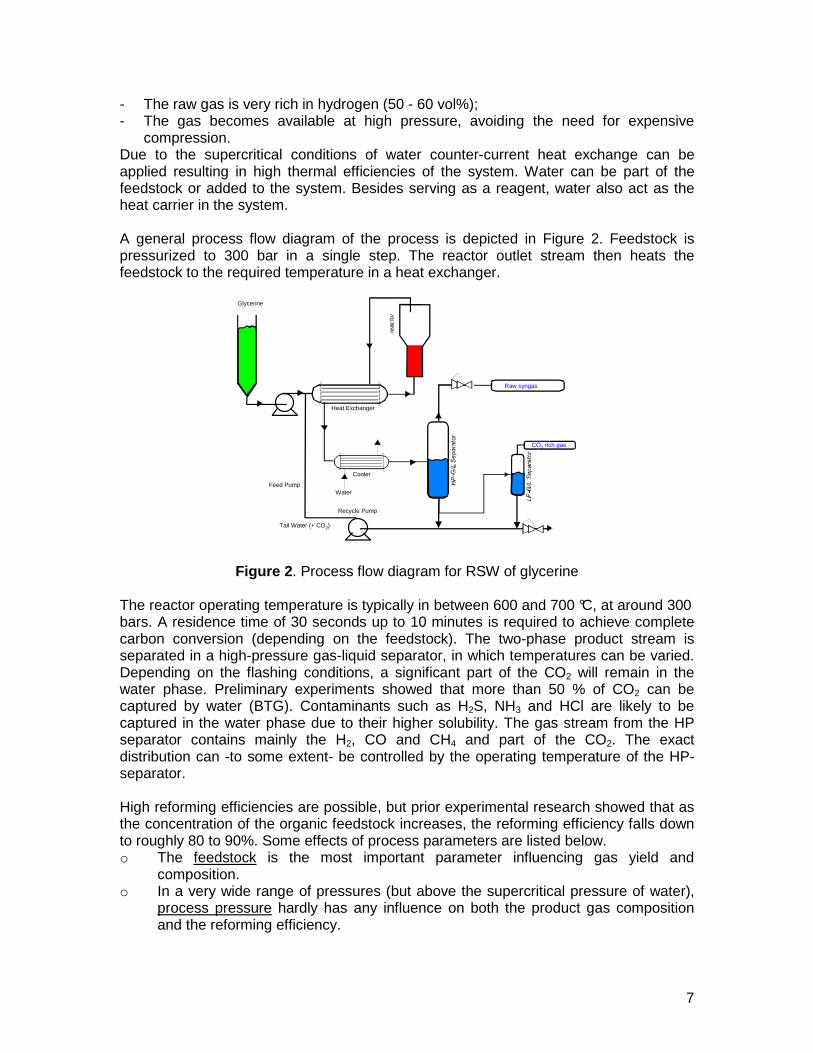
compression. Due to the supercritical conditions of water counter-current heat exchange can be applied resulting in high thermal efficiencies of the system. Water can be part of the feedstock or added to the system. Besides serving as a reagent, water also act as the heat carrier in the system. A general process flow diagram of the process is depicted in Figure 2. Feedstock is pressurized to 300 bar in a single step. The reactor outlet stream then heats the feedstock to the required temperature in a heat exchanger.
Heat Exchanger
CO2 rich gas
Feed Pump
Cooler
Water
Raw syngas
Glycerine
Tail Water (+ CO2)
Recycle Pump
Figure 2. Process flow diagram for RSW of glycerine The reactor operating temperature is typically in between 600 and 700 °C, at around 300 bars. A residence time of 30 seconds up to 10 minutes is required to achieve complete carbon conversion (depending on the feedstock). The two-phase product stream is separated in a high-pressure gas-liquid separator, in which temperatures can be varied. Depending on the flashing conditions, a significant part of the CO2 will remain in the water phase. Preliminary experiments showed that more than 50 % of CO2 can be captured by water (BTG). Contaminants such as H2S, NH3 and HCl are likely to be captured in the water phase due to their higher solubility. The gas stream from the HP separator contains mainly the H2, CO and CH4 and part of the CO2. The exact distribution can -to some extent- be controlled by the operating temperature of the HP-separator. High reforming efficiencies are possible, but prior experimental research showed that as the concentration of the organic feedstock increases, the reforming efficiency falls down to roughly 80 to 90%. Some effects of process parameters are listed below. o The feedstock is the most important parameter influencing gas yield and
composition. o In a very wide range of pressures (but above the supercritical pressure of water),
process pressure hardly has any influence on both the product gas composition and the reforming efficiency.
8
o The concentration of the feedstock usually exerts a limitation on the process. Concentrations higher than 5 to 10 wt. % lead to a significant drop of the hydrogen yield and carbon reforming efficiency.
o A higher temperature shows higher biomass conversion rates, and improved yields. Slow heating up leads to the promotion of coke/char, and reduce gas yield.
o The gas composition depends on various aspects, such as temperature, type of feedstock, presence of any catalysts (including catalytic effect of reactor walls), heating up rate of the feed etc. Relatively little is known on the effect of gas composition as a function of these parameters. Substantial amounts of hydrocarbons (CH4 and C2
+) are found in the product gas, while the concentration of the syngas component (H2, CO and CO2) depend on the presence of catalysts. Higher syngas (and lower hydrocarbons) concentrations are promoted by more rapid heating up rates for the biomass.
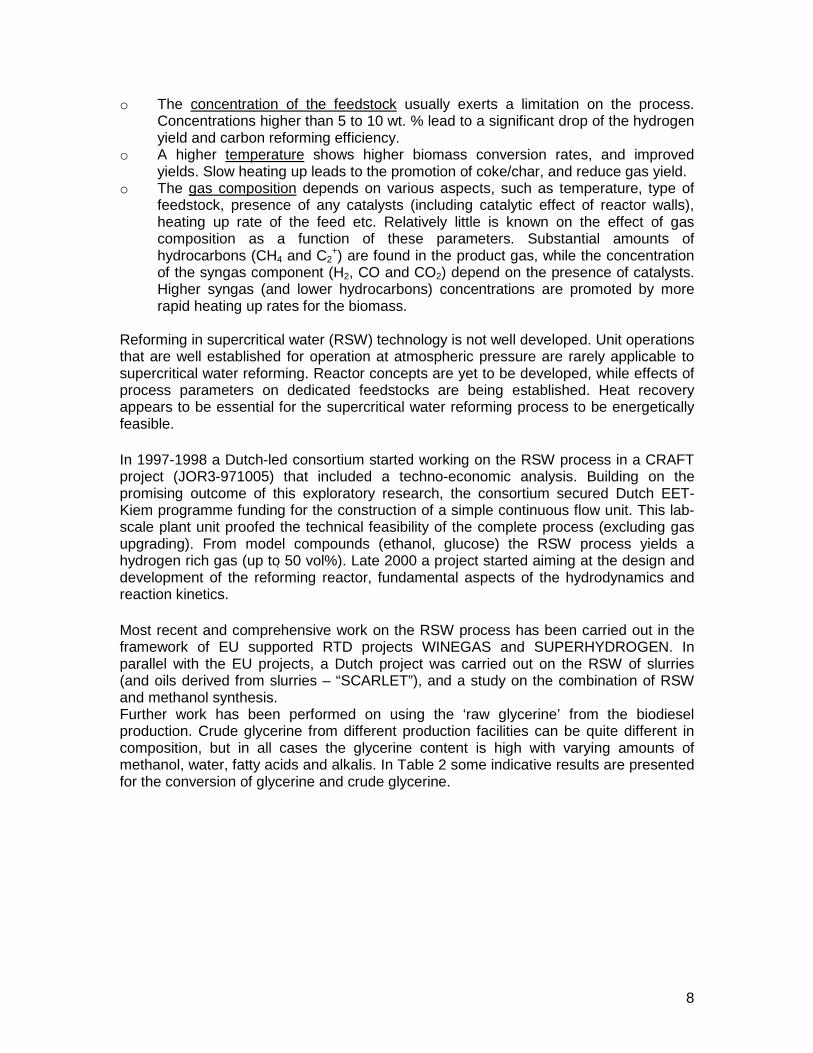
Reforming in supercritical water (RSW) technology is not well developed. Unit operations that are well established for operation at atmospheric pressure are rarely applicable to supercritical water reforming. Reactor concepts are yet to be developed, while effects of process parameters on dedicated feedstocks are being established. Heat recovery appears to be essential for the supercritical water reforming process to be energetically feasible. In 1997-1998 a Dutch-led consortium started working on the RSW process in a CRAFT project (JOR3-971005) that included a techno-economic analysis. Building on the promising outcome of this exploratory research, the consortium secured Dutch EET-Kiem programme funding for the construction of a simple continuous flow unit. This lab-scale plant unit proofed the technical feasibility of the complete process (excluding gas upgrading). From model compounds (ethanol, glucose) the RSW process yields a hydrogen rich gas (up to 50 vol%). Late 2000 a project started aiming at the design and development of the reforming reactor, fundamental aspects of the hydrodynamics and reaction kinetics. Most recent and comprehensive work on the RSW process has been carried out in the framework of EU supported RTD projects WINEGAS and SUPERHYDROGEN. In parallel with the EU projects, a Dutch project was carried out on the RSW of slurries (and oils derived from slurries – “SCARLET”), and a study on the combination of RSW and methanol synthesis. Further work has been performed on using the ‘raw glycerine’ from the biodiesel production. Crude glycerine from different production facilities can be quite different in composition, but in all cases the glycerine content is high with varying amounts of methanol, water, fatty acids and alkalis. In Table 2 some indicative results are presented for the conversion of glycerine and crude glycerine.
9
Table 2. Experimental results: typical gas phase concentrations for two types of feed: pure glycerine, and alkalized glycerin to which alkalis (Na2CO3) are added. Glycerine (10 vol.%) Alkalized glycerine
Alkalis in the feedstock are likely to promote the water-gas-shift reaction resulting in a higher hydrogen concentration and consumption of water. For most catalytic processes it is required that the concentration of CH4 + C2
+ is minimized to avoid catalyst deactivation and reduction of syngas yield. Particularly in the SUPER HYDROGEN project work has been carried out with a pre-reforming catalysts to remove the C2
+. These results will be used as a start for the present investigations. Tests in the pilot-plant showed that a cold gas efficiency of up to 80% can be obtained for feed stock in water, at concentration in between 5 and 10 wt.%. Using glycerine, higher feedstock concentration could be used without causing operational problems. 1.1.4 Methanol synthesis Methanol has a history extending back to about 1661. It was re-discovered in 1822 by Taylor, after which in 1835 Von Liebig succeeded in clarifying the chemical individuality of methanol. In the hundred years following this, methanol was recovered to an increasing degree as wood alcohol by distilling wood. In 1913, Mittasch and his staff succeeded in first producing methanol from carbon monoxide and hydrogen (‘synthesis gas’ or ‘syngas’), with iron as catalyst. Patart then described a methanol synthesis process using hydrogenation active metals, and metal oxides stated to be the catalyst. This led to a first commercial plant in France (1922). The formation of methanol from synthesis gas takes place according to two main equations:
Methanol synthesis CO + 2 H2 ↔ CH3OH [2a] Water-Gas Shift reaction CO + H2O ↔ CO2 + H2 [2b]
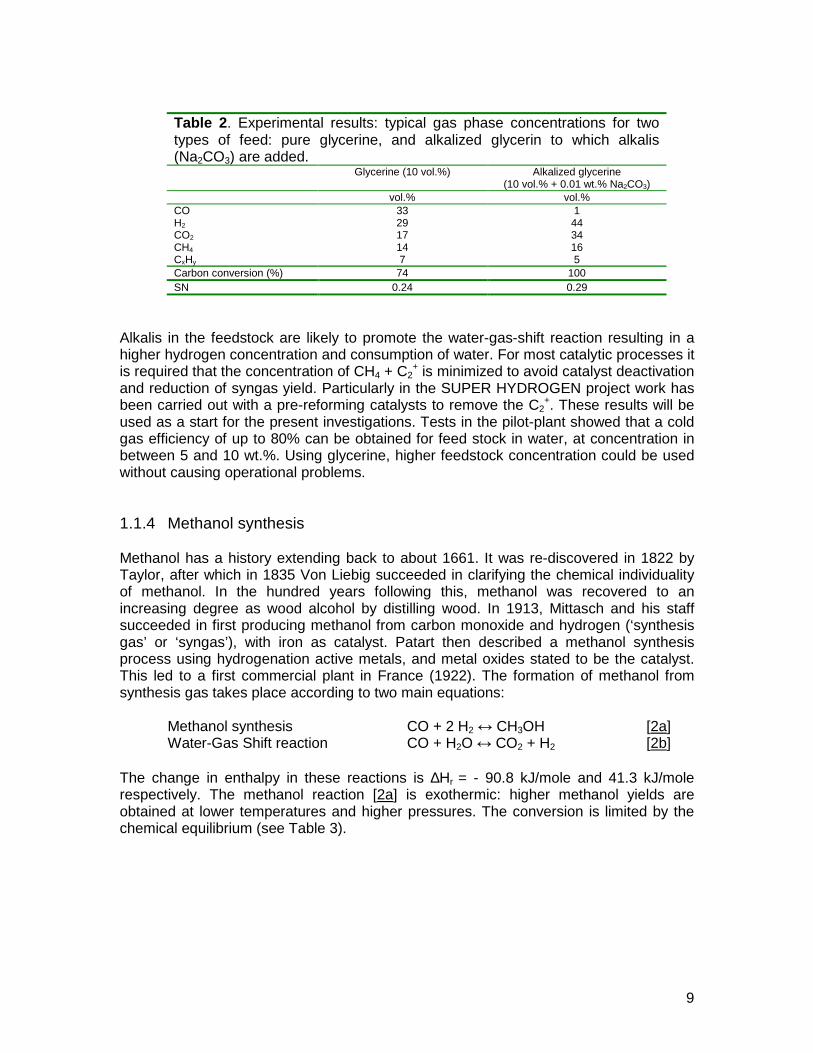
The change in enthalpy in these reactions is ∆Hr = - 90.8 kJ/mole and 41.3 kJ/mole respectively. The methanol reaction [2a] is exothermic: higher methanol yields are obtained at lower temperatures and higher pressures. The conversion is limited by the chemical equilibrium (see Table 3).
10
Table 3. The conversion of CO and CO2 at equilibrium conditions (syngas: 3 vol.% CO2, 27 vol.% CO, 64 vol.% H2, 6 vol.% CH4 + N2) Pressure (bar) 25 50 70 150 300 Temperature CO CO2 CO CO2 CO CO2 CO CO2 CO CO2 275oC 14.4 3.9 39.1 4.2 53.9 4.5 81.9 6.2 95.8 13.5 300oC 5.9 5.6 21.7 5.7 35.1 5.9 69.2 7.1 90.1 11.6 325oC 10.4 7.6 19.5 7.8 53.2 8.6 81.8 11.7 350oC 9.41 10.1 36.4 10.7 70.1 12.8
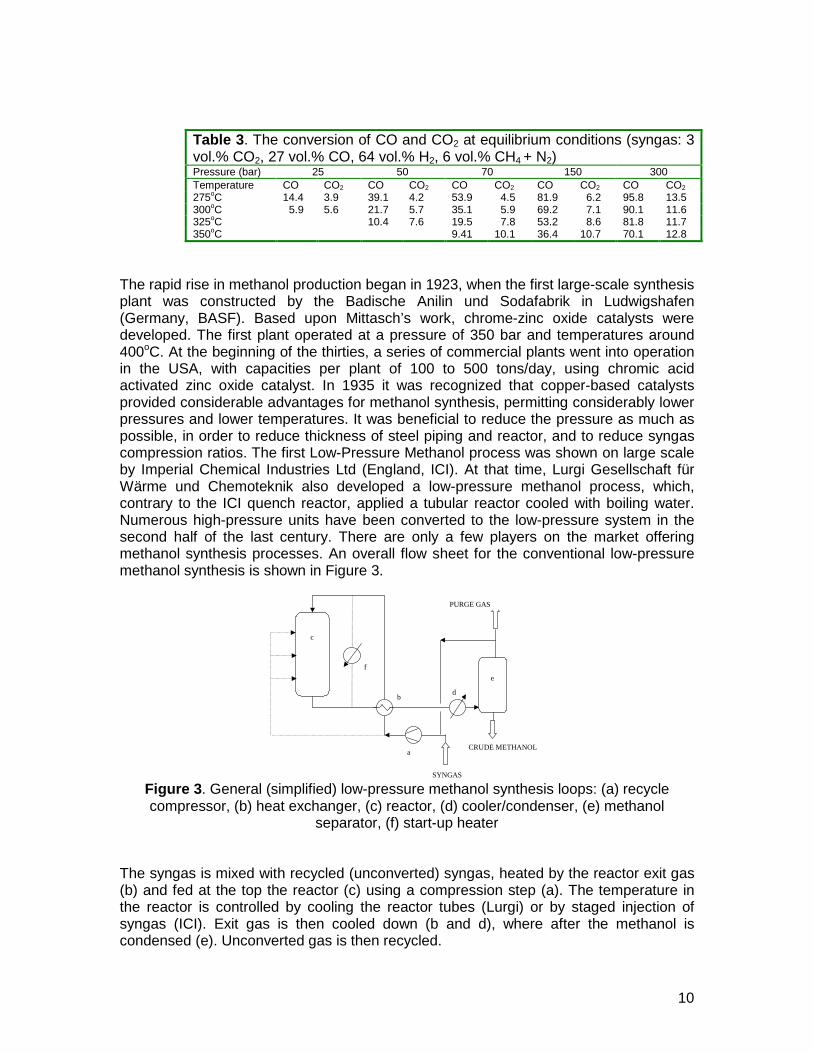
The rapid rise in methanol production began in 1923, when the first large-scale synthesis plant was constructed by the Badische Anilin und Sodafabrik in Ludwigshafen (Germany, BASF). Based upon Mittasch’s work, chrome-zinc oxide catalysts were developed. The first plant operated at a pressure of 350 bar and temperatures around 400oC. At the beginning of the thirties, a series of commercial plants went into operation in the USA, with capacities per plant of 100 to 500 tons/day, using chromic acid activated zinc oxide catalyst. In 1935 it was recognized that copper-based catalysts provided considerable advantages for methanol synthesis, permitting considerably lower pressures and lower temperatures. It was beneficial to reduce the pressure as much as possible, in order to reduce thickness of steel piping and reactor, and to reduce syngas compression ratios. The first Low-Pressure Methanol process was shown on large scale by Imperial Chemical Industries Ltd (England, ICI). At that time, Lurgi Gesellschaft für Wärme und Chemoteknik also developed a low-pressure methanol process, which, contrary to the ICI quench reactor, applied a tubular reactor cooled with boiling water. Numerous high-pressure units have been converted to the low-pressure system in the second half of the last century. There are only a few players on the market offering methanol synthesis processes. An overall flow sheet for the conventional low-pressure methanol synthesis is shown in Figure 3.
separator, (f) start-up heater The syngas is mixed with recycled (unconverted) syngas, heated by the reactor exit gas (b) and fed at the top the reactor (c) using a compression step (a). The temperature in the reactor is controlled by cooling the reactor tubes (Lurgi) or by staged injection of syngas (ICI). Exit gas is then cooled down (b and d), where after the methanol is condensed (e). Unconverted gas is then recycled.
11
Glycerine can be converted to methanol using conventional gasification routes, and an example will be BioMCN. Here, glycerine will be fed directly to a conventional methane steam reformer, after which the syngas will be further compressed for a subsequent methanol synthesis. The concept is different compared to approach undertaken here: - In BioMCN purified glycerine is to be applied, to avoid excessive charring on the
steam reforming catalyst. Right now, a glycerine purification system is being build; - The methanol synthesis process is carried out at conventional pressures of 60 to 100
bars, requiring recycle of syngas. 1.1.5 Reforming in supercritical water and relevance for methanol synthesis Methanol synthesis shows that higher pressures promote the complete conversion of the syngas, and reduce syngas recycle ratios. The limit in the pressure of the methanol synthesis, however, is mainly due to the costs in syngas production. The investment costs for the syngas production section alone is reportedly 50 % of the total plant costs for natural gas and up to 80% for coal or oil as a feed. The fact that the raw syngas from RSW becomes available at the high pressures is a distinct advantage relevant for methanol synthesis. Compared to conventional methanol synthesis, this enables cost effective methanol synthesis at lower scales of operation. The theoretical outcome of a technical feasibility appears very promising, and gave starting points for further investigations to be carried out, before it can be justified to start a larger research trajectory to investigate the overall concept: - The proof of principle is which glycerine is fed to a small scale gasifier, and the gas is
further upgraded and converted into methanol; - To provide insight in the methanol process using this different type of syngas, and
specifically focus on catalyst activity, reaction kinetics, possible contaminants and so on. Important is to establish the quality of the methanol as well, realising the completely different conditions at which it is produced compared to ‘commercial’ methanol.
- To assess the main actors that can be of additional support in such a further proof-of-demo project.
The specific activities were carried out at two different locations, viz. BTG (Enschede) and RuG (Groningen), and those are summarised below: BTG:
1. Construction of a methanol synthesis reactor;; 2. Production of methanol at the envisaged conditions; 3. Modification of the existing reformer unit and coupling to the methanol synthesis
reactor; 4. Production of small quantities of methanol from glycerine;
RuG: 5. Analysis of methanol products derived from step 2; 6. Modification / construction of a methanol kinetics reactor; 7. Production of methanol samples, and provide insight in the kinetics of methanol
synthesis at these extreme conditions. 8. Analysis of samples produced in step 4 and step 7.
Simultaneously, a proposal was for a larger project to investigate the GtM concept in a larger consortium.
12
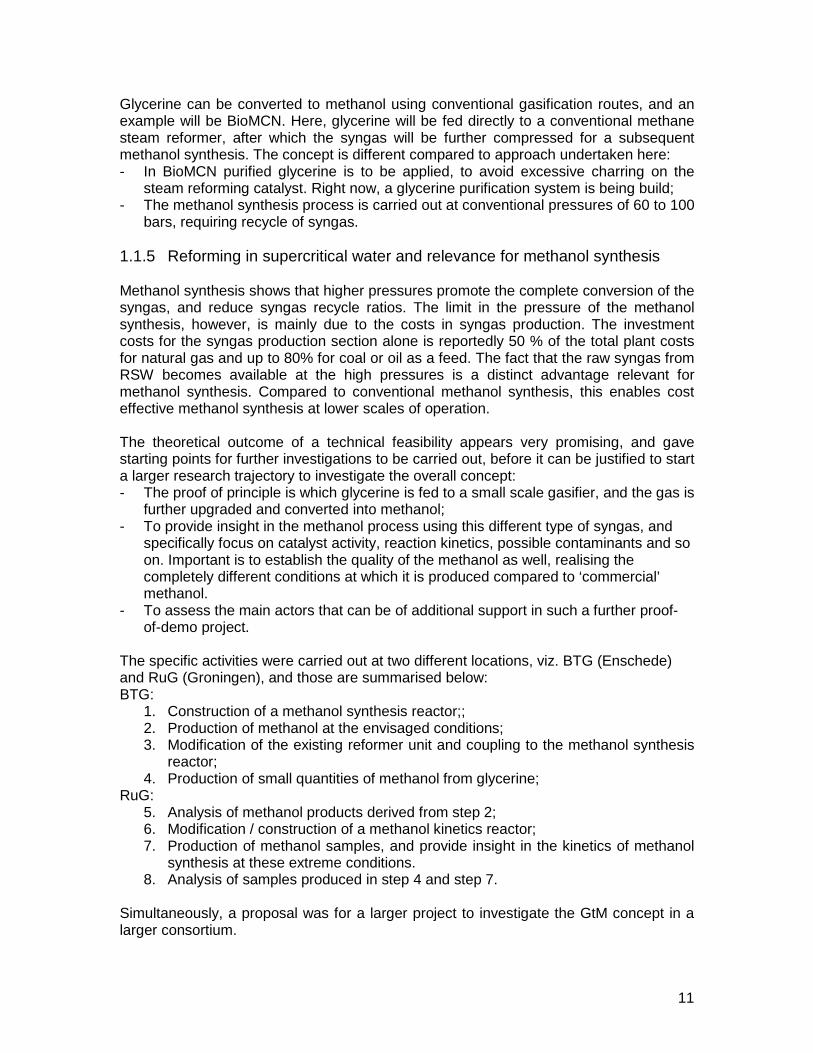
2 Experimental set-ups 2.1 Methanol synthesis coupled to RSW reactor The reactor is built up of a number of separate reactor parts. After the reactor, the water and gas are cooled down to room temperature. The water and gases are separated in a gas-liquid separator. The gas flows towards the methanol section, and “tail water” is separated. The gases subsequently flow through a gas meter and a gas sampling point, toward the ventilation system. Water is collected outside the box in another vessel, placed on a balance to record the weight. Directly after the methanol synthesis reactor, the gas are cooled down to room temperature and de-pressurized. The liquid products will be collected in the product vessel, while the gas is vented to the atmosphere through the ventilation system via a gas meter measuring the gas flow. The gas can be analyzed on relevant components (mainly CO2, CO, H2 en CH4). Liquid products can be tapped from the product vessel. The enclosed environment is applied in order to separate the MeOH liquid product and non-converted gases (flow towards gas meter and vent). 2.2 Kinetic measurements A continuous stirred laboratory reactor is used to evaluate reaction kinetics and product distributions for gas-solid kinetic measurements of the methanol synthesis. The finally implemented version can be found in Figures 6 and 7.
Figure 6. Final configuration. PID of experimental set-up for investigating the kinetics of high-pressure methanol synthesis.
13
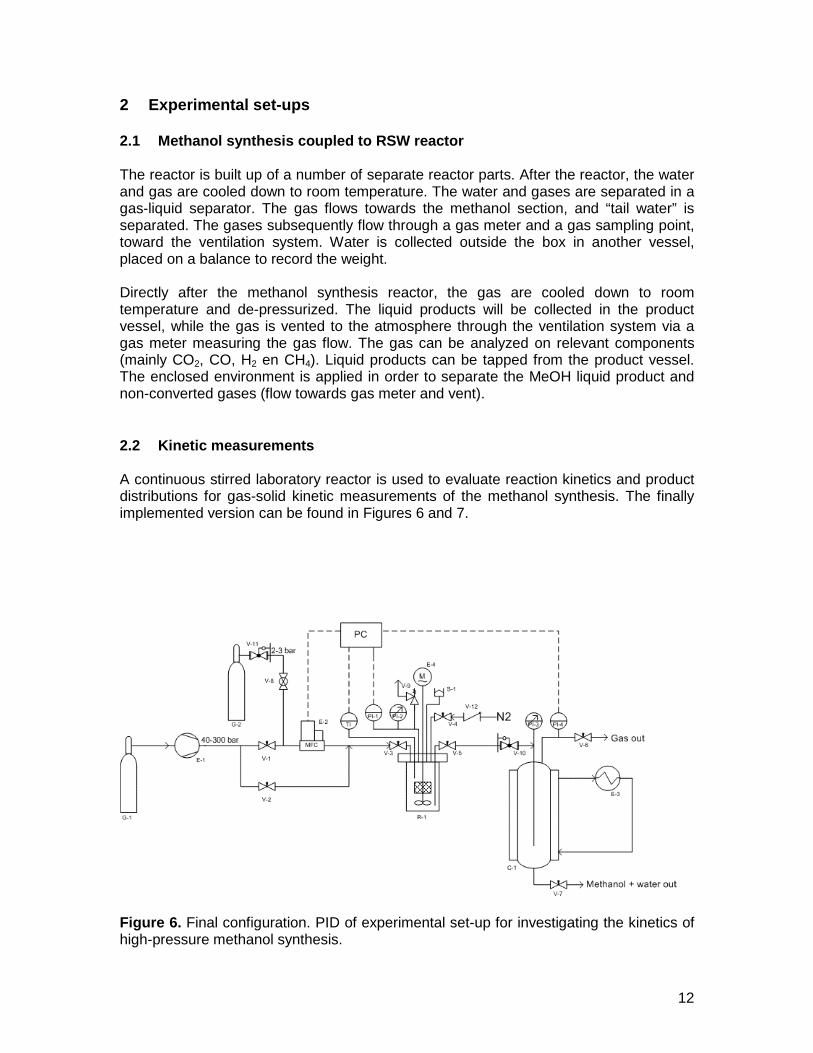
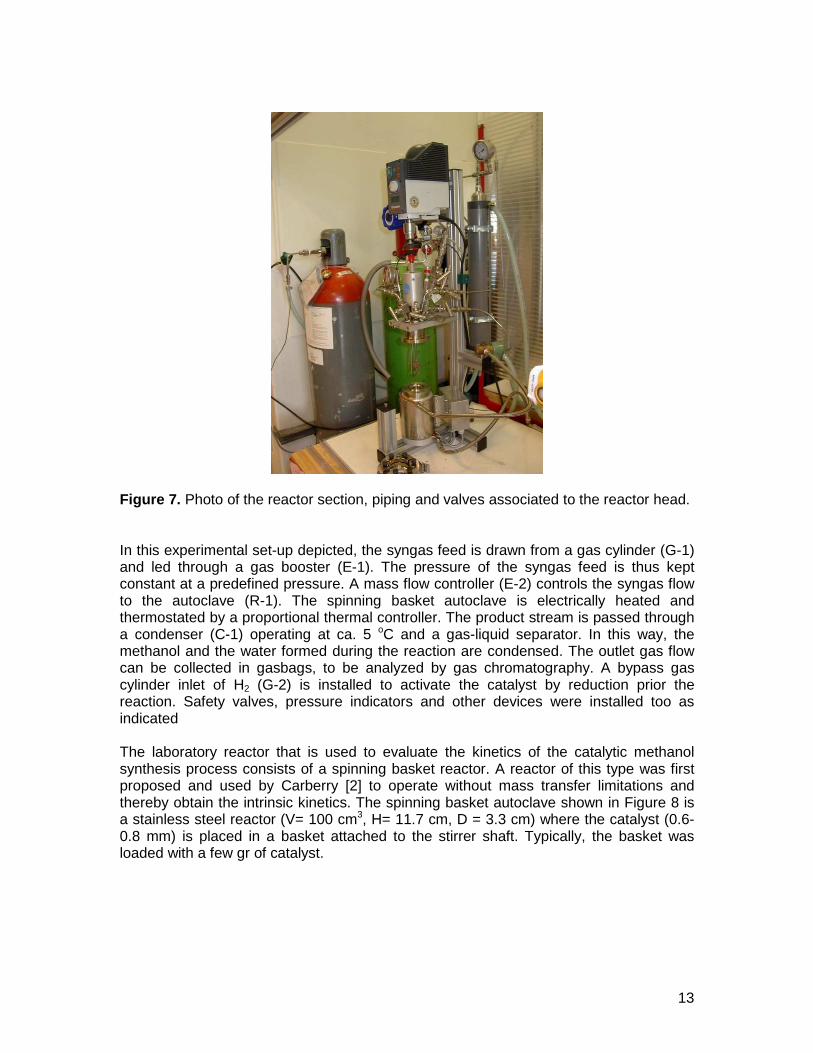
Figure 7. Photo of the reactor section, piping and valves associated to the reactor head. In this experimental set-up depicted, the syngas feed is drawn from a gas cylinder (G-1) and led through a gas booster (E-1). The pressure of the syngas feed is thus kept constant at a predefined pressure. A mass flow controller (E-2) controls the syngas flow to the autoclave (R-1). The spinning basket autoclave is electrically heated and thermostated by a proportional thermal controller. The product stream is passed through a condenser (C-1) operating at ca. 5 oC and a gas-liquid separator. In this way, the methanol and the water formed during the reaction are condensed. The outlet gas flow can be collected in gasbags, to be analyzed by gas chromatography. A bypass gas cylinder inlet of H2 (G-2) is installed to activate the catalyst by reduction prior the reaction. Safety valves, pressure indicators and other devices were installed too as indicated The laboratory reactor that is used to evaluate the kinetics of the catalytic methanol synthesis process consists of a spinning basket reactor. A reactor of this type was first proposed and used by Carberry [2] to operate without mass transfer limitations and thereby obtain the intrinsic kinetics. The spinning basket autoclave shown in Figure 8 is a stainless steel reactor (V= 100 cm3, H= 11.7 cm, D = 3.3 cm) where the catalyst (0.6-0.8 mm) is placed in a basket attached to the stirrer shaft. Typically, the basket was loaded with a few gr of catalyst.
14
Electrical heating
Baskets containing catalyst particles Electrical
heating
Baskets containing catalyst particles
Figure 8. Left) Schematic representation of the spinning basket autoclave and right) mounted device. 2.3 Analysis
2.3.1 Chromatographic instrumentation/technique Identification of the by-products in the methanol samples was carried out using a Shimadzu GC-2010 instrument equipped with a GCMS-QP2010 mass spectrometer (MS) and a VF-35ms low bleed column (mid polarity). The GC was operated under the following conditions: carrier gas was helium. A 0.1 µl sample volume was injected using the split mode. The samples were injected undiluted. In order to prevent methanol oversaturation of the MS detector, which causes the detector to shut down, the MS detection was started after the methanol peak elution. The purity of the commercial analytical grade methanol (LabScan), which was used as a solvent in the quantitative analysis, was also investigated by GC-MS analysis.
2.3.2 Chemicals Methanol was used as solvent and was of analytical grade (LabScan). Heptane (HPLC grade) was used as internal standard and was supplied by LabScan too. The ten other components used for calibration are enlisted in Table 2 below.
15
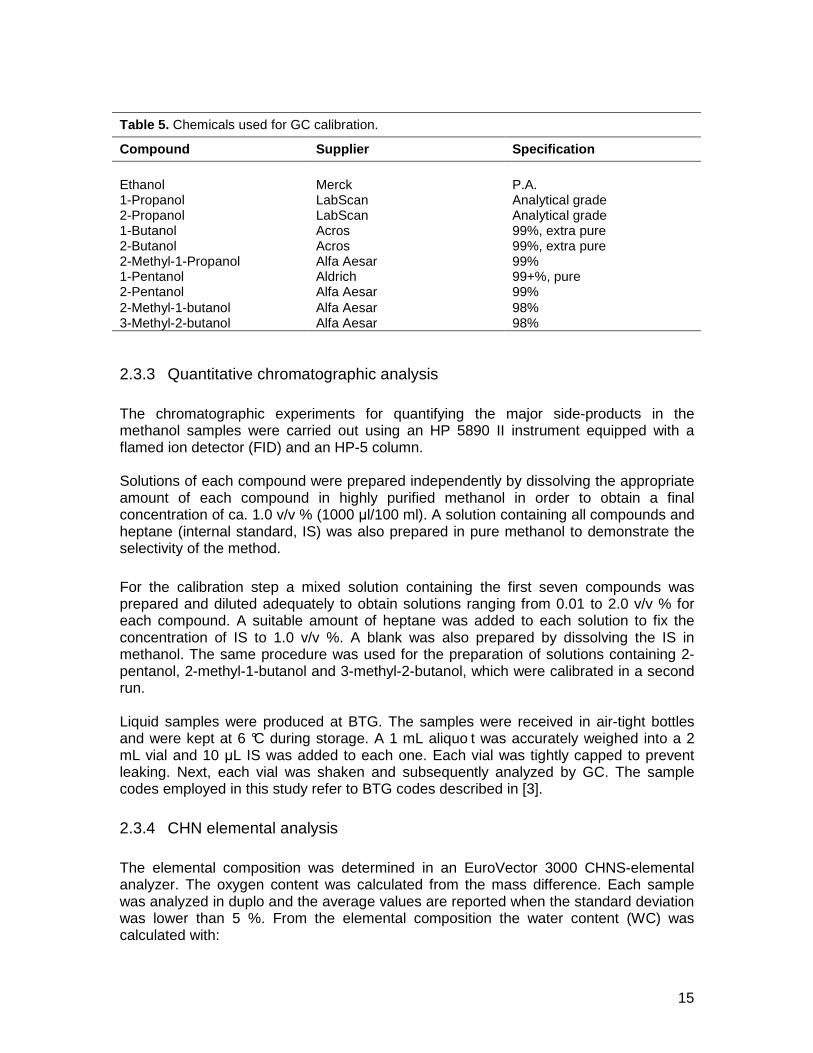
Table 5. Chemicals used for GC calibration.
Compound Supplier Specification
Ethanol
Merck
P.A.
1-Propanol LabScan Analytical grade 2-Propanol LabScan Analytical grade 1-Butanol Acros 99%, extra pure 2-Butanol Acros 99%, extra pure 2-Methyl-1-Propanol Alfa Aesar 99% 1-Pentanol Aldrich 99+%, pure 2-Pentanol Alfa Aesar 99% 2-Methyl-1-butanol Alfa Aesar 98% 3-Methyl-2-butanol Alfa Aesar 98% 2.3.3 Quantitative chromatographic analysis
The chromatographic experiments for quantifying the major side-products in the methanol samples were carried out using an HP 5890 II instrument equipped with a flamed ion detector (FID) and an HP-5 column. Solutions of each compound were prepared independently by dissolving the appropriate amount of each compound in highly purified methanol in order to obtain a final concentration of ca. 1.0 v/v % (1000 µl/100 ml). A solution containing all compounds and heptane (internal standard, IS) was also prepared in pure methanol to demonstrate the selectivity of the method.
For the calibration step a mixed solution containing the first seven compounds was prepared and diluted adequately to obtain solutions ranging from 0.01 to 2.0 v/v % for each compound. A suitable amount of heptane was added to each solution to fix the concentration of IS to 1.0 v/v %. A blank was also prepared by dissolving the IS in methanol. The same procedure was used for the preparation of solutions containing 2-pentanol, 2-methyl-1-butanol and 3-methyl-2-butanol, which were calibrated in a second run. Liquid samples were produced at BTG. The samples were received in air-tight bottles and were kept at 6 °C during storage. A 1 mL aliquo t was accurately weighed into a 2 mL vial and 10 µL IS was added to each one. Each vial was tightly capped to prevent leaking. Next, each vial was shaken and subsequently analyzed by GC. The sample codes employed in this study refer to BTG codes described in [3].
2.3.4 CHN elemental analysis
The elemental composition was determined in an EuroVector 3000 CHNS-elemental analyzer. The oxygen content was calculated from the mass difference. Each sample was analyzed in duplo and the average values are reported when the standard deviation was lower than 5 %. From the elemental composition the water content (WC) was calculated with:
16
( )
++⋅−=
C
OH
samplelTheoretica M
MMCCWC
41%%
Where C% is the percentage of carbon atoms and M denotes the atomic mass.
17
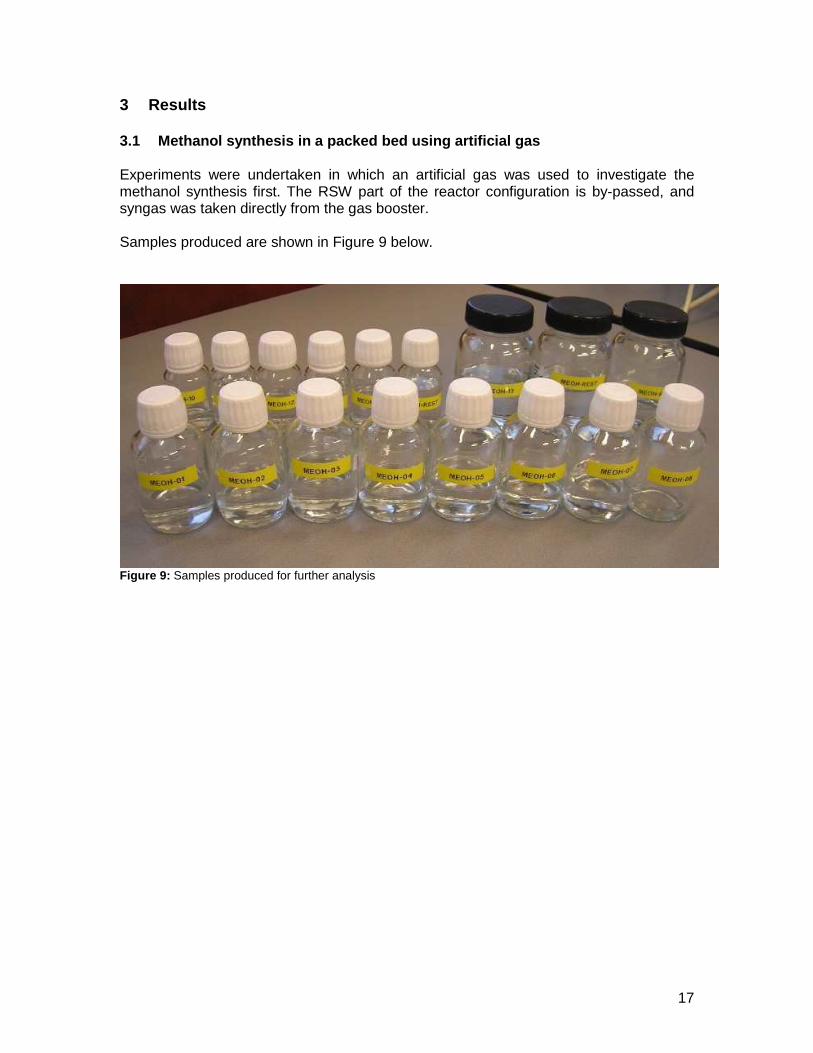
3 Results 3.1 Methanol synthesis in a packed bed using artificial gas Experiments were undertaken in which an artificial gas was used to investigate the methanol synthesis first. The RSW part of the reactor configuration is by-passed, and syngas was taken directly from the gas booster. Samples produced are shown in Figure 9 below.
Figure 9: Samples produced for further analysis
18
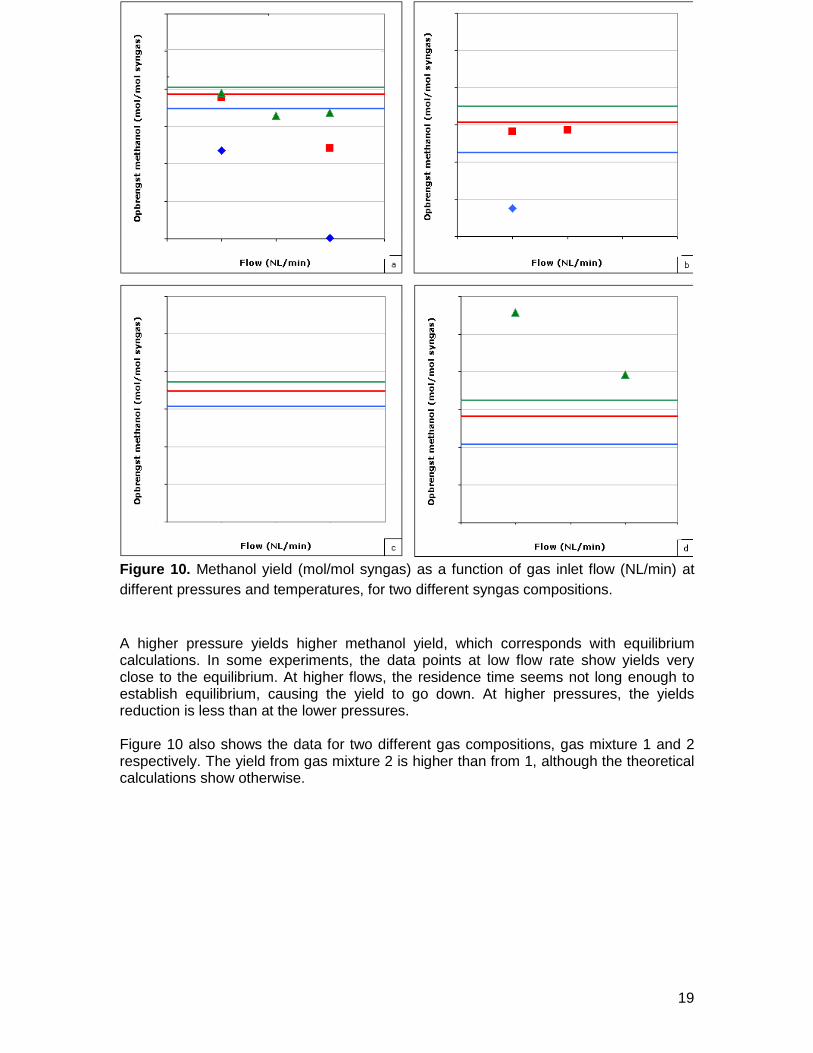
From first experiments onwards, in each experiment methanol was produced. This implies that these temperatures seem high enough for methanol production. Table 6 shows that, apart for the first experiment, mass balances were quite consistent, approaching 100%, especially if the difficult operating conditions and ways to analyze the gas and methanol are considered. The effect of pressure, flow and temperature on the amount of methanol produced is summarized in Figure 10 below. In all figures, the methanol production is presented as a function of the gas flow rate (in NL/min), for two different temperatures and two different pressures. In addition, lines are presented indicating the theoretical values at these conditions, based upon the thermodynamical equilibrium.
19
Figure 10. Methanol yield (mol/mol syngas) as a function of gas inlet flow (NL/min) at different pressures and temperatures, for two different syngas compositions. A higher pressure yields higher methanol yield, which corresponds with equilibrium calculations. In some experiments, the data points at low flow rate show yields very close to the equilibrium. At higher flows, the residence time seems not long enough to establish equilibrium, causing the yield to go down. At higher pressures, the yields reduction is less than at the lower pressures. Figure 10 also shows the data for two different gas compositions, gas mixture 1 and 2 respectively. The yield from gas mixture 2 is higher than from 1, although the theoretical calculations show otherwise.
20
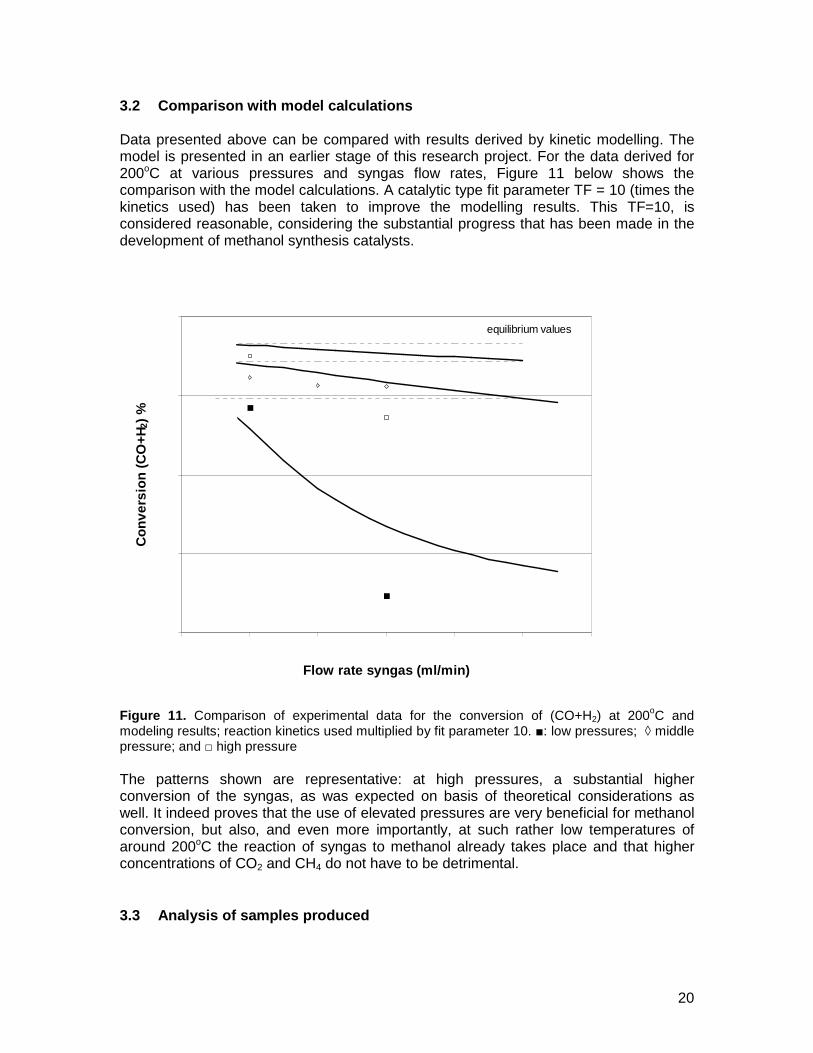
3.2 Comparison with model calculations Data presented above can be compared with results derived by kinetic modelling. The model is presented in an earlier stage of this research project. For the data derived for 200oC at various pressures and syngas flow rates, Figure 11 below shows the comparison with the model calculations. A catalytic type fit parameter TF = 10 (times the kinetics used) has been taken to improve the modelling results. This TF=10, is considered reasonable, considering the substantial progress that has been made in the development of methanol synthesis catalysts.
Figure 11. Comparison of experimental data for the conversion of (CO+H2) at 200oC and modeling results; reaction kinetics used multiplied by fit parameter 10. ■: low pressures; ◊ middle pressure; and □ high pressure The patterns shown are representative: at high pressures, a substantial higher conversion of the syngas, as was expected on basis of theoretical considerations as well. It indeed proves that the use of elevated pressures are very beneficial for methanol conversion, but also, and even more importantly, at such rather low temperatures of around 200oC the reaction of syngas to methanol already takes place and that higher concentrations of CO2 and CH4 do not have to be detrimental. 3.3 Analysis of samples produced
0
25
50
75
100
0 2 4 6 8 10 12
Flow rate syngas (ml/min)
Co
nve
rsio
n (
CO
+H2)
% 75 bar
250 bar
150 bar
equilibrium values
21
3.3.1 Water analysis One important characteristic of the methanol produced is the water content. The water is produced if CO2 is consumed following the reaction to methanol. Higher pressures, lower temperatures and lower gas flows yield higher water content in the product. The percentage of water in the samples is only slightly higher than can be calculated on basis of the thermodynamics. It is assumed that only through the CO2 hydrogenation reaction, water can be produced, and apparently this reaction appears to a larger extent than expected on basis of calculations. The samples produced are further analyzed on the presence of alcohols, and the qualification / qualification is given below. 3.3.2 Identification of by-products
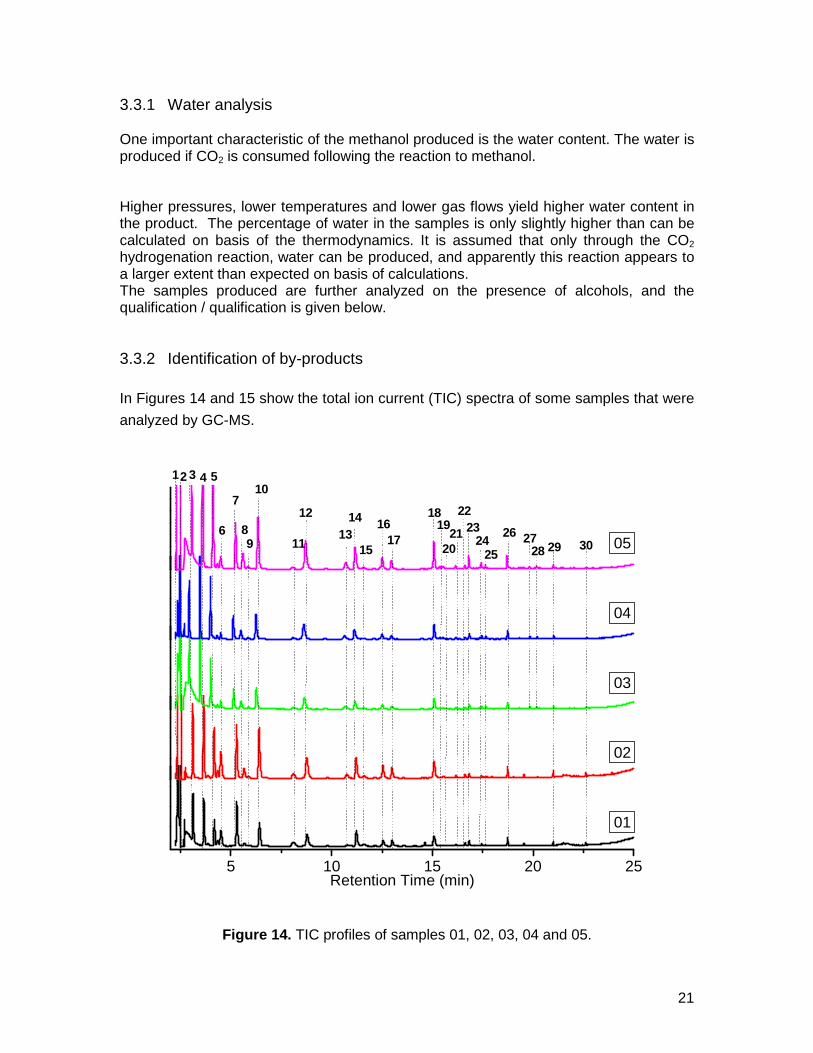
In Figures 14 and 15 show the total ion current (TIC) spectra of some samples that were
analyzed by GC-MS.
5 10 15 20 25Retention Time (min)
01
02
03
04
3020
19
2825
2
272321
159 2926
24
22181614
13
12
118
31
6
107
54
0517
Figure 14. TIC profiles of samples 01, 02, 03, 04 and 05.
22
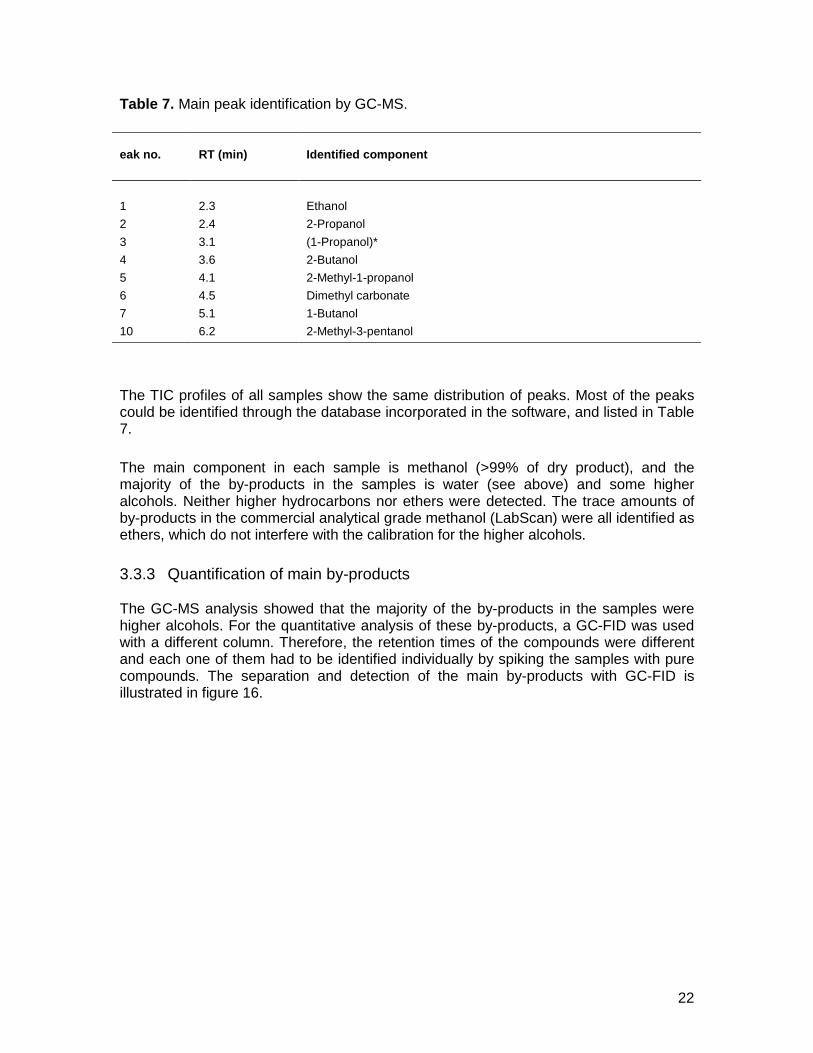
Table 7. Main peak identification by GC-MS.
The TIC profiles of all samples show the same distribution of peaks. Most of the peaks could be identified through the database incorporated in the software, and listed in Table 7.
The main component in each sample is methanol (>99% of dry product), and the majority of the by-products in the samples is water (see above) and some higher alcohols. Neither higher hydrocarbons nor ethers were detected. The trace amounts of by-products in the commercial analytical grade methanol (LabScan) were all identified as ethers, which do not interfere with the calibration for the higher alcohols.
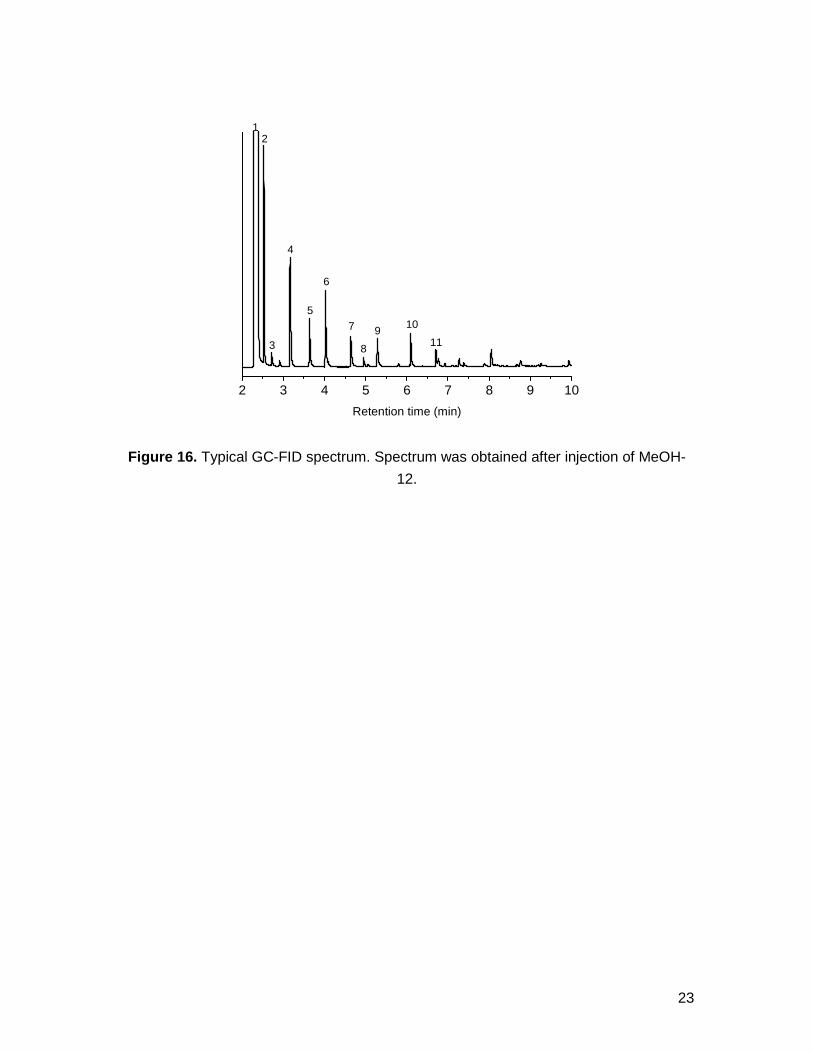
3.3.3 Quantification of main by-products The GC-MS analysis showed that the majority of the by-products in the samples were higher alcohols. For the quantitative analysis of these by-products, a GC-FID was used with a different column. Therefore, the retention times of the compounds were different and each one of them had to be identified individually by spiking the samples with pure compounds. The separation and detection of the main by-products with GC-FID is illustrated in figure 16.
eak no. RT (min) Identified component
1
2.3
Ethanol
2 2.4 2-Propanol
3 3.1 (1-Propanol)*
4 3.6 2-Butanol
5 4.1 2-Methyl-1-propanol
6 4.5 Dimethyl carbonate
7 5.1 1-Butanol
10 6.2 2-Methyl-3-pentanol
23
2 3 4 5 6 7 8 9 10
119
10
8
7
4
6
2
5
3
Retention time (min)
1
Figure 16. Typical GC-FID spectrum. Spectrum was obtained after injection of MeOH-
12.
24
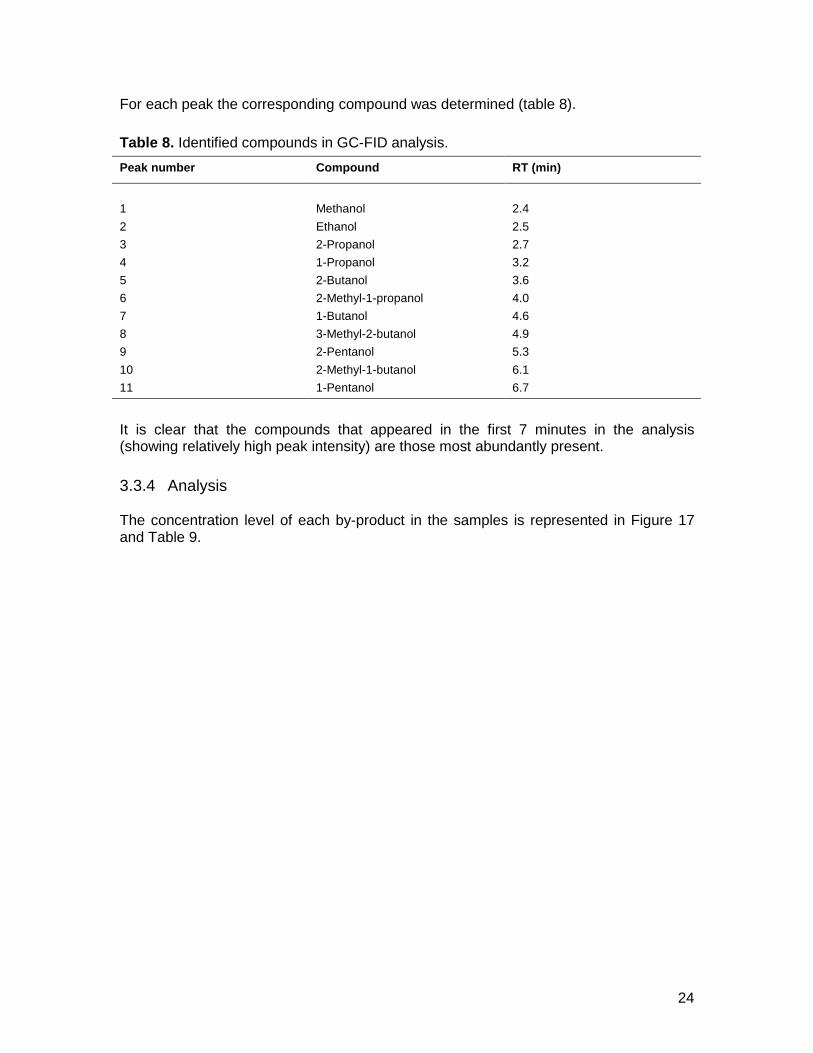
For each peak the corresponding compound was determined (table 8).
Table 8. Identified compounds in GC-FID analysis.
Peak number Compound RT (min)
1
Methanol
2.4
2 Ethanol 2.5
3 2-Propanol 2.7
4 1-Propanol 3.2
5 2-Butanol 3.6
6 2-Methyl-1-propanol 4.0
7 1-Butanol 4.6
8 3-Methyl-2-butanol 4.9
9 2-Pentanol 5.3
10 2-Methyl-1-butanol 6.1
11 1-Pentanol 6.7
It is clear that the compounds that appeared in the first 7 minutes in the analysis (showing relatively high peak intensity) are those most abundantly present.
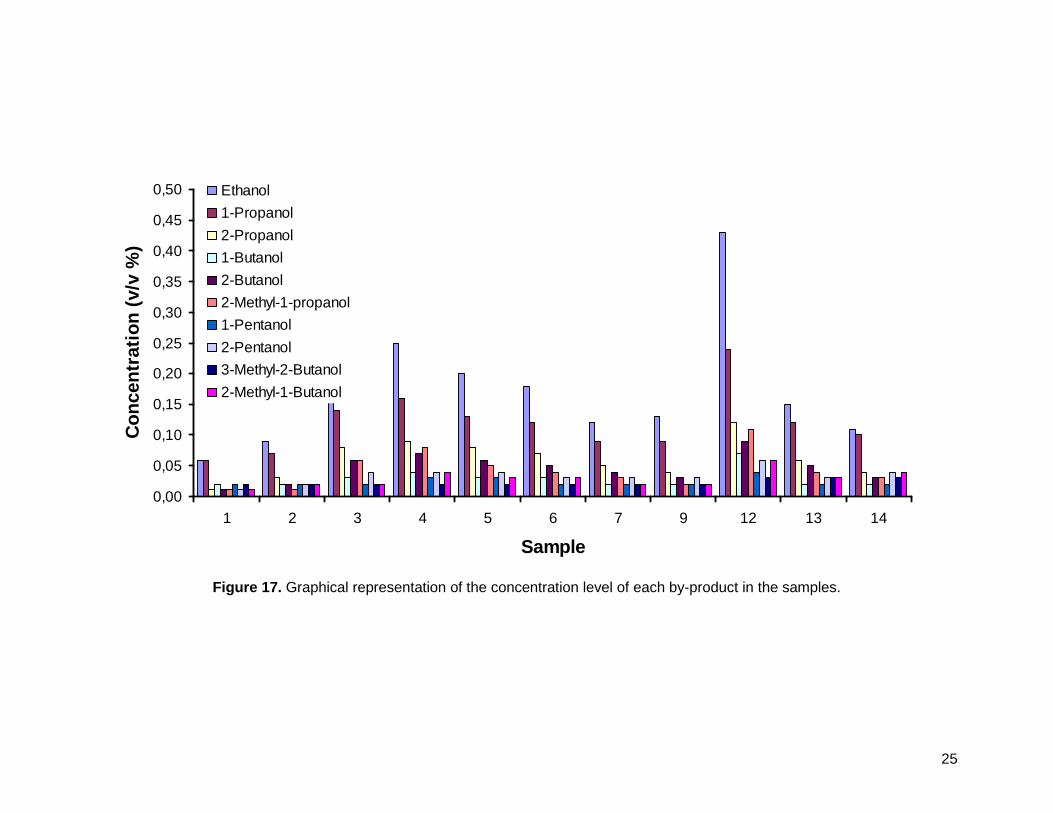
3.3.4 Analysis The concentration level of each by-product in the samples is represented in Figure 17 and Table 9.
25
0,00
0,05
0,10
0,15
0,20
0,25
0,30
0,35
0,40
0,45
0,50
1 2 3 4 5 6 7 9 12 13 14
Sample
Co
nce
ntr
atio
n (
v/v
%)
Ethanol
1-Propanol
2-Propanol
1-Butanol
2-Butanol
2-Methyl-1-propanol
1-Pentanol
2-Pentanol
3-Methyl-2-Butanol
2-Methyl-1-Butanol
Figure 17. Graphical representation of the concentration level of each by-product in the samples.
26
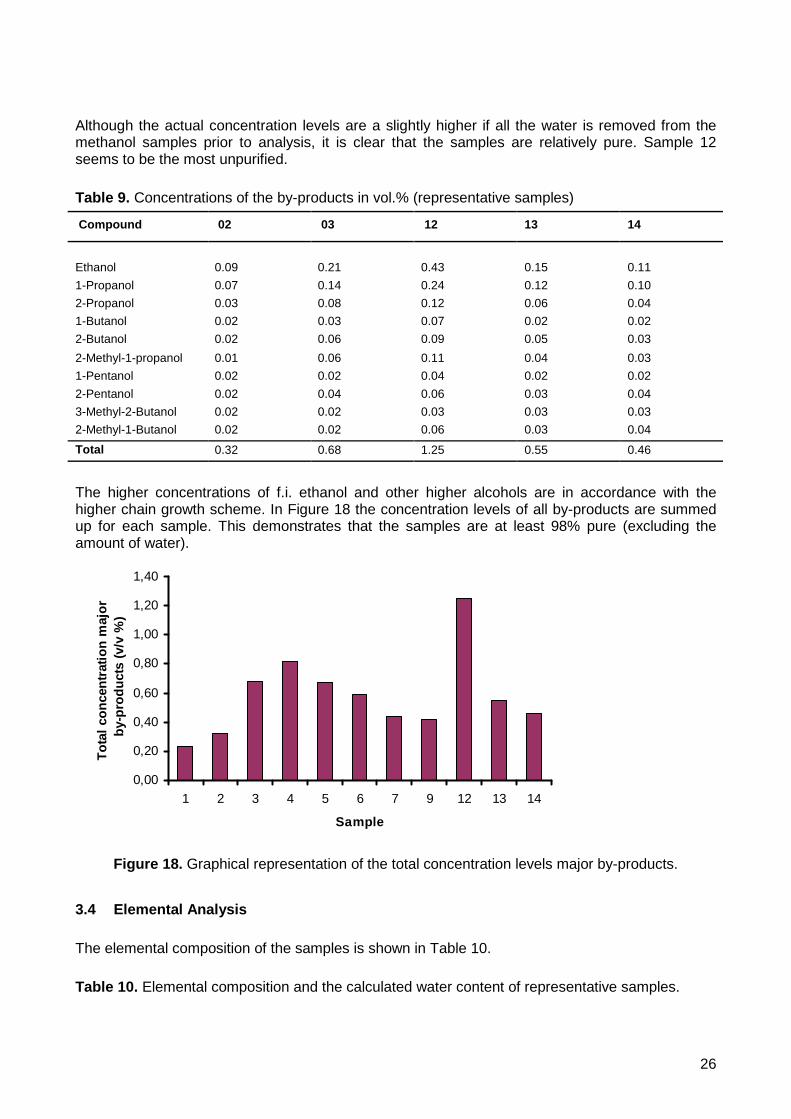
Although the actual concentration levels are a slightly higher if all the water is removed from the methanol samples prior to analysis, it is clear that the samples are relatively pure. Sample 12 seems to be the most unpurified.
Table 9. Concentrations of the by-products in vol.% (representative samples)
Compound 02 03 12 13 14
Ethanol
0.09
0.21
0.43
0.15
0.11
1-Propanol 0.07 0.14 0.24 0.12 0.10
2-Propanol 0.03 0.08 0.12 0.06 0.04
1-Butanol 0.02 0.03 0.07 0.02 0.02
2-Butanol 0.02 0.06 0.09 0.05 0.03
2-Methyl-1-propanol 0.01 0.06 0.11 0.04 0.03
1-Pentanol 0.02 0.02 0.04 0.02 0.02
2-Pentanol 0.02 0.04 0.06 0.03 0.04
3-Methyl-2-Butanol 0.02 0.02 0.03 0.03 0.03
2-Methyl-1-Butanol 0.02 0.02 0.06 0.03 0.04
Total 0.32 0.68 1.25 0.55 0.46
The higher concentrations of f.i. ethanol and other higher alcohols are in accordance with the higher chain growth scheme. In Figure 18 the concentration levels of all by-products are summed up for each sample. This demonstrates that the samples are at least 98% pure (excluding the amount of water).
0,00
0,20
0,40
0,60
0,80
1,00
1,20
1,40
1 2 3 4 5 6 7 9 12 13 14
Sample
To
tal
con
cen
trat
ion
maj
or
by-
pro
du
cts
(v/v
%)
Figure 18. Graphical representation of the total concentration levels major by-products.
3.4 Elemental Analysis
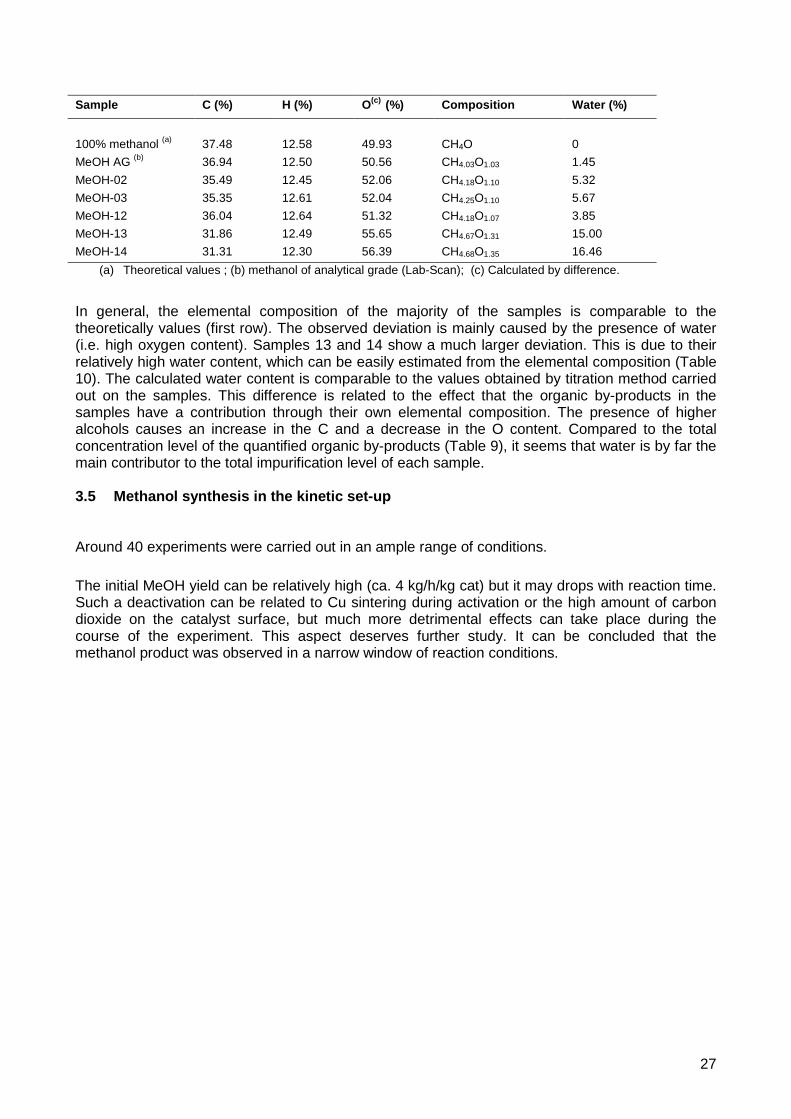
The elemental composition of the samples is shown in Table 10.
Table 10. Elemental composition and the calculated water content of representative samples.
27
Sample C (%) H (%) O(c) (%) Composition Water (%)
100% methanol (a) 37.48 12.58 49.93
CH4O 0
MeOH AG (b) 36.94 12.50 50.56 CH4.03O1.03 1.45
MeOH-02 35.49 12.45 52.06 CH4.18O1.10 5.32
MeOH-03 35.35 12.61 52.04 CH4.25O1.10 5.67
MeOH-12 36.04 12.64 51.32 CH4.18O1.07 3.85
MeOH-13 31.86 12.49 55.65 CH4.67O1.31 15.00
MeOH-14 31.31 12.30 56.39 CH4.68O1.35 16.46
(a) Theoretical values ; (b) methanol of analytical grade (Lab-Scan); (c) Calculated by difference.
In general, the elemental composition of the majority of the samples is comparable to the theoretically values (first row). The observed deviation is mainly caused by the presence of water (i.e. high oxygen content). Samples 13 and 14 show a much larger deviation. This is due to their relatively high water content, which can be easily estimated from the elemental composition (Table 10). The calculated water content is comparable to the values obtained by titration method carried out on the samples. This difference is related to the effect that the organic by-products in the samples have a contribution through their own elemental composition. The presence of higher alcohols causes an increase in the C and a decrease in the O content. Compared to the total concentration level of the quantified organic by-products (Table 9), it seems that water is by far the main contributor to the total impurification level of each sample. 3.5 Methanol synthesis in the kinetic set-up Around 40 experiments were carried out in an ample range of conditions.
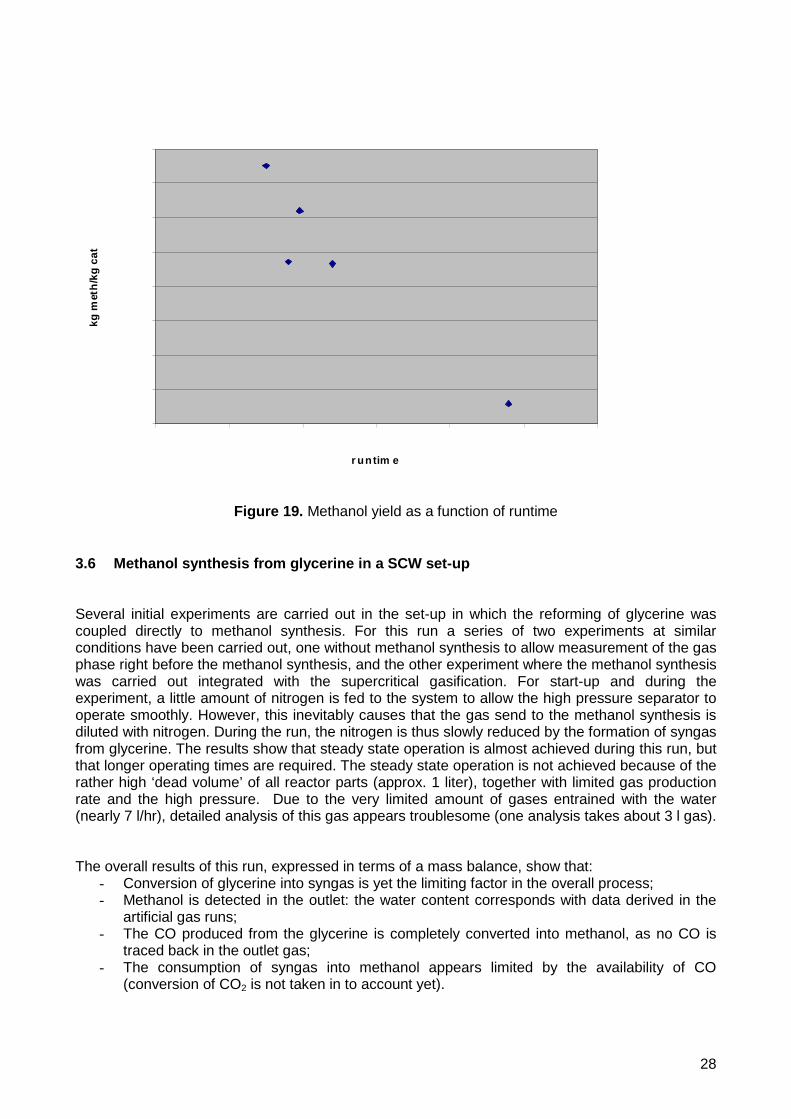
The initial MeOH yield can be relatively high (ca. 4 kg/h/kg cat) but it may drops with reaction time. Such a deactivation can be related to Cu sintering during activation or the high amount of carbon dioxide on the catalyst surface, but much more detrimental effects can take place during the course of the experiment. This aspect deserves further study. It can be concluded that the methanol product was observed in a narrow window of reaction conditions.
28
Figure 19. Methanol yield as a function of runtime 3.6 Methanol synthesis from glycerine in a SCW set-up Several initial experiments are carried out in the set-up in which the reforming of glycerine was coupled directly to methanol synthesis. For this run a series of two experiments at similar conditions have been carried out, one without methanol synthesis to allow measurement of the gas phase right before the methanol synthesis, and the other experiment where the methanol synthesis was carried out integrated with the supercritical gasification. For start-up and during the experiment, a little amount of nitrogen is fed to the system to allow the high pressure separator to operate smoothly. However, this inevitably causes that the gas send to the methanol synthesis is diluted with nitrogen. During the run, the nitrogen is thus slowly reduced by the formation of syngas from glycerine. The results show that steady state operation is almost achieved during this run, but that longer operating times are required. The steady state operation is not achieved because of the rather high ‘dead volume’ of all reactor parts (approx. 1 liter), together with limited gas production rate and the high pressure. Due to the very limited amount of gases entrained with the water (nearly 7 l/hr), detailed analysis of this gas appears troublesome (one analysis takes about 3 l gas). The overall results of this run, expressed in terms of a mass balance, show that:
- Conversion of glycerine into syngas is yet the limiting factor in the overall process; - Methanol is detected in the outlet: the water content corresponds with data derived in the
artificial gas runs; - The CO produced from the glycerine is completely converted into methanol, as no CO is
traced back in the outlet gas; - The consumption of syngas into methanol appears limited by the availability of CO
(conversion of CO2 is not taken in to account yet).
0,0000
0,5000
1,0000
1,5000
2,0000
2,5000
3,0000
3,5000
4,0000
0 200 400 600 800 1000 1200
r untim e
kg m
eth
/kg
cat
29
- Although the nitrogen significantly reduces the actual partial pressures, the conversion to methanol is promising.
- Glycerine is converted into methanol. The experiments undertaken thus show that a) It is possible to produce methanol from glycerine in the way proposed here; b) The catalyst applied is reactive; c) Actual mass and heat balances (although preliminary) can be established on basis of gas
flows and gas compositions d) Design constraints (small scale) have been summarized, and modifications for more reliable
operation proposed. Although the principle has been proven that glycerine can be converted in a single step into methanol. The following recommendation can be presented here: a) Catalyst deactivation (mechanisms and contaminants) has not been determined, and requires
substantial longer operating times; b) Catalyst optimization; c) Some minor modifications are required for a reliable operation of the set-up: e.g. modifications
aimed at are the HP gas-liquid separator, re-arranging the methanol reactor to allow the methanol product to avoid premature condensation in the piping and, modification on the depositing of salts in the supercritical gasification section, improved analysis of gas phase, and so on;
d) Measurement of kinetic data; e) Use of raw RME-glycerine; f) Measurement of various vapour-liquid equilibria in the supercritical gasification, e.g. for the
CH4 and CO2 recovery. The experimental work is ongoing, partly in a new European program SuperMethanol, see section 5 below.
30
4 Preparation of a LT-EOS proposal One of the main objectives of the present research proposal beginning 2007 was to proof the principle, and if successful, to carry out an assessment to bring the concept further in a larger consortium, e.g. in a LT-EOS program. Already halfway 2007, however, the opportunity was given to submit a proposal in a European context, in the area of ‘New Uses of Glycerine’. BTG, together with RuG, decided to submit a proposal in this context (a.o. based upon the work described here), and was granted finance end 2007 in a project referred to as SUPERMETHANOL (for further information such as project objectives and summary, see also http://supermethanol.eu/). The kick-off for this project was held beginning 2008. There are three Dutch partners in this consortium, viz. BTG, RuG and Sparqle International. The research started in NEO in 2006 with an economic assessment, and the experimental validation written down in this report, has thus resulted in a large European based project.
31
5 Conclusions and recommendations Earlier techno-economic work carried out within NEO already showed that, from a theoretical background, glycerine can be converted into a syngas, and that this gas can be synthesised into methanol. The work described here is based upon a project proposal to answer the questions relevant for the GtM concept. Experiments using artificial gas, but also real gas derived from glycerine, show that methanol is actually produced. The conversion rates are higher than expected on basis of ‘1980’-kinetics if modern up-to-date catalysts are applied. Longer-term testing is now necessary to determine the deactivation rate and contaminants relevant. So far the role of contaminants is unclear: in the runs carried out at BTG in packed bed runs during several weeks and using different types of syngas composition, no severe deactivation have been observed. All data could, to a certain extent, be correlated and explained by theoretical models. In runs carried by RuG in a smaller autoclave (using artificial gas), a change in catalyst activity could be observed. The exact reasons are unknown, but it may be that, where in the runs at BTG approx.70 grams catalyst was used, the RuG experiments were undertaken using only 2.5 grams of catalyst, by which a more rapid deactivation is noticed. It is unlikely, though, that the deactivation is caused by the change in gas composition. Commercial available catalysts have been applied successfully: so far, there is no reason to change the catalyst. It is important to establish the influence of contaminants first. Analysis of the samples produced showed that it contains mainly methanol and water, in ratios predictable from theoretical analysis. Only very limited higher alcohols are traced back (< 1 vol.%).