CZECH TECHNICAL UNIVERSITY IN PRAGUE Faculty of Electrical Engineering Prague, 2018 Business Plan eForce FEE Prague Formula 2018 Bachelor Thesis Marek Szeles Field of study: Software Engineering and Technology Thesis advisor: Ing. Tomáš Podivínský
Transcript
CZECH TECHNICAL UNIVERSITY IN PRAGUE
Faculty of Electrical Engineering
Prague, 2018
Business Plan eForce FEE Prague
Formula 2018
Bachelor Thesis
Marek Szeles
Field of study: Software Engineering and Technology
Thesis advisor: Ing. Tomáš Podivínský
ZADÁNÍ BAKALÁŘSKÉ PRÁCE
I. OSOBNÍ A STUDIJNÍ ÚDAJE
456868Osobní číslo:MarekJméno:SzelesPříjmení:
Fakulta elektrotechnickáFakulta/ústav:
Zadávající katedra/ústav: Katedra počítačů
Softwarové inženýrství a technologieStudijní program:
II. ÚDAJE K BAKALÁŘSKÉ PRÁCI
Název bakalářské práce:
Byznys plán eForce FEE Prague Formula 2018
Název bakalářské práce anglicky:
Business Plan eForce FEE Prague Formula 2018
Pokyny pro vypracování:- Introduction to Formula Student, its disciplines and the eForce team- Analysis of historical results and the current state of the project at CTU- Prerequisites of business plan creation- Methodology of applied analyses and calculations- Graphic support materials preparation- Implementation of support systems for business plan creation- Business Plan eForce Prague Formula 2018- Preparation of relevant information and analyses (technological, financial, business)- Creation of presentation materials- Business Plan presentation and its evaluation by an independent expert jury
Seznam doporučené literatury:[1] SRPOVÁ, J. et al. Podnikatelský plán a strategie. 1. vydání. Praha: Grada Publishing, a. s., 2011. 194 s. ISBN978-80-247-4103-1.[2] Formula SAE Rulebook, SAE International, Warrendale, Pennsylvania, USA, 2007, available at http://www.sae.org.[3] Záruba T. Business plán technologického projektu formule student na ČVUT[4] BERRY, T. Hurdle, the book on business planning: how to develop and implement a successful business plan. Eugene,OR: Palo Alto Software, 1998. ISBN 0966489101.[5] Chohan, Usman W. ?Initial Coin Offerings (ICOs)?: Risks, Regulation, and Accountability (November 30, 2017).Discussion Paper Series: Notes on the 21st Century.
Jméno a pracoviště vedoucí(ho) bakalářské práce:
Ing. Tomáš Podivínský, katedra ekonomiky, manažerství a humanitních věd FEL
Jméno a pracoviště druhé(ho) vedoucí(ho) nebo konzultanta(ky) bakalářské práce:
Termín odevzdání bakalářské práce: 25.05.2018Datum zadání bakalářské práce: 19.02.2018
Platnost zadání bakalářské práce: 30.09.2019
_________________________________________________________________________________prof. Ing. Pavel Ripka, CSc.
podpis děkana(ky)podpis vedoucí(ho) ústavu/katedryIng. Tomáš Podivínský
III. PŘEVZETÍ ZADÁNÍStudent bere na vědomí, že je povinen vypracovat bakalářskou práci samostatně, bez cizí pomoci, s výjimkou poskytnutých konzultací.Seznam použité literatury, jiných pramenů a jmen konzultantů je třeba uvést v bakalářské práci.
Business Plan eForce FEE Prague Formula Marek Szeles, CTU in Prague
Page 1 of 86
Acknowledgement
I am grateful to my thesis supervisor Ing. Tomáš Podivínský for allowing me to work on my preferred topic and for the time he has dedicated to my work in the past year. I greatly appreciate his expertise and valuable advice, which has without a doubt improved this thesis. I am also thankful to the whole eForce FEE Prague Formula team for cooperating with me and helping me complete and research a lot of Formula Student related information, as well as technical consultations. Finally, I would like to thank my family and my girlfriend Aneta for supporting and encouraging me throughout my studies, I could not have achieved what I did without them.
Declaration
I hereby declare that I have written the submitted thesis myself and I quoted all used sources of information in accord with Methodical instructions about ethical principles for writing academic theses.
In Prague on May 24, 2018
……………………………………………….
Marek Szeles
Business Plan eForce FEE Prague Formula Marek Szeles, CTU in Prague
Page 2 of 86
Abstract
A student team, eForce FEE Prague Formula, active at the Faculty of Electrical Engineering CTU, annually participates in the Formula Student engineering competition. This thesis is focused on creating competitive materials for eForce in the 2018 competition season for one of the competition disciplines in particular – the Business Plan.
Apart from the economical aspect of the business plan, this thesis takes a software engineering approach to the whole process by making the business concept based on technology innovation and by supplementing the business plan itself by various digital supporting materials, including an Augmented Reality mobile application. Both the software and the business plan itself are tested on their quality as part of the thesis.
Keywords
Business Plan, Formula Student, Software Engineering, Mobile application, Android, Kotlin, Augmented Reality
Abstrakt
Studentský tým eForce FEE Prague Formula, působící na Fakultě elektrotechnické ČVUT, se každoročně účastní inženýrské soutěže Formula Student. Tato práce se zabývá přípravou materiálů pro tým eForce na soutěžní sezonu 2018, a to zejména v disciplíně „Business Plan“.
Kromě ekonomického aspektu tvořeného byznys plánu zaujímá tato práce sofwarově inženýrský přístup k celému procesu tvorby materiálů zvolením byznysového konceptu, který se zaměřuje na technologické inovace a také vytvořením několika podpůrných digitálních materiálů, včetně mobilní aplikaci využívající technologie rozšířené reality. Jak softwarová řešení, tak byznys plán samotný jsou v práci také otestovány.
2. Formula Student .......................................................................................................................................... 6
2.1. History of the competition ............................................................................................................. 6
3. The eForce FEE Prague Formula Team ............................................................................................ 13 3.1. Team history...................................................................................................................................... 13
3.3. Past results ......................................................................................................................................... 15
4. Analysis of eForce results within the Business Plan category ............................................... 16
4.1. Past eForce Business Plan comparison .................................................................................. 17 4.1.1. Presentation ............................................................................................................................. 17
5.3.2. Organization of potential source materials................................................................. 24
6. Business Plan eForce 2018 ................................................................................................................... 25
6.1. Graphic template for presentation and documents .......................................................... 25
6.2. Assumptions considered in the Business Plan .................................................................... 26
6.2.1. Formula manufacturing cost ............................................................................................. 26
6.2.2. Manufacturing and selling capacity................................................................................ 28
6.3. Business Plan concept ................................................................................................................... 28 6.3.1. Business innovation and logic .......................................................................................... 29
6.3.3. Formula racing innovation ................................................................................................ 33
6.4. Outputs for the competition preceding the Business Plan ............................................. 36
6.4.1. Business Logic Case for Formula Student UK ............................................................ 36 6.4.2. Business Plan Executive Summary for FS East .......................................................... 36
6.4.3. Business Plan Executive Summary for FS Netherlands ......................................... 36
6.4.4. Business Plan Executive Summary for FS Czech ....................................................... 36
Business Plan eForce FEE Prague Formula Marek Szeles, CTU in Prague
Page 4 of 86
6.5. Business Plan creation .................................................................................................................. 37
6.5.1. Business logic .......................................................................................................................... 37
Appendix [A] – eForce PowerPoint presentation template 2018 v2.0 .................................... 76 Appendix [B] – Business Logic Case for Formula Student United Kingdom ......................... 76
Appendix [C] – Business Plan Executive Summary for FS East .................................................. 76
Appendix [D] – Business Plan Executive Summary for FS Netherlands ................................. 76
Appendix [E] – Business Plan Executive Summary for FS Czech ............................................... 76
Appendix [H] – Formula models comparison .................................................................................... 79
Appendix [I] – Source code of the applications ................................................................................. 80 Base application (eForce App)............................................................................................................. 80
Appendix [J] – The eForce Business Plan core presentation ....................................................... 80
11. Literature and other sources used ................................................................................................ 81
Business Plan eForce FEE Prague Formula Marek Szeles, CTU in Prague
Page 5 of 86
1. Introduction
Since 2010, the Faculty of Electrical Engineering of the Czech Technical University has been home to eForce FEE Prague Formula – a student electrical formula team that builds a new formula each year to participate in the Formula Student competition. The competition and its disciplines are described in chapter 2 and the eForce team is discussed in chapter 3.
One of the disciplines of the Formula Student competition is called the “Business Plan”. This thesis is primarily focused on preparing the materials which can be used by the eForce team to successfully participate in the 2018 season of the competition, especially in the Business Plan discipline.
In order to be able to prepare a high quality output, the first goal of the thesis is to assess the analytical background to create a Business Plan, both by analysis of past eForce results, as discussed in chapter 4 and by covering the theoretical background on creating a good business plan, as covered in chapter 5.
The main goal of this thesis, the creation of a rigid business plan, is covered in chapter 6. This chapter has many subdivisions due to the complexity of the topic. At first in subchapter 6.1, templates to be used by the eForce team are prepared for the following work. Then, factors taken into account while creating the Business Plan are discussed in subchapter 6.2. In subchapter 6.3, the concept behind the Business Plan is outlined, pointing out the various areas of innovation. Based on this, preliminary outputs are discussed in chapter 6.4. Subchapter 6.5 is concerned with the creation of the Business Plan material proper – starting at business logic and finishing by a financial projection and investment proposition. Subchapter 6.6 complements the Business Plan by presenting supporting materials. These range from physical ones, like custom folders and business cards, to digital ones, most notably a functioning Android application featuring augmented reality functions. This application is modelled, described and tested.
The last major text division, chapter 7, is concerned with converting the abovementioned materials into a unified document – presentation – that can be used by eForce at the competition. The presentation is also tested on its quality in front of experts.
The thesis is finished with a summary in chapter 8, including a brief analysis of possible next steps for the work on the outputted materials.
To successfully reach said goals, this thesis utilizes knowledge and information from all four focus minors of the Software Engineering and Technology study program major. Some knowledge of the Networking expertise minor is applied in the theoretical part of the thesis while preparing the cloud solution. The main topic of the Business Plan covers the Information Systems and Entrepreneurship minor, while the graphical template and logos created to supplement it are related to the Multimedia Technologies minor. Last but not least, the supporting mobile application development uses many takeaways from the Programming and Application Architecture minor. This thesis combines relevant information from all these sources into one unitary academic work intended to benefit one of the Faculty of Electrical Engineering’s most successful student projects.
Business Plan eForce FEE Prague Formula Marek Szeles, CTU in Prague
Page 6 of 86
2. Formula Student
Formula Student (FS), sometimes known as Formula Society of Automotive Engineers (FSAE) in North America, is an international student engineering competition. Student teams from universities from all over the world take part in individual events all over the world, designing, producing and racing a prototype for a single-seat race car for autocross or sprint dynamic disciplines, and presenting it to a hypothetical board of investors and judges.[1]
2.1. History of the competition
The competition dates back to the year 1981[2], when it was founded by the Society of Automotive Engineers (SAE) in the United States. The first event took place in the United Kingdom in 1998 and was attended by just seven teams from the United Kingdom and the United States.
Since then, the competition has become an annual event and with its move to the Silverstone Grand Prix circuit in 2007, a new, modern era for Formula Student began. Gradually, the rules became formalized, so that the concept could spread across not just all of Europe, but also North America, Asia and Oceania.
Apart from the original combustion category, events for electric-powered formulas were introduced in 2010 and 2017 saw a debut of driverless electric cars.
2.2. Rules
Each Formula Student competition has a very extensive and specific set of rules that are accessible to the teams at the start of the season, usually to be downloaded from the event website. Although the general rules are usually the same for all events (so that student teams may attend multiple events with one car), each event also has certain specifics. The general rules for the Formula Student season 2018 can be found on its official website3.
Business Plan eForce FEE Prague Formula Marek Szeles, CTU in Prague
Page 7 of 86
2.3. Event and team ranking
The Formula Student events are generally split into two types: Unofficial Events and Official Events. Official Events are included in the Formula Student World Ranking List, whereas the unofficial events are not. The World Ranking List compares the teams from all over the world to form a single scoreboard where the Formula Student teams are ranked according to past performance. The methodology of this process is described in chapter 2.3.2. The Official events are ranked on their competitiveness, as described in the following subchapter.
2.3.1. Official race competitiveness factor
The event (race) competitiveness is calculated by weighing in the TOP10 participating student teams compared to the world TOP10 teams overall. The competitiveness factor has a value between 0.85 (worst) and 1.0 (best – all world TOP10 teams are present).
The exact calculation has the following steps:
At the beginning of each event, the overall points of the world’s TOP 10 competing teams are being compared to the overall world ranking list points of the 10 best starters at the event
if the ratio is 1, the points achieved at the event are weighed with 1
if the ratio is 0.6 or less, the points achieved at the event are weighed with 0.85
if the ratio is between 1 and 0.6, the event is weighed linearly between 1 and 0.85
The event competitiveness calculated for Formula Student Germany 2017 is like so:
Business Plan eForce FEE Prague Formula Marek Szeles, CTU in Prague
Page 8 of 86
2.3.2. Team World Ranking Points
Once a Formula Racing Team participates in a World Ranking Event for the first time, it is assigned so-called World Ranking Points (WRP), which are then used to compare different teams all around the world. The resulting list of teams is called the World Ranking List (WRL).
The world ranking points are calculated according to this formula as of late 2017[4]:
𝑊𝑅𝑃 = ∑ 𝑠𝑛 × 𝑎𝑛 × 𝑃𝑛 × 𝐶𝑛
6
𝑛=1
Where:
WRP = World Ranking Points n = event index: 1 = latest event, 2 = second latest event, etc. sn = normalized season factor for event n an = normalized actuality factor for event n Pn = overall Points from event n Cn = competitiveness of event n
As an example calculation, one can calculate the World Ranking Points for eForce as of January 6th 2018. In order to do that, one has to first assemble information about the past six ranked events of the team:
Event Date Season S A S × A S × A
normalized P C (S×A norm.)
×P×C
CZ[7] 2017-08-05
1 6 1 6 0.4465 828.73 0.857 317.0999
EA[8] 2017-07-23
1 6 0.6 3.6 0.2679 527.80 0.9854 139.3188
CZ[7] 2016-08-07
2 5 0.36 1.8 0.1339 366.00 0.85 41.6682
IT[9] 2015-09-14
2 5 0.216 1.08 0.0804 343.84 0.853 23.5706
CZ[7] 2015-09-06
2 5 0.1296 0.648 0.0482 839.11 0.85 34.391
HU[10] 2015-08-23
3 4 0.07776 0.311 0.0231 352.50 0.9008 7.349
Table 1: Past six events of eForce as of January 6th 2018
Then, the World Ranking Points are the simple sum of the last column:
Business Plan eForce FEE Prague Formula Marek Szeles, CTU in Prague
Page 9 of 86
2.4. Racing season overview
Every year, the Formula Student Racing Season has a typical phased schedule, which differs slightly for every team. Overall, the timeline is mainly defined by the event dates – in Europe, most events are during the summer holidays, between July and September. During the rest of the year, it is up to the teams to divide up the time to design and manufacture their vehicle.
In figure 1, a more detailed, yet conceptually high-level diagram shows the season stages as used by eForce, with the roman numerals on top indicating months.
Figure 1: A typical season stages diagram for eForce
Once the team is ready to partake in a competition, it can apply to virtually any race online. For the official races, there are two main requirements in order to sign up – completing an onboarding test and paying the race fee.
The onboarding test is essentially an online questionnaire every team wanting to participate has to fill out. It consists of questions based off of the official event rules and tests the team’s knowledge of them. Generally, the whole team can cooperate to submit the questionnaire, but it is only accepted if there are no mistakes at all. Luckily, there are multiple re-submissions possible. Once the team manages to get all the answers right, their completion time is noted and all teams are then ranked based on their completion time, from fastest to slowest. Teams that failed to complete the questionnaire in a given time limit are not eligible to participate. Usually there are more teams interested in an event than there is capacity for and so many teams are put on a waiting list beyond the accepted teams, since they finished the questionnaire correctly, but not fast enough.
After the team is accepted as a participant, it needs to pay the event fee, which is generally in the lower thousands of Euros. Failure to do so would result in disqualification. The teams have to finance their participation by themselves using funds from their university and sponsors – usually the only way to not have to pay the race fee is to win the competition, as a refund of the fee is usually the main prize.
Design Manufacture Competition
VIII IX X XI XII I II III IV V VI VII VIII IX
Cost report
Business plan
Finance management, funding search
PR, media
machining
compositing
assembly
welding
calculations
simulationsconstruction
testing
static
events
dynamic
events
Business Plan eForce FEE Prague Formula Marek Szeles, CTU in Prague
Page 10 of 86
2.5. Race structure, individual disciplines
All Formula Student races have a set event structure and are divided into disciplines totaling 1000 points. The team that manages to earn the most points during the whole event is declared winner – though the results are separate for electric, combustion, and recently driverless cars in some races. The point distribution between individual disciplines can be seen on figure 2.
Figure 2: Points distribution between the individual disciplines
2.5.1. Scrutineering
Before a team is allowed to participate in the race itself, their vehicle has to pass through a set of safety checks commonly called scrutineering. The aim of these checks is not only to ensure the safety of the cars, but also to verify their compliance with the extensive set of rules. Should a vehicle fail to comply with some rule, the team is usually given a couple of hours to fix the issue if possible, and if they are successful, they can apply for a new check (a so-called re-scrut).
Scrutineering is slightly different for the electric and combustion categories. Most checks are the same for both categories, while some checks only make sense for one of them. The simple overview of the usual scrutineering scheme is as follows:
For both categories (Combustion & Electric): Electrical scrutineering Mechanical scrutineering Tilt test Weight test Drivers escape test
Electric only: Rain test
Combustion only: Noise test
Acceleration
75
75
Autocross
325
Skid Pad
Endurance
100
Engineering Design
100
Fuel/Energy Efficiency
75Business Plan
100Cost Analysis
150
Scrutineering
Business Plan eForce FEE Prague Formula Marek Szeles, CTU in Prague
Page 11 of 86
2.5.2. Static disciplines The static disciplines are not tied to the performance of the vehicle on-track, and are thus the only disciplines that a team can attend without having successfully gone through all scrutineering. The three static disciplines are Engineering Design, Cost Report and Business Plan. The grand total of possible points received for static disciplines is 325 points.
Engineering Design Report, maximum score: 150 points
Engineering Design is the main static discipline, focused on the quality of engineering solutions made on the actual vehicle. In the months before the competition, teams prepare and submit an Engineering Design Report, an extensive document describing the development of the current year’s formula and the team’s approach to the whole process. During this discipline, the teams can also use eight pages/flipcharts to support the presentation of their vehicle – usually the whole team takes part, presenting the vehicle development both as a whole and in detail, from the individual aspects of the project – mechanical, electrical and management. Based on this presentation, the submitted report, as well as the personal inspection of the vehicle itself, the judges evaluate the progress the team has achieved compared to last season, as well as the viability of the vehicle as a general concept of a nonprofessional weekend autocross racer.
Cost Report, maximum score: 100 points
The Cost Report focuses on cost estimations, manufacturing techniques and processes used during a hypothetical series manufacture of the formula. The discipline consists of a written report (the Cost Report), which is essentially a large spreadsheet documenting all the formula parts and their costs, and a discussion with the judges around the manufactured prototype. There is usually also an additional assignment, the so called “Real Case”, released by the event organizers a couple of weeks prior to the event itself, assigning the teams to create a solution to a specific problem and elaborate on a cost-driven approach.
Business Plan, maximum score: 75 points
The discipline this work is mainly concerned with is the Business Plan. In it, the teams are asked to prepare a pitch presentation of a business concept involving the formula for investors to consider funding. This presentation should be presented orally, with any type of visual support allowed, but it cannot exceed 15 minutes of time, including time for questions. Apart from the general business plan, the individual events usually release a “Deep Dive Topic” a couple weeks prior to the event. It is expected of the participants to include this topic in the presentation and elaborate on it for about 3-5 minutes. The aim of this is to put pressure on the teams to show they can work on highly specific topics under time pressure given by the race deadline.
Long before the competition, the races also require the teams to submit a one-page summary of their intended business plans. Depending on the event, this is either a “Business Logic Case” (BLC), or a “Business Plan Executive Summary” (BPES). Usually, no points are awarded for these documents, but the team can receive a penalty if it does not submit the document in time, or if it fails to meet the requirements defined by the rules. In rare cases, the content of the document can be used as a tie-breaker if some teams are tied in admission for the last spot of a race. In this case, the team with a more innovative business summary document may be admitted to the race preferentially.
Business Plan eForce FEE Prague Formula Marek Szeles, CTU in Prague
Page 12 of 86
2.5.3. Dynamic disciplines
In the dynamic disciplines, the teams have to demonstrate the racing capabilities of their vehicle on a prepared racetrack. Each of the disciplines is designed to test a different aspect of the vehicle’s performance. With the exception of the final Endurance race, in every discipline two drivers have two runs each to try and complete the assignment at hand. Their best run will be counted as the optimum the car can achieve and awarded points according to the rules. The grand total of possible points received for dynamic disciplines is 675 points.
Acceleration, maximum score: 75 points
The first dynamic discipline is simply measuring the aerodynamics, weight and power combination of the car. The formula is tasked to cover 75 meters of track as fast as possible with a standing start.
Skid Pad, maximum score: 75 points
This discipline measures lateral acceleration. The cars are driving two consecutive laps on a track in the shape of a figure 8. The second lap is timed and awarded points.
Autocross, maximum score: 100 points
The cars are assigned to drive two laps on a track which is usually around 1 kilometer in length. The best time is then used for the leaderboard and scored. Additionally, the final result ranking determines the starting order of the final Endurance race, with the fastest teams in Autocross starting last.
Endurance, maximum score: 325 points
Endurance is the main discipline and it has the highest maximum achievable points of all disciplines. The formulas drive on a track similar to autocross, with a total distance of 22 kilometers, with a driver change in the middle. The goal is to show the durability of the vehicles under long-term conditions. Up to four cars can be on the track at the same time.
Fuel Efficiency, maximum score: 100 points
Fuel Efficiency is not a standalone discipline per se, but rather an extension of the Endurance race. After the race is finished, the fuel consumption is calculated by taking the total fuel used in relation to average speed. The consumption is calculated and points are awarded even to teams that did not manage to complete the whole race, as long as they completed the driver change.
Business Plan eForce FEE Prague Formula Marek Szeles, CTU in Prague
Page 13 of 86
3. The eForce FEE Prague Formula Team
In the Czech Republic, eForce FEE Prague Formula is the oldest and at present time still the only Formula Student Electric team. It is headquartered in a workshop provided by the Faculty of Electrical Engineering, Czech Technical University in Prague. The team consists entirely of students, mostly from the Electrical and Mechanical Engineering Faculties of CTU, however, students attending other faculties and universities are also represented and are able to join. Moreover, alumni of the team are involved in the team’s organization as experienced consultants.
3.1. Team history
The team was founded in 2010, back then as part of the older CTU CarTech Formula Team, which was only building combustion formulas up until then. It took two years, but in 2012 the team managed to complete its first functioning electric vehicle. Two years later, the team expanded and got its own premises. With that, the electric part of the team decided to separate from the original CarTech Team in order to increase the efficiency of the organization. Whereas the CarTech Team officially remained a team under the Faculty of Mechanical Engineering, Czech Technical University, the newly established eForce FEE Prague Formula Team moved to the Faculty of Electrical Engineering, where its new premises were located, and the team remains there to this day.
Since 2012, when the first eForce formula was built, the team has grown to a stable 60 or so members in total, with 30 core members that work on the formula continuously for more than one season. Every season, a new formula is built, with the general trend being that the weight of the vehicle is gradually decreased every season, and the maximum power increased. A summary of the development can be seen on figure 3.
Figure 3: Brief summary of eForce history
8
Eforce in numbers
2013
2014
2015
2016
FSE.01
330kg, 25kW
FSE.02
278kg, 62kW
FSE.03
260kg, 62kW
FSE.04x
200kg, 58kW
FSE.05x
195kg, 112kW
2012
2017
FSE.06
192kg, 112kW6
custom formulas designed
and manufactured in-house
40+ active team members
Founded in 2010
Only Czech team constructing a fully
electric-based formula
Business Plan eForce FEE Prague Formula Marek Szeles, CTU in Prague
Page 14 of 86
3.2. Organization
According to the rules, the entire team can only consist of students. The only notable exception is the faculty advisor, who is a member of University staff responsible for the communication between the team and the University. This is the only role of the faculty advisor, as they are not participating in the formula design or manufacture.
In the beginning of every academic year in October, new members are admitted to the team, but not all of them stay until the season finishes – mostly because they lack the time required to commit to such a project.
Team members in eForce are organized into four major work groups: Mechanical group, Electrical group, IT group, and Project group. Each group has its responsible group lead who is in turn directly under the overall Team captain. The simplified organization chart can be seen on figure 4.
Figure 4: High-level team organization chart
Team captain Faculty advisor
~20
members
~15
members
~10
members
~10
members
Mechanical
Group Lead
Electrotechnical
Group Lead
IT
Group Lead
Project
Group Lead
Business Plan eForce FEE Prague Formula Marek Szeles, CTU in Prague
Page 15 of 86
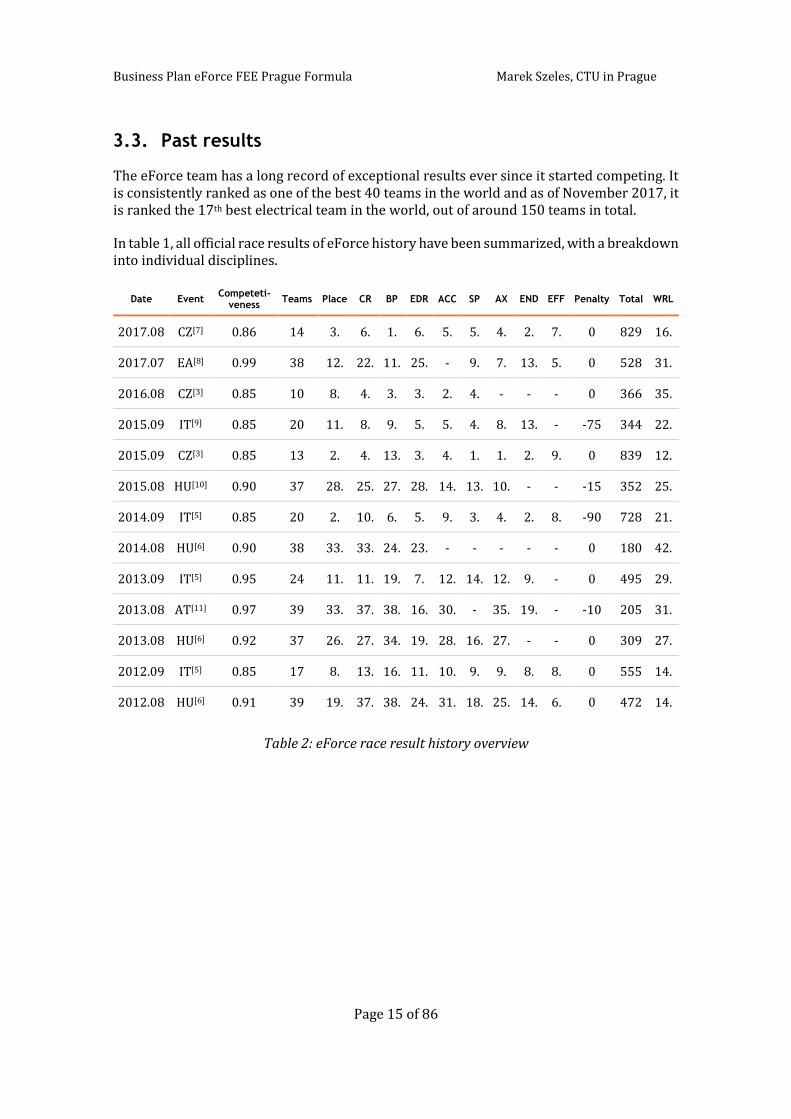
3.3. Past results
The eForce team has a long record of exceptional results ever since it started competing. It is consistently ranked as one of the best 40 teams in the world and as of November 2017, it is ranked the 17th best electrical team in the world, out of around 150 teams in total.
In table 1, all official race results of eForce history have been summarized, with a breakdown into individual disciplines.
Date Event Competeti-
veness Teams Place CR BP EDR ACC SP AX END EFF Penalty Total WRL
Business Plan eForce FEE Prague Formula Marek Szeles, CTU in Prague
Page 16 of 86
4. Analysis of eForce results within the Business Plan category
Historically, the Business Plan discipline was not a strong point for eForce. This was due to several factors, including different approaches to the discipline, lack of know-how and high fluctuation of presenters. However, a positive trend started in 2016, when the results started improving.
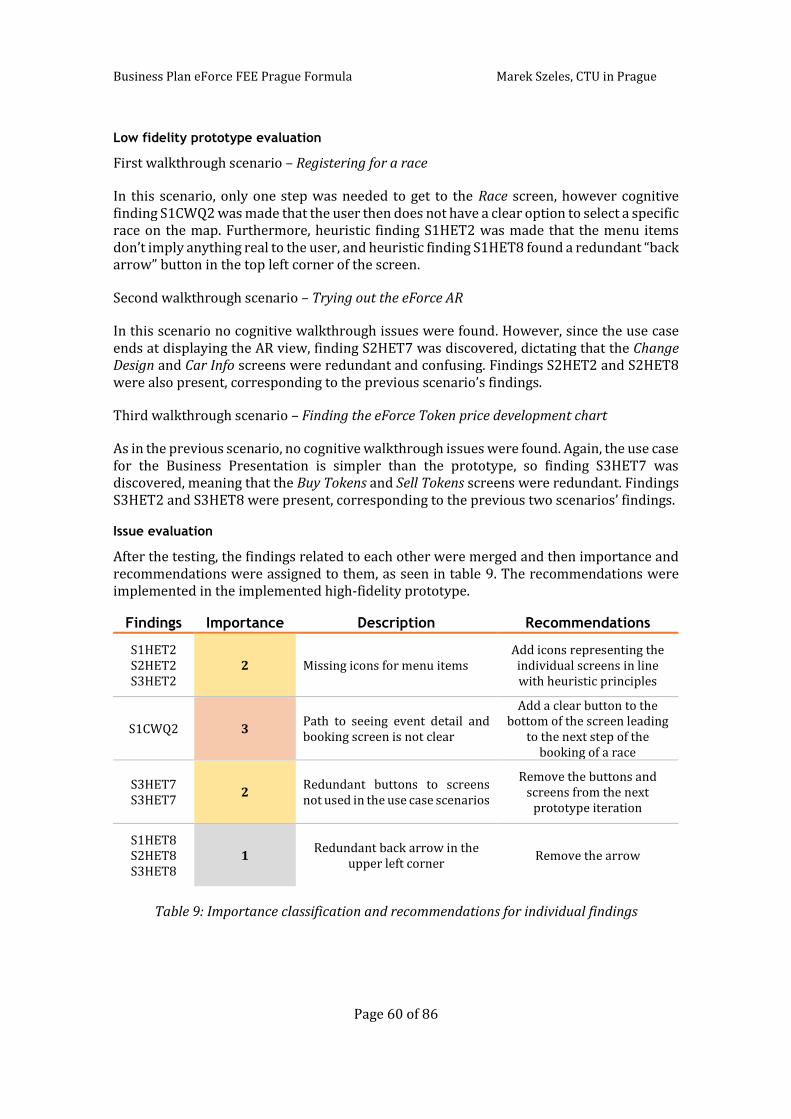
In table 3, the results of the Business Plan discipline are summarized from the past three seasons (2015-2017). The ranking has been color coded green (best result) to red (worst result), which highlights the overall improvement in performance over time.
Table 3: eForce Business Plan result overview for the past three seasons
Business Plan eForce FEE Prague Formula Marek Szeles, CTU in Prague
Page 17 of 86
4.1. Past eForce Business Plan comparison
For the sake of having a starting reference for creating the Business Plan for the 2018 season, the Business Plan presentations from the past three seasons were compared and analyzed.
4.1.1. Presentation
There are many differences to be found between the decks, both in form and in content. All presentations were done and presented in Microsoft PowerPoint, with the 2015 and 2017 having the aspect ratio of 16:9 and the 2016 deck being made in the size of A4 standard paper, see figure 5.
Figure 5: The presentation deck samples for the past three seasons
Prior to the 2015 season, the eForce Business Plan was mainly focused on calculations and a printed comprehensive document explaining the business concept[15]. This approach has since been abandoned, because it was deemed as inefficient in allocation of time and resources.
4.1.2. Additional content
Since there is no restriction on the supporting materials, any additional printed content can be used, ranging from things as small as business cards to as large as flipcharts or banners.
The eForce Team traditionally brings printouts of the presentation in bound A4 sheets, bundled in representative folders including a business card for each judge. In 2016, an additional handout leaflet covering the business plan outline was issued and handed out along with the other materials.
Business Plan eForce FEE Prague Formula Marek Szeles, CTU in Prague
Page 18 of 86
4.2. Comparison with TU Delft Formula Team
In order to improve the knowledge base regarding Business Plan creation and team management in general, eForce scheduled a meeting with TU Delft Formula Team representatives in November 2017. The meeting took place in Delft in the team’s workshop and offices.
The team from TU Delft has a long history of consistently excellent results, they won the overall Formula Student Champion title 2 times[16] and were notably the overall Business Plan winners of FS East 2017.
The discussion was concerned mainly with Business Plan and Static disciplines, but in the end team structure and knowledge management were also discussed.
The key takeaways from the discussion were summed up by Egor Popov, the Operations Manager[17] for the TU Delft Formula Student Team in the 2018 season and a co-creator of Delft’s Business Plan in 2017:
“Most of the success in the Business Plan Finals is not the size of team, or the depth of business analysis, but really in the execution of the 10-minute presentation itself, because this is the only time the judges can pay their full attention to it. Within the presentation, impressive concept and good presentation skills usually beat in-depth data sheets there is no time to show anyway. That applies only to the presentation of the finalist teams at the competitions. In order to get to the finals at all however, the concept has to be backed up by an in-depth analysis in order to be able to answer judges' questions quickly and accurately. In order to get a solid finished product, many iterations of the presentation have to be made, each improving both on the content and the presentation of it. As to structure, it really helped us last year to take inspiration from the Business Plan Finals video recordings on the FSG YouTube channel.”
The mentioned videos can be found on the YouTube channel administered by the organizers of the Formula Student Germany competition[18].
4.3. Summary and takeaways from the analysis
Considering the data and analysis from the previous chapters, it can be concluded that the business plan discipline is not the strongest for the eForce formula team, but that the situation is improving.
With regards to the creation of a new business plan, it is clear that the positive trends started in the 2017 season should be furthered. Firstly, the presentation structure should be revised with regards to the reference provided on the YouTube recordings of the FSG final presentations. Secondly, it is always good to improve on the visual aspect of the presentation and thus a new concept video is highly recommended. And lastly, in order to preserve the Business Plan capability of the team long-term, it would be beneficial to organize the past Business Plan resources to be accessible by other team members, spread the Business Plan know-how between more members and ideally also involve more people in the creation of the Business Plan itself. This last part however is mostly beyond the main output that has direct impact on the team’s performance in the current season and thus is of lowered priority.
Business Plan eForce FEE Prague Formula Marek Szeles, CTU in Prague
Page 19 of 86
5. Prerequisites for Business Plan creation
Before one starts preparing a comprehensive Business Plan, it is important to understand the commonly used methodologies for the evaluation of business situations. This section aims to describe the basic theory behind some of the methodologies which are going to be used in the eForce Business Plan.
5.1. Business Plan Theory
A Business Plan is a document and a strategy describing the goals of a planned business endeavor and the means to achieve them. It is the single most defining characteristic of any business, as it describes how the business plans to operate and create revenue – the main purpose of a business overall.
"... a good business plan can help to make a good business credible, understandable, and attractive to someone who is unfamiliar with the business. Writing a good business plan can’t guarantee success, but it can go a long way toward reducing the odds of failure."[19]
In Formula Student, the Business Plan is mainly focused on the presentation of the concept, with the operating details only being of secondary importance. Still, as the judges are usually experienced business(wo)men, it is highly appreciated, expected almost, that the business plans presented include analytical methods that a standard business plan outside the competition surely would.
Business Plan eForce FEE Prague Formula Marek Szeles, CTU in Prague
Page 20 of 86
5.2. The theory of individual methodologies and calculations
The limit of 15 minutes for a presentation leaves limited space for strategic analysis, thus only two main methodologies were picked for further explanation and will be included in the final Business Plan.
5.2.1. SWOT analysis
SWOT analysis/matrix stands for “Strengths, Weaknesses, Opportunities, Threats” and is a widely-used method to evaluate the initial position a business has under the current circumstances[20]. Using this method, a square canvas is divided into four quarters of a matrix, each signifying one of the four words in the name. A template for the SWOT analysis can be seen in figure 6.
Figure 6: SWOT analysis matrix template
The aim of the SWOT analysis is to provide a complete overview of the environment a business is in, with all the advantages and disadvantages in one picture.
Characteristics of
the business that
place the business
or project at
a disadvantage
relative to others
Characteristics
of the business
or project
that give it
an advantage
over others
Elements
in the environment
that the business
or project could
exploit to
its advantage
Elements in
the environment
that could
cause trouble
for the business
or project
Strengths
Exte
rnal
Weaknesses
Opportunities Threats
Helpful
Inte
rnal
Harmful
Business Plan eForce FEE Prague Formula Marek Szeles, CTU in Prague
Page 21 of 86
5.2.2. Risk Analysis
Risk Analysis is commonly defined as a “systematic process to comprehend the nature of risk and to express the risk, with the available knowledge”[21]. In other words, it is an attempt to foresee otherwise unexpected situations that might affect the business at hand. Usually, the risk analysis is done qualitatively, by only stating the risk at hand and a proposed solution. However, if there is a larger number of risks, it is beneficial to be able to prioritize possible actions. In order to be able to prioritize risks, they have to be quantified somehow – this is called quantitative risk analysis. Using this method, the risks are assigned a numeric value usually for three parameters:
Impact (How much would the risk affect the business?) Probability (How likely is it that this risk will occur?) Detection (If the risk occurs, how hard is it to detect the occurrence?)
After having the parameters assigned, one can calculate the overall risk factors of individual risks by adding up the parameters – a more complex calculation of the overall risk level might also include weights to multiply the individual risk factors by and thus assign different levels of importance to each risk.
Alternatively, a simpler version of the risk analysis only splits the impact and probability of the risk into three qualitative categories: low, medium and high. In both metrics, low signifies positive value/low priority and high signifies a negative value/ higher priority of the risk. The overall priority of individual risk factors can be determined using a simple algorithm: if both impact and probability are low, then the overall priority is low too. If both parameters are rated as medium, or one is medium and one low, the overall priority is medium. If one parameter is medium and the other high, or both are high, the risk has high priority. The last case is if one parameter is rated low and the other one as high. If this rare case happens, the overall risk factor is considered medium.
Based on these values and the nature of the risk, it is best practice to include a mitigation plan in case the risk truly occurs. Quantitative risk analysis is especially useful when devising a potential exit strategy, as one can foresee the situations in which it is best to abandon the original business concept.
5.2.3. Investment performance metrics
In addition to the situation methodologies, it is vital to be able to assess the financial viability and profitability of the created business plan. The simplest value for measurement is the Net Cash Flow of the business plan. However, as it is often misleading, two other main metrics are used for performance measurement in this thesis – Net Present Value (NPV) and Return on Investment (ROI). Apart from these two metrics, Compound Annual Growth Rate (CAGR) was also used at times to indicate yearly growth over time.
Business Plan eForce FEE Prague Formula Marek Szeles, CTU in Prague
Page 22 of 86
Net Cash Flow
This value indicates the total financial profit or loss from a project, added as a simple sum of Cash Flow from all considered periods. The formula for calculation is as follows[22]:
𝑁𝑒𝑡 𝐶𝑎𝑠ℎ𝑓𝑙𝑜𝑤 = ∑ 𝐶𝐹𝑡
𝑡𝑚𝑎𝑥
𝑖=0
Where t is a period of time and CF is the Cash Flow for the given period.
Net Present Value
This common metric expands on Net Cash Flow, but is more sophisticated by introducing a discount rate – a percentage representing expected returns for investments of similar risk[23].
𝑁𝑃𝑉 = 𝐶𝐹0 + ∑𝐶𝐹𝑡
(1 + 𝑑)𝑡
𝑡𝑚𝑎𝑥
𝑖=1
Again, t is a period of time and CF is the Cash Flow for the given period. CF0 is the initial investment, and thus almost always a negative value.
Return on Investment
This metric represents the ratio between the total net gain from investment (which is equal to Net Cash Flow) and the investment cost[24]:
𝑅𝑂𝐼 = 𝐺𝑎𝑖𝑛 𝑓𝑟𝑜𝑚 𝑖𝑛𝑣𝑒𝑠𝑡𝑚𝑒𝑛𝑡 − 𝐶𝑜𝑠𝑡 𝑜𝑓 𝑖𝑛𝑣𝑒𝑠𝑡𝑚𝑒𝑛𝑡
𝐶𝑜𝑠𝑡 𝑜𝑓 𝑖𝑛𝑣𝑒𝑠𝑡𝑚𝑒𝑛𝑡
This metric has a drawback though – since the majority of investments are projected to be profitable from some point in the future, the ROI can easily be inflated by extending the timeline for the considered Cash Flows. To balance this, Annualized ROI is often used[25]:
𝐴𝑛𝑛𝑢𝑎𝑙𝑖𝑧𝑒𝑑 𝑅𝑂𝐼 = 𝑅𝑂𝐼(
1𝑛𝑢𝑚𝑏𝑒𝑟 𝑜𝑓 𝑝𝑒𝑟𝑖𝑜𝑑𝑠
)− 1
Using this formula, the Return on Investment is split per period, which might offer a more representative view on the value.
Compound Annual Growth Rate
In many cases when considering medium to long term development, it is important to have an idea of how the total development translates into an average growth per one period. For this, the Compound Annual Growth Rate is usually used. The formula for it is as follows[26]:
𝐶𝐴𝐺𝑅 = (𝐸𝑛𝑑𝑖𝑛𝑔 𝑣𝑎𝑙𝑢𝑒
𝑆𝑡𝑎𝑟𝑡𝑖𝑛𝑔 𝑣𝑎𝑙𝑢𝑒)
(1
𝑛𝑢𝑚𝑏𝑒𝑟 𝑜𝑓 𝑝𝑒𝑟𝑖𝑜𝑑𝑠)
− 1
As indicated by the name, the most common period for measurement is one year, but the same methodology can theoretically be applied to other time periods too.
Business Plan eForce FEE Prague Formula Marek Szeles, CTU in Prague
Page 23 of 86
5.3. Material and systematic preparation for the Business Plan
Since there were capacity issues in the past, the team decided to transfer to a new server in 2017. The new server, commonly called “eForce-two”, since “eForce-one” was its predecessor, is located on the Strahov dormitories of CTU. The hardware setup consists of HP Z400 + 2x2TB HDD RAID1 and is running a Debian GNU/Linux 7 (wheezy). The server is running several concurrent services for eForce, including several websites, team databases, git, server-licensed applications (such as Ansys) and team emails.
5.3.1. Cloud storage
The eForce team consists of many different students that have to cooperate and share both knowledge and data files. In order to efficiently do this, a cloud-based data synchronization solution was put in place, OwnCloud, operated by CesNet in the Czech Republic. The basic scheme of its deployment at eForce can be seen in figure 7.
Figure 7: OwnCloud distribution model at eForce
Firewall
eForce IT groupMobile devicesNetwork users • User provisioning
• Storage administration
OwnCloudclient sync
Direct access
Synchronize
FTP, httpWebDav
Business Plan eForce FEE Prague Formula Marek Szeles, CTU in Prague
Page 24 of 86
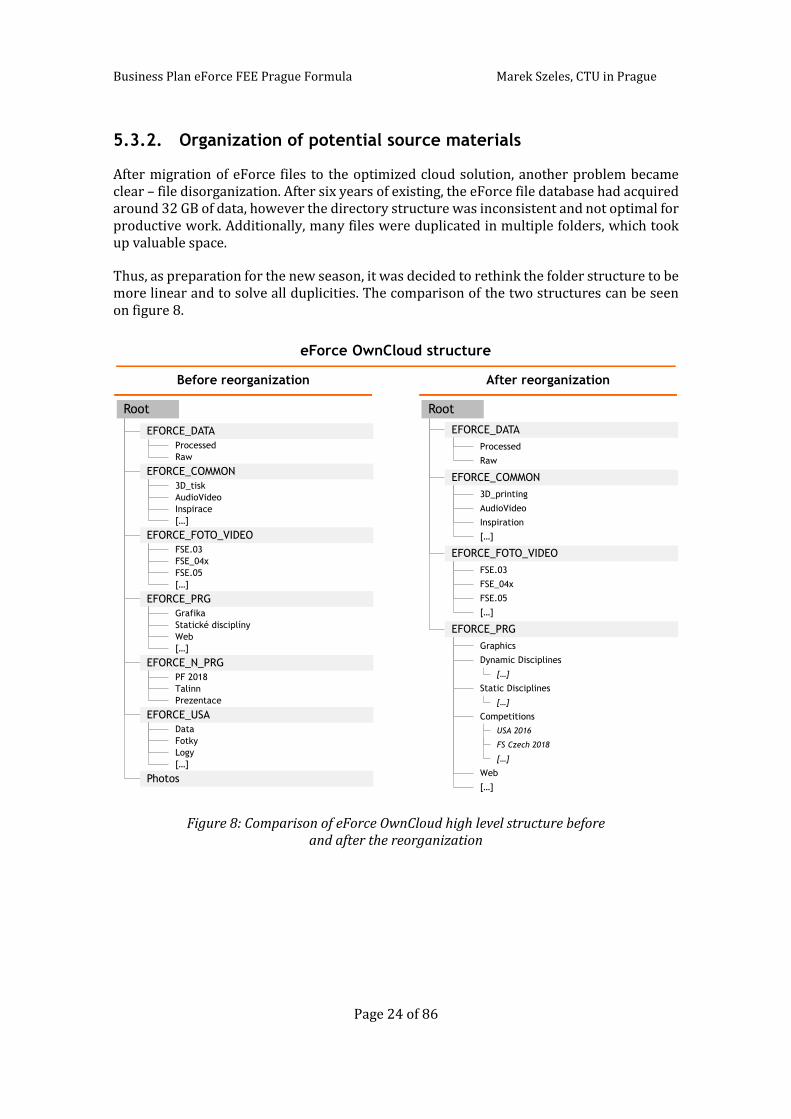
5.3.2. Organization of potential source materials
After migration of eForce files to the optimized cloud solution, another problem became clear – file disorganization. After six years of existing, the eForce file database had acquired around 32 GB of data, however the directory structure was inconsistent and not optimal for productive work. Additionally, many files were duplicated in multiple folders, which took up valuable space.
Thus, as preparation for the new season, it was decided to rethink the folder structure to be more linear and to solve all duplicities. The comparison of the two structures can be seen on figure 8.
Figure 8: Comparison of eForce OwnCloud high level structure before and after the reorganization
Before reorganization After reorganization
eForce OwnCloud structure
Root
Photos
Data
Fotky
Logy
[…]
PF 2018
Talinn
Prezentace
Grafika
Statické disciplíny
[…]
Web
FSE.03
FSE_04x
[…]
FSE.05
3D_tisk
AudioVideo
[…]
Inspirace
Processed
Raw
EFORCE_DATA
EFORCE_COMMON
EFORCE_FOTO_VIDEO
EFORCE_PRG
EFORCE_N_PRG
EFORCE_USA
Root
Graphics
Dynamic Disciplines
[…]
Competitions
FSE.03
FSE_04x
[…]
FSE.05
3D_printing
AudioVideo
[…]
Inspiration
Processed
Raw
EFORCE_DATA
EFORCE_COMMON
EFORCE_FOTO_VIDEO
EFORCE_PRG
Static Disciplines
Web
USA 2016
FS Czech 2018
[…]
[…]
[…]
Business Plan eForce FEE Prague Formula Marek Szeles, CTU in Prague
Page 25 of 86
6. Business Plan eForce 2018
This chapter is the core of the thesis, as it deals with the Business Plan itself. Since the resulting plan is a complex piece of work, some steps preceding and following it are also included.
This season’s preparations for static disciplines at eForce started by reorganizing the cloud storage solution the team is using. Thus, this is documented in the first subchapter. Then, the assumptions taken into account are described, followed by a detailed description of the Business Plan concept and its various aspects of innovation. Out of this basic information, preliminary outputs for the competition are assembled – the BLC and BPES documents.
After this follows the overarching subchapter combining within itself all the partial analyses that make up the Business Plan, ranging from situational assessment to the investment proposition. After this, the Business Plan itself is further complemented by several draft supporting materials for the inevitable presentations at the competitions.
6.1. Graphic template for presentation and documents
Since the main output of the Business Plan is the presentation, it is very important that it looks representative, is visually pleasing and allows the audience to pick up the main message as quickly as possible. In order to prepare such outputs as quickly as possible, it is best to have a well-prepared template one can merely use to fill in the content. One such template is part of this work’s output.
Due to most of the team using the Windows OS, and PowerPoint being the worldwide standard[27] for creating and using presentations, the presentation template was created with and optimized for Microsoft PowerPoint.
Graphically, the template is mostly following the footsteps of the presentations used in the 2017, with content added and unified. Naturally, it uses the eForce signature orange colors, with bright orange-yellow as a secondary accent. Bebas Neue[28] has been used as a main font for headings, with Trebuchet MS[29] being used for standard text. The overall look of the presentation template was inspired by the 2017 rebranding materials of The Boston Consulting Group, done by the Carbone Smolan Agency[30].
The template, of course, is not limited to Business Plan presentations and can be used virtually by any team member for any presentation purposes – such as promotional presentations in schools, or for sponsors.
The resulting output is likely not final, as eForce is now creating a new visual identity along with a branding guide – should it be released in the following months, the template will be adjusted to comply with its specifications.
The template file can be found in appendix [A].
Business Plan eForce FEE Prague Formula Marek Szeles, CTU in Prague
Page 26 of 86
6.2. Assumptions considered in the Business Plan
Before preparing the actual materials for the Business Plan itself, it is critical to define the initial assumptions that have to be taken into account when assembling the Business Plan.
The key general assumptions in this Business Plan are connected especially to the formula manufacturing – the cost of manufacturing for one formula, and its relationship to the manufacturing capacity and sale volumes. Both are discussed in further detail in their own subchapters.
6.2.1. Formula manufacturing cost
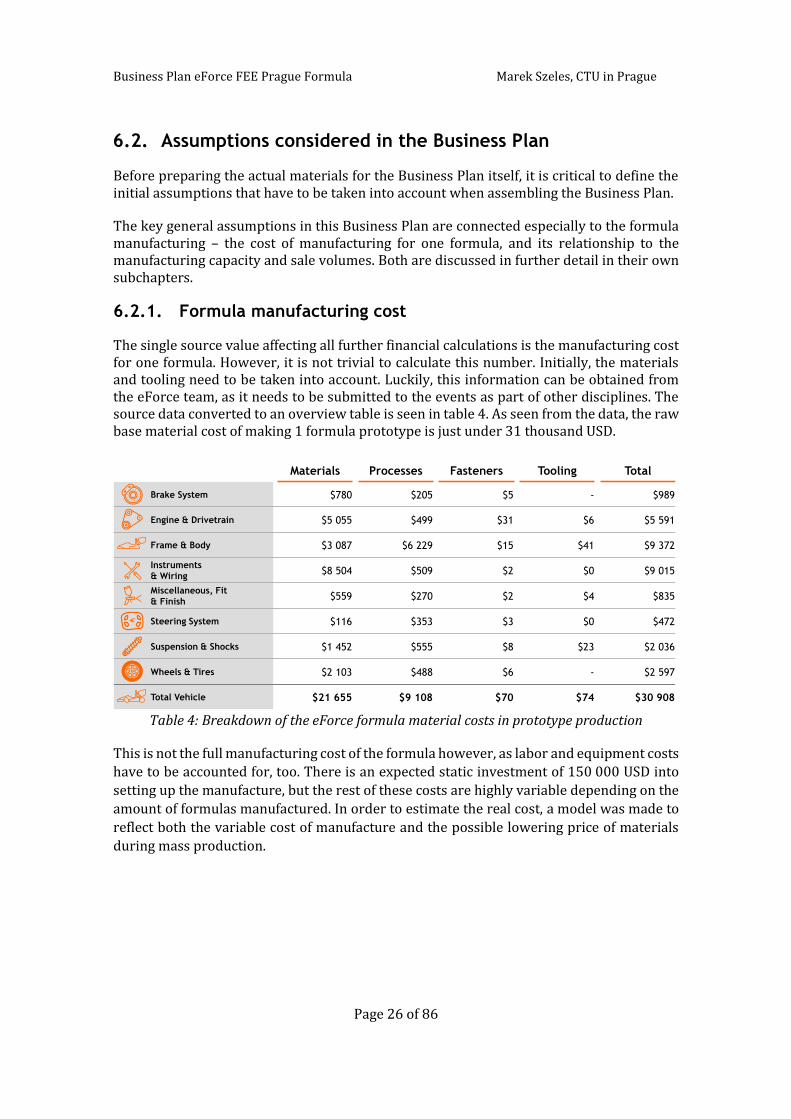
The single source value affecting all further financial calculations is the manufacturing cost for one formula. However, it is not trivial to calculate this number. Initially, the materials and tooling need to be taken into account. Luckily, this information can be obtained from the eForce team, as it needs to be submitted to the events as part of other disciplines. The source data converted to an overview table is seen in table 4. As seen from the data, the raw base material cost of making 1 formula prototype is just under 31 thousand USD.
Table 4: Breakdown of the eForce formula material costs in prototype production
This is not the full manufacturing cost of the formula however, as labor and equipment costs have to be accounted for, too. There is an expected static investment of 150 000 USD into
setting up the manufacture, but the rest of these costs are highly variable depending on the
amount of formulas manufactured. In order to estimate the real cost, a model was made to
reflect both the variable cost of manufacture and the possible lowering price of materials
during mass production.
Materials Processes Fasteners Tooling Total
Brake System $780 $205 $5 - $989
Engine & Drivetrain $5 055 $499 $31 $6 $5 591
Frame & Body $3 087 $6 229 $15 $41 $9 372
Instruments
& Wiring$8 504 $509 $2 $0 $9 015
Miscellaneous, Fit
& Finish$559 $270 $2 $4 $835
Steering System $116 $353 $3 $0 $472
Suspension & Shocks $1 452 $555 $8 $23 $2 036
Wheels & Tires $2 103 $488 $6 - $2 597
Total Vehicle $21 655 $9 108 $70 $74 $30 908
Business Plan eForce FEE Prague Formula Marek Szeles, CTU in Prague
Page 27 of 86
This analysis included scenarios for manufacturing 1, 5, 10, 20 and 50 formulas annually.
The resulting manufacturing costs range from over 230 thousand USD, when manufacturing
only one prototype, to just over 30 thousand USD, when manufacturing 50 vehicles
annually, as seen on figure 9. The data points can be interpolated using a hyperbolic
estimation, as also seen in the figure.
Figure 9: Relationship of production volumes to vehicle manufacturing cost
Although the original analysis is in-depth and goes into component level of detail, it was co-authored by multiple eForce team members and is thus not a full part of this thesis. Access to it can however be granted upon request.
y = 204124x-0.539
R? = 0.954
$-
$50 000
$100 000
$150 000
$200 000
0 5 10 15 20 25 30 35 40 45 50
Man
ufa
ctu
rin
g p
rice
Number of vehicles made annually
Manufacturing cost of one vehicle
Annual
volume
Manufacturing
price
1 243 232$
5 71 431$
10 51 566$
20 38 652$
50 30 117$
Business Plan eForce FEE Prague Formula Marek Szeles, CTU in Prague
Page 28 of 86
6.2.2. Manufacturing and selling capacity
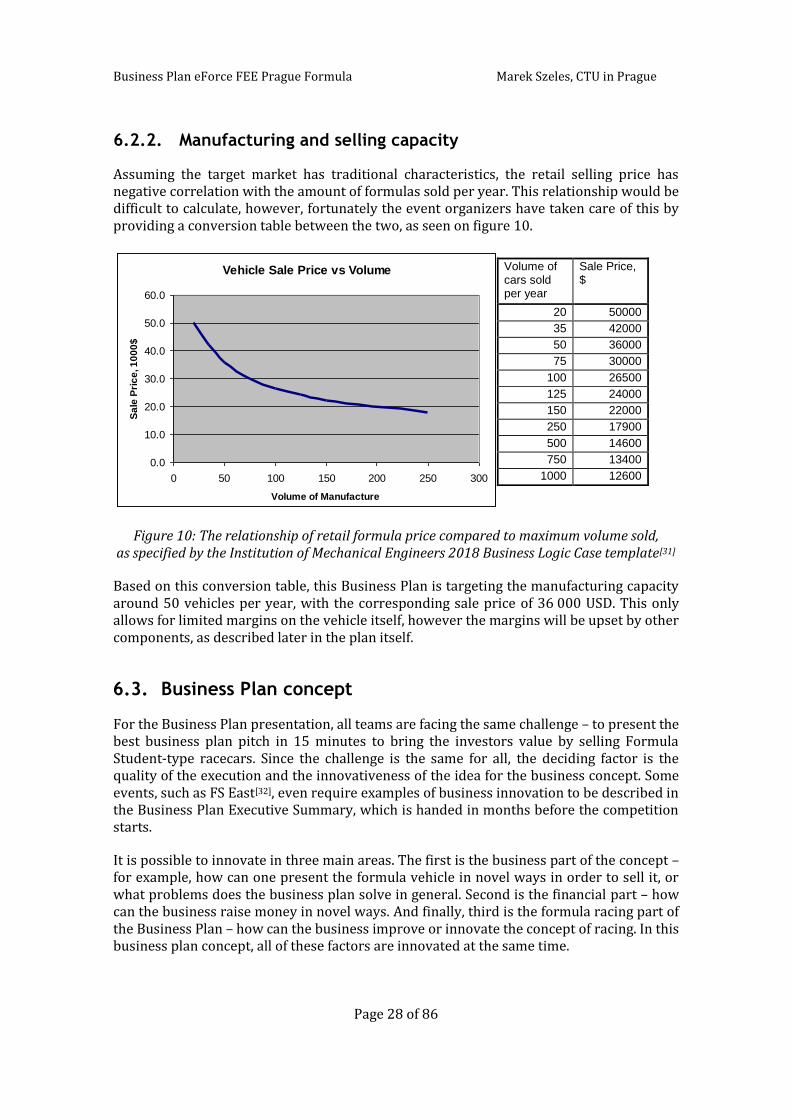
Assuming the target market has traditional characteristics, the retail selling price has negative correlation with the amount of formulas sold per year. This relationship would be difficult to calculate, however, fortunately the event organizers have taken care of this by providing a conversion table between the two, as seen on figure 10.
Figure 10: The relationship of retail formula price compared to maximum volume sold, as specified by the Institution of Mechanical Engineers 2018 Business Logic Case template[31]
Based on this conversion table, this Business Plan is targeting the manufacturing capacity around 50 vehicles per year, with the corresponding sale price of 36 000 USD. This only allows for limited margins on the vehicle itself, however the margins will be upset by other components, as described later in the plan itself.
6.3. Business Plan concept
For the Business Plan presentation, all teams are facing the same challenge – to present the best business plan pitch in 15 minutes to bring the investors value by selling Formula Student-type racecars. Since the challenge is the same for all, the deciding factor is the quality of the execution and the innovativeness of the idea for the business concept. Some events, such as FS East[32], even require examples of business innovation to be described in the Business Plan Executive Summary, which is handed in months before the competition starts.
It is possible to innovate in three main areas. The first is the business part of the concept – for example, how can one present the formula vehicle in novel ways in order to sell it, or what problems does the business plan solve in general. Second is the financial part – how can the business raise money in novel ways. And finally, third is the formula racing part of the Business Plan – how can the business improve or innovate the concept of racing. In this business plan concept, all of these factors are innovated at the same time.
Volume of cars sold per year
Sale Price, $
20 50000
35 42000
50 36000
75 30000
100 26500
125 24000
150 22000
250 17900
500 14600
750 13400
1000 12600
Vehicle Sale Price vs Volume
0.0
10.0
20.0
30.0
40.0
50.0
60.0
0 50 100 150 200 250 300
Volume of Manufacture
Sa
le P
ric
e, 1
00
0$
Business Plan eForce FEE Prague Formula Marek Szeles, CTU in Prague
Page 29 of 86
6.3.1. Business innovation and logic
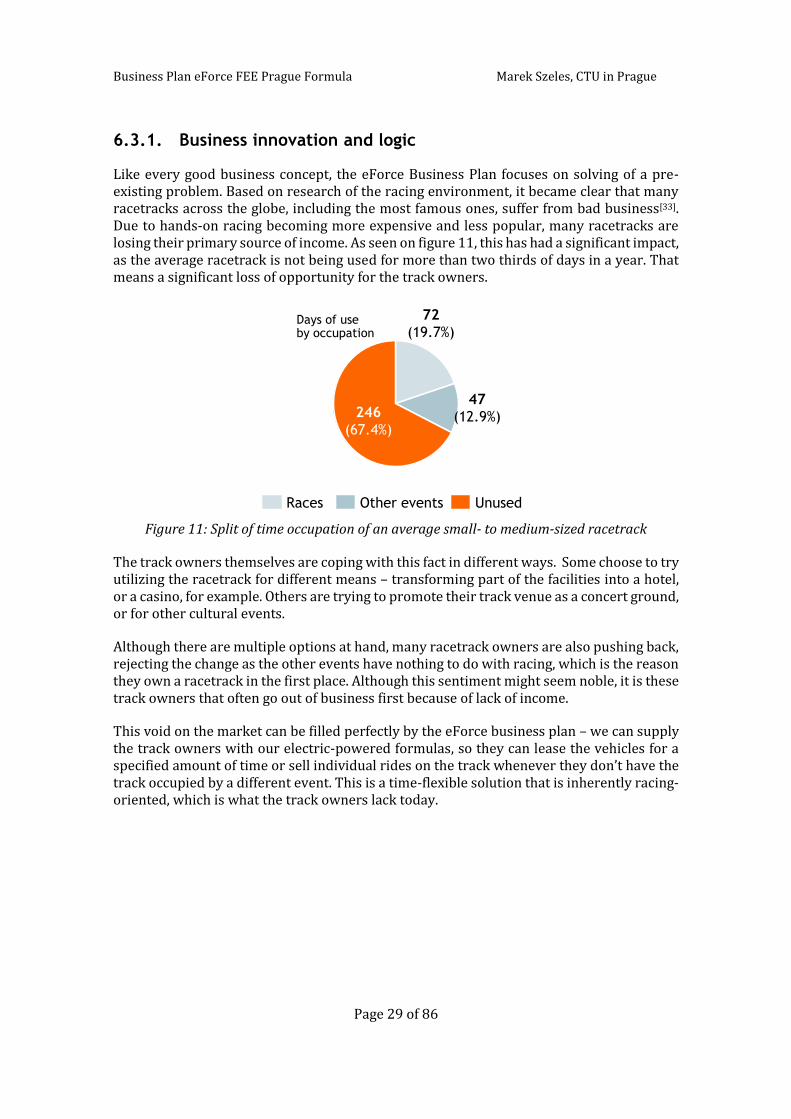
Like every good business concept, the eForce Business Plan focuses on solving of a pre-existing problem. Based on research of the racing environment, it became clear that many racetracks across the globe, including the most famous ones, suffer from bad business[33]. Due to hands-on racing becoming more expensive and less popular, many racetracks are losing their primary source of income. As seen on figure 11, this has had a significant impact, as the average racetrack is not being used for more than two thirds of days in a year. That means a significant loss of opportunity for the track owners.
Figure 11: Split of time occupation of an average small- to medium-sized racetrack
The track owners themselves are coping with this fact in different ways. Some choose to try utilizing the racetrack for different means – transforming part of the facilities into a hotel, or a casino, for example. Others are trying to promote their track venue as a concert ground, or for other cultural events.
Although there are multiple options at hand, many racetrack owners are also pushing back, rejecting the change as the other events have nothing to do with racing, which is the reason they own a racetrack in the first place. Although this sentiment might seem noble, it is these track owners that often go out of business first because of lack of income.
This void on the market can be filled perfectly by the eForce business plan – we can supply the track owners with our electric-powered formulas, so they can lease the vehicles for a specified amount of time or sell individual rides on the track whenever they don’t have the track occupied by a different event. This is a time-flexible solution that is inherently racing-oriented, which is what the track owners lack today.
246
(67.4%)
UnusedRaces Other events
47
(12.9%)
72
(19.7%)Days of useby occupation
Business Plan eForce FEE Prague Formula Marek Szeles, CTU in Prague
Page 30 of 86
6.3.2. Financial innovation
Innovation in the financial part of the business plan is much less common – after all, it is difficult to find a new creative way of financing a project other than changing the outside investment to business share ratio or proposing different metrics on how to measure the value of the investment proposition.
Still, the eForce business plan includes a bold concept on how to transfer and steer the financial risk away from the investors and eForce itself to the end customer and at the same time raise further investment by utilizing a modern trend and a novel way of raising funds – the Initial Coin Offering (ICO).
The eForce Initial Coin Offering
Initial Coin Offerings are a relatively simple idea, being in essence a new way of crowd-sourcing. The name implies similarity to Initial Public Offerings (IPOs) – a traditional name for the process when a private company is listed on a stock exchange for the first time and starts being open to the public for trading – thus becoming a public company[34]. Even though the name “Initial Coin Offering” is directly derived from the term “Initial Public Offering”, such a comparison is only partially accurate. While the IPO is a legally regulated complex process taking several months, at the end of which the stock of the company is available for purchase to consumers, the ICO is currently a legally almost unregulated process that is bound purely by technical boundaries, guaranteed by so-called “smart contracts”[35], which are in principle pieces of software or protocols ensuring the performance of credible transactions without third parties.
The ICO describes the process after the creation of the first token blocs. The creator – in this case, eForce – is able to distribute the tokens for a specified fee. The incentive to buy the tokens is either a speculative promise of future value increase, or, as in eForce token’s case, the intrinsic value of services to be sold exclusively through the use of the token. Trading and speculating with the value of the individual tokens has become very popular lately, as seen on the total market capitalization of all cryptocurrencies/tokens in figure 12.
Figure 12: Market capitalization of cryptocurrencies from January 2017 to May 2018[36]
400
200
300
500
100
0
50
800
600
80
40
30
10
0
700
20
60
900
70
177
Aug Oct
14
26
7
Jul
814
FebDec
Cryptocurrency market capitalization (B USD)
Jun
453
24h trading volume (B USD)
44
282
Nov Mar
5
464
May
15
Jan Apr
201
Sep
48
Mar
0
102
May
323
Jan Feb Apr
2
Market capitalization 24h trading volume
Business Plan eForce FEE Prague Formula Marek Szeles, CTU in Prague
Page 31 of 86
The overall cryptocurrency market has reached a peak at the end of 2017 and has seen a correction since. However, about 450 billion USD value still remains on the market, which represents an impressive 947% increase over the last year as of May 2018.
This coin offering approach is very beneficial for the initiator, as there is little to no risk associated with it – the worst case scenario is damaged reputation in the case of an unsuccessful ICO. Almost all risk is transferred to the buyer of the token, who believes that the value of the token will increase with time, or that the project will be successful and it will be possible to spend the tokens on services. However, there is often no guarantee to the buyer that this will happen, and there are no refunds.
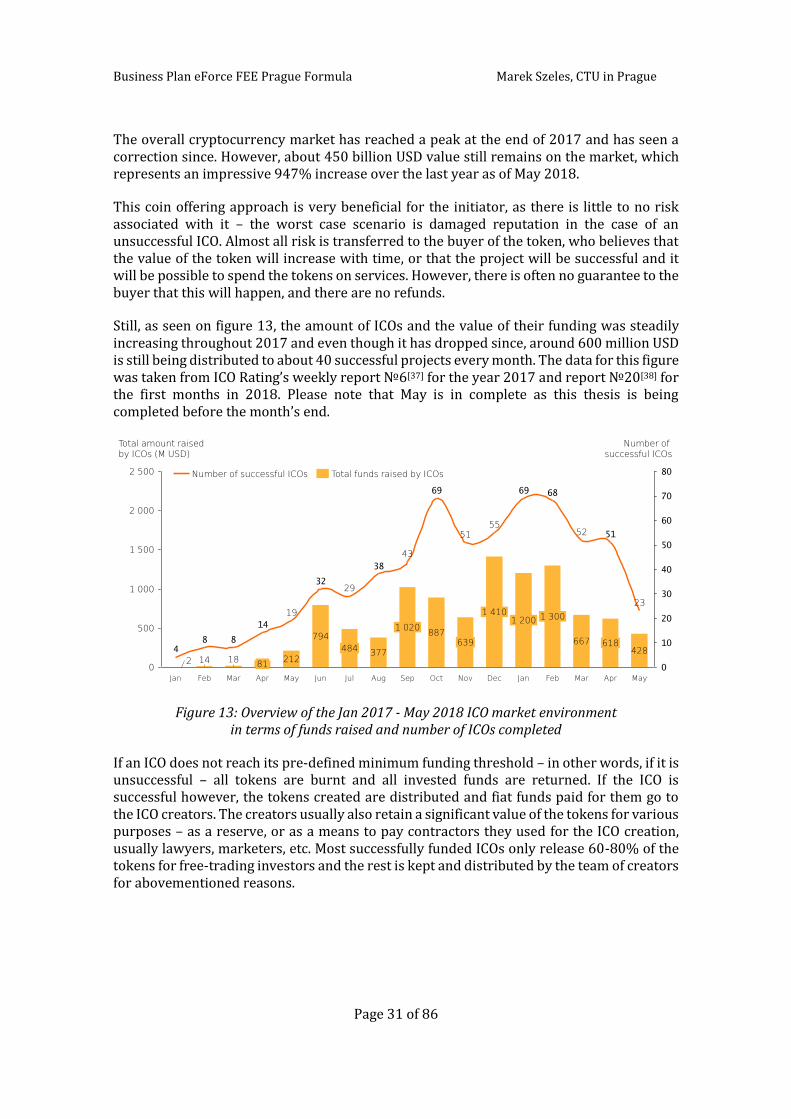
Still, as seen on figure 13, the amount of ICOs and the value of their funding was steadily increasing throughout 2017 and even though it has dropped since, around 600 million USD is still being distributed to about 40 successful projects every month. The data for this figure was taken from ICO Rating’s weekly report №6[37] for the year 2017 and report №20[38] for the first months in 2018. Please note that May is in complete as this thesis is being completed before the month’s end.
Figure 13: Overview of the Jan 2017 - May 2018 ICO market environment in terms of funds raised and number of ICOs completed
If an ICO does not reach its pre-defined minimum funding threshold – in other words, if it is unsuccessful – all tokens are burnt and all invested funds are returned. If the ICO is successful however, the tokens created are distributed and fiat funds paid for them go to the ICO creators. The creators usually also retain a significant value of the tokens for various purposes – as a reserve, or as a means to pay contractors they used for the ICO creation, usually lawyers, marketers, etc. Most successfully funded ICOs only release 60-80% of the tokens for free-trading investors and the rest is kept and distributed by the team of creators for abovementioned reasons.
51
686969
38
32
14
884
0
10
20
30
40
50
60
70
80
0
1 000
2 000
1 500
500
2 500
212
Feb Mar Jun
23
Jul Aug SepMay Oct
52
Jan Apr
29
Jan Mar Apr MayDec Feb
484
19
Nov
377
1 020
51
43
Total amount raisedby ICOs (M USD)
55
Number ofsuccessful ICOs
618
18
1 200
428142
639
1 410
794
1 300
887
81
667
Total funds raised by ICOsNumber of successful ICOs
Business Plan eForce FEE Prague Formula Marek Szeles, CTU in Prague
Page 32 of 86
The eForce token trading ecosystem
There are four major stakeholders which should be balanced in the future eForce token economy – the eForce team itself, the future investors, the eForce customers/racetrack owners and finally the end customers/drivers. Among these four, a functioning ecosystem for token trading has to be set up, so that each of the groups has some incentive to spend the tokens or make other transactions – otherwise, the tokens would essentially have no intrinsic value.
For the end customers, who are expected to be the largest investors in the ICO itself and thus the largest group of token holders, the incentive to buy the token is twofold – firstly, they have the motivation to support the project pilot at its start, but most of all the eForce token is to become the single trading currency for all eForce services to be implemented. Thus, using the eForce token, the individual investors and soon to be drivers will get early access to the eForce community, the application and all its features – like custom livery creation, racing a track against celebrities and other digital perks. It is also possible that using the token, promotional items could be purchased from eForce directly.
The track owners in turn have the possibility to stage promotions and competitions using the tokens through an eForce prepared interface and they can use them to pay for eForce services and products.
Other investors have an opportunity to participate in the ecosystem even if they do not want to purchase anything with the tokens – they can trade them on the exchanges where the eForce token will be listed.
The eForce team in itself will function as a minor regulator – it could start selling off some of its reserve tokens from the ICO to raise additional funds, as well as burn some of these tokens to limit token supply and thus regulate the trading prices of the token on the exchanges. The general structure of these relationships can be seen on figure 14.
Figure 14: High-level scheme of the eForce token ecosystem
eForce
Sells/burns
tokens to limit
supply
End customers
Gets digital rewards:
Custom liveries
Race a celebrity
Buy memorabilia
from eForce
Track owners
Create promotion
events for racers
Buy services from
eForce
All interested
parties
General public
trading on token
exchanges
Business Plan eForce FEE Prague Formula Marek Szeles, CTU in Prague
Page 33 of 86
6.3.3. Formula racing innovation
The formula racing innovation is the backbone of the whole Business Plan, as it is the façade of the whole model that the customers will see. For the eForce Business Plan 2018, two complementary innovation elements were selected: Augmented Reality enabled racing and a supporting social network-type app for the end customers/racers. Each of these topics is expanded upon in a separate subchapter.
Augmented racing
The main selling point to attract end customers to the idea of racing in an eForce racecar is the implementation of Augmented Reality technology in every helmet visor. This allows the driver to see not only the real objects such as the track and the formula being driven, but also completely virtual objects that can be programmed and designed according to eForce specification.
There are several basic features included in this concept. The main feature is a dynamic projection of a General User Interface (GUI), mainly consisting of a speedometer showing the current velocity. Another application of the technology is to project the ideal apex on the track – an estimate of a line the driver should try to drive on in order to achieve the fastest possible time at that particular segment of the track. Such a line may use color signaling to indicate whether the driver should be accelerating or braking at a given moment, relative to their current velocity. Furthermore, the AR visor can display virtual objects, such as virtual opponents, barriers, or advertisements. A visualization of how such a concept might look like can be seen on figure 15.
Figure 15: Racing concept visualization – view from racing helmet with Augmented Reality elements
Projected GUI
2
1 Simulated opponents Projected ideal apex2 3
3
1
Business Plan eForce FEE Prague Formula Marek Szeles, CTU in Prague
Page 34 of 86
It is probably not surprising that to implement such a system, the standard formulas, helmets and even the track have to be further equipped with additional sensors, monitors and other features in order for the whole system to work accurately and the driver has a seamless experience. An overview of such planned features can be seen on figure 16.
Figure 16: Overview of sensors needed to be installed on each vehicle, track and helmet in order to realize the concept
Augmented vision
Medical sensors
4x4 Drive
Performance monitors
GPS tracking system
WiFi connection to servers
In-track safety sensors
Business Plan eForce FEE Prague Formula Marek Szeles, CTU in Prague
Page 35 of 86
Social aspect
An integral part of the user experience for the eForce Augmented Reality concept is the social aspect of the endeavor. The end customers that take part in the races are encouraged to download an app that allows them to interact with the eForce concept even when they are not on the track themselves. The social aspect mostly revolves around a mobile application, which serves as the main interface between the end customer and the eForce systems.
In the app, every driver has a user account, which allows them to search for nearby eForce events, pay for services, and even view their own digitally projected custom formula livery, which they designed. At the same time, the app serves as a wallet for the eForce coins described in the Financial Innovation chapter. As for the social aspect, a parallel, interest-based social network is created, where every user can compare their performance with other drivers using lap times at a given track – where the lap times of all drivers form the overall leaderboards, as seen on a concept art on figure 17. They can also gain experience points, earn achievements and thus level up their profile while using the eForce services, which serves as a further gamification feature.
Figure 17: Social experience oriented app visualization – track leaderboards
Top Drivers
1
2
3
4
5
6
7
8
Perez
Senna
Hamilton
Alonso
Vettel
Rajaphutti
Wu
Raikkonen
Business Plan eForce FEE Prague Formula Marek Szeles, CTU in Prague
Page 36 of 86
6.4. Outputs for the competition preceding the Business Plan
Long before the racing events take place, many competition organizers demand a sneak-peak into the preparations of the individual teams, through earlier hand-in of certain documents. The Business Plan discipline also includes such a document – the Business Logic Case, or the Business Plan Executive Summary.
6.4.1. Business Logic Case for Formula Student UK
The deadline for submission of the Formula Student UK event was Friday, December 7th, 2017. Due to the strict deadline, the Business Logic Case document submitted was mostly a re-visited and updated version of the document used for submission for the 2017 season.
The business strategy is to leverage a combination of the formula concept with augmented reality, targeting both the motorsport and the digital gadget/gaming markets. As for business execution, apart from raising funds the traditional way, an ICO will be made so the investors will have two assets from one transaction.
The full document handed in can be found in appendix [B].
6.4.2. Business Plan Executive Summary for FS East
The deadline for submission of the BPES document for Formula Student East in Hungary was Friday, May 25th, 2018. FS East has a specific additional rule to include one outstanding, innovative business model idea and one outstanding car technical feature in the summary, along with the anticipated production costs of the car[39].
The full document handed in can be found in appendix [C].
6.4.3. Business Plan Executive Summary for FS Netherlands
The deadline for submission of the BPES document for Formula Student Netherlands was Friday, June 1st, 2018. Instead of the innovation, the BPES here includes a planned 3-phase rollout of the concept.
The full document handed in can be found in appendix [D].
6.4.4. Business Plan Executive Summary for FS Czech
The deadline for submission of the BPES document for Formula Student Czech was Monday, June 11th, 2018. For the first submission, the BPES has the same format as for FS Netherlands,
The full document handed in can be found in appendix [E].
Business Plan eForce FEE Prague Formula Marek Szeles, CTU in Prague
Page 37 of 86
6.5. Business Plan creation
After defining the overall concept and innovation opportunities, as described in the previous chapters, one must expand on this by describing the underlying logic of the Business Plan, including relevant calculations backing it up.
6.5.1. Business logic
Building on the innovation concepts described previously, the logic of the business focuses on the three main stakeholders of the eForce concept – eForce itself, the racetrack owners and the end customers. In order for the business plan to be successful, all stakeholders must prosper from it. The main points that make the eForce Business Plan attractive to the individual parties can be seen on figure 18.
Figure 18: Overview of stakeholders’ interests in the concept
This three-way relationship is further bolstered by the eForce coin ecosystem and trading platform, as discussed earlier.
Track owners
Use up the void space
Get new revenue from
selling the eForce
experience as a service
eForce
Creates a new market
Brings gamers to
motorsport industry
Gets revenue from
selling formulas and
providing digital services
Customers
Gain a new opportunity
to spend free time
Build social
status/reputation
through the levelling
system
Spends money on rides
and digital perks
Business Plan eForce FEE Prague Formula Marek Szeles, CTU in Prague
Page 38 of 86
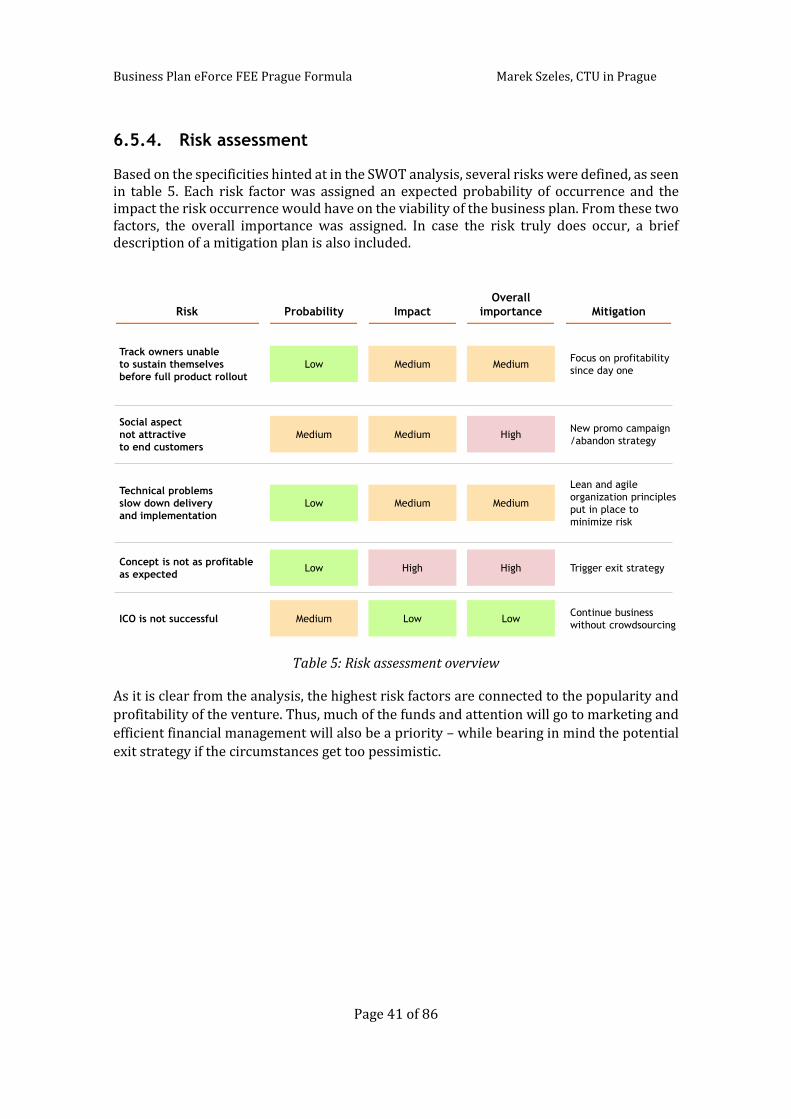
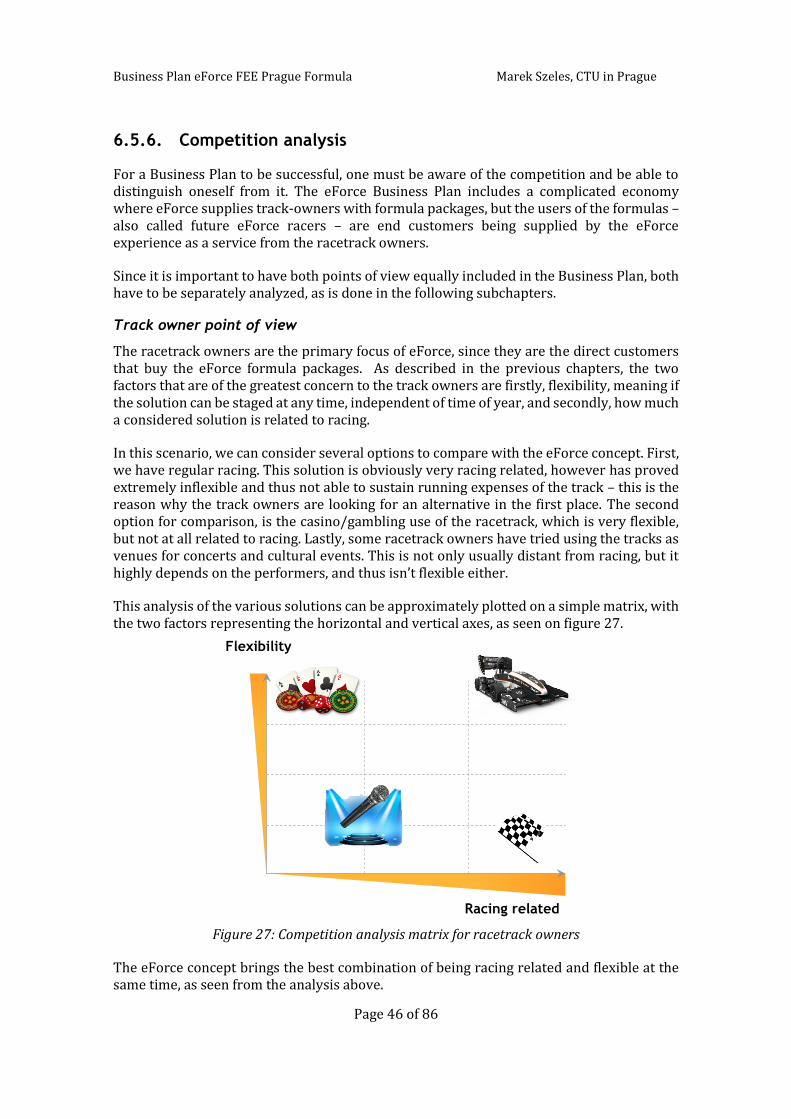
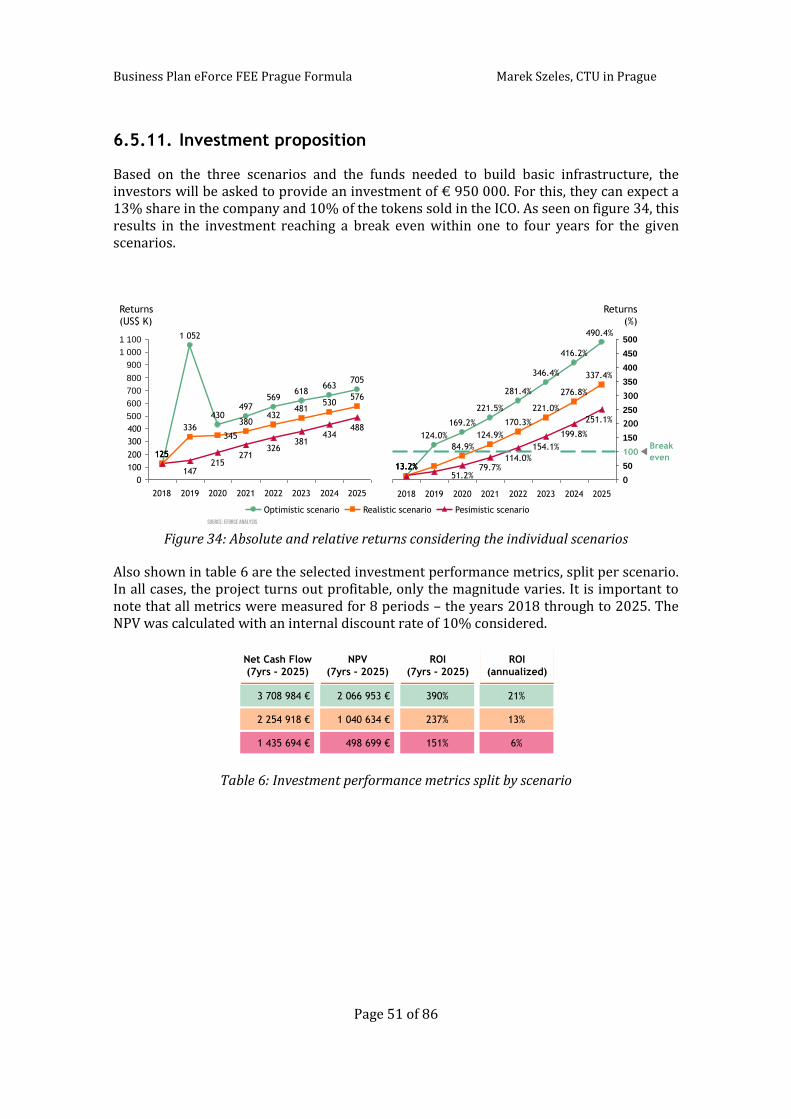
6.5.2. Pricing
Money is the main enabler of any business plan, and since product pricing is the main source of income for eForce, it is a big driver behind the success and the feasibility of the whole concept. There are two sets of pricing connected to the Business Plan.
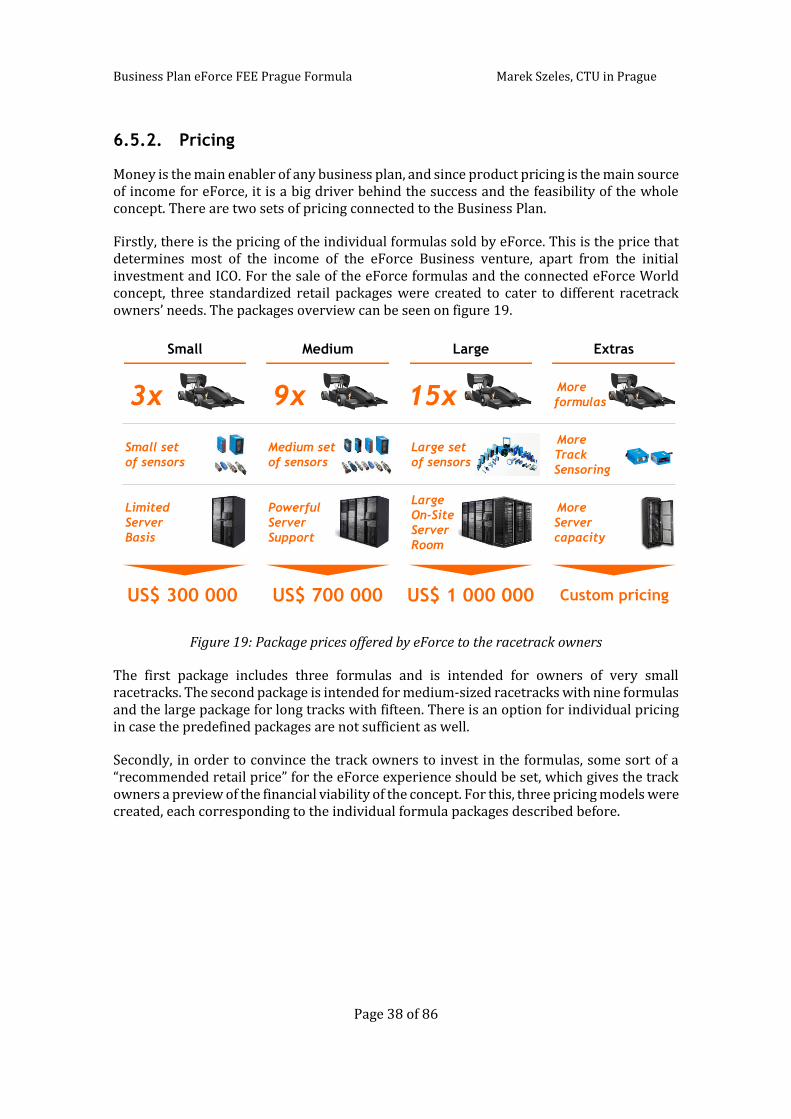
Firstly, there is the pricing of the individual formulas sold by eForce. This is the price that determines most of the income of the eForce Business venture, apart from the initial investment and ICO. For the sale of the eForce formulas and the connected eForce World concept, three standardized retail packages were created to cater to different racetrack owners’ needs. The packages overview can be seen on figure 19.
Figure 19: Package prices offered by eForce to the racetrack owners
The first package includes three formulas and is intended for owners of very small racetracks. The second package is intended for medium-sized racetracks with nine formulas and the large package for long tracks with fifteen. There is an option for individual pricing in case the predefined packages are not sufficient as well.
Secondly, in order to convince the track owners to invest in the formulas, some sort of a “recommended retail price” for the eForce experience should be set, which gives the track owners a preview of the financial viability of the concept. For this, three pricing models were created, each corresponding to the individual formula packages described before.
Small Medium Large Extras
3x 9x 15xMore
formulas
US$ 300 000
More
Track
Sensoring
Small set
of sensors
Medium set
of sensors
Large set
of sensors
US$ 700 000 US$ 1 000 000 Custom pricing
More
Server
capacity
Limited
Server
Basis
Powerful
Server
Support
Large
On-Site
Server
Room
Business Plan eForce FEE Prague Formula Marek Szeles, CTU in Prague
Page 39 of 86
A sample model for the small package can be seen on figure 20. On the left side of the figure, all the assumptions were consolidated into three tables, showing the investment parameters, the maintenance expenses and tax rate and also the recommended price. Two products for the end customers (racers) were defined, one being two laps in the formula and the other offering five laps. Please note that apart from the clean lap times, both products assume a three-minute buffer time for driver change.
On the right side, the profitability calculation is made – on the left there is a theoretical scenario for full capacity during the day, and on the right a more realistic scenario assuming 70% capacity. After the simple earnings are calculated from sales, the maintenance (variable and fixed) is deducted to get Earnings before interest and taxes (EBIT). After deducting tax, Earnings after taxes (EAT) are the resulting income for one day. After comparing it to the initial investment, one can calculate the total number of days and months needed to break even – in this case, just over 7 months in the realistic scenario.
Figure 20: Pricing proposition for the small package
The same pricing models were created for both the medium and the large packages. Apart from the initial investment, it was assumed that the larger packs would be purchased for longer tracks, so an expected lap time was increased to 4.5 and 6 minutes respectively. For the increased duration of the experience, the prices were also slightly increased, by 10 USD for both products (2 and 5 laps) for the medium package scenario and by 20 USD for the large package.
After taking into account the higher cost of maintenance of larger tracks, the total daily profit (earnings after tax) was 7 529 USD at full capacity and 3 985 USD at 70% for the medium package scenario, which translates to 3.9, or 5.8 months to break even respectively. The larger package had an EAT of 11753 USD and 6420 USD for the respective scenarios, with 2.9 or 5.2 months until break even.
5 laps2 laps
Total time
allocation15.5 min8 min
Price for product $109 $49
Product
Assumptions
Formulas 3
Investment $300 000
One lap time average 2.5
Expenses
Variable (per round) $10
Variable per hour $500
Fixed $3 800
Variable per day $6 000
Tax rate 25%
5 laps2 laps
Full capacity
(optimistic)
70% capacity
(realistic)
5 laps2 laps
Units 1855 1339
Dollars $1 962 $2 695 $1 417 $1 911
Expenses $9 800 $8 090
EBIT $4 171 $1 894
EAT $3 128 $1 421
Days 96 days 212 days
Months 3.2 months 7.1 months
Sale
sFin
ancia
lsBre
ak
even
peri
od
Business Plan eForce FEE Prague Formula Marek Szeles, CTU in Prague
Page 40 of 86
6.5.3. SWOT analysis
Using this analysis, the project’s specific attributes were classified into strengths – such as the uniqueness of the concept; weaknesses – mostly the novelty of the concept, which is yet to be tested; opportunities, such as the direct targeting of an identified market gap; and threats – like the uncertainty of ICO success. The resulting matrix can be seen in figure 21.
Figure 21: SWOT analysis of the proposed eForce Business Plan
Concept yet
to be adopted
Unique concept
Passed 1st round
of investment
Pre-negotiated
contracts
Risks diversified
Market gap targeting
- filling existing
demand
First to combine
racing and gaming
in real life
Market is
possibly volatile
ICO might be
unsuccessful
as market trends
are shifting
Strengths
Exte
rnal
Weaknesses
Opportunities Threats
Helpful
Inte
rnal
Harmful
Business Plan eForce FEE Prague Formula Marek Szeles, CTU in Prague
Page 41 of 86
6.5.4. Risk assessment
Based on the specificities hinted at in the SWOT analysis, several risks were defined, as seen in table 5. Each risk factor was assigned an expected probability of occurrence and the impact the risk occurrence would have on the viability of the business plan. From these two factors, the overall importance was assigned. In case the risk truly does occur, a brief description of a mitigation plan is also included.
Table 5: Risk assessment overview
As it is clear from the analysis, the highest risk factors are connected to the popularity and
profitability of the venture. Thus, much of the funds and attention will go to marketing and
efficient financial management will also be a priority – while bearing in mind the potential
exit strategy if the circumstances get too pessimistic.
Risk
Track owners unable
to sustain themselves
before full product rollout
Social aspect
not attractive
to end customers
Concept is not as profitable
as expected
Technical problems
slow down delivery
and implementation
ICO is not successful
Mitigation
Focus on profitability
since day one
New promo campaign
/abandon strategy
Trigger exit strategy
Lean and agile
organization principles
put in place to
minimize risk
Continue business
without crowdsourcing
Impact
Medium
Medium
High
Medium
Low
Probability
Low
Medium
Low
Low
Medium
Overall
importance
Medium
High
High
Medium
Low
Business Plan eForce FEE Prague Formula Marek Szeles, CTU in Prague
Page 42 of 86
6.5.5. Market analysis
In order to have a sense of the scale the business described in the document can reach, it is crucial to measure the absolute size of the market that includes the proposed business venture. For the eForce Business Plan, two distinct industries are relevant – the market of automotive racing and the market of digital gaming experiences. Since both markets are quite distinct, the methodology to measure them is described in separate chapters. Most information on market sizing was retrieved from the Economist Intelligence Unit (EIU)[40] under a subscription. Compared to the source data from EIU, the structure has been changed as the Western Europe and Eastern Europe data sets were combined to form a data set called Europe representing the whole continent. No data on the market size of Oceania was provided, so it was assumed that its market size was a dynamic share of the overall Asia data set, starting at 7% in 2005 and ending at 5.5% in 2025. For the estimates until 2025 if no data was provided by the Economist Intelligence Unit, the data was extrapolated using the Compound Annual Growth Rate method from the past five periods. If any data was missing and assumptions were made, it is always noted in the relevant subchapter.
Automotive racing/motorsport market
Since the Economist Intelligence Unit only has data for the overall automotive market, it was the starting point for making an assumption on the size of the motorsport market. The data on the overall automotive market can be seen on figure 22. Note that data points for 2017 and before are assumptions and for 2018 onwards are estimates.
Business Plan eForce FEE Prague Formula Marek Szeles, CTU in Prague
Page 43 of 86
The automotive industry is without a doubt one of the largest industries worldwide. Not all of it can be targeted by the eForce concept– eForce can only target the motorsport industry, which is a part of the automotive industry. How to correctly estimate the market size of this industry is an open question due to sparse availability of data. However, after some research, a document by the Motorsport Industry Association[41] was found estimating the motorsport industry of the United Kingdom to be roughly equal to 10% of the country’s automotive industry. Assuming the ratio is the same across Western Europe, we can calculate the rough size of the industry there.
Based on experienced estimation, it was assumed that Eastern Europe had a slightly smaller share of motorsport penetration, assumed at 7%. Combining these two values produced the Europe data set. The 7% ratio was assumed for the Asia, Oceania and Latin America datasets as well. The penetration in Africa was assumed even lower at 5%, while in North America the penetration was assumed to be the highest, at 13%.
The consolidated view on the market sizes can be seen on figure 23.
Business Plan eForce FEE Prague Formula Marek Szeles, CTU in Prague
Page 44 of 86
Digital/gaming market
The data on the market for digital wares and experiences was again provided by the Economist Intelligence Unit – the data visualization as grouped by continents defined before are presented on figure 24. Note again that data points for 2017 and before are assumptions and for 2018 onwards are estimates. In this case, the North American market seems to still be the largest, but can be expected to be surpassed by the Asian market sometime around the year 2025. The European market plays a substantial role likewise, but all other markets are marginalized.
Figure 24: Total digital/gaming market volume
Overall view
If we combine the market sizes from the two previously described target industries – motorsport and digital entertainment, we get an interesting picture, as seen on figure 25. The North American market clearly seems the largest in the targeted areas, followed by Europe and Asia. The Southern hemisphere lags behind in total value, but South America is clearly the best performer there.
Business Plan eForce FEE Prague Formula Marek Szeles, CTU in Prague
Page 45 of 86
During the Formula Student competition, it is important to show a clear, yet compact overall picture of the data collected. Therefore, it has been decided to include volume data on both the automotive racing and gaming markets into one figure, all the while split into data on both industries and continents. An arrow showing the expected compound annual growth rate until 2025 is also included to complement the overall picture. The resulting picture can be seen on figure 26.
Figure 26: Consolidated data on relevant market sizes
In order to further visually enhance the information, a backdrop of the world map is used. On top of each continent, two bubbles were placed, representing the Motorsport and Digital/gaming markets, with their respective bubble areas corresponding to the market size. In order to convey the future market potential, a past 10-year compound annual growth rate was included. From this analysis, it is clear that the markets in the Northern Hemisphere are the most attractive, with Europe being preferred in the Business Plan in the first phase for practical location logistics reasons.
15 965
3 993
20 358
36 5244 467
3 541
North America
Oceania
212 081
60 774
Africa
Europe Asia
250 436
159 468 106 488
South America
297 915
Motorsport market
Digital/gaming market
X% Expected CAGR until 2025
7%
3%
17%
6%
3%
2%
Business Plan eForce FEE Prague Formula Marek Szeles, CTU in Prague
Page 46 of 86
6.5.6. Competition analysis
For a Business Plan to be successful, one must be aware of the competition and be able to distinguish oneself from it. The eForce Business Plan includes a complicated economy where eForce supplies track-owners with formula packages, but the users of the formulas – also called future eForce racers – are end customers being supplied by the eForce experience as a service from the racetrack owners.
Since it is important to have both points of view equally included in the Business Plan, both have to be separately analyzed, as is done in the following subchapters.
Track owner point of view
The racetrack owners are the primary focus of eForce, since they are the direct customers that buy the eForce formula packages. As described in the previous chapters, the two factors that are of the greatest concern to the track owners are firstly, flexibility, meaning if the solution can be staged at any time, independent of time of year, and secondly, how much a considered solution is related to racing.
In this scenario, we can consider several options to compare with the eForce concept. First, we have regular racing. This solution is obviously very racing related, however has proved extremely inflexible and thus not able to sustain running expenses of the track – this is the reason why the track owners are looking for an alternative in the first place. The second option for comparison, is the casino/gambling use of the racetrack, which is very flexible, but not at all related to racing. Lastly, some racetrack owners have tried using the tracks as venues for concerts and cultural events. This is not only usually distant from racing, but it highly depends on the performers, and thus isn’t flexible either.
This analysis of the various solutions can be approximately plotted on a simple matrix, with the two factors representing the horizontal and vertical axes, as seen on figure 27.
Figure 27: Competition analysis matrix for racetrack owners
The eForce concept brings the best combination of being racing related and flexible at the same time, as seen from the analysis above.
Flexibility
Racing related
Business Plan eForce FEE Prague Formula Marek Szeles, CTU in Prague
Page 47 of 86
End customer point of view
To support the previous analysis, it is necessary to find out whether eForce is a good fit for the end customers – racers that would purchase individual rides.
Again, two important factors can be identified. As with almost any consumer, price is very relevant. But it is not the only factor that is considered, as the customers also need to feel their investment is worth it – that they get a reasonably enjoyable experience for their money. Thus, the excitement from the experience is considered, covering parameters like overall speed, the user experience, as well as the overall “coolness” factor.
The most obvious simple alternative to eForce is go-kart racing. As it is priced at approximately 15 USD per 10-minute race[42], it is less expensive than the eForce experience (which starts at around 49 USD). However, it also provides a comparably much less exciting experience. The second comparable option is second/third-grade Formula racing, such as Formula 3000, or vintage Formula Ford[43], which is usually not priced per race, but could be approximated at 90 USD. This makes it more expensive than eForce, while at the same time not providing that much excitement, since it is focused mostly on enthusiasts and lacks general community support. The last competing concept are rides in actual Formula 1 vehicles. While the excitement from such an experience is surely extremely appealing, a price starting around 465 USD[44], but reaching even prices like 6995 USD[45] makes this out of the affordable price range for the majority of customers.
Figure 28: Competition analysis matrix for end customers
Again, as can be seen from the resulting matrix in figure 28, eForce provides the best excitement-to-price ratio compared to the other solutions that were also considered.
Price
Excitement from experience
Business Plan eForce FEE Prague Formula Marek Szeles, CTU in Prague
Page 48 of 86
6.5.7. Marketing strategy
For the promotion of the concept, a simple marketing strategy was also drafted. Extensive promotion will especially be needed for the ICO, with the digital channels being somewhat restricted since Google and other companies passed a ban on similar ads[46]. To complement this, ads will run on TV too, and thematic automobile/entertainment printed magazines, neither of which is regulating ICOs thus far.
Another pillar of the promotional campaign are live events staged at various famous racetracks around the world, which will serve as a proof of concept to both the customers and the racetrack owners. The eForce app will also be supporting every step of the campaign, and will function as a newsletter conveyer among many other things. An overview of all three channels can be seen in figure 29.
Figure 29: Marketing campaign channels
Advertisements Promo events Apps
Both in digital and traditional media- Web- TV- Newspapers
Campaign with a "Revolutionary vibe"
Aimed both at
racetrack owners
and customers
Intended to show
off business
concept, let
customers test
themselves
A set of mobile/VR
games to get people
hyped for the real
formula
Awards the best
players promotions
Business Plan eForce FEE Prague Formula Marek Szeles, CTU in Prague
Page 49 of 86
6.5.8. Rollout strategy
Due to a global launch being costly, the concept rollout is split into three stages: Locally focused, Europe-wide and finally, Global. The first two stages focus on Europe due to the geographic location and great economic climate, which was shown in market analysis. Firstly, the concept is “battle-tested” on selected Central and Western European markets as a beta phase for three months. After that, a secondary spread into the rest of Europe lasting 18 months is planned. If all is successful, the next 5 years are then dedicated for spreading the concept to all other relevant markets before any possible competition copies the idea. For each stage, a set of relevant Key Performance Indicators was defined to measure performance, as seen on figure 30.
Figure 30: Three stages of the rollout strategy
6.5.9. ICO Token distribution strategy
For the ICO, two milestones were set – a minimum capitalization of tokens bought by consumers was set at € 1.5 million, while the maximum capitalization was set at € 10 million. The split of token distribution in each scenario is shown in figure 31. A 70% reach of the maximum capitalization is also used in further calculations and thus included in the figure as a middle scenario.
Figure 31: Token split at the three milestones to be reached in the ICO
Staging multiple events on
various racetracks in Western
and Central Europe to promote
our conceptFirst ~10 Business Agreements
sealed
12 pilot events launched
Production of first
~30 formulas
Expanding to secondary
European markets, creating
a stable foothold for further
company growthCreation of a distribution network
in Europe
~15 stable events
Production increasing
as facilities expand
Gradual expansion to other
target regions, with focus
on North American
and Asian marketsCreation of service centers in new
regions
10 new events every year
Production stabilized at 50
formulas annually
Extensive promotionGaining traction
in Europe
Spreading
to other regions
1 2 3
6 months 18 months 5 years+
Team development
eForce reserve
300 000
(9%)Minimum trading capital
150 000
(5%)
1 500 000
(46%)
Legal
450 000
(14%)
Marketing
Production overhead500 000
(15%)
200 000
(6%)
150 000
(5%)Investors
Investors
2 000 000
(14%)
Team development
1 000 000
(7%)
150 000
(1%)
eForce reserve200 000
(1%)
Legal
Production overhead
500 000
(3%)
Marketing
450 000
(3%)
10 000 000
(70%)
Maximum trading capital
Team development
eForce reserve1 400 000
(13%)
70% trading capital
150 000
(1%)
7 000 000
(67%)
Legal450 000
(4%)
Marketing Production overhead
500 000
(5%)
200 000
(2%)
700 000
(7%)
Investors
Business Plan eForce FEE Prague Formula Marek Szeles, CTU in Prague
Page 50 of 86
6.5.10. Project financial projection
The financial projection is always a sensitive subject, as it is in a way trying to predict the future. Since this is impossible to do precisely, the eForce Business Plan includes three rigid scenarios for the projection. One is optimistic, weighing in a success of the ICO launch, as well as the business. One is realistic, weighing in only the success of the core business. The last one is pessimistic, expecting only the success of the core business with only minimal growth of eForce formula sales. For all scenarios, the development of Net Sales and EBIT were modelled on a yearly basis until 2025, as seen on figures 32 and 33. The spike in 2019 for the optimistic scenario is caused by the ICO success.
Figure 32: Three considered scenarios for eForce business development – Net Sales
Figure 33: Three considered scenarios for eForce business development – EBIT
50
0
20
40
60
80
100
120
140
160
180
2 000
6 000
4 000
8 000
0
7 000
3 000
1 000
10 000
9 000
5 000
5 620
502 912
50
6 144
50
4 5735 097
50
Net Sales
(US$ K)
2018 2022
4 412
9 912
5 307
8 682
2020 2024
7 330
2023 2025
2 662
37
2 6622 662
Production volume
(units)
4 050
6 813
5 056
8 057
2019 2021
7 434
47
5 6226 035
4 623
3 527
6 1906 759
43
Optimistic scenario
Realistic scenario
Pesimistic scenario
Formula production volume
X% CAGR
18%
16%
13%
50
0
50
100
150
200
250
300
350
1 000
9 000
4 000
3 000
5 000
2 000
0
4 696
2 507
3 772
2019 2021
3 250
1 652
962962962
2 641
37
EBIT
(US$ K)
43
20222020
50
5 369
2023
Production volume
(units)
3 342
1 12750
2025
4 417
2024
2 915
4 062
2018
2 927
3 692 3 751
8 042
5 046
3 309
4 324
50 50
2 082
47
2 576
Realistic scenario
Pesimistic scenarioOptimistic scenario
Formula production volume
X% CAGR
28%
24%
21%
Business Plan eForce FEE Prague Formula Marek Szeles, CTU in Prague
Page 51 of 86
6.5.11. Investment proposition
Based on the three scenarios and the funds needed to build basic infrastructure, the investors will be asked to provide an investment of € 950 000. For this, they can expect a 13% share in the company and 10% of the tokens sold in the ICO. As seen on figure 34, this results in the investment reaching a break even within one to four years for the given scenarios.
Figure 34: Absolute and relative returns considering the individual scenarios
Also shown in table 6 are the selected investment performance metrics, split per scenario. In all cases, the project turns out profitable, only the magnitude varies. It is important to note that all metrics were measured for 8 periods – the years 2018 through to 2025. The NPV was calculated with an internal discount rate of 10% considered.
Table 6: Investment performance metrics split by scenario
Business Plan eForce FEE Prague Formula Marek Szeles, CTU in Prague
Page 52 of 86
Investment distribution
One of the logical questions an investor might ask is how the investment is distributed towards reaching the intended goal of setting up a functioning company. The presented split of the investment asked for is seen on figure 35. The largest chunk of the investment will go to new and expanded facilities to enable larger production. Then, labor costs will be the second largest budget part. And thirdly, since risk analysis has shown our vulnerability towards public opinion, a promo campaign will also be funded.
Figure 35: Investment use split
6.5.12. Deep Dive Topics
Since the Deep Dive Topics are being released around one month before the individual competitions, none of the assignments were made public before this work was finished. However, the methodology to create content for them is clear. The main challenge is to somehow connect the Deep Dive Topic with the rest of the prepared presentation. This can usually only be done by slightly changing even the base presentation to steer the story in the direction of the Deep Dive.
This can often prove quite difficult, as the topics tend to be very specific, in the past years they included Aftersales & Guarantee Management; Knowhow Management or Customer Value Proposition Canvas.
The FS Netherlands competition announced that there will be no deep dive topic in their Business Plan discipline[47].
Production to satisfy
increasing demand as
expansion takes place
ICO promotion, focus
on social media and
"entrance activities"
like video games
Facilities to support
our product in
different regions
950 000
New facilities
237 500
30%
285 000
45%
427 500
Total investment
25%
Personal costs Promo campaign
If the ICO base target is
included, this
investment only 29.2%
of total funding
Business Plan eForce FEE Prague Formula Marek Szeles, CTU in Prague
Page 53 of 86
6.6. Supporting materials
In order to aid the Business Plan presentation itself, it is best practice to also provide the judges with additional materials – printed or digital. There are many options to consider preparing as part of the project – however, the team usually does not have the time or capacity to create all of them. In order to assess the best materials to work on, a time spent to effect ratio was conducted, as seen on table 7.
Table 7: Supporting materials options overview
The individual options were compared on three basic factors – practicality, impressiveness and difficulty to make. Practicality indicates the compatibility of the material with the overall concept. The impressiveness indicates the assumed impact on the judges’ scoring if this feature is or is not included – also taking into account how many other teams have included such a feature in the past. The last parameter indicates the difficulty to create the material, based on the time spent creating it on top of the standard business plan. Financial aspect was disregarded, as the possible printing costs would be covered by the eForce team and the digital features only require investment of time. Based on these three scorings, an overall priority was assigned to the making of each feature, as not all features could be created at once in the given time.
Based on this analysis, it was decided to create a custom printed package for the presentation, consisting of a folder, a business card, the printed presentation slides, and a one-page summary handout.
Business Plan eForce FEE Prague Formula Marek Szeles, CTU in Prague
Page 54 of 86
6.6.1. Project logo
Since the services presented in the business plan are more complex than just simple car racing, a decision was made to combine all these services in a singular envelope brand. This decision was made based on industry practices – for example, Google has many services such as Back up & Sync (formerly Google Drive), Gdocs, Gsheets, etc. – but it promotes them under a single envelope brand, GSuite[48].
Similarly, for this project, a single branding was used, with one envelope brand – eForce world. The name and graphic should evoke immediate connection with the original eForce Brand, as well as imply that more services are part of this label. Overall, the word “World” implies that a whole separate economy/society is created – much like the famous brands “World of Warcraft” or “Disney World” suggest – this is also true and part of the intended effect. The resulting logo set can be seen in figure 36.
Figure 36: The complete eForce World logo set
Business Plan eForce FEE Prague Formula Marek Szeles, CTU in Prague
Page 55 of 86
6.6.2. Business Plan Package
While the judges will surely be paying attention to the presentation, they will also be provided a printed package of documents related to the business plan. This package serves several purposes – firstly, the prepared physical materials show that the business plan was well prepared weeks in advance and not finished just before the event took place. This adds a level of professionalism to the business plan.
Secondly, the printouts of the presentation slides provide the judges with the possibility to return to any part of the business plan. And thirdly, since the business plan is a complex work, not all slides can be shown during the presentation proper and are thus included at the end of the presentation – only being shown if there is a question from the judges concerning them, or in the printouts. Thus, printouts provide additional information about the business plan which could not be shown during the presentation because of the time constraint. An example of a whole printed package is seen in figure 37.
Figure 37: Example of a printed-out Business Plan document in a folder, version 2017
The individual components of this printed package are discussed separately in the following subchapters.
Custom folder
All the printed materials are to be contained in eForce-branded folders distributed to each judge separately. The folders are of traditional eForce design, with a white cover featuring the eForce FEE Prague formula logo and an orange-accented inner canvas, which highlights all the documents included within. The folder also includes a dedicated cutout to insert a business card.
Business Plan eForce FEE Prague Formula Marek Szeles, CTU in Prague
Page 56 of 86
Printouts
The core material included in the folder is a bound copy of the Business Plan presentation slides, including the appendix. The slides are arranged in pairs vertically on top of each other on an A4 standard page, which is printed upon from both sides – this is both to save paper and to make it possible to read the slides like a regular book.
Each set of printed presentation slides also includes a printed 1-page Business Logic Case/Business Plan Executive Summary relevant to the particular race.
Business Card
In order to provide the judges a simple way to contact the presenter and the team, a business card is provided in the folder. The design respects the overall concept of the business plan, as well as the general eForce visual identity, as seen in figure 38.
Figure 38: Rendering of the Business Card Visual before printing, avers on the left and revers on the right
Handouts
The handouts are a printed material of the lowest priority, as their impact on the overall perception is relatively low and they are not a required part of the business plan. However, if made, they provide a simple, visual summary of the entire business concept that should be possible to read and comprehend in just tens of seconds.
At the date of this thesis’ hand-in, the handouts were not yet prepared, but are still planned to be finished before the first competition.
Business Plan eForce FEE Prague Formula Marek Szeles, CTU in Prague
Page 57 of 86
6.6.3. Mobile app concept
Thus far, most of the materials were fairly easy to make and therefore commonplace among the competing teams. This is not the case for the last material prepared – a demonstrative eForce application. Combined with a general business plan, developing an app would make little sense as it consumes a great deal of time and effort and the benefits are unclear. However, the eForce Business Plan described in this thesis heavily depends on digital features – a blockchain-based cryptocurrency token and the implementation of augmented reality. It is clear that demonstrating these features on at least a partially functioning mobile application can really enhance the overall impression of the judges.
Use cases
Since the app will serve merely demonstrative purposes and will be used by only a small set of people for short periods of time, focus is made mostly on first-impression user experience improving factors such as graphics, layout and user interfaces, rather than functionality itself.
Thus, the overarching use-case is to open the app, see the main menu and be able to navigate between individual demonstrations of the eForce World concept. For this, four basic use-cases were defined as follows:
UC1: Social engagement feature – see own profile and own results UC2: ICO feature – see the eForce token trading platform interface UC3: Racing feature – see the race selection and booking user flow UC4: Augmented Reality feature – see the eForce AR demonstration
Business Plan eForce FEE Prague Formula Marek Szeles, CTU in Prague
Page 58 of 86
Low-Fidelity prototype
After defining the use-cases, a low-fidelity (lo-fi) prototype was drafted in the modelling software Balsamiq, a student license to which was provided during the Principles of Mobile Applications (B6B39PDA) course in the summer semester of the academic year 2017/2018. In order to allow the user easy navigation, a menu was statically placed on the bottom on the screen, so that all five main items were always visible, as seen on figure 39. The first four menu items directly correspond to use cases UC1 – UC4. The last menu item is a more screen, which offers additional information by offering the user a link to the eForce website.
Figure 39: First four screens as designed in the lo-fi prototype
To cover all the use cases and offer additional information, some more detailed screens were also added. The screen map of the low fidelity prototype can be seen on figure 40.
Figure 40: Screen map of the low-fidelity prototype
From the designed model, a clickable pdf interactive prototype was exported, which can be found in appendix [F].
Onboarding:Splash screen
eForce tokenProfile Races map eForce AR More
Personalresults
eForce AR launcher
eForce website
Buy tokens Sell tokens
Token buyamount
confirmation
Token sellamount
confirmation
Business Plan eForce FEE Prague Formula Marek Szeles, CTU in Prague
Page 59 of 86
Usability testing
Two methods were used for the usability testing of the low-fidelity prototype without users – cognitive walkthrough and heuristic evaluation. For both methods, it is vital to have a prepared use case scenario to be tested. In this case, three scenarios were used: Registering for a race, Trying out the eForce AR and Finding the eForce Token price development chart.
Cognitive walkthrough
Cognitive walkthrough[49] is directly applied to each step of the defined use-case. The scenario is defined by the overlapping question Q0, usually described by the use case itself: Q0: “Will the user try to achieve the right effect?”
Then, the individual steps of the use case scenario are followed. At each step, it is important to answer three questions marked as Q1, Q2 a Q3:
Q1: “Will the user notice that the correct action is available?”
Q2: “Will the user associate the correct action with the effect to be achieved?”
Q3: “If the correct action is performed, will the user see that progress is being made toward the solution of the task?”
Heuristic evaluation
This method of usability testing uses ten heuristic principles as defined by Jakob Nielsen[50]:
1. Visibility of system status 2. Match between system and the real world 3. User control and freedom 4. Consistency and standards 5. Error prevention 6. Recognition rather than recall 7. Flexibility and efficiency of use 8. Aesthetic and minimalist design 9. Help users recognize, diagnose, and recover from errors 10. Help and documentation
At each step, the design is evaluated whether it serves its purpose well according to the heuristics. After going through both methods, issues are awarded priority according to an importance grading system defined in table 8.
Importance Meaning
0 Not a usability issue
1 Cosmetic issue, not necessarily in need of fixing
2 Small usability issue, recommended for fixing (low priority)
3 Significant usability issue in need of fixing (high priority)
4 Critical issue (ShowStopper), which needs to be fixed before application release
Table 8: Usability issue importance grading system
Business Plan eForce FEE Prague Formula Marek Szeles, CTU in Prague
Page 60 of 86
Low fidelity prototype evaluation
First walkthrough scenario – Registering for a race
In this scenario, only one step was needed to get to the Race screen, however cognitive finding S1CWQ2 was made that the user then does not have a clear option to select a specific race on the map. Furthermore, heuristic finding S1HET2 was made that the menu items don’t imply anything real to the user, and heuristic finding S1HET8 found a redundant “back arrow” button in the top left corner of the screen.
Second walkthrough scenario – Trying out the eForce AR
In this scenario no cognitive walkthrough issues were found. However, since the use case ends at displaying the AR view, finding S2HET7 was discovered, dictating that the Change Design and Car Info screens were redundant and confusing. Findings S2HET2 and S2HET8 were also present, corresponding to the previous scenario’s findings.
Third walkthrough scenario – Finding the eForce Token price development chart
As in the previous scenario, no cognitive walkthrough issues were found. Again, the use case for the Business Presentation is simpler than the prototype, so finding S3HET7 was discovered, meaning that the Buy Tokens and Sell Tokens screens were redundant. Findings S3HET2 and S3HET8 were present, corresponding to the previous two scenarios’ findings.
Issue evaluation
After the testing, the findings related to each other were merged and then importance and recommendations were assigned to them, as seen in table 9. The recommendations were implemented in the implemented high-fidelity prototype.
Findings Importance Description Recommendations
S1HET2 S2HET2 S3HET2
2 Missing icons for menu items Add icons representing the individual screens in line with heuristic principles
S1CWQ2 3 Path to seeing event detail and booking screen is not clear
Add a clear button to the bottom of the screen leading
to the next step of the booking of a race
S3HET7 S3HET7
2 Redundant buttons to screens not used in the use case scenarios
Remove the buttons and screens from the next
prototype iteration
S1HET8 S2HET8 S3HET8
1 Redundant back arrow in the
upper left corner Remove the arrow
Table 9: Importance classification and recommendations for individual findings
Business Plan eForce FEE Prague Formula Marek Szeles, CTU in Prague
Page 61 of 86
Implementation
Bearing in mind the purpose of the app, the implemented application is focused on presentation and user flow and is limited in functionality - it could therefore be considered a high-fidelity prototype of sorts.
For the overall implementation, the statically-typed programming language Kotlin[51] developed by JetBrains was used, mainly through the publicly available Android Studio IDE[52]. The Android Platform was used for several practical purposes – mainly because it is currently the most widely used mobile operating system, but also the only devices available for artifact deployment and testing were running on Android – The first being Samsung Galaxy A3 (2016 model, running Android 7.0/Kernel 3.10.61-12219145, display 540x960px), the second being Samsung J5 (2017 model, running Android 7.0/Kernel 3.18.14-12779141, display 720x1280px). For clarity, the development was broken down into several stages, each described in a following subchapter.
Android shell
The Android studio used has two modes of operation – Design mode and Text mode, as seen on figure 41. For most of the UI development, the Design mode was used, through the flexible ConstraintLayout view group, which makes it possible to define one UI layout which works on many different resolutions. The functionality was mostly built using Kotlin implementations in Text mode.
Figure 41: Android Studio Text (left side) and Design (right side) GUIs
Business Plan eForce FEE Prague Formula Marek Szeles, CTU in Prague
Page 62 of 86
The output of this implementation is a high-fidelity prototype created within the Google Material Design guidelines. The screen map hierarchy of the resulting application can be seen on figure 42. Note that screens with dotted outline are external from the base eForce application – namely, this concerns the eForce AR experience, which is a separate application and the redirection to the eForce website, which launches the internal web browser of the device. Screenshots of the finished application can be found in appendix [G].
Figure 42: Screen map of the eForce application high-fidelity prototype
AR extension
The extension enabling the user augmented reality vision through the phone’s camera lens is mostly enabled by the Vuforia AR platform[53], using mainly its add-in extension into Android Studio. The choice of AR platform was heavily influenced by an impressive demonstration of an AR formula solution by an Israeli startup called Griiip[54], during a presentation at the Future Port 2017[55] convention in early September 2017.
The Vuforia platform allows the developer to implement several augmented reality effects and solutions, such as projecting 3D models on various physical 3D and 2D targets, implementation into AR hardware, such as Microsoft’s Hololens, procedural generation of 3D landscape, and several more. These were not utilized in this thesis mostly for budget reasons.
For the purposes of the eForce Business Plan Demo Application, only the option to project objects onto a pre-defined target was used.
Onboarding:Splash screen
eForce token Races map eForce AR MoreProfile
Personalresults
Eventdescription
eForce AR launcher
eForce website
Business Plan eForce FEE Prague Formula Marek Szeles, CTU in Prague
Page 63 of 86
Target selection
After registering for a developer license at the Vuforia developer portal, there are multiple possibilities the developer can decide to utilize as physical targets which will be tracked and onto which the digital content will be projected. The options include: a static flat image, a VuMark, a cuboid, a cylinder or a 3D object, the choices can be seen on figure 43.
Figure 43: Various target options
The static image can be any image uploaded by the developer, or chosen from the Vuforia provided library. Not every image is well suited for targeting, however. In order for the computer vision to work reliably, the image has to have many points of recognition, which means that the image has to have many granular areas of rapidly changing brightness levels – and thus, a high contrast[56]. Fortunately, Vuforia provides a useful tool for the developer to analyze the usability score of their preferred image – it is possible to upload it onto the Vuforia developer portal and the image will be automatically evaluated and assigned a score, as seen on figure 44.
Figure 44: Uploaded image target scoring example
Business Plan eForce FEE Prague Formula Marek Szeles, CTU in Prague
Page 64 of 86
The VuMark implementation is similar to the previous option – it is essentially a static image and thus seems like a subset of the previous choice. This is only partially correct. While the VuMark seems like a really simple flat image, it is specifically designed for easy optical recognition by the AR-simulating machine. It also has a second great advantage over standard static images – the VuMark serves as a generator of several instances of itself – and thus, the VuMark template can be utilized to encode an identification code (ID) readable by the machine, which can then display different 3D virtual models based on the ID detected. If one would like to show different models using plain static images, the images would have to be vastly different to prevent confusion of the AR software. The parts of information encoding the object ID in the VuMark can be graphically incorporated into the custom VuMark design, as seen on VuMark examples on figure 45.
Figure 45: VuMark instance examples[57]
Using a 3D object, cuboid or a cylinder as a target is the most complicated as one has to define a real-life object to be tracked and recognized. Because of the impracticality of this design compared to the intent of the application, these options were not considered.
For the implementation of the eForce demo application, the VuMark option was selected, largely because of the possibility of a custom design and because of a comparatively simpler generation of different targets for multiple 3D models.
Business Plan eForce FEE Prague Formula Marek Szeles, CTU in Prague
Page 65 of 86
VuMark creation
The VuMark template itself was created using an Adobe Illustrator template, which was provided by Vuforia for download, along with a creation manual[58]. The template is essentially a set of scripts for import into Adobe Illustrator one can use to validate the draft design and then export it for use in the Vuforia platform itself.
Figure 46: Components of the VuMark design
As seen on figure 46, during the creation, the designer has to create the individual VuMark components:
Contour – the background space that the Vuforia algorithm first detects Border – the outermost boundary of the VuMark Clearspace – a mandatory clear area Code/elements – where the id is encoded Design area – a design-restricted space used only for tracking and not VuMark
detection.
The individual components can be classified into three categories according to function – those that are mostly ignored by the computer vision algorithm, like the design area, those that contribute to ID encryption, like the code/elements component and those that contribute to the tracking itself, like the contour, border and clearspace components.
Business Plan eForce FEE Prague Formula Marek Szeles, CTU in Prague
Page 66 of 86
The eForce VuMark was created according to the VuMark creation guide published by Vuforia and can be seen on figure 47 along with a generated instance of itself. Note the highlighted elements on the template not appearing in the generated instances – the code/elements around the central “E” are highlighted with circles and the contour is highlighted in pink on the perimeter. The design has 56 code elements to allow the encoding of 4 letter IDs in the instances.
Figure 47: On the left is the finished eForce VuMark template. On the right is a generated eForce VuMark instance containing the string “test” encoded within
One of the recommendations for VuMark creation is to use a contour shape that is not rotationally symmetrical – this was achieved by taking advantage of the slanted nature of the eForce logo. The right side of the contour is slanted, while the left side is perpendicular to the base. Some further adjustments were made to the contour and border in order to make it more visually appealing.
The VuMark went through several iterations of adjusting before reaching its final design. An interesting takeaway from the creation of the VuMark is the effect of contrast – the first design was mainly dark orange for aesthetic reasons, which fulfilled the minimum 40% contrast requirement. However, VuMark recognition was very slow and ineffective on this version, so the border and code/elements were changed to black, which improved the recognition and tracking greatly. It also allowed for printing of the VuMark on black and white printers, since the only remaining colorful elements are ignored by the tracking algorithm.
Business Plan eForce FEE Prague Formula Marek Szeles, CTU in Prague
Page 67 of 86
Model import
The model used for import to the application was provided by the aerodynamics group of the eForce team and can be seen on figure 48. In order to be used in the AR application, the model had to be simplified and “hollowed out” by removing all the internal parts of machinery not vital for rendering of the formula shell.
Figure 48: Model of the eForce FSE.07 formula used for import as rendered in Autodesk Showcase[59]
The simplification of the model took it from over 2GB in size to just over 11MB, representing a 99.5% reduction in data volume and from 11.5 million vectors making up 19.1 million faces to 216 vectors with 169 faces, a 98% and 99% reduction respectively. This was achieved through multiple iterations of applying the Blender’s decimate modifier[60], and Adobe Meshmixer reduce tool[61]. A comparison of the two models on a top-down view can be seen on figure 49. Note that the apparent largest loss is visible on the rear wing. Further comparisons can be found in appendix [H].
Figure 49: Quality comparison between the original model, as shown in Dassault Systems Catia[62], compared to the compressed model used in the AR application
Business Plan eForce FEE Prague Formula Marek Szeles, CTU in Prague
Page 68 of 86
Integration into shell
Since the Augmented Reality application is rather large, it was decided to keep it separate from the core eForce application. However, this does not prevent seamless user experience between the two. It is assumed that the users will start in the base eForce app and then transfer to eForce AR, as this is the use case scenario that will be used during the presentation at the competitions.
7. Business Plan Presentation
The final stage of the business plan creation is to convert all the analyses mentioned prior into a unified presentation to be shown to the jury during the races. The output needs to not only stand out and be visually appealing, but has to first and foremost convey the intended message and information from the analyses in the most direct way possible.
7.1. Overall concept
The aim of the presentation is first and foremost to be structured. In order to enable this, an agenda is featured throughout the presentation, outlining the structure, as well as serving as the contents overview in the printed version of the Business Plan. The proposed agenda slide can be seen on figure 50. To further enhance the visual appeal and clarity, each chapter has a pictogram/icon associated in the list. This icon also appears in the upper left corner of all slides relevant to the topic, thus simplifying navigation.
Figure 50: The prepared presentation structure. Note the placeholder chapter for the Deep Dive topic
AgendaIntroduction 1´
Our concept 3´
Market Analysis 2´
Deep Dive 2'
Financial forecast 2´
Appendix – Unused slides
Business Plan eForce FEE Prague Formula Marek Szeles, CTU in Prague
Page 69 of 86
7.2. Alterations for individual races
The Business Plan presentation will not be fully consistent between the individual races as a slightly distinct version will be created for each race. This is due to several reasons.
Firstly, each race releases a Deep Dive topic around two weeks before the event date. This is around 2-5 minutes of mandatory content that has to be presented and is specific in topic to each race. Due to this extra content, some general content of the original presentation might also be moved to the appendix.
Secondly, at every competition, feedback by the juries is provided after the presentation. This allows for quick learning from past mistakes and making focused improvements on the Business Plan content and/or structure based on this feedback before each subsequent race.
The third factor is the most debatable – cultural preference. The races take place in different countries and the jury is always mostly sourced from the particular country pool of experts. Even though the official rules for content are almost identical for all races, one can see a trend in the winning solutions for individual countries, which is likely based on cultural preference. For example, based on eForce experience, it seems that in Hungary, the judges are mostly focused on the presentation skills and quality of the visuals. In Italy, the originality of the idea and innovation seems to have a big impact. And in Germany and Austria, the realistic assumptions of the business plan reign supreme.
Due to the nature of the individual versions – which will be created in the future just before the competitions themselves – these individual altered versions of the business plan cannot be attached at this point.
Business Plan eForce FEE Prague Formula Marek Szeles, CTU in Prague
Page 70 of 86
7.3. Output quality evaluation
In order to evaluate the quality of the eForce Business Plan and its presentation, it was planned to stage a mock presentation in front of a jury consisting of experts in the field of the automotive industry and its economic aspects. In order to do this, eForce has contacted the Czech division of the German international automotive parts company Continental AG, based in Otrokovice near Prague[63], which has been a partner and financial sponsor of the eForce team for several years[64]. Unfortunately, although both eForce and Continental were eager to schedule the event, in the end it was not possible to arrange a date in May that would suit both parties.
As an alternative, it was decided that the eForce Business Plan would enter a suitable competition taking place in April or May. This competition turned out to be the “Present around the World”[65] competition organized by the Institution of Engineering and Technology. The Czech regional event was conveniently scheduled to take place on April 26th, 2018[66] from 14:00 and the rules and concept[67] of the competition perfectly fitted the format of the Business Plan and connected supporting materials, such as the eForce application and Augmented Reality concept.
The assignment was to present any technical topic in an engaging ten-minute presentation in English and later face questions from the jury. The jury consisted of the last year’s winner of the Czech competition round, and representatives from various institutions, such as the University of Life Sciences in Prague, Czech Technical University, Faculty of Electrical Engineering, Czech Academy of Sciences, the Institution of Engineering and Technology and a business representative from the United Kingdom, whose task was also to evaluate the English skills of the presenter.
Even though the competition was attended by several aspiring students presenting interesting, contemporary and advanced topics about Science, Engineering or Technology and its applications, in the end, the jury chose to support the eForce business plan as the winning presentation, landing the eForce team a pleasant £150 prize, as well as the opportunity to participate in the next round of the competition, a semi-final for the Europe, Middle East and Africa (EMEA) region, held in the Summer in Kazakhstan.
Independent of this event, a second round of mock presentations was scheduled to happen with the abovementioned traditional partner of eForce, Continental AG in late June, by which time the Deep Dive for FS Netherlands should also be assigned and incorporated.
Business Plan eForce FEE Prague Formula Marek Szeles, CTU in Prague
Page 71 of 86
8. Summary
The main goal of this thesis was to create a well-prepared Business Plan for the eForce FEE Prague Formula team to use at the Formula Student competition. This goal was certainly fulfilled in its entirety.
First of all, the theoretical part of the thesis described the competition and the eForce team, and later focused on eForce’s past performance, speculating about the possible causes for previous successes and failures. After discussion with a representative from one of the best ranking teams, the priorities for the Business Plan creation were identified as the impressiveness of the concept and its background in-depth feasibility analysis. The theoretical part is completed by a description of different methodologies used later in the Business Plan creation process.
Stemming from the key takeaways from the theoretical part, the practical part of the thesis described the creation of the Business Plan materials. After preparing the available materials and assessing the limitations for the Business Plan, the business concept was defined, innovating on three fronts at once: focusing on solving racetrack owners’ problems in the business innovation, leveraging blockchain technology in the financial innovation and expanding the racing experience using augmented reality in the formula racing innovation.
Building on this are preliminary outputs – one-page summaries of the business concept – already sent to the individual events that eForce will partake in this year, as well as the detailed description of the eForce Business Plan. The Plan itself includes many aspects, including pricing, feasibility analyses, marketing strategy and description of the technical solutions. At the end, a proposition for the fictitious investors is made, including a calculation for their expected returns on investment.
After the Business Plan was completed, it was expanded upon by supporting materials for the presentation, including physical perks, such as a package of printed materials, and a set of digital assets, including a set of logos and two mobile applications, one of which uses augmented reality technology.
Once all outputs were prepared, the thesis described the transformation of all materials into one presentation which will be taken as an output to the Formula Student competition.
At the very end, the Business Plan presentation was successfully validated at an international competition and already managed to attain an award even before this thesis was completed.
The next steps for this thesis’ output are clear. The Business Plan presentation is yet to be completed by the Deep Dive sections for the individual races, the topics for which are to be released around two weeks before the corresponding event starts. Further, the augmented reality part of the application can be well expanded upon by re-texturing the model to not only present a single-colored material. The augmented reality experience is also ready to include various different 3D models for the future thanks to the implementation of a custom VuMark solution.
Business Plan eForce FEE Prague Formula Marek Szeles, CTU in Prague
Page 72 of 86
9. Registry
9.1. Abbreviations
Abbreviation Expanded Meaning
FS/FSAE Formula Student Engineering competition for students, see chapter 2
EDR Engineering Design
Report A static discipline in the Formula Student competition, see chapter 2.5.2.1
CR Cost Report A static discipline in the Formula Student competition, see chapter 2.5.2.2
BP Business Plan A static discipline in the Formula Student competition, see chapter 2.5.2.3
ACC Acceleration A dynamic discipline in the Formula Student competition, see chapter 2.5.3.1
SP Skid Pad A dynamic discipline in the Formula Student competition, see chapter 2.5.3.2
AX Autocross A dynamic discipline in the Formula Student competition, see chapter 2.5.3.3
END Endurance A dynamic discipline in the Formula Student competition, see chapter 2.5.3.4
EFF Fuel Efficiency A dynamic discipline in the Formula Student competition, see chapter 2.5.3.5
WRL World Ranking List Official ranking for Formula Student teams, see chapter 2.3.2
BLC Business Logic Case A preliminary BP overview document submitted to some races
BPES Business Plan
Executive Summary A preliminary BP overview document submitted to some races
ICO Initial Coin Offering A means by which funds are raised for a new blockchain-based venture[68]
EIU Economist
Intelligence Unit Information service part of The Economist magazine
EBIT Earnings Before Interest and Tax
Accounting term describing net profits before tax
EAT Earnings after Tax Accounting term describing net profits after tax
IDE Integrated
Development Environment
Usually a desktop application with which applications are built through source code editing
GUI Graphical User
Interface Graphical representation of a program the user is working with
CTU Czech Technical
University A technical university in Prague, Czech Republic, where this thesis was written.
FEE Faculty of Electrical
Engineering An electrical faculty of CTU, where this thesis was written.
AR Augmented Reality Technology allowing the user to see virtual elements layered on top of traditional reality
EMEA Europe, Middle
East, Africa A geographic region
Business Plan eForce FEE Prague Formula Marek Szeles, CTU in Prague
Page 73 of 86
9.2. Figures
Identifier Page Description
Figure 1 9 A typical season stages diagram for eForce
Figure 2 10 Points distribution between the individual disciplines
Figure 3 13 Brief summary of eForce history
Figure 4 14 High-level team organization chart
Figure 5 17 The presentation deck samples for the past three seasons
Figure 6 20 SWOT analysis matrix template
Figure 7 23 OwnCloud distribution model at eForce
Figure 8 24 Comparison of eForce OwnCloud high level structure before and after the reorganization
Figure 9 27 Relationship of production volumes to vehicle manufacturing cost
Figure 10 28 The relationship of retail formula price compared to maximum volume sold, as specified by the Institution of Mechanical Engineers 2018 Business Logic Case template
Figure 11 29 Split of time occupation of an average small- to medium-sized racetrack
Figure 12 30 Total market capitalization of cryptocurrencies from January 2017 to May 2018
Figure 13 31 Overview of the Jan 2017 - May 2018 ICO market environment in terms of funds raised and number of ICOs completed
Figure 14 32 High-level scheme of the eForce token ecosystem
Figure 15 33 Racing concept visualization – view from racing helmet with Augmented Reality elements
Figure 16 34 Overview of sensors needed to be installed on each vehicle, track and helmet in order to realize the concept
Figure 18 37 Overview of stakeholders’ interests in the concept
Figure 19 38 Package prices offered by eForce to the racetrack owners
Figure 20 39 Pricing proposition for the small package
Figure 21 40 SWOT analysis of the proposed eForce Business Plan
Figure 22 42 Total automotive market volume
Figure 23 43 Total motorsport market volume
Figure 24 44 Total digital/gaming market volume
Figure 25 44 Total targeted market size overview
Figure 26 45 Consolidated data on relevant market sizes
Figure 27 46 Competition analysis matrix for racetrack owners
Figure 28 47 Competition analysis matrix for end customers
Business Plan eForce FEE Prague Formula Marek Szeles, CTU in Prague
Page 74 of 86
Identifier Page Description
Figure 29 48 Marketing campaign channels
Figure 30 49 Three stages of the rollout strategy
Figure 31 49 Token split at the three milestones to be reached in the ICO
Figure 32 50 Three considered scenarios for eForce business development – Net Sales
Figure 33 50 Three considered scenarios for eForce business development – EBIT
Figure 34 51 Absolute and relative returns considering the individual scenarios
Figure 35 52 Investment use split
Figure 36 54 The complete eForce World logo set
Figure 37 55 Example of a printed-out Business Plan document in a folder, version 2017
Figure 38 56 Rendering of the Business Card Visual before printing, avers on the left and revers on the right
Figure 39 58 First four screens as designed in the lo-fi prototype
Figure 40 58 Screen map of the low-fidelity prototype
Figure 41 61 Android Studio Text (left side) and Design (right side) GUIs
Figure 42 62 Screen map of the eForce application high-fidelity prototype
Figure 43 63 Various target options
Figure 44 63 Uploaded image target scoring example
Figure 45 64 VuMark instance examples
Figure 46 65 Components of the VuMark design
Figure 47 66 On the left is the finished eForce VuMark template. On the right is a generated eForce VuMark instance containing the string “test” encoded within
Figure 48 67 Model of the eForce FSE.07 formula used for import as rendered in Autodesk Showcase
Figure 49 67 Quality comparison between the original model, as shown in Dassault Systems Catia, compared to the compressed model used in the AR application
Figure 50 68 The prepared presentation structure. Note the placeholder chapter for the Deep Dive topic
Business Plan eForce FEE Prague Formula Marek Szeles, CTU in Prague
Page 75 of 86
9.3. Tables
Identifier Page Description
Table 1 8 Past six events of eForce as of January 6th 2018
Table 2 14 eForce race result history overview
Table 3 16 eForce Business Plan result overview for the past three seasons
Table 4 26 Breakdown of the eForce formula material costs in prototype production
Table 5 41 Risk assessment overview
Table 6 51 Investment performance metrics split by scenario
Table 7 53 Supporting materials options overview
Table 8 59 Usability issue importance grading system
Table 9 60 Importance classification and recommendations for individual findings
Business Plan eForce FEE Prague Formula Marek Szeles, CTU in Prague
The presentation template is attached in a separate potx file, named “Appendix[A]-eForce_template_v2.potx”.
Appendix [B] – Business Logic Case for Formula Student United Kingdom
The Business Logic Case document for Formula Student United Kingdom is attached in a separate pdf file, named “Appendix[B]-fsUK-BLC-2018-eForce-CTU.pdf”.
Appendix [C] – Business Plan Executive Summary for FS East
The Business Plan Executive Summary document for Formula Student United Kingdom is attached in a separate pdf file, named “Appendix[C]-fsEast-BPES-2018-eForce-CTU”.
Appendix [D] – Business Plan Executive Summary for FS Netherlands
The Business Plan Executive Summary document for Formula Student United Kingdom is attached in a separate pdf file, named “Appendix[D]-fsNL-BPES-2018-eForce-CTU”.
Appendix [E] – Business Plan Executive Summary for FS Czech
The Business Plan Executive Summary document for Formula Student United Kingdom is attached in a separate pdf file, named “Appendix[E]-fsCZ-BPES-2018-eForce-CTU.pdf”.
Appendix [F] – Interactive low-fidelity prototype
The low-fidelity prototype created in Balsamiq is attached in a separate pdf file, named “Appendix[F]-eForce-app-lofi.pdf”.
Business Plan eForce FEE Prague Formula Marek Szeles, CTU in Prague
Page 77 of 86
Appendix [G] – Screenshots of the applications
Base application (eForce App)
Figure G1:Splash screen, profile, leaderboards and token evaluation screens
Figure G2: Race map, race detail, eForce AR launcher and web redirection screens
Business Plan eForce FEE Prague Formula Marek Szeles, CTU in Prague
Page 78 of 86
Augmented Reality viewer (eForce AR)
Figure G3: From splash screen to a projected eForce AR formula
Figure G4: The VuMark provides accurate tracking even when held in hand and bent
Figure G5: Front view of the formula, a laptop and a glass are placed for scale reference
Business Plan eForce FEE Prague Formula Marek Szeles, CTU in Prague
Page 79 of 86
Appendix [H] – Formula models comparison
On the left side is the source model as displayed in Dassault Systems Catia, on the right side the final model used in the AR application is shown.
Figure H1: Front view comparison
Figure H2: Right side view comparison
Figure H3: Steering wheel and connected electronics comparison
Business Plan eForce FEE Prague Formula Marek Szeles, CTU in Prague
Page 80 of 86
Figure H4: Rear wing comparison
Figure H5: Rear wheel comparison
Appendix [I] – Source code of the applications
Base application (eForce App) The eForce App source code is attached in a compressed Android Studio project in a separate zip file, named “Appendix[I]-eForce_App_src.zip”.
Augmented Reality viewer (eForce AR) Due to its size, the eForce AR source code had to be split into multiple archives for upload into KOS with this thesis, and it can only be retrieved by extracting the following files:
Appendix [J] – The eForce Business Plan core presentation
The Business Plan presentation is attached in a separate pdf file, named “Appendix[J]-eForce_BP28.pdf”.
Business Plan eForce FEE Prague Formula Marek Szeles, CTU in Prague
Page 81 of 86
11. Literature and other sources used
[1] SAE [online]. Society of Automotive Engineers, 2017 (Retrieved October 24th, 2017 from: http://www.sae.org/ )
[2] FSAE History [online]. Society of Automotive Engineers, 2017 (Retrieved November 10th, 2017 from: https://www.fsaeonline.com/page.aspx?pageid=c4c5195a-60c0-46aa-acbf-958ef545b72)
[3] FSAE official rules [online]. Society of Automotive Engineers, 2017 (Retrieved November 15th, 2017 from: https://www.fsaeonline.com/content/2017-18%20FSAE%20Rules%209.2.16a.pdf)
[4] Formula Student World Ranking [online]. Mazur Events, 2017 (Retrieved November 11th, 2017 from: https://mazur-events.de/fs-world/)
[5] Formula Student World Ranking Combustion [online]. Mazur Events, 2017 (Retrieved November 11th, 2017 https://mazur-events.de/fs-world/C
[6] Formula Student World Ranking Electric [online]. Mazur Events, 2017 (Retrieved November 11th, 2017 https://mazur-events.de/fs-world/E
[7] FS Czech Republic [online]. Formula Student Czech, 2017 (Retrieved November 30th, 2017 from: https://www.fsczech.cz/)
[8] FS East [online]. Formula Student East, 2017 (Retrieved November 30th, 2017 from: http://fseast.eu/ )
[9] FS Italy [online]. ATA - Associazione Tecnica dell'Automobile, 2017 (Retrieved November 30th, 2017 from: http://www.ata.it/content/formula-ata/ )
[10] FS Hungary [online]. Formula Student Hungary, 2017 (Retrieved November 30th, 2017 from: http://fshungary.hu/ )
[11] FS Austria [online]. Formula Student Austria, 2017 (Retrieved November 30th, 2017 from: http://www.fsaustria.at/ )
[13] FS SAE Lincoln [online]. Society of Automotive Engineers, 2017 (Retrieved November 30th, 2017 from: http://students.sae.org/cds/formulaseries/west/ )
[14] FS North [online]. Formula Student North, 2017 (Retrieved November 30th, 2017 from: https://formulanorth.com/ )
Business Plan eForce FEE Prague Formula Marek Szeles, CTU in Prague
Page 82 of 86
[15] T. Záruba, [online]. Bussines plán technologického projektu Formule student na ČVUT (Available in Czech) (Retrieved November 25th from: https://dspace.cvut.cz/bitstream/handle/10467/61457/F3-BP-2015-Zaruba-Tomas-bp2.pdf )
[16] History of Formula Student [online]. Institution of Mechanical Engineers, 2017 (Retrieved November 20th, 2017 from: https://www.imeche.org/events/formula-student/about-formula-student/history-of-formula-student )
[17] Formula Student Team Delft Contact Page [online]. FS Team Delft, 2017 (Retrieved November 20th, 2017 from: https://www.fsteamdelft.nl/contact )
[18] Formula Student Germany Youtube channel [online]. Youtube, 2017 (Retrived November 22nd, 2017 from: https://www.youtube.com/channel/UCwS29Q7eFXFwjl6lv2jhl5A )
[19] E. S. Siegel, B. R. Ford, J. M. Bornstein (1993), The Ernst & Young Business Plan Guide (New York: John Wiley and Sons) ISBN 0-471-57826-6
[20] A. Humphrey, SWOT Analysis for Management Consulting. SRI Alumni Newsletter. SRI International (December 2005): pages 7-8
[21] SRA glossary [online]. Society for Risk Analysis, 2015 (Retrieved January 2nd, 2018 from: http://www.sra.org/sites/default/files/pdf/SRA_glossary_20150622.pdf )
[22] Investopedia Glossary: Cashflow [online]. Investopedia, 2018 (Retrieved on April 14th , 2018 from: https://www.investopedia.com/terms/c/cashflow.asp )
[23] J.Berk; P. DeMarzo; D. Stangeland (2015). Corporate Finance (3rd Canadian ed.). Toronto: Pearson Canada. p. 64. ISBN 978-0133552683.
[24] Farris, Paul W.; Neil T. Bendle; Phillip E. Pfeifer; David J. Reibstein (2010). Marketing Metrics: The Definitive Guide to Measuring Marketing Performance. Upper Saddle River, New Jersey: Pearson Education, Inc. ISBN 0137058292.
[25]Investopedia Glossary: Annualized Rate [online]. Investopedia, 2018 (Retrieved on April 14th , 2018 from: https://www.investopedia.com/terms/a/annualized-rate.asp )
[26] M. J. P. Anson; F. J. Fabozzi; F. J. Jones (3 December 2010). The Handbook of Traditional and Alternative Investment Vehicles: Investment Characteristics and Strategies. John Wiley & Sons. pp. 489–. ISBN 978-1-118-00869-0.
[27] Presentation software comparison [online]. Business Tuts Plus, 2016 (Retrieved January 1st, 2018 from: https://business.tutsplus.com/articles/powerpoint-vs-keynote-vs-google-slides-what-is-the-best-presentation-software--cms-26831 )
Business Plan eForce FEE Prague Formula Marek Szeles, CTU in Prague
Page 83 of 86
[28] Bebas Neue [online]. TypeKit / Ryoichi Tsunekawa, 2018 (Retrieved January 1st, 2018 from: https://typekit.com/fonts/bebas-neue )
[29] Trebuchet MS [online]. Microsoft, 2001 (Retrieved January 1st, 2018 from: https://www.microsoft.com/typography/ fonts/family.aspx?FID=2 )
[30] Carbone Smolan, Boston Consulting Group: Transforming a brand. Doubling engagement [online]. Carbone Smolan Agency, 2017 (Retrieved February 22nd, 2018 from: https://www.carbonesmolan.com/work/boston-consulting-group.html)
[31] IMECHE BLC Template [online]. Institution of Mechanical Engineers, 2018 (Retrieved May 17th, 2018 from: http://www.imeche.org/events/formula-student/team-information/forms-and-documents)
[32] FS East Static Event Rules [online], FS EAST 2018 (Retrieved May 24th 2018 from: https://fseast.eu/wp-content/uploads/2018/05/FS_East_2018_Static_rules_A4_v1-1_NET.pdf )
[33]Lost Speedways Project: Documenting disappearing automotive racetracks [online]. Matthew Dillner, 2018 (Retrieved on May 22nd, 2018 from: http://www.lostspeedways.com/about.html )
[34] Initial Public Offering (IPO) definition [online]. NASDAQ, 2018 (Retrieved March 27th, 2018 from: https://www.nasdaq.com/investing/glossary/i/initial-public-offering )
[35]A. Kosba, A. Miller, E. Shi, Z. Wen and C. Papamanthou, Hawk: The Blockchain Model of Cryptography and Privacy-Preserving Smart Contracts, 2016 IEEE Symposium on Security and Privacy (SP) [online], San Jose, CA, 2016, pp. 839-858. (Retrieved April 2nd, 2018 from: http://ieeexplore.ieee.org/stamp/stamp.jsp?tp= &arnumber=7546538&isnumber=7546461)
[36] Cryptocurrencies Total Market Capitalization [online]. Coin Market Cap, 2018 (Retrieved May 20th 2018 from: https://coinmarketcap.com/charts/ )
Business Plan eForce FEE Prague Formula Marek Szeles, CTU in Prague
Page 84 of 86
[40] The Economist Intelligence Unit [online]. The Economist, 2018 (Retrieved February 10th 2018 from: https://www.eiu.com/home.aspx )
[41] Highlights from the 2013 Review of UK's Motorsport Valley Business Cluster [online], Motorsport Industry Association United Kingdom, 2013 (Retrieved March 13th, 2018 from: https://www.the-mia.com/assets/Highlights_from_Review_of_Motorsport_Valley_2013.pdf )
[42] Leihkart Preise [online] (Available in German). Kartshop Ampfing, 2018. Converted from 13 EUR using the trading middle rate on May 18th 2018 (Retrieved on May 18th, 2018 from: http://www.kartshop-ampfing.de/leihkart---event/preise.html )
[43]Virtually Affordable Racing [online]. Road and Track, 2012 (Retrieved on May 18th, 2018 from: https://www.roadandtrack.com/motorsports/news/a18412/virtually-affordable-racing/)
[44] Formula Racing Starter [online]. Nuerburgring, 2018. Converted from 396 EUR using the trading middle rate on May 18th 2018 (Retrieved on May 18th, 2018 from: http://www.nuerburgring.de/en/drives-fun/drives/formula-trainings/formula-racing-starter.html)
[45] Drive and Ride a Formula 1 Racecar [online]. Club Sportiva, 2018 Includes other services. (Retrieved on May 18th, 2018 from: https://www.clubsportiva.com/experiences/drive-and-ride-in-a-formula-1-racecar )
[46] Google Blog: An advertising ecosystem that works for everyone [online]. Google, 2018 (Retrieved March 23rd, 2018 from: https://www.blog.google/topics/ads/advertising-ecosystem-works-everyone/)
[47] FS Netherlands Competition Handbook [online] Formula Student Netherlands, 2018 (Retrieved May 24th 2018 from: http://formula-student.nl/wp-content/uploads/Competition-Handbook-2018-V1.3.pdf )
[48]G Suite [online]. Google, 2018 (Retrieved March 26th, 2018 from: https://gsuite.google.com/ )
[49] C. Wharton, J. Rieman, C. Lewis and P. Polson. The Cognitive Walkthrough Method: A Practicioner’s Guide. [online] University of Colorado and Boulder, Department of Computer Science and Institute of Cognitive Science, 1994 (Retrieved April 28th, 2018 from: https://www.colorado.edu/ics/sites/default/files/attached-files/93-07.pdf )
[50] J. Nielsen, and R. Molich. Heuristic evaluation of user interfaces. In: Proceedings of the
SIGCHI conference on Human factors in computing systems. 1990. 249–256.
[55] Future Port Festival 2017 [online]. Etnetera Group, 2017 (Retrieved April 8th, 2018 from: https://www.futureportprague.cz/fpp-2017/ )
[56] T. Mahalingam, M. Subramoniam, A robust single and multiple moving object detection, tracking and classification, Applied Computing and Informatics, 2018 [online] (Retrieved April 18th, 2018 from: https://www.sciencedirect.com/science/article/pii/S221083271730217X)
[62] Catia Product Overview: shape the world we live in. Dassault Systèmes, 2018 (Retrieved April 27th, 2018 from: https://www.3ds.com/products-services/catia/ )
[63] Continental AG Czech Republic Overview [online]. Continental AG, 2018 (Retrieved May 13th, 2018 from: https://www.continental-corporation.com/cs-cz/spolecnost/prehled )
Business Plan eForce FEE Prague Formula Marek Szeles, CTU in Prague
Page 86 of 86
[64] eForce FEE Prague Formula Official Website: Partners [online]. eForce FEE Prague Formula, 2018 (Retrieved May 13th, 2018 from: https://eforce.cvut.cz/partneri/)
[65] IET Present Around the World competition [online]. The Institution of Engineering and Technology, 2018 (Retrieved May 13th, 2018 from: https://conferences.theiet.org/patw/ )
[66] IET Present Around the World Czech Regional Round [online] (Available in Czech). The Institution of Engineering and Technology, 2018 (Retrieved May 13th, 2018 from: http://www.theiet.cz/?lang=cs&menu=event&submenu=180426)
[67]IET Present Around the World Czech Regional Round Leaflet [online] (Available in Czech). The Institution of Engineering and Technology, 2018 (Retrieved May 13th, 2018 from: http://www.theiet.cz/download/events/18/patw2018v02.pdf )
[68]W. U. Chohan, Initial Coin Offerings (ICOs): Risks, Regulation, and Accountability (November 30, 2017). Discussion Paper, Series: Notes on the 21st Century. (Retrieved January 3rd, 2018 from: https://ssrn.com/abstract=3080098 )