240
Annual Report 2007 Československá obchodní banka, a. s.
Annual Report 2007
Československá obchodní banka, a. s.
Business name: Československá obchodní banka, a. s.
Registered office: Radlická 333/150, Praha 5, Postal Code 150 57,
Czech Republic
Legal status: Joint-stock company
Registration: Registered in the Commercial Registry of the City
Court in Prague, Section B XXXVI, Entry 46
Date of registration: 21 December 1964
ID No.: 00001350
Bank code: 0300
SWIFT: CEKOCZPP
Telephone: +420 224 111 111
E-mail: [email protected]
Internet address: http://www.csob.cz
CSOB’s Organisational Unit in the Slovak Republic*
Business name: Československá obchodní banka, a.s.,
branch of a foreign bank in the Slovak Republic
Registered office: Michalská 18, Bratislava, 815 63, Slovak Republic
Legal status: Organisational unit of a foreign entity
Registration: Registered in the Commercial Registry of the District Court
in Bratislava 1, Section Po, Entry 168/B
Date of registration: 8 April 1993
ID No.: 30 805 066
Bank code: 7500
SWIFT: CEKOSKBX Telephone: +421 259 661 111
Fax: +421 254 414 795
E-mail: [email protected]
Internet address: http://www.csob.sk
* Since 1 January 2008 is acting in Slovakia as a new legal entity with the official business name – Československá obchodná banka, a. s. (new ID No.: 36 854 140).
ČSOB’s Basic Information

All great things are made of smalldetails

2
When designing a new building, the architect considers every small detail; when building relationships with our clients, we do the same. We at ČSOB think everything over so that each detail fits to a perfect whole.
1
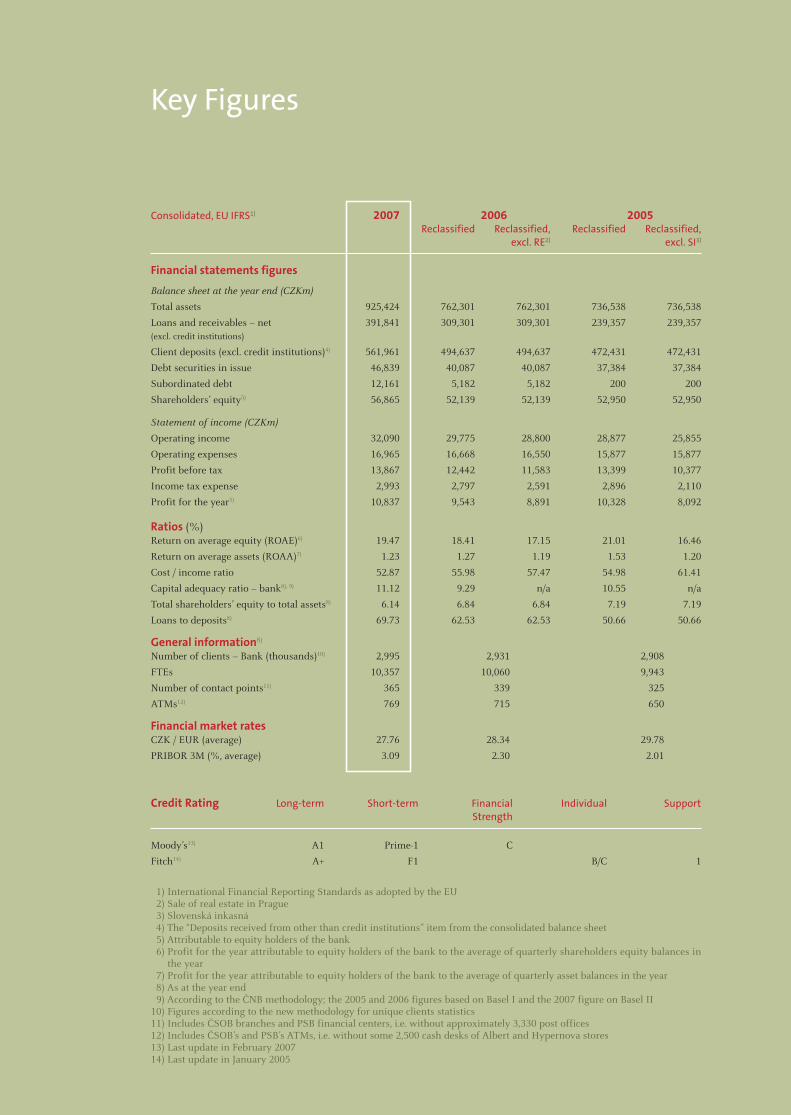
Consolidated, EU IFRS1) 2007 2006 2005 Reclassified Reclassified, Reclassified Reclassified, excl. RE2) excl. SI3)
Financial statements figures
Balance sheet at the year end (CZKm)
Total assets 925,424 762,301 762,301 736,538 736,538
Loans and receivables – net 391,841 309,301 309,301 239,357 239,357(excl. credit institutions)
Client deposits (excl. credit institutions)4) 561,961 494,637 494,637 472,431 472,431
Debt securities in issue 46,839 40,087 40,087 37,384 37,384
Subordinated debt 12,161 5,182 5,182 200 200
Shareholders’ equity5) 56,865 52,139 52,139 52,950 52,950
Statement of income (CZKm)
Operating income 32,090 29,775 28,800 28,877 25,855
Operating expenses 16,965 16,668 16,550 15,877 15,877
Profit before tax 13,867 12,442 11,583 13,399 10,377
Income tax expense 2,993 2,797 2,591 2,896 2,110
Profit for the year5) 10,837 9,543 8,891 10,328 8,092
Ratios (%)Return on average equity (ROAE)6) 19.47 18.41 17.15 21.01 16.46
Return on average assets (ROAA)7) 1.23 1.27 1.19 1.53 1.20
Cost / income ratio 52.87 55.98 57.47 54.98 61.41
Capital adequacy ratio – bank8), 9) 11.12 9.29 n/a 10.55 n/a
Total shareholders’ equity to total assets8) 6.14 6.84 6.84 7.19 7.19
Loans to deposits8) 69.73 62.53 62.53 50.66 50.66
General information8)
Number of clients – Bank (thousands)10) 2,995 2,931 2,908
FTEs 10,357 10,060 9,943
Number of contact points11) 365 339 325
ATMs12) 769 715 650
Financial market ratesCZK / EUR (average) 27.76 28.34 29.78
PRIBOR 3M (%, average) 3.09 2.30 2.01
Credit Rating Long-term Short-term Financial Individual Support Strength
Moody’s13) A1 Prime-1 C
Fitch14) A+ F1 B/C 1
1) International Financial Reporting Standards as adopted by the EU 2) Sale of real estate in Prague 3) Slovenská inkasná 4) The “Deposits received from other than credit institutions” item from the consolidated balance sheet 5) Attributable to equity holders of the bank 6) Profit for the year attributable to equity holders of the bank to the average of quarterly shareholders equity balances in
the year 7) Profit for the year attributable to equity holders of the bank to the average of quarterly asset balances in the year 8) As at the year end 9) According to the ČNB methodology; the 2005 and 2006 figures based on Basel I and the 2007 figure on Basel II10) Figures according to the new methodology for unique clients statistics11) Includes ČSOB branches and PSB financial centers, i.e. without approximately 3,330 post offices12) Includes ČSOB’s and PSB’s ATMs, i.e. without some 2,500 cash desks of Albert and Hypernova stores13) Last update in February 200714) Last update in January 2005
Key Figures
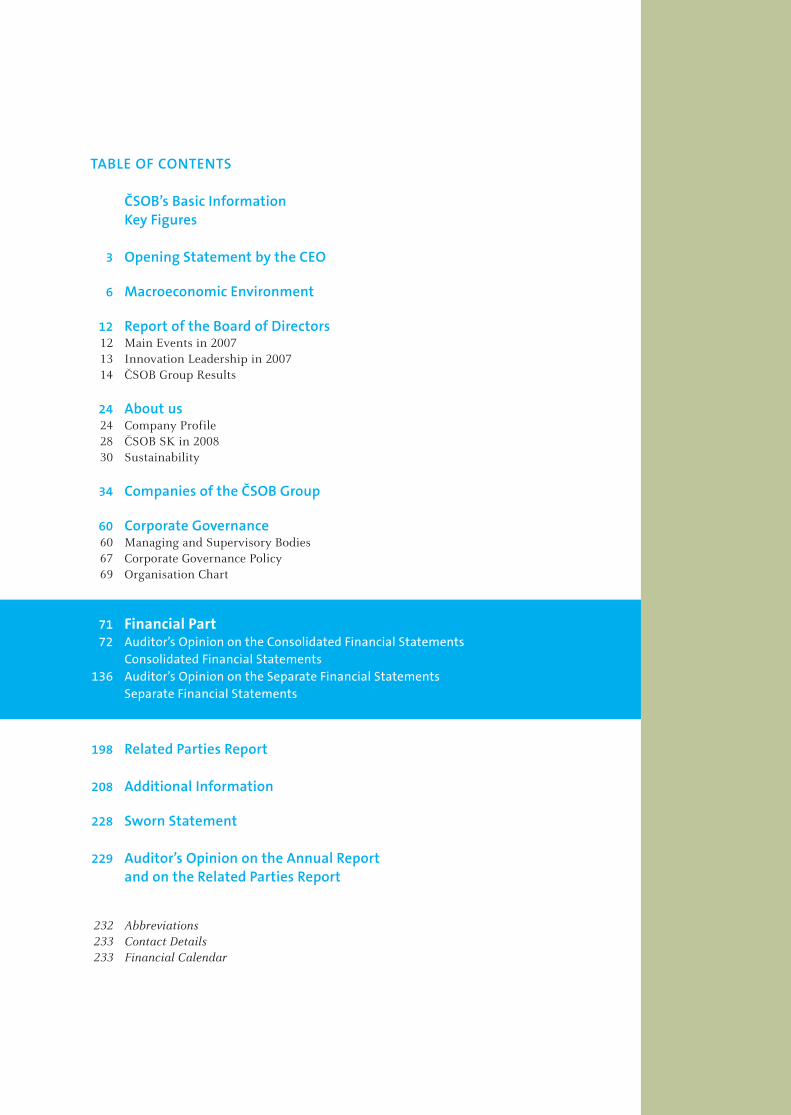
TABLE OF CONTENTS
ČSOB’s Basic Information Key Figures 3 Opening Statement by the CEO
6 Macroeconomic Environment
12 Report of the Board of Directors 12 Main Events in 2007 13 Innovation Leadership in 2007 14 ČSOB Group Results
24 About us 24 Company Profile 28 ČSOB SK in 2008 30 Sustainability
34 Companies of the ČSOB Group
60 Corporate Governance 60 Managing and Supervisory Bodies 67 Corporate Governance Policy 69 Organisation Chart
71 Financial Part 72 Auditor’s Opinion on the Consolidated Financial Statements Consolidated Financial Statements 136 Auditor’s Opinion on the Separate Financial Statements Separate Financial Statements
198 Related Parties Report
208 Additional Information
228 Sworn Statement
229 Auditor’s Opinion on the Annual Report and on the Related Parties Report
232 Abbreviations 233 Contact Details 233 Financial Calendar

3
Ladies and gentlemen,
The year 2007 was extraordinarily successful for ČSOB and its Group. Growing, net of real estate sale, by 22% year on year, our consolidated net profit for the year 2007 exceeded CZK 10.8 bn, which repre-sents an absolute record in the history of the ČSOB Group. Moreover, this profit does not include any important extraordinary items that would be unrelated to our usual business activity and everyday efforts of our employees. Thanks to our great achievements throughout all segments, we increased the volume of business loans by 26%, while keeping high asset quality and only 3% year-on-year increase in operating expenses, net of the real estate one-off. For a more detailed, comprehensive analysis of the financial and business results of the ČSOB Group please refer to the Report of the Board of Directors on pages 12 through 21 herein.
Personally, I will remember the successful year 2007 also as the year when I moved, together with more than two and a half thousand colleagues, from historical buildings in the centre of Prague to a unique, green space in Prague - Radlice which suits much better our needs. I see our Radlice base as a quiet coach who helps us with our transformation into a highly efficient organism and as a very attractive employer in both the Czech and European contexts.
In 2007, the ownership integration of the ČSOB Group into the KBC Group was completed in June when KBC Bank became the sole shareholder of ČSOB as a result of the squeeze-out of minority shareholders. For us, this milestone means more direct responsibility towards our parent company and, at the same time, it highlights the fact that the ČSOB Group is an incremental part of the strong European KBC Group. According to market estimates, we represent about a fifth of its total value.
My thanks go to all who have contributed to the ČSOB Group’s continuing success.
Pavel KavánekChairman of the Board of Directors and Chief Executive Officer
Opening Statement by the CEO
3


Rather than laying a cornerstone, we planted a sycamore maple in front of the main entrance. The tree is a symbol of the company’s positive attitude towards the environment and nature.
6
The Czech Economy in 2007
The Czech Economy prospered in 2007. In real terms, the year-on-year growth of gross domestic product (GDP) surpassed six percent for the third year in a row. The unemployment rate reached its lowest average level since 1997. Despite the ongoing real appreciation of the Czech crown, the trade balance surplus climbed to record heights. Public budgets booked a relatively good result. Last but not least, a fragile government majority in the Czech Parliament endorsed legislative changes that open the doors to the first round of much needed fiscal reforms.
Even evident achievements do not allow the Czech economy to rest on laurels. The low unemployment rate dampens investment and spurs wage pressures. Rapid real appreciation of the Czech crown reduces profitability of Czech exporters. Despite the low average unemployment rate, structurally weak areas plagued with high and long-lasting unemployment still exist. In the long run, the low priority assigned in reality to education, science and research threatens the competitiveness of the domestic labour force. Globally rising oil and food prices count, besides tax changes and administrative price deregulations, among the key accelerators of Czech inflation in the years 2007 – 2008. Persistently weak demand pressures on the price growth ask the Czech National Bank the question, to what degree the central bank should
respond by hiking rates to rapidly growing domestic inflation in an environment of cooling economic growth in the U.S.A. and the Eurozone. First of all due to fears of mounting inflation expectations, the CNB raised the two-week repo rate by a cumulative percentage point last year, to 3.5% in December.
As in previous years, also in 2007 the CNB considered the nominal exchange rate development when handling interest rates. Triggered by large volumes of crown loans granted to buyers of high yielding assets denominated in other currencies, the sharp depreciation of the domestic currency in the first half of the past year demonstrated that not only the positive but also the negative interest rate differential has limits, beyond which it can become a threat to the smooth development of the Czech economy.
Despite higher key interest rates of the central bank and the trade balance surplus that more than doubled, the current account of the Czech balance of payments remained in the red in 2007. This was caused by ongoing profit repatriation from the Czech Republic. Direct investment debits in the investment income credits item jumped by 20% year on year in 2007 to reach a level of 7% of the GDP. Net of reinvestments, the current account of the Czech balance of payments appears in mild surplus.
Public budgets recorded a deficit as low as 1.6% of GDP last year. The improvement was
Macroeconomic Environment
7
reached mainly thanks to surprisingly high tax revenues, originating from unexpected economic growth, high household consumption and low unemployment – which spoils the joy. A more intense participation of the expenditure side in the process of public deficit healing has been postponed until the fiscal reforms enter a later stage marked by bolder systemic changes in public health care, pensions, and social security.
2007 was another successful year also for the banking sector. Assets of commercial banks grew by 18.9% annually and reached a level of 105.3% of GDP. Total outstanding loans granted to households and non-financial enterprises jumped by 33.4% and 19.4%, respectively. Non-financial enterprises’ deposits in commercial banks increased by 18% year on year, household deposits added 9.8%. Profit generated by commercial banks grew by 23.9% compared to the previous period, amounting to CZK 47.1 billion.
The Slovak Economy in 2007
In 2007, the Slovak economy continued its very successful development crowned with the fastest economic growth for the entire period extending from the start of the country’s economic transformation. Fast growing GDP manifested also in the labour market, as the unemployment rate hit a 10-year low without any substantial wage pressures. Unlike the previous year, the inflation rate fell significantly, and this, together with the strong Slovak crown, created conditions for another cut in interest rates. Slovakia has made significant progress on its path to the Eurozone, with the decision on the country’s accession to be made as early as this spring.
The upswing of the Slovak economy again increased last year. GDP growth hit a new all-time high (10.4%), due primarily to the rapidly rising exports of automotive products, encouraged by the launch of production of two new carmakers (PSA and KIA). Less significant contributors to economic growth were consumer demand, based on real wage growth, falling unemployment, and strong demand for loans.
Showing no acceleration, in spite of strong economic growth, inflation did not threaten compliance with the Maastricht inflation criterion. Harmonised year-on-year inflation fell to an all-time low of 1.2% during the year, but, at the end of the year, it started to be driven upward by food prices that rose across the EU. Positive inflation developments, along with the appreciation of the Slovak crown, provided the central bank with room to cut rates. The base rate of the National Bank of Slovakia was cut twice, down to the final 4.25%.
The Slovak crown on average strengthened by 10.3% against the euro and 21.1% against the U.S. dollar last year, contributed significantly to the positive inflation developments. The appreciation of the crown made the NBS revaluate the central parity by 8.5% to SKK 35.4424 per EUR, with the band of +/-15%, as early as in March. In addition, the central bank had to intervene against the rapidly appreciating crown in March and April in the total amount of EUR 2.6 bn. The rest of the year was much calmer in terms of the Slovak currency developments.
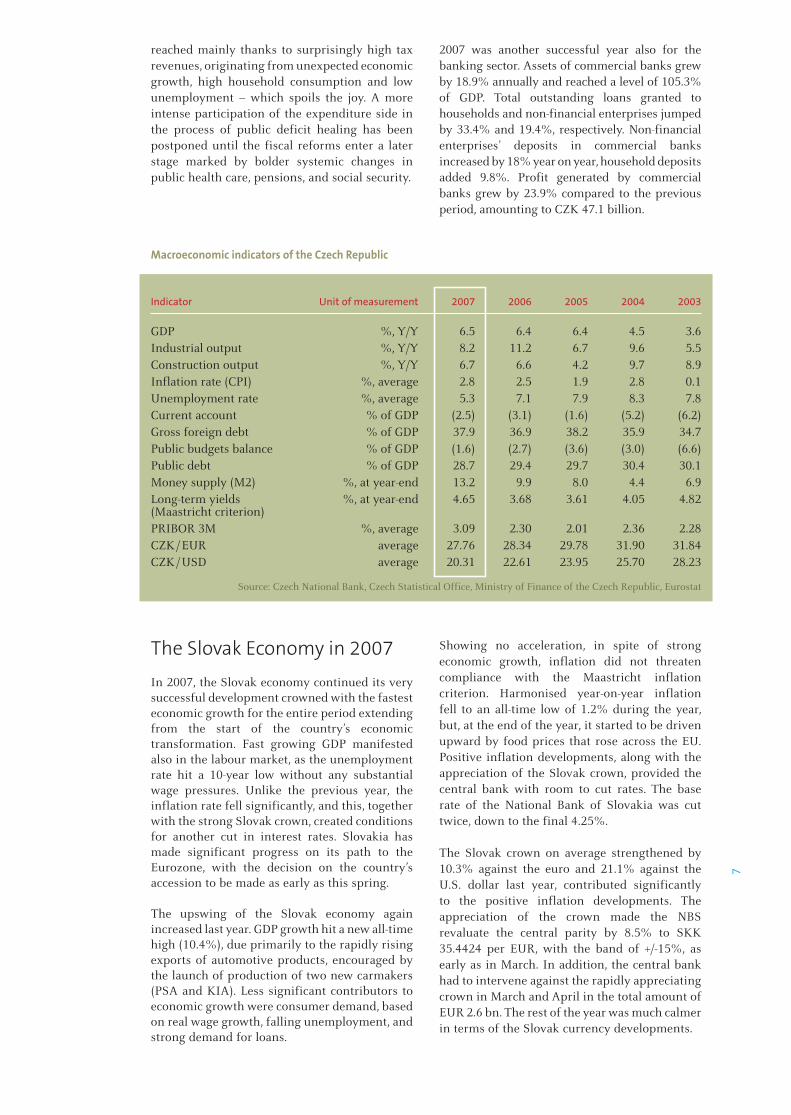
Macroeconomic indicators of the Czech Republic
Indicator Unit of measurement 2007 2006 2005 2004 2003
GDP %, Y/Y 6.5 6.4 6.4 4.5 3.6Industrial output %, Y/Y 8.2 11.2 6.7 9.6 5.5Construction output %, Y/Y 6.7 6.6 4.2 9.7 8.9Inflation rate (CPI) %, average 2.8 2.5 1.9 2.8 0.1Unemployment rate %, average 5.3 7.1 7.9 8.3 7.8Current account % of GDP (2.5) (3.1) (1.6) (5.2) (6.2)Gross foreign debt % of GDP 37.9 36.9 38.2 35.9 34.7Public budgets balance % of GDP (1.6) (2.7) (3.6) (3.0) (6.6)Public debt % of GDP 28.7 29.4 29.7 30.4 30.1Money supply (M2) %, at year-end 13.2 9.9 8.0 4.4 6.9Long-term yields %, at year-end 4.65 3.68 3.61 4.05 4.82(Maastricht criterion)PRIBOR 3M %, average 3.09 2.30 2.01 2.36 2.28CZK / EUR average 27.76 28.34 29.78 31.90 31.84CZK / USD average 20.31 22.61 23.95 25.70 28.23
Source: Czech National Bank, Czech Statistical Office, Ministry of Finance of the Czech Republic, Eurostat

8The appreciation of the crown was encouraged by good news from the economy, which increased Slovakia’s chances of adopting the euro within the planned deadline (1 January 2009). The good news included falling inflation, strong GDP growth and especially a rapidy improving foreign trade result. Exports, primarily encouraged by carmakers’ new production facilities, rose at a double-digit rate, and helped significantly to reduce the deficit, from SKK 81 bn in 2006 to approximately 25% of that value. The good news is that this trend is very likely to persist in 2008.
The trend of increasing indebtedness of the population persisted in 2007, encouraged by generally improving standard of living and falling interest rates. Demand was primarily focused on mortgages that rose by 28.2% Y/Y.
On the other hand, households continued to strongly prefer bank deposits in 2007, which increased up by approximately 13% last year. Business loans also rose at quite a fast rate, by more than 20%.
Favourable economic developments and a relatively stable currency create the conditions for Slovakia to with the decision to be made in the first half of 2008. Thus, Slovakia will most probably be able to adopt the euro in early 2009. The central parity of the exchange rate of the crown might be revalued once again prior to that.
Macroeconomic indicators of the Slovak Republic
Indicator Unit of measurement 2007 2006 2005 2004 2003
GDP %, Y/Y 10.4 8.5 6.6 5.2 4.8Industrial output %, Y/Y 13.0 9.9 3.0 4.2 4.8Construction output %, Y/Y 5.7 14.9 14.7 5.7 6.0Inflation rate (CPI) %, average 2.8 4.5 2.7 7.5 8.5Unemployment rate %, average 11.1 13.3 16.2 18.1 17.4Current account % of GDP (5.3) (7.0) (8.5) (7.8) (5.9)Gross foreign debt % of GDP 54.7 50.9 58.2 49.7 48.7Public budgets balance % of GDP (2.5)* (3.7) (2.8) (2.4) (2.7)Public debt % of GDP 30.6* 30.4 34.2 41.4 42.4Money supply (M3) %, at year-end 12.9 15.3 7.8 15.0 -Long-term yields %, at year-end 4.61 4.15 3.62 4.58 5.42(Maastricht criterion)BRIBOR 3M %, average 4.34 4.32 2.93 4.67 6.18SKK/EUR average 33.78 37.25 38.59 40.05 41.49SKK/USD average 24.71 27.72 31.02 32.27 36.77
* Convergence Programme of the Slovak Republic for 2007 – 2010 Source: National Bank of Slovakia, Statistical Office of the Slovak Republic, Ministry of Finance of the Slovak Republic, Eurostat

9


Designed by Josef Pleskot, the barrier-free building with four floors houses 2,600 people and is located in Prague – Radlice.
12
Strategy of the ČSOB Group is fully aligned with KBC’s strategy for the region of Central and Eastern Europe and Russia. Hence, the ČSOB Group’s vision is to deliver clients the best bank-ing and insurance offer in the Czech Republic tailored to the needs of the Czech market.
Main Events in 2007ČSOB successfully finished 2007 – a year full of important events. Relocation to a new environ-mentally friendly building in Prague - Radlice, a change in shareholders structure and com-pleted separation of ČSOB SK as a new legal entity (effective from 1 January 2008) were the most important among them.
Between April and June 2007, most Prague employees of the ČSOB Group moved from downtown to the new ecological building in Prague - Radlice reaching thus an important mile-stone on our journey towards a high performance corporate culture. The new building gives space for interaction of 2,600 service-minded people.
On 8 March 2007, the CNB approved the squeeze-out of minority shareholders, which was approved by the ČSOB General Meeting on 20 March. In June 2007, KBC Bank NV became the sole share-holder of ČSOB. This operation was financed by KBC’s capital surplus. The value of ČSOB was set at CZK 185 bn, i.e. about 20% of KBC’s market capitalization.
On 1 January 2008, ČSOB SK, formerly the Slovak branch of ČSOB, started operating as a new legal entity and became the owner of the ČSOB Group’s business subsidiaries in SK. KBC obtained full direct control over ČSOB SK. The separation aligned formal bodies of ČSOB in both countries with the country management approach within KBC Central Europe.
Other important events were:• In February, Moody’s upgraded ČSOB’s Financial
Strength rating from C- to C. ČSOB’s long-term rating A1 by Moody’s is at the same level as the country ceiling (i.e. the highest possible) which reflects good asset quality, enhanced risk management, a good track record as a conservative institution, stable funding and systematic support from majority shareholder, KBC Bank.
• In March, Moody’s upgraded the national rat-ing of ČSOB PF Progres and ČSOB PF Stabilita up to Aa1.cz.
• In March, ČSOB took a CZK 7 bn tranche of subordinated debt provided by KBC Bank.
• In December, KBC Bank increased share capi-tal (incl. premium) in ČSOB by CZK 6 bn.
• In December, rating agency Standard&Poor’s upgraded ČSOB Pojišťovna’s long-term rating and rating of financial strength to A-.
• On 31 December 2007, Zemský PF was suc-cessfully merged with ČSOB PF Progres.
Report of the Board of Directors
13
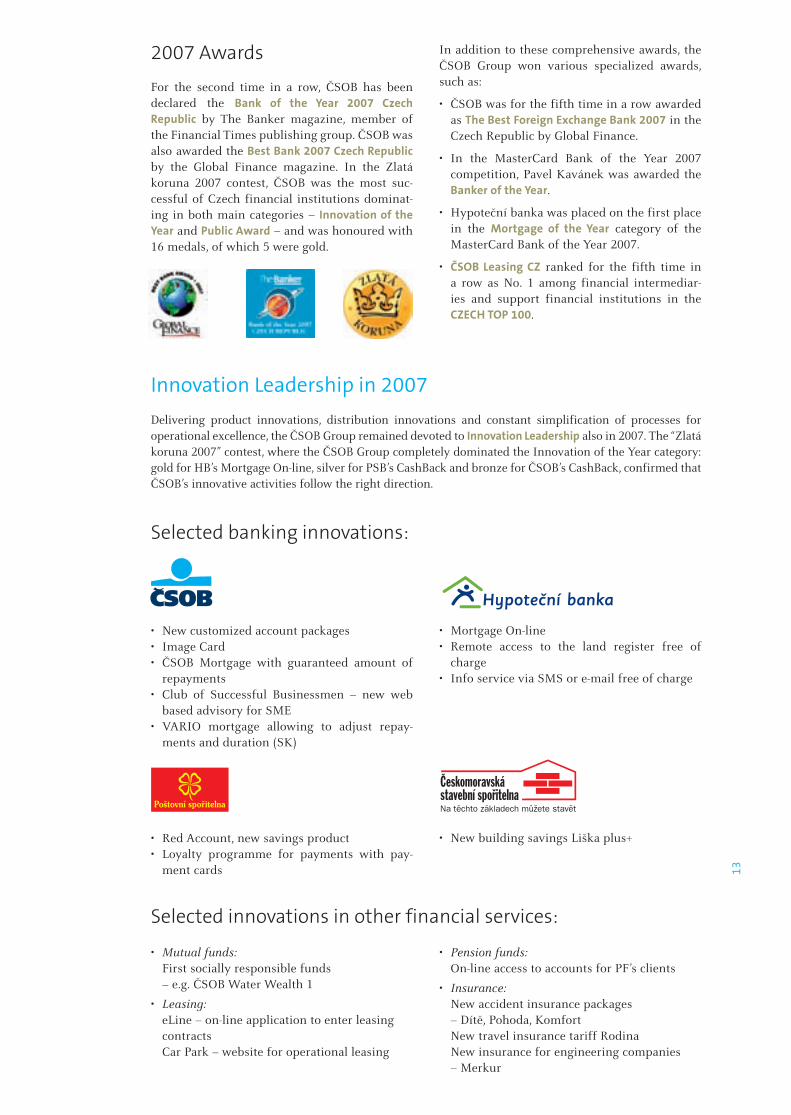
2007 Awards
For the second time in a row, ČSOB has been declared the Bank of the Year 2007 Czech Republic by The Banker magazine, member of the Financial Times publishing group. ČSOB was also awarded the Best Bank 2007 Czech Republic by the Global Finance magazine. In the Zlatá koruna 2007 contest, ČSOB was the most suc-cessful of Czech financial institutions dominat-ing in both main categories – Innovation of the Year and Public Award – and was honoured with 16 medals, of which 5 were gold.
In addition to these comprehensive awards, the ČSOB Group won various specialized awards, such as:
• ČSOB was for the fifth time in a row awarded as The Best Foreign Exchange Bank 2007 in the Czech Republic by Global Finance.
• In the MasterCard Bank of the Year 2007 competition, Pavel Kavánek was awarded the Banker of the Year.
• Hypoteční banka was placed on the first place in the Mortgage of the Year category of the MasterCard Bank of the Year 2007.
• ČSOB Leasing CZ ranked for the fifth time in a row as No. 1 among financial intermediar-ies and support financial institutions in the CZECH TOP 100.
Innovation Leadership in 2007Delivering product innovations, distribution innovations and constant simplification of processes for operational excellence, the ČSOB Group remained devoted to Innovation Leadership also in 2007. The “Zlatá koruna 2007” contest, where the ČSOB Group completely dominated the Innovation of the Year category: gold for HB’s Mortgage On-line, silver for PSB’s CashBack and bronze for ČSOB’s CashBack, confirmed that ČSOB’s innovative activities follow the right direction.
Selected banking innovations:
• New customized account packages • Image Card• ČSOB Mortgage with guaranteed amount of
repayments• Club of Successful Businessmen – new web
based advisory for SME• VARIO mortgage allowing to adjust repay-
ments and duration (SK)
• Red Account, new savings product • Loyalty programme for payments with pay-
ment cards
• Mortgage On-line• Remote access to the land register free of
charge• Info service via SMS or e-mail free of charge
• New building savings Liška plus+
• Mutual funds: First socially responsible funds
– e.g. ČSOB Water Wealth 1
• Leasing: eLine – on-line application to enter leasing
contracts Car Park – website for operational leasing
• Pension funds: On-line access to accounts for PF’s clients
• Insurance: New accident insurance packages – Dítě, Pohoda, Komfort New travel insurance tariff Rodina New insurance for engineering companies
– Merkur
Selected innovations in other financial services:
14
ČSOB Group Results
Financial Performance in the Year 20071)
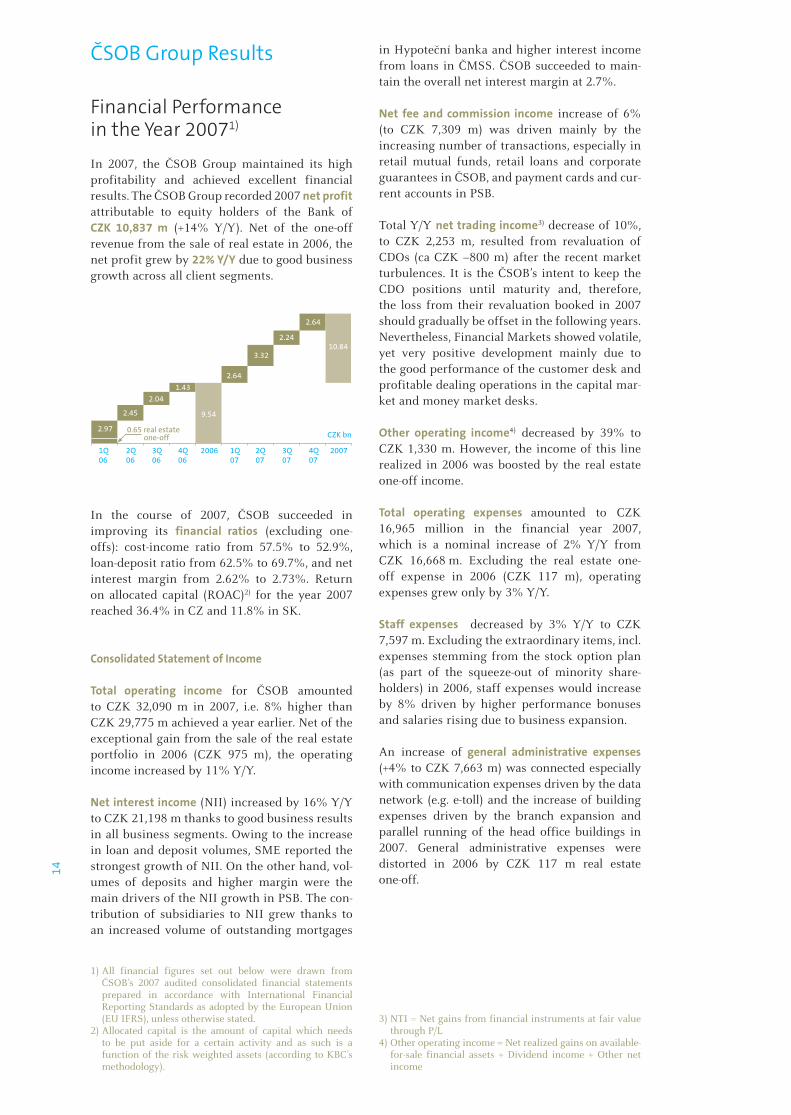
In 2007, the ČSOB Group maintained its high profitability and achieved excellent financial results. The ČSOB Group recorded 2007 net profit attributable to equity holders of the Bank of CZK 10,837 m (+14% Y/Y). Net of the one-off revenue from the sale of real estate in 2006, the net profit grew by 22% Y/Y due to good business growth across all client segments.
In the course of 2007, ČSOB succeeded in improving its financial ratios (excluding one-offs): cost-income ratio from 57.5% to 52.9%, loan-deposit ratio from 62.5% to 69.7%, and net interest margin from 2.62% to 2.73%. Return on allocated capital (ROAC)2) for the year 2007 reached 36.4% in CZ and 11.8% in SK.
Consolidated Statement of Income
Total operating income for ČSOB amounted to CZK 32,090 m in 2007, i.e. 8% higher than CZK 29,775 m achieved a year earlier. Net of the exceptional gain from the sale of the real estate portfolio in 2006 (CZK 975 m), the operating income increased by 11% Y/Y.
Net interest income (NII) increased by 16% Y/Y to CZK 21,198 m thanks to good business results in all business segments. Owing to the increase in loan and deposit volumes, SME reported the strongest growth of NII. On the other hand, vol-umes of deposits and higher margin were the main drivers of the NII growth in PSB. The con-tribution of subsidiaries to NII grew thanks to an increased volume of outstanding mortgages
1) All financial figures set out below were drawn from ČSOB’s 2007 audited consolidated financial statements prepared in accordance with International Financial Reporting Standards as adopted by the European Union (EU IFRS), unless otherwise stated.
2) Allocated capital is the amount of capital which needs to be put aside for a certain activity and as such is a function of the risk weighted assets (according to KBC’s methodology).
in Hypoteční banka and higher interest income from loans in ČMSS. ČSOB succeeded to main-tain the overall net interest margin at 2.7%.
Net fee and commission income increase of 6% (to CZK 7,309 m) was driven mainly by the increasing number of transactions, especially in retail mutual funds, retail loans and corporate guarantees in ČSOB, and payment cards and cur-rent accounts in PSB.
Total Y/Y net trading income3) decrease of 10%, to CZK 2,253 m, resulted from revaluation of CDOs (ca CZK –800 m) after the recent market turbulences. It is the ČSOB’s intent to keep the CDO positions until maturity and, therefore, the loss from their revaluation booked in 2007 should gradually be offset in the following years. Nevertheless, Financial Markets showed volatile, yet very positive development mainly due to the good performance of the customer desk and profitable dealing operations in the capital mar-ket and money market desks.
Other operating income4) decreased by 39% to CZK 1,330 m. However, the income of this line realized in 2006 was boosted by the real estate one-off income.
Total operating expenses amounted to CZK 16,965 million in the financial year 2007, which is a nominal increase of 2% Y/Y from CZK 16,668 m. Excluding the real estate one-off expense in 2006 (CZK 117 m), operating expenses grew only by 3% Y/Y.
Staff expenses decreased by 3% Y/Y to CZK 7,597 m. Excluding the extraordinary items, incl. expenses stemming from the stock option plan (as part of the squeeze-out of minority share-holders) in 2006, staff expenses would increase by 8% driven by higher performance bonuses and salaries rising due to business expansion.
An increase of general administrative expenses (+4% to CZK 7,663 m) was connected especially with communication expenses driven by the data network (e.g. e-toll) and the increase of building expenses driven by the branch expansion and parallel running of the head office buildings in 2007. General administrative expenses were distorted in 2006 by CZK 117 m real estate one-off.
3) NTI = Net gains from financial instruments at fair value through P/L
4) Other operating income = Net realized gains on available-for-sale financial assets + Dividend income + Other net income
10.84
2.64
2.24
3.32
2.641.43
2.04
2.97
2.45 9.54
1Q 06
2Q 06
3Q 06
4Q 06
2006 1Q 07
2Q 07
3Q 07
4Q 07
2007
0.65 real estate one-off CZK bn
15
Depreciation and amortization reached CZK 1,939 m (+3%). The increase relates to opera-tional leasing that generates income (mainly in the line of other operating income) and expenses (mainly depreciation and amortization). The increase was also caused by the activation of the new headquarters in the assets and the start of its depreciation.
Provisions amounted to CZK 234 m in FY 2007; the positive contribution comes mainly from the reserves used in 2007, while in 2006 reserves for litigation were released.
Impairment losses grew by 103% Y/Y to CZK 1,439 m due to higher recoveries in 2006.
Share of profit of associates increased by 302% Y/Y as a result of ČSOB Pojišťovna’s profit growth. ČSOB Pojišťovna has been consolidated in the ČSOB Group by 25% since the half of 2006.
Income tax expense of the ČSOB Group for the year 2007 grew by 7% Y/Y amounting to CZK 2,993 m. Income tax expense in 2007 was influ-enced by deferred tax expense resulting mainly from the reduction in the deferred tax rate – 24% rate applicable in 2006 changed to 20% in 2007.
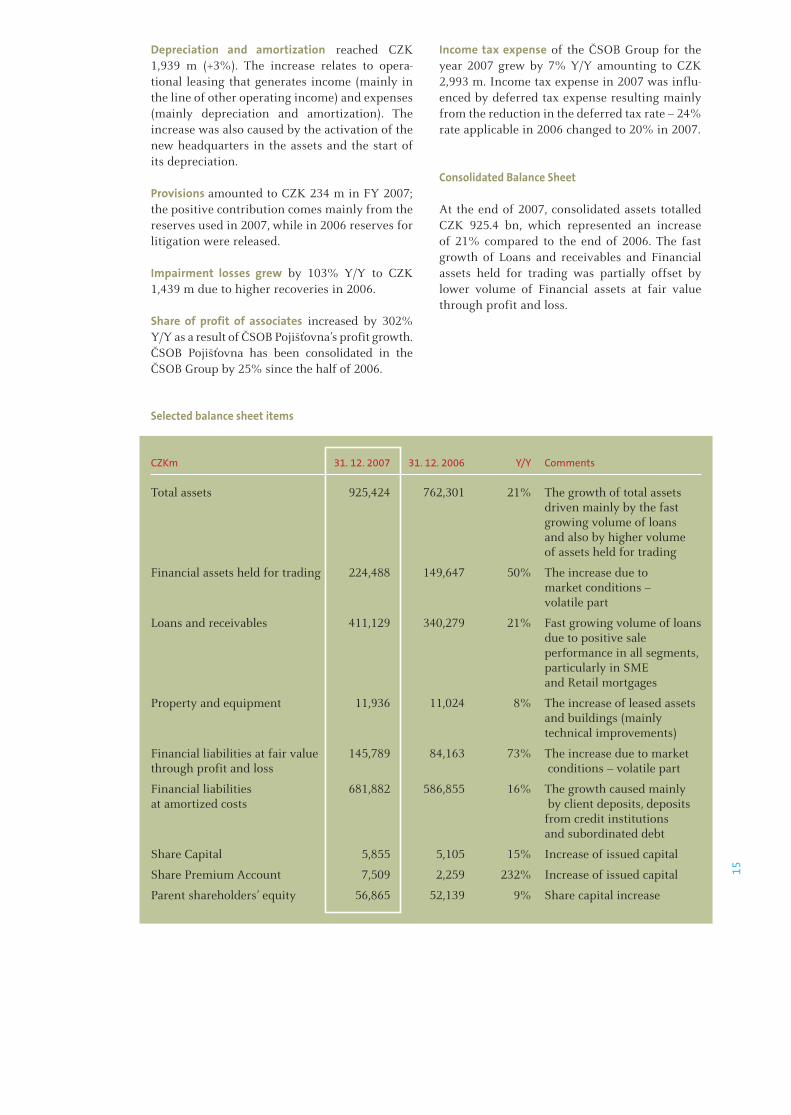
Consolidated Balance Sheet
At the end of 2007, consolidated assets totalled CZK 925.4 bn, which represented an increase of 21% compared to the end of 2006. The fast growth of Loans and receivables and Financial assets held for trading was partially offset by lower volume of Financial assets at fair value through profit and loss.
Selected balance sheet items
CZKm 31. 12. 2007 31. 12. 2006 Y/Y Comments
Total assets 925,424 762,301 21% The growth of total assets driven mainly by the fast growing volume of loans and also by higher volume of assets held for trading
Financial assets held for trading 224,488 149,647 50% The increase due to market conditions – volatile part
Loans and receivables 411,129 340,279 21% Fast growing volume of loans due to positive sale performance in all segments, particularly in SME and Retail mortgages
Property and equipment 11,936 11,024 8% The increase of leased assets and buildings (mainly technical improvements)
Financial liabilities at fair value 145,789 84,163 73% The increase due to marketthrough profit and loss conditions – volatile part
Financial liabilities 681,882 586,855 16% The growth caused mainlyat amortized costs by client deposits, deposits from credit institutions and subordinated debt
Share Capital 5,855 5,105 15% Increase of issued capital
Share Premium Account 7,509 2,259 232% Increase of issued capital
Parent shareholders’ equity 56,865 52,139 9% Share capital increase
16
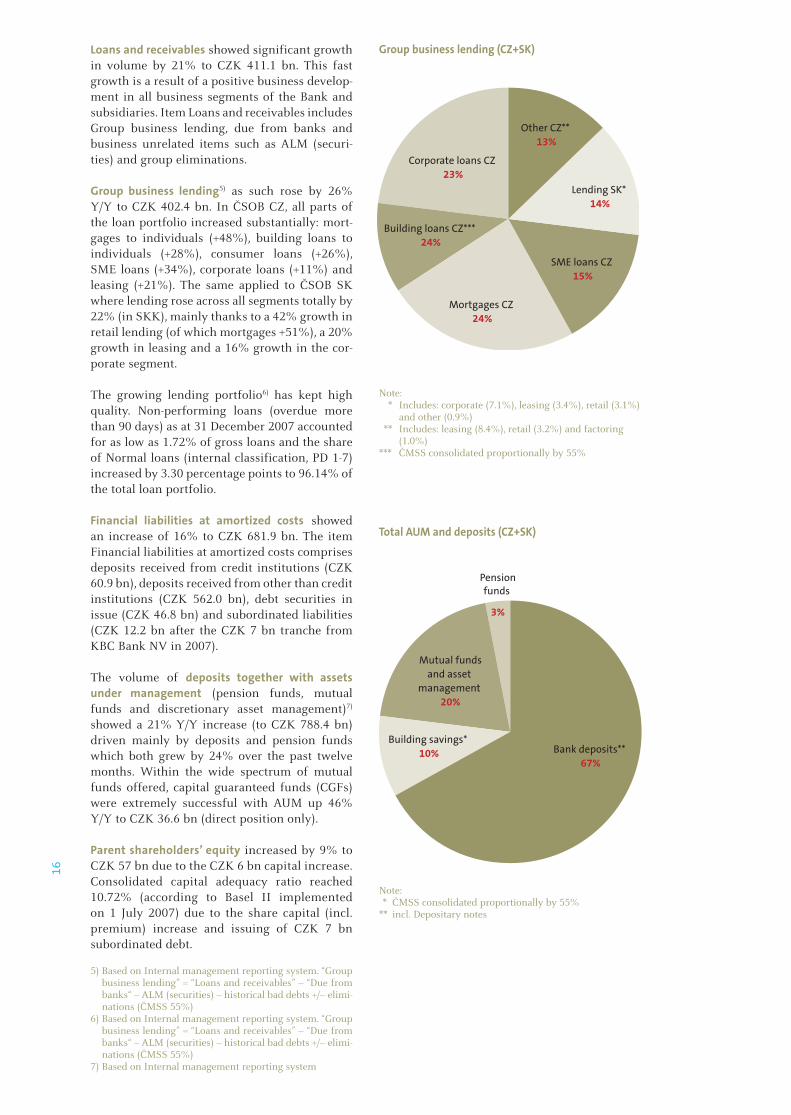
Loans and receivables showed significant growth in volume by 21% to CZK 411.1 bn. This fast growth is a result of a positive business develop-ment in all business segments of the Bank and subsidiaries. Item Loans and receivables includes Group business lending, due from banks and business unrelated items such as ALM (securi-ties) and group eliminations.
Group business lending5) as such rose by 26% Y/Y to CZK 402.4 bn. In ČSOB CZ, all parts of the loan portfolio increased substantially: mort-gages to individuals (+48%), building loans to individuals (+28%), consumer loans (+26%), SME loans (+34%), corporate loans (+11%) and leasing (+21%). The same applied to ČSOB SK where lending rose across all segments totally by 22% (in SKK), mainly thanks to a 42% growth in retail lending (of which mortgages +51%), a 20% growth in leasing and a 16% growth in the cor-porate segment.
The growing lending portfolio6) has kept high quality. Non-performing loans (overdue more than 90 days) as at 31 December 2007 accounted for as low as 1.72% of gross loans and the share of Normal loans (internal classification, PD 1-7) increased by 3.30 percentage points to 96.14% of the total loan portfolio.
Financial liabilities at amortized costs showed an increase of 16% to CZK 681.9 bn. The item Financial liabilities at amortized costs comprises deposits received from credit institutions (CZK 60.9 bn), deposits received from other than credit institutions (CZK 562.0 bn), debt securities in issue (CZK 46.8 bn) and subordinated liabilities (CZK 12.2 bn after the CZK 7 bn tranche from KBC Bank NV in 2007).
The volume of deposits together with assets under management (pension funds, mutual funds and discretionary asset management)7) showed a 21% Y/Y increase (to CZK 788.4 bn) driven mainly by deposits and pension funds which both grew by 24% over the past twelve months. Within the wide spectrum of mutual funds offered, capital guaranteed funds (CGFs) were extremely successful with AUM up 46% Y/Y to CZK 36.6 bn (direct position only).
Parent shareholders’ equity increased by 9% to CZK 57 bn due to the CZK 6 bn capital increase. Consolidated capital adequacy ratio reached 10.72% (according to Basel II implemented on 1 July 2007) due to the share capital (incl. premium) increase and issuing of CZK 7 bn subordinated debt.
5) Based on Internal management reporting system. “Group business lending” = “Loans and receivables” – “Due from banks“ – ALM (securities) – historical bad debts +/– elimi-nations (ČMSS 55%)
6) Based on Internal management reporting system. “Group business lending” = “Loans and receivables” – “Due from banks“ – ALM (securities) – historical bad debts +/– elimi-nations (ČMSS 55%)
7) Based on Internal management reporting system
Note: * Includes: corporate (7.1%), leasing (3.4%), retail (3.1%)
and other (0.9%) ** Includes: leasing (8.4%), retail (3.2%) and factoring
(1.0%)*** ČMSS consolidated proportionally by 55%
Note: * ČMSS consolidated proportionally by 55% ** incl. Depositary notes
Group business lending (CZ+SK)
Total AUM and deposits (CZ+SK)
Mutual fundsand asset
management 20%
Pensionfunds
3%
Bank deposits** 67%
Building savings* 10%
Corporate loans CZ 23%
Other CZ** 13%
Lending SK* 14%
SME loans CZ 15%
Mortgages CZ 24%
Building loans CZ*** 24%
17
ČSOB Group in the Czech Republic
Group Synergies
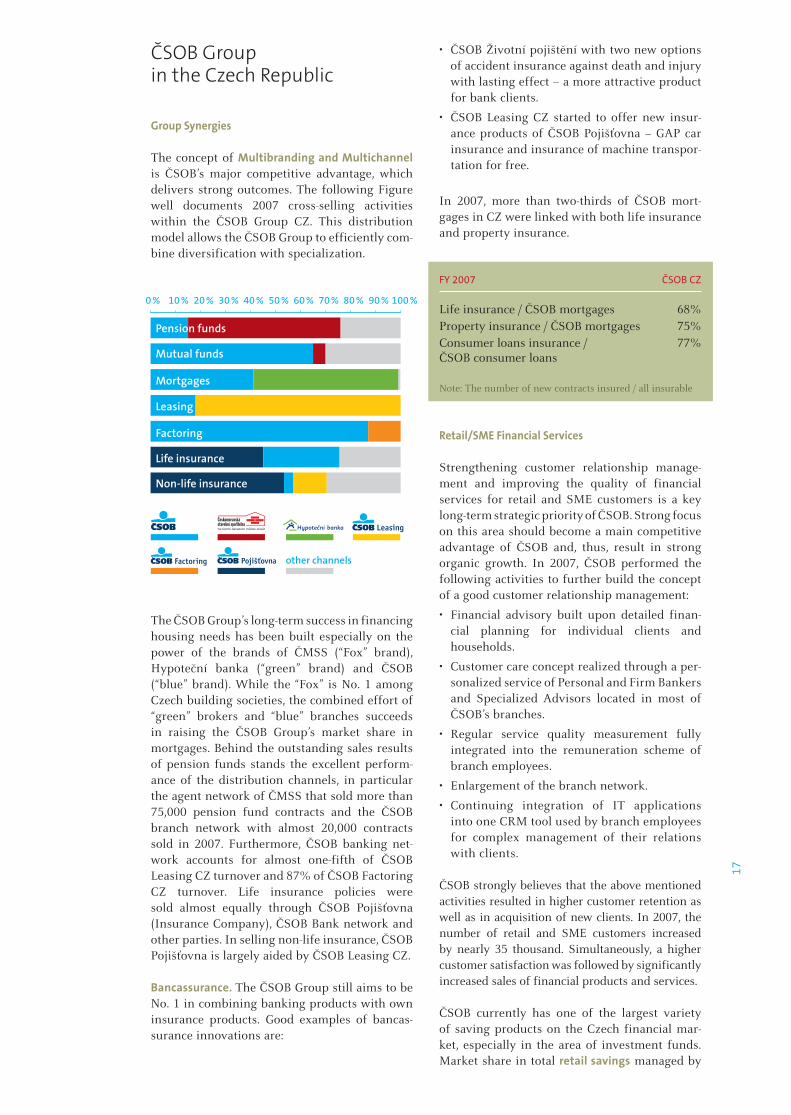
The concept of Multibranding and Multichannel is ČSOB’s major competitive advantage, which delivers strong outcomes. The following Figure well documents 2007 cross-selling activities within the ČSOB Group CZ. This distribution model allows the ČSOB Group to efficiently com-bine diversification with specialization.
The ČSOB Group’s long-term success in financing housing needs has been built especially on the power of the brands of ČMSS (“Fox” brand), Hypoteční banka (“green” brand) and ČSOB (“blue” brand). While the “Fox” is No. 1 among Czech building societies, the combined effort of “green” brokers and “blue” branches succeeds in raising the ČSOB Group’s market share in mortgages. Behind the outstanding sales results of pension funds stands the excellent perform-ance of the distribution channels, in particular the agent network of ČMSS that sold more than 75,000 pension fund contracts and the ČSOB branch network with almost 20,000 contracts sold in 2007. Furthermore, ČSOB banking net-work accounts for almost one-fifth of ČSOB Leasing CZ turnover and 87% of ČSOB Factoring CZ turnover. Life insurance policies were sold almost equally through ČSOB Pojišťovna (Insurance Company), ČSOB Bank network and other parties. In selling non-life insurance, ČSOB Pojišťovna is largely aided by ČSOB Leasing CZ.
Bancassurance. The ČSOB Group still aims to be No. 1 in combining banking products with own insurance products. Good examples of bancas-surance innovations are:
• ČSOB Životní pojištění with two new options of accident insurance against death and injury with lasting effect – a more attractive product for bank clients.
• ČSOB Leasing CZ started to offer new insur-ance products of ČSOB Pojišťovna – GAP car insurance and insurance of machine transpor-tation for free.
In 2007, more than two-thirds of ČSOB mort-gages in CZ were linked with both life insurance and property insurance.
FY 2007 ČSOB CZ
Life insurance / ČSOB mortgages 68%Property insurance / ČSOB mortgages 75%Consumer loans insurance / 77%ČSOB consumer loans
Note: The number of new contracts insured / all insurable
Retail/SME Financial Services
Strengthening customer relationship manage-ment and improving the quality of financial services for retail and SME customers is a key long-term strategic priority of ČSOB. Strong focus on this area should become a main competitive advantage of ČSOB and, thus, result in strong organic growth. In 2007, ČSOB performed the following activities to further build the concept of a good customer relationship management:
• Financial advisory built upon detailed finan-cial planning for individual clients and households.
• Customer care concept realized through a per-sonalized service of Personal and Firm Bankers and Specialized Advisors located in most of ČSOB’s branches.
• Regular service quality measurement fully integrated into the remuneration scheme of branch employees.
• Enlargement of the branch network.
• Continuing integration of IT applications into one CRM tool used by branch employees for complex management of their relations with clients.
ČSOB strongly believes that the above mentioned activities resulted in higher customer retention as well as in acquisition of new clients. In 2007, the number of retail and SME customers increased by nearly 35 thousand. Simultaneously, a higher customer satisfaction was followed by significantly increased sales of financial products and services.
ČSOB currently has one of the largest variety of saving products on the Czech financial mar-ket, especially in the area of investment funds. Market share in total retail savings managed by
0 % 10 % 20 % 30 % 40 % 50 % 60 % 70 % 80 % 90 % 100 %
Pension funds
Mutual funds
Mortgages
Leasing
Factoring
Life insurance
Non-life insurance
other channels
18
the ČSOB Group has been stable of around 30% for a long time. Specifically, the total volume of savings reached CZK 318 bn at the end of 2007. Concerning investment funds, the total volume of KBC/ČSOB funds reached CZK 81.4 bn (direct position only) at the end of 2007. Record net sales of funds in 2007 also resulted in a significant Y/Y increase of market share by nearly 2 percentage points up to 28.8% at the end of 2007.
In 2007, ČSOB further retained its position of the largest retail loan provider for housing purposes on the Czech financial market. The total volume of outstanding loans provided for these purposes increased by 38% compared to 2006 and reached CZK 160 bn at the end of 2007. A market share of 31.3% was reached due mainly to record sales of new mortgages. In 2007, ČSOB and Hypoteční banka sold together more than 22 thousand con-tracts in the amount of CZK 38 bn. Market share of the ČSOB Group in newly provided retail mortgages reached 26.8% in 2007.
Record sales were also achieved in the segment of SME clientele. Outstanding volume of credits, including leasing and factoring, provided in ČSOB branches increased by 35% in 2007 and reached CZK 62 bn. This increase was mainly driven by loans provided for company investments and development. In 2007, ČSOB also recorded the highest increase of SME savings in the ČSOB history. The total volume of AUM (deposits and funds) increased by 20% Y/Y and, thus, reached a volume of CZK 120 bn at the end of 2007. The main innovation in the SME deposit area was ČSOB Saving Account for Businessman.
Poštovní spořitelna (Postal Savings Bank, PSB), ČSOB’s second retail banking brand, is a key player in the lower mass retail market, serving over 2 million clients. PSB offers its services in the postal network of some 3,330 post offices in the Czech Republic, 29 own PSB Financial centres (branches) and various direct channels. PSB followed its long-term strategy to become the No.1 bank for mass retail in the next ten years and build PSB as a modern multi-channel bank. The multi-channel distribution of PSB services has been enhanced by the launch of close cooperation with ČMSS whose 2,500 financial advisors actively promote selected PSB products. As in previous years, PSB continues to attract urban and young clients. In May, PSB launched a new sub-brand focusing on the youth segment, Space. The focus on the youth meets with great success – the number of Mini Accounts and Junior Accounts grew Y/Y by 267% and 21%, respectively. PSB is also focused on the sale of investment products – the outstanding volume of Postal Investment Programme rose by 38% to almost CZK 2.7 bn. The most important PSB’s innovations in 2007 were Red Account and loyalty programme for both debit and credit
cards users. The Red Account has the potential to become the fastest growing product.
Services for Corporate Clients
Meeting all the key commercial targets, 2007 again represented a successful year for the corporate and institutional banking division that provides financial services for companies with business turnover above CZK 300 m. In recent months, ČSOB successfully continued in its evolution into a full-fledged financial advisory provider supporting its customers in strategic development through comprehensive and highly customized consulting services. These individual customizations are based on long-term experience, international know-how and deep knowledge of the local market, but also on exceptionally broad product portfolio that was further strengthened in 2007. Attention was paid mainly to sophisticated services in domains like structured finance, financial markets, trade finance or custody.
Last year’s growth of the Czech economy allowed ČSOB to continue in the corporate credit lend-ing. Despite a very sound credit portfolio of more than CZK 94 bn, several innovative measures to further enhance credit risk management were taken. Thanks to the achieved improvements, ČSOB is now proud to be compliant with the Basel II requirements as well as with other mar-ket conditions of modern corporate banking.
Asset Management
At year-end 2007, the ČSOB Group’s total assets under management containing mutual funds, discretionary asset management and pension funds reached CZK 164.4 billion, the Y/Y growth of 24% (according to the AKAT methodology).
Owing to continuous launching of innovative new products, ČSOB AM Group8) remained market leader of the discretionary asset management and mutual funds industry on the Czech market in 2007, as in the previous year. While over the past few years its share on the Czech market in total assets under management (discretionary assets and mutual funds) has continually stayed above 20%, in 2007 ČSOB reached a 23% market share.
2007 was a good year for ČSOB AM CZ in the discretionary asset management, despite the fact there was a negative climate on the stock market in the second half of the year. In the segment of private individuals the market share is almost 40%, assets exceeded CZK 10 bn and grew by 8% Y/Y. A booming segment was SME, where assets
8) ČSOB AM Group consists of two companies: ČSOB AM CZ and ČSOB IS – the first covering the asset manage-ment of clients’ money and the second covering mutual fund business
19
increased by more than 50% Y/Y. Total assets in discretionary asset management (including Group clients) came to CZK 75.7 bn.
ČSOB AM CZ also launched the ČSOB Property fund, a qualified investors’ fund dedicated to investments in the real estate market in CEE. The fund belongs to the first funds of that nature in the market and was granted a license in July 2007. Its capital of CZK 50 million was increased by the Bank and ČSOB Pojišťovna by CZK 918 million. The fund also concluded its first investment – EUR 35 m prime property in Prague.
ČSOB AM Group, via ČSOB IS, is also highly active in the mutual funds industry, where ČSOB, in collaboration with KBC AM, launched 10 open-ended and 66 capital guaranteed funds on the Czech market in 2007, for both retail and institutional clients.
Thanks to its numerous innovative products, especially capital guaranteed funds, ČSOB IS is continually strengthening its position in the Czech market for mutual funds. Assets in ČSOB’s mutual funds grew above the market to reach 28.8% market share at the end of 2007. Growing by 47% during 2007 in the assets in capital guaranteed funds (incl. funds for single life insurance), ČSOB confirmed its No. 1 position with assets over CZK 41 bn in this most dynamic part of the market. ČSOB IS also launched SRI (socially responsible investment) funds. In 2007, SRI funds were one of the most popular investments with sales app. CZK 2 billion.
ČSOB has been offering two strong pension funds with different investment profiles: ČSOB PF Stabilita (conservative investment strategy, mainly fixed-return securities) and ČSOB PF Progres (dynamic investment profile with more stocks and foreign bonds). The total volume of clients’ assets placed in ČSOB pension funds reached CZK 19.7 bn at the end of 2007 repre-senting 22% Y/Y growth. In 2007, ČSOB PFs jumped one place and became the third largest provider of pension insurance in the country with almost 615,000 active clients, with a 15% Y/Y growth. ČSOB PFs achieved the largest increase in market share, in terms of number of clients, of 0.8 percentage points Y/Y. Behind the outstanding sales results stands the excellent performance of the distribution channels, in par-ticular the agent network of ČMSS which sold more than 75,000 pension fund contracts and ČSOB branch network with almost 20,000 con-tracts sold in 2007. ČSOB PF Progres remained the best performing pension fund on the market over the long term and received again public award for the best performing pension fund, first place in Zlatá koruna 2007. The ČSOB pen-sion funds’ successful year 2007 was completed by a merger of ČSOB PF Progres and Zemský PF on 31 December 2007.
Other Core Financial Services
In 2007, Financial Markets recorded the most successful year in the Bank’s history, despite the market turbulences in the second half of the year. The most successful areas were the Capital Market desk, the Money Market desk and the FX desk. Extremely positive point in FX was the fact that ČSOB was able to maintain or even increased its leading position on the local market. The main reasons for the good result and position-ing were proper trading strategy and very good contacts and relationships with a vast majority of foreign banks and investment houses active on the local market, which were using ČSOB as the main bank for execution of their orders and information source. A very important and positive fact was that ČSOB further increased the usage of derivatives by 32% in 2007 and the interest rates and commodity part increased by 238%. ČSOB’s Derivatives (traded into the books of KBC) were the most profitable part of the whole KBC FXO trading, same as in 2006.
ČSOB Leasing CZ confirmed its No. 1 position with 2007 new turnover of CZK 25.2 bn, which is 16% higher compared to 2006. The Y/Y improve-ment was driven by financial leasing (+10%), full service operative leasing (+34%) and consumer loans (+46%). From the commodity view, the best results were achieved in the area of com-mercial vehicles (+33%). ČSOB Leasing CZ also ranked first among financial intermediaries and support financial institutions in the CZECH TOP 100 for the fifth time in a row.
As of 31 December 2007, total new turnover of assumed receivables of ČSOB Factoring CZ amounted to CZK 27.1 bn (39% above the previ-ous year). In the end of 2007, ČSOB Factoring CZ reached a market share of 21.3% and kept the position of the market leader. Good development of business was driven by raised volume of cred-its provided to clients, which were acquired at the end 2006, and also supported by significant improvement in the cooperation with the Bank.
In line with the governance structure, the ČSOB Group consolidated 25% of the insurance com-pany ČSOB Pojišťovna in its accounts. In 2007, ČSOB Pojišťovna reported net profit of CZK 840 m, which is the best result in its history. Non-life gross written premium in the amount of CZK 3.635 bn grew by 12% Y/Y. The high-est growth was recorded in Households, MTPL and Casco. Since October 2007, the new product Merkur is being sold as part of industrial risk – for engineering business. Life gross written pre-mium of CZK 5.421 bn increased in 2007 by 22% Y/Y. ČSOB Pojišťovna raised its market share to 10.1% in life insurance and 4.8% in non-life insurance and confirmed its position No. 5 in the market of life and non-life insurance.
20
Direct Banking
The increase in banking transactions initiated through Direct Sales and Services gives evidence that e-banking is becoming a more common part of life. In 2007, there were more than 65 million transactions executed through direct services in ČSOB (including PSB), i.e. 20% more than in 2006, and 80% of all transactions realized in ČSOB were executed through direct services. More than 44% of ČSOB clients have opened at least one channel of Direct Banking with their bank accounts. Also the first year of e-Toll functioning was very successful, CZK 6 bn were cleared for road-toll transactions by ČSOB.
In 2007, almost 3 million client calls were answered by the Client Centre. This represented ca 233 thousand calls per month, signifying a Y/Y increase of 9%. In compliance with the business focus of the Client Centre on an active approach towards the clients, ČSOB are progressing to increase the rate of the outbound calls in comparison with inbound calls from 29% in 2006 to 37% in 2007.
In May, ČSOB successfully finished the migra-tion of Card management system from GPE to Sinsys (global KBC provider) that enables the Bank and its partners to extend the quality of service and further implement services with added value. By the end of 2007, the CashBack service, unique in the Czech Republic, reached 100 million transactions and was awarded in the Zlatá koruna contest as one of the Innovations of the Year 2007. On a yearly basis, ČSOB increased the number of transactions processed via ČSOB merchants by 21% and via ATMs by 34%. The number of ATMs raised by 52 to 637 in total. The expansion of functionalities via ATM network continued, ČSOB successfully launched personal loans offers and credit cards via ATM.
Other 2007 e-innovations were ČSOB Business Banking 24 Online and Max Homebanking PS Online. ČSOB completely re-designed all the currently managed web pages of all blue brand companies together with two new web pages – Private Bank and Club of Successful Businessmen and launched on-line sales of MTPL insurance.
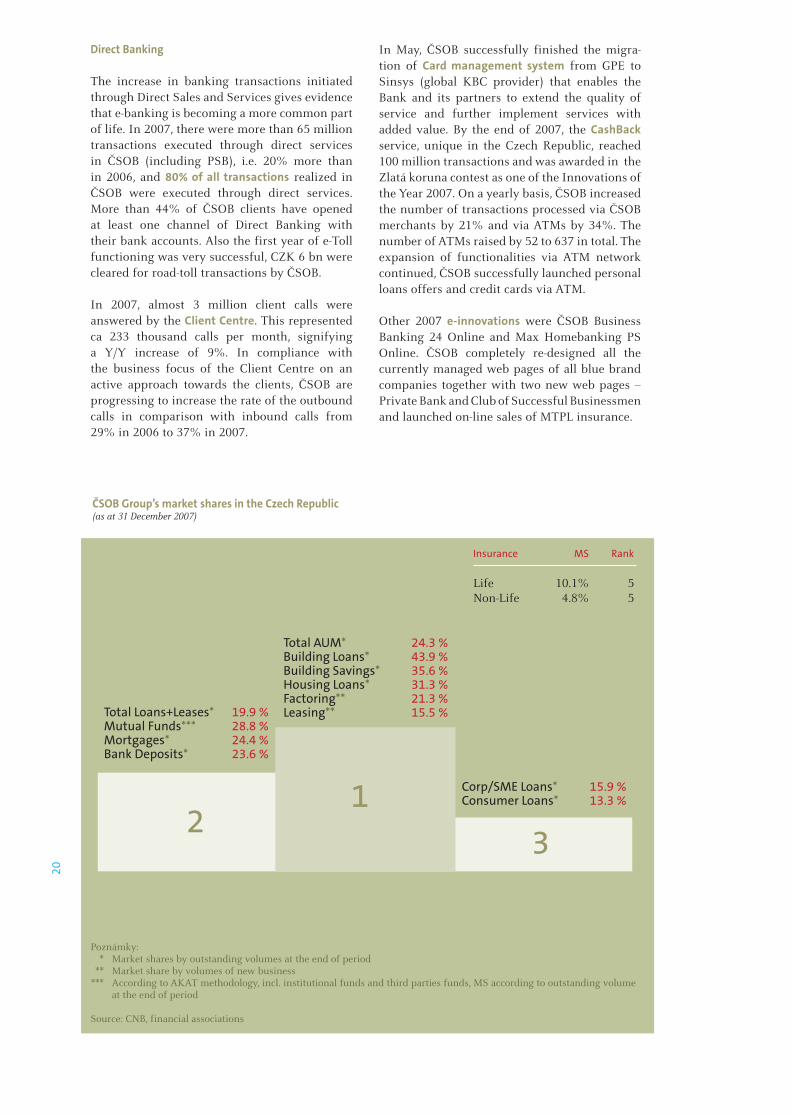
Corp/SME Loans* 15.9 %Consumer Loans* 13.3 %
Total Loans+Leases* 19.9 %Mutual Funds*** 28.8 %Mortgages* 24.4 %Bank Deposits* 23.6 %
Total AUM* 24.3 %Building Loans* 43.9 %Building Savings* 35.6 %Housing Loans* 31.3 %Factoring** 21.3 %Leasing** 15.5 %
31
2
ČSOB Group’s market shares in the Czech Republic (as at 31 December 2007)
Insurance MS Rank
Life 10.1% 5Non-Life 4.8% 5
Poznámky: * Market shares by outstanding volumes at the end of period ** Market share by volumes of new business *** According to AKAT methodology, incl. institutional funds and third parties funds, MS according to outstanding volume
at the end of period
Source: CNB, financial associations
21
ČSOB Group in Slovakia
ČSOB Group SK achieved very good business results in 2007, using 86 retail branches and 15 SME-specialized Business Centres of ČSOB SK and the network of ČSOB’s Slovak subsidiaries. Total business lending in Slovakia increased by 22% Y/Y and reached SKK 73.9 bn, thanks to the growth reported in all segments: Retail (+42%), Corporate (+16%), SME (+9%), Leasing (+21%). Being the main part of retail loans, mortgages rose by 51% Y/Y. In terms of total assets, ČSOB SK has remained No. 4 in the Slovak market.
Behind the good business results stand continu-ous product improvements and distribution inno-vations. In line with the Group strategy, ČSOB SK also seeks to strengthen insurance sales via the bank network.
ČSOB SK redesigned all service packages for SME clients and individuals to make their use more effective. ČSOB SK also launched a new package for administrators – ČSOB Business Account KOMPLET for Administrators – and updated Agricultural Bridging Loan and Renewal Housing Fund. ČSOB SK successfully offered its highly structured and sophisticated acquisition financing, which resulted in transactions within the telecommunication industry amounting to SKK 2.7 bn. ČSOB SK participated in syndicated loan transactions exceeding in total EUR 1 bn.
Noteworthy among retail innovations is ČSOB Mortgage for young people entitled to a state housing benefit and contribution from the Bank. In autumn 2007, ČSOB SK was the first bank in Slovakia to launch VARIO mortgage, an adjustable rate mortgage with flexible payment options, maturity (up to 40 years) and repayment anytime after 30 years. Retail branches started to provide credit products such as consumer loans, overdrafts and credit cards through the ATM network. ČSOB SK is the first bank to offer card-holders the option to design their own unique payment card – IMAGE card.
Other companies of the ČSOB Group SK also sig-nificantly contributed to the achieved results.
In the course of 2007, ČSOB AM SK extended its offer by eight new capital guaranteed funds in SKK for retail clients and eight capital guaran-teed funds for clients of the Private Bank. ČSOB AM SK continues to strengthen its No. 4 posi-tion in the Slovak mutual funds market with a market share of 11.5%. Gross sales of mutual funds in 2007 reached SKK 14.2 bn (+35% Y/Y). In 2007, ČSOB AM SK launched a first property CGF – FUND PARTNERS ČSOB Reality SKK 1.
In 2007, together with a slight increase of the number of clients ČSOB d.s.s. witnessed a signifi-cant growth of assets under management up to the total of SKK 2.8 bn. At the end of 2007, ČSOB d.s.s. had more than 104 thousand clients.
In 2007, ČSOB SP continued its past success as the number of concluded housing savings agree-ments increased Y/Y by 41%. In line with the set objectives and seeking to simplify processes of service provision, ČSOB SP introduced the sales of housing savings through the Bank branches, launched cross-selling of products and restruc-tured its loan portfolio. To provide its clients with higher quality and achieve better client satisfaction, ČSOB SP has significantly reduced the loan approval period.
In bancassurance, an increased cooperation of ČSOB Poisťovňa and ČSOB SK doubled the volume of life gross written premium compared to 2006. ČSOB Poisťovna further secured its sig-nificant position which was proved by the third place in the 2007 insurance company awards organized by the TREND weekly.
FY 2007 ČSOB SK
Life insurance / ČSOB mortgages 53%Property insurance / ČSOB mortgages 63%Consumer loans insurance / ČSOB consumer loans 84%
Note: The number of new contracts insured / all insurable
In 2007, ČSOB Leasing SK financed assets in the total amount of SKK 12.3 bn. The company concluded over 16,150 contracts. With its 17% market share in movable asset financing, ČSOB Leasing SK again confirmed its leading mar-ket position. The growing number of changes focused on productivity of labour as well as the implementation of customer-oriented changes contributed to the results achieved.
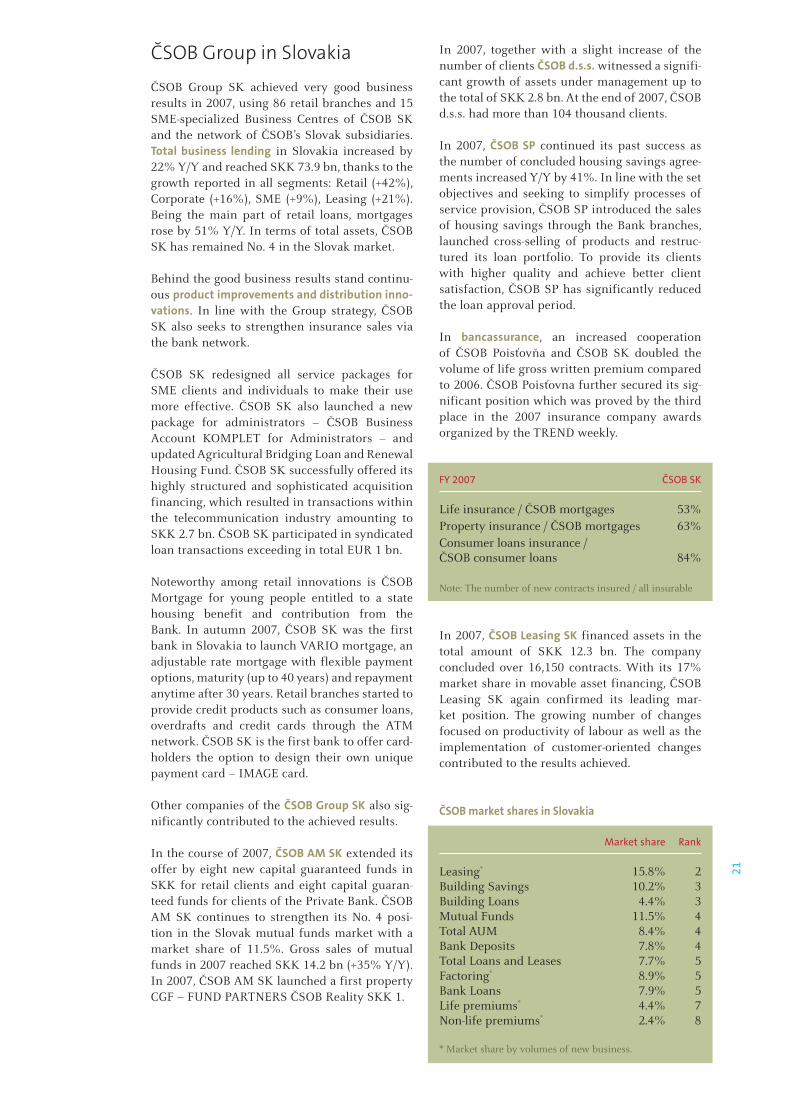
ČSOB market shares in Slovakia
Market share Rank
Leasing* 15.8% 2Building Savings 10.2% 3Building Loans 4.4% 3Mutual Funds 11.5% 4Total AUM 8.4% 4Bank Deposits 7.8% 4Total Loans and Leases 7.7% 5Factoring* 8.9% 5Bank Loans 7.9% 5Life premiums* 4.4% 7Non-life premiums* 2.4% 8
* Market share by volumes of new business.

Featured mainly by significant flexibility of interior premises, the new ČSOB headquarters is nearly as large as one third of the Wenceslas Square in Prague.


24
Company profile
ČSOB Profile
Československá obchodní banka, a. s. is a univer-sal bank operating in the Czech Republic. ČSOB was established by the state in 1964 as a bank to provide foreign trade financing and convertible currency operations. It was privatized in 1999 when KBC Bank, a member of the Belgium’s KBC Group, became the majority owner. ČSOB took over Investiční a Poštovní banka, a.s. in 2000. ČSOB had been active in both Czech and Slovak markets until 2007; the Slovak branch was sepa-rated as at 1 January 2008.
ČSOB’s business profile comprises the following segments: retail (individuals), SMEs, corporate and non-banking financial institutions, financial markets and private banking. ČSOB operates under two retail brands in the Czech Republic – ČSOB and Poštovní spořitelna (Postal Savings Bank – PSB); the latter uses a wide distribution network of Czech Post. To serve their clients, ČSOB has 222 branches in the Czech Republic while PSB uses 29 Financial Centers and approx. 3,330 post offices. In addition to its own products, ČSOB distributes a complete selection of products and services of the whole ČSOB Group. Both ČSOB and PSB also provide their services through various direct-banking channels.
The ČSOB Group is a leading player in Czech financial services industry. Combining the
power of its brands – ČSOB (banking, insurance, asset management, pension funds, leasing and factoring), the Postal Savings Bank (banking through the postal distribution network), Hypoteční banka and ČMSS (banks specialized in financing housing needs) – the ČSOB Group holds strong market positions in all segments of the Czech financial market. The ČSOB Group is a long-term number 1 in financing housing needs, leasing and total assets under management. Services related to trading on financial markets are provided by Patria, a sister company of ČSOB.
The ČSOB Group builds a strong, long-term partner-ship with each client, whether in personal and fam-ily finance, financing SMEs or corporate finance. The ČSOB Group is a good listener who offers suit-able solutions, rather than mere products.
KBC Group Profile
The ČSOB Group is a member of the KBC Group which was formed in early 2005 as a result of the merger of KBC Bank and Insurance Holding Company (which was created in 1998 through the merger, in Belgium, of ABB Insurance Group, the Almanij-Kredietbank Group and CERA Bank Group) and its parent company, Almanij. The group has three direct subsidiar-ies: KBC Bank, KBC Insurance and Kredietbank Luxembourgeoise.
About us

25
The KBC Group is a well capitalized, multi-chan-nel bancassurance group enjoying traditionally a strong market share position in Belgium. As at the end of 2007, its market capitalization reached 34 billion euros. KBC has successfully expanded its geographic reach over the last nine years to include Central and Eastern Europe and now already has a significant to even very
strong presence in the Czech Republic, Slovakia, Poland, Hungary, Bulgaria, Romania, Serbia and Russia. Via its minority share in NLB, it also has an indirect presence in Slovenia and other Balkan states. The group caters mainly for retail customers, small and medium-sized enterprises and private banking clientele, but is also active in corporate banking and market activities.
Main Central and Eastern European KBC Group companies and participations(as at 31 December 2007)
Country Banks and Insurance companies Interest percentage (direct and indirect)
Czech Republic ČSOB Bank 100 ČSOB Pojišťovna Insurance company 100Hungary K&H Bank Bank 100 K&H Insurance Insurance company 100Poland Kredyt Bank Bank 80 Warta Insurance company 100Slovakia ČSOB Bank See Czech Republic ČSOB Poisťovňa Insurance company 100Bulgaria Economic and Investment Bank Bank 75 DZI Insurance Insurance company 89Russia Absolut Bank Bank 95Serbia A Banka Bank 100Slovenia NLB Bank 34 NLB Life Insurance company 67
Some key figures for the KBC Group as at 31 December 2007 are given below.
KBC Group’s Key Data(as at 31 December 2007)
Total assets EUR bn 355.6Market capitalization EUR bn 34.2Net profit EUR bn 3.3Tier 1 ratio, banking activities (Basel II) % 8.7Solvency ratio, insurance activities % 265Headcount FTEs 57,000
Long-term ratings Fitch Moody’s S & P
KBC Bank AA- Aa2 AA-KBC Insurance AA - AA-
For more information please refer to the KBC’s corporate website www.kbc.com.
26
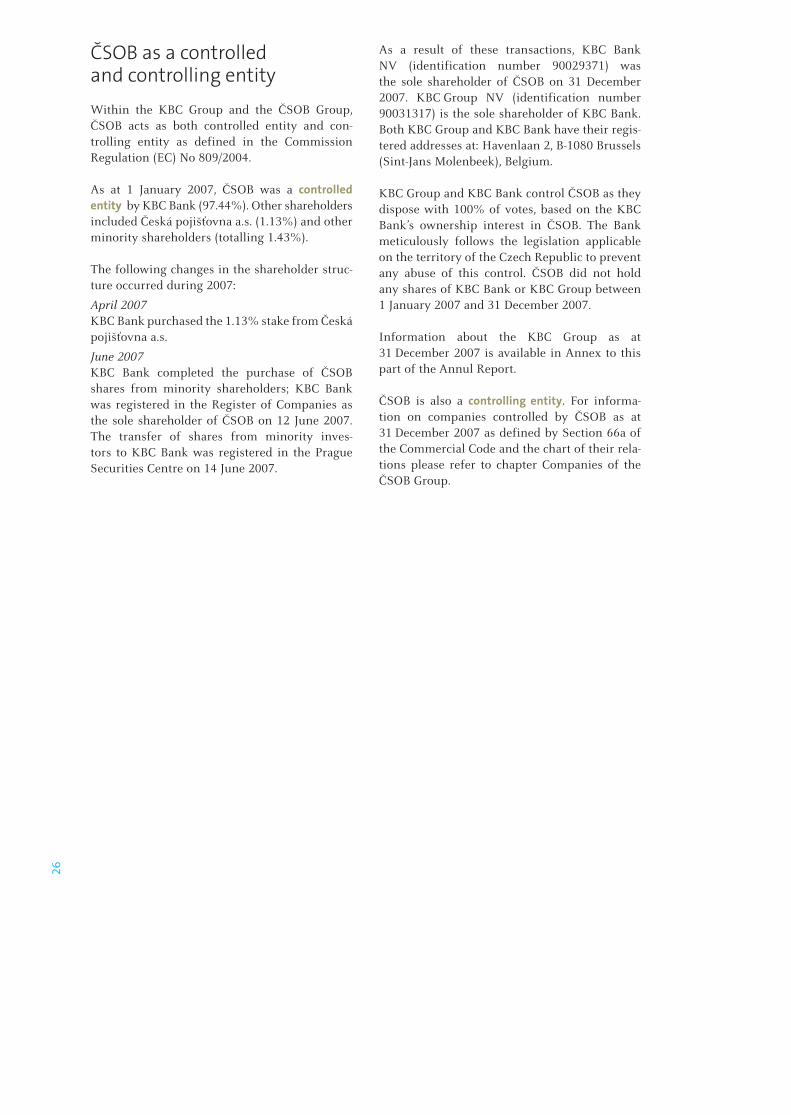
ČSOB as a controlled and controlling entity
Within the KBC Group and the ČSOB Group, ČSOB acts as both controlled entity and con-trolling entity as defined in the Commission Regulation (EC) No 809/2004.
As at 1 January 2007, ČSOB was a controlled entity by KBC Bank (97.44%). Other shareholders included Česká pojišťovna a.s. (1.13%) and other minority shareholders (totalling 1.43%).
The following changes in the shareholder struc-ture occurred during 2007:
April 2007KBC Bank purchased the 1.13% stake from Česká pojišťovna a.s.
June 2007KBC Bank completed the purchase of ČSOB shares from minority shareholders; KBC Bank was registered in the Register of Companies as the sole shareholder of ČSOB on 12 June 2007. The transfer of shares from minority inves-tors to KBC Bank was registered in the Prague Securities Centre on 14 June 2007.
As a result of these transactions, KBC Bank NV (identification number 90029371) was the sole shareholder of ČSOB on 31 December 2007. KBC Group NV (identification number 90031317) is the sole shareholder of KBC Bank. Both KBC Group and KBC Bank have their regis-tered addresses at: Havenlaan 2, B-1080 Brussels (Sint-Jans Molenbeek), Belgium.
KBC Group and KBC Bank control ČSOB as they dispose with 100% of votes, based on the KBC Bank’s ownership interest in ČSOB. The Bank meticulously follows the legislation applicable on the territory of the Czech Republic to prevent any abuse of this control. ČSOB did not hold any shares of KBC Bank or KBC Group between 1 January 2007 and 31 December 2007.
Information about the KBC Group as at 31 December 2007 is available in Annex to this part of the Annul Report.
ČSOB is also a controlling entity. For informa-tion on companies controlled by ČSOB as at 31 December 2007 as defined by Section 66a of the Commercial Code and the chart of their rela-tions please refer to chapter Companies of the ČSOB Group.
27
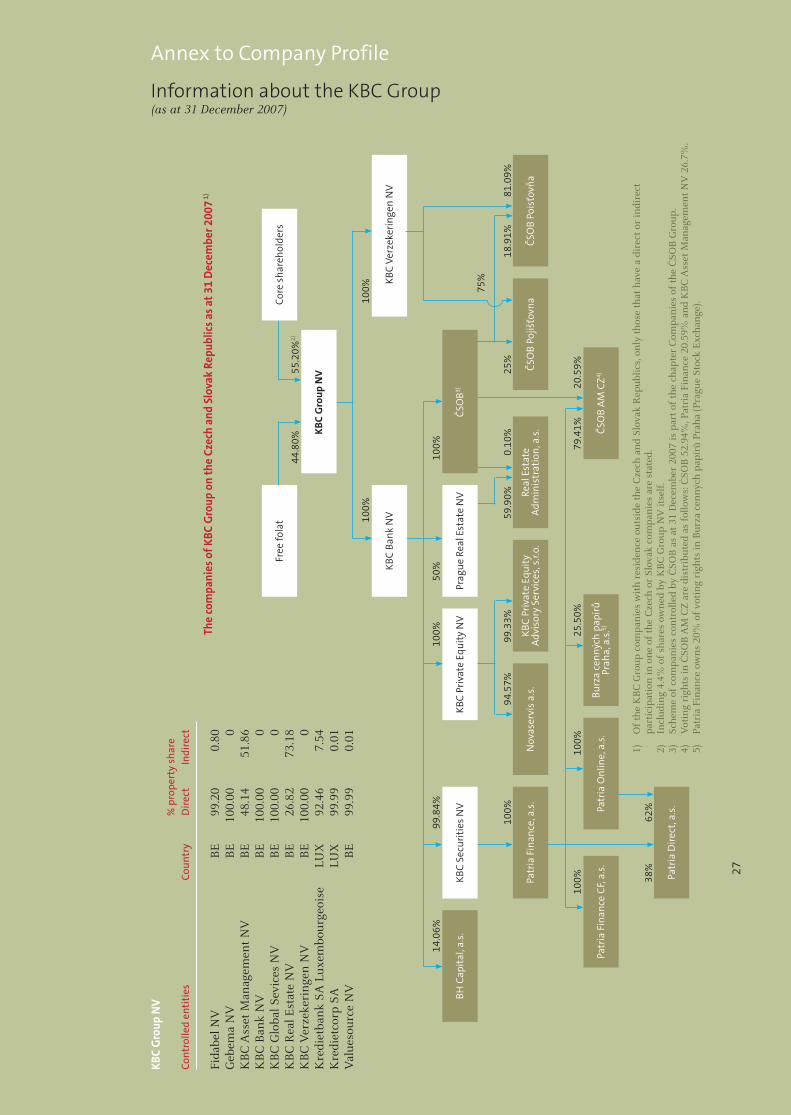
Annex to Company Profile
Information about the KBC Group (as at 31 December 2007)
KBC
Gro
up N
V
% p
rope
rty
shar
eCo
ntro
lled
enti
ties
Co
untr
y D
irec
t In
dire
ct
Fida
bel N
V
BE
99
.20
0.80
Geb
ema
NV
B
E
100.
00
0K
BC
Ass
et M
anag
emen
t N
V
BE
48
.14
51.8
6K
BC
Ban
k N
V
BE
10
0.00
0
KB
C G
loba
l Sev
ices
NV
B
E
100.
00
0K
BC
Rea
l Est
ate
NV
B
E
26.8
2 73
.18
KB
C V
erze
keri
nge
n N
V
BE
10
0.00
0
Kre
diet
ban
k SA
Lux
embo
urge
oise
LU
X
92.4
6 7.
54K
redi
etco
rp S
A
LUX
99
.99
0.01
Val
ueso
urce
NV
B
E
99.9
9 0.
01
1)
Of
the
KB
C G
roup
com
pan
ies
wit
h re
side
nce
out
side
the
Cze
ch a
nd
Slov
ak R
epub
lics,
on
ly t
hose
tha
t ha
ve a
dir
ect
or in
dire
ct
part
icip
atio
n in
on
e of
the
Cze
ch o
r Sl
ovak
com
pan
ies
are
stat
ed.
2)
Incl
udin
g 4.
4% o
f sh
ares
ow
ned
by
KB
C G
roup
NV
itse
lf.
3)
Sche
me
of c
ompa
nie
s co
ntr
olle
d by
ČSO
B a
s at
31
Dec
embe
r 20
07 is
par
t of
the
cha
pter
Com
pan
ies
of t
he Č
SOB
Gro
up.
4)
Vot
ing
righ
ts in
ČSO
B A
M C
Z a
re d
istr
ibut
ed a
s fo
llow
s: Č
SOB
52.
94%
, Pat
ria
Fin
ance
20.
59%
an
d K
BC
Ass
et M
anag
emen
t N
V 2
6.7%
. 5)
Pa
tria
Fin
ance
ow
ns
20%
of
voti
ng
righ
ts in
Bur
za c
enn
ých
papí
rů P
raha
(Pr
ague
Sto
ck E
xcha
nge
).
The
com
pani
es o
f KBC
Gro
up o
n th
e Cz
ech
and
Slov
ak R
epub
lics
as a
t 31
Dec
embe
r 200
7 1)
44.8
0%55
.20%
2)
100%
100%
14.0
6%99
.84%
100%
50%
100%
100%
94.5
7%99
.33%
59.9
0%25
%0.
10%
18.9
1%81
.09%
100%
100%
25.5
0%79
.41%
20.5
9%
38%
62%
75%
BH C
apit
al, a
.s.
Patr
ia F
inan
ce, a
.s.
Nov
aser
vis
a.s.
KBC
Priv
ate
Equi
ty
Adv
isor
y Se
rvic
es, s
.r.o.
Real
Est
ate
Adm
inis
trat
ion,
a.s
.ČS
OB
Pojiš
ťovn
a ČS
OB
Pois
ťovň
a
KBC
Priv
ate
Equi
ty N
V
KBC
V erz
eker
inge
n N
V
Patr
ia F
inan
ce C
F, a.
s.Pa
tria
Onl
ine,
a.s
.Bu
rza
cenn
ých
papí
rů
Prah
a, a
.s.5)
Patr
ia D
irect
, a.s
.
ČSO
B A
M C
Z4)
KBC
Secu
riti
es N
V
Free
fola
t
KBC
Gro
up N
V
Core
sha
reho
lder
s
ČSO
B3)Pr
ague
Rea
l Est
ate
NV
KBC
Bank
NV
27
28
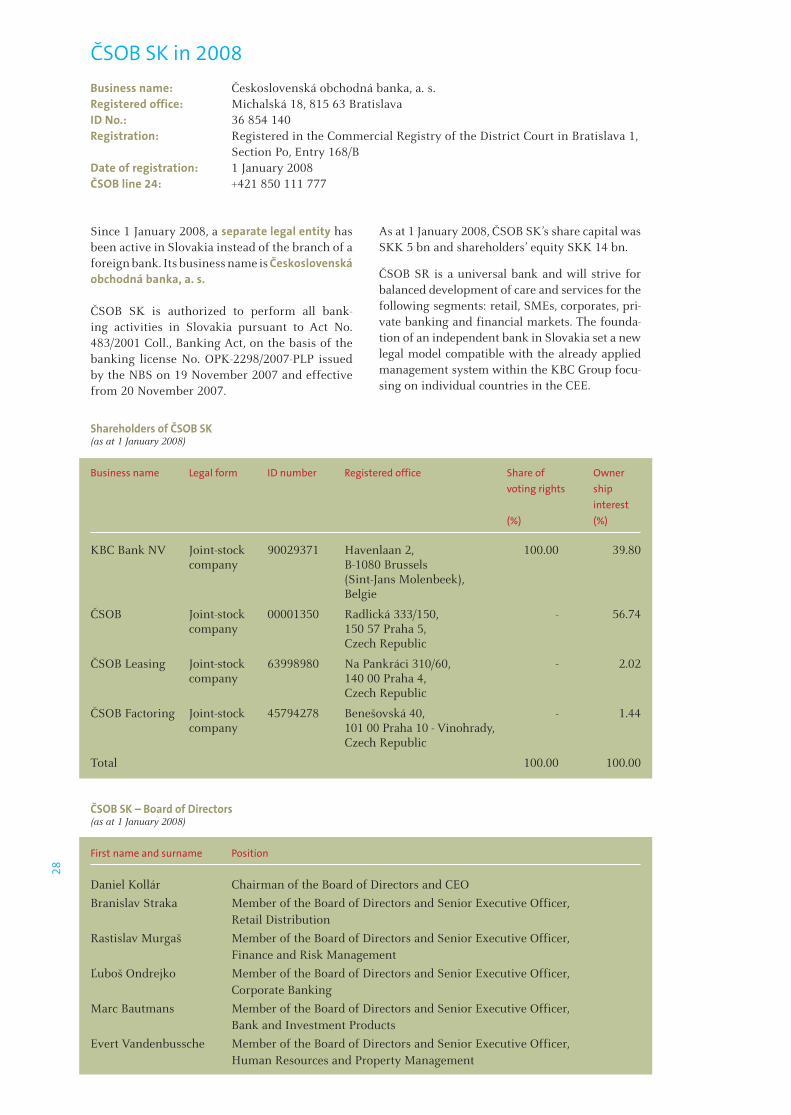
ČSOB SK in 2008Business name: Československá obchodná banka, a. s.Registered office: Michalská 18, 815 63 BratislavaID No.: 36 854 140Registration: Registered in the Commercial Registry of the District Court in Bratislava 1,
Section Po, Entry 168/BDate of registration: 1 January 2008ČSOB line 24: +421 850 111 777
Shareholders of ČSOB SK (as at 1 January 2008)
Business name Legal form ID number Registered office Share of Owner voting rights ship interest (%) (%)
KBC Bank NV Joint-stock 90029371 Havenlaan 2, 100.00 39.80 company B-1080 Brussels (Sint-Jans Molenbeek), Belgie
ČSOB Joint-stock 00001350 Radlická 333/150, - 56.74 company 150 57 Praha 5, Czech Republic
ČSOB Leasing Joint-stock 63998980 Na Pankráci 310/60, - 2.02 company 140 00 Praha 4, Czech Republic
ČSOB Factoring Joint-stock 45794278 Benešovská 40, - 1.44 company 101 00 Praha 10 - Vinohrady, Czech Republic
Total 100.00 100.00
ČSOB SK – Board of Directors (as at 1 January 2008)
First name and surname Position
Daniel Kollár Chairman of the Board of Directors and CEO
Branislav Straka Member of the Board of Directors and Senior Executive Officer, Retail Distribution
Rastislav Murgaš Member of the Board of Directors and Senior Executive Officer, Finance and Risk Management
Ľuboš Ondrejko Member of the Board of Directors and Senior Executive Officer, Corporate Banking
Marc Bautmans Member of the Board of Directors and Senior Executive Officer, Bank and Investment Products
Evert Vandenbussche Member of the Board of Directors and Senior Executive Officer, Human Resources and Property Management
Since 1 January 2008, a separate legal entity has been active in Slovakia instead of the branch of a foreign bank. Its business name is Československá obchodná banka, a. s.
ČSOB SK is authorized to perform all bank-ing activities in Slovakia pursuant to Act No. 483/2001 Coll., Banking Act, on the basis of the banking license No. OPK-2298/2007-PLP issued by the NBS on 19 November 2007 and effective from 20 November 2007.
As at 1 January 2008, ČSOB SK’s share capital was SKK 5 bn and shareholders’ equity SKK 14 bn.
ČSOB SR is a universal bank and will strive for balanced development of care and services for the following segments: retail, SMEs, corporates, pri-vate banking and financial markets. The founda-tion of an independent bank in Slovakia set a new legal model compatible with the already applied management system within the KBC Group focu-sing on individual countries in the CEE.
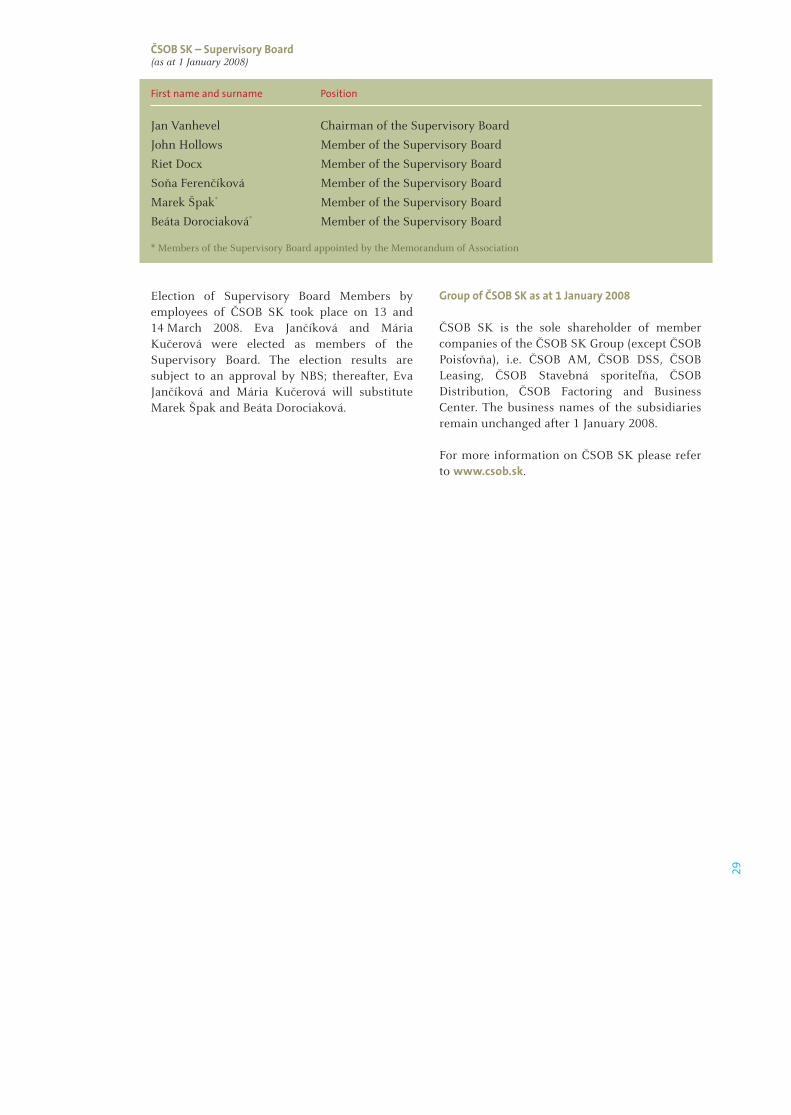
29
Election of Supervisory Board Members by employees of ČSOB SK took place on 13 and 14 March 2008. Eva Jančíková and Mária Kučerová were elected as members of the Supervisory Board. The election results are subject to an approval by NBS; thereafter, Eva Jančíková and Mária Kučerová will substitute Marek Špak and Beáta Dorociaková.
Group of ČSOB SK as at 1 January 2008
ČSOB SK is the sole shareholder of member companies of the ČSOB SK Group (except ČSOB Poisťovňa), i.e. ČSOB AM, ČSOB DSS, ČSOB Leasing, ČSOB Stavebná sporiteľňa, ČSOB Distribution, ČSOB Factoring and Business Center. The business names of the subsidiaries remain unchanged after 1 January 2008.
For more information on ČSOB SK please refer to www.csob.sk.
ČSOB SK – Supervisory Board (as at 1 January 2008)
First name and surname Position
Jan Vanhevel Chairman of the Supervisory Board
John Hollows Member of the Supervisory Board
Riet Docx Member of the Supervisory Board
Soňa Ferenčíková Member of the Supervisory Board
Marek Špak* Member of the Supervisory Board
Beáta Dorociaková* Member of the Supervisory Board
* Members of the Supervisory Board appointed by the Memorandum of Association

30
SustainabilityLast year, the sustainability programme in the ČSOB Group underwent many considerable changes. To find and offer solutions for social needs belong to the Group’s commercial interests. This is why issues related to the healthy development of the society became part of everyday decision-making. Sustainability is not understood as a concept out of touch with our business, but as its integral part.
A sustainability strategy, including the main priorities and decision-making powers, as it was clearly defined in 2007, aims at coherency and efficiency of each project. Having the rules laid out made it possible to perform numerous new activities attended by employees, customers and public. It is the Group’s intent to further develop these activities in the future. Additionally, a first Report on sustainability was issued. The 2007 report will be issued together with the Group’s Annual Report. For the first time, the Bank’s philanthropy activities were assessed by the Donors Forum pursuant to the internationally recognized London Benchmarking Group methodology.
What do we bring to our customers?
Customers play a key role in the ČSOB Group’s operations. They receive only unbiased and true information from well-trained advisors at points of sale. A high quality of the branch and advisory network is guaranteed by a comprehensive system of training courses and customer satisfaction surveys. With its responsible approach to financing the Group always strictly adheres to the principles of ethics in business.
The Group was the first in the Czech Republic to offer its customers Socially Responsible Funds through which the customers make investments in advanced environmental technologies and infrastructures that bring higher quality of life. Issuers must comply with strict economic and social criteria. These SRI funds are no charity activities. Quite the opposite, their revenues are at least comparable to standard funds and, in some cases, even higher.
Together with ČSOB, the public had a chance to support projects of non-profit organizations – to buy an image card from the series “We help” or paintings painted by children in the sales exhibition taking place in our Na Poříčí branch in Prague 1, and to vote in the Regional Support Programme.
Our employees are crucial for usThey are a backbone of the ČSOB Group’s activities and the employee care programme is one of the most important components of the sustainability
strategy. This is why the Group seeks to create an environment where the employees feel comfortably when carrying out their work duties. When recruited or assessed, each applicant receives full respect regardless of his/her gender, race, religion and belief. Not only to women does the Group offer suitable conditions to aid reconciliation of professional and private life, including part-time work, flexible working hours, etc. Moreover, a wide range of educational and training courses is available to all employees who can choose among them according to their specialization and needs.
We care for the environmentMoving of nearly 2,600 employees to our new, environmental-friendly new building in Prague - Radlice was one of the crucial events. In its approval process, ČSOB adopted Equators Principles launched by the World Bank and applied by the banking sector to set, assess and manage social and environmental risks in project financing. Furthermore, the Group finances renewable resource projects. Our care for the environment finds expression in our philanthropy projects as well.
Our communitySupport of education, especially financial literacy and integration of the socially and physically disadvantaged became the top priorities of our philanthropy support.
More than ten years of co-operation with the Education Fund by Good Will Committee – The Olga Havlová Foundation, make this project a tradition. So far, ČSOB has granted more than CZK 10 million to talented students. Extended co-operation with Ergotep, co-operative associating the physically impaired, enables Ergotep to provide Poštovní spořitelna with marketing and distribution services. To address financial literacy, an independent and specialized advisory project was launched with Citizen Advisory Offices focusing on personal finance, debt trap, the basics of finance etc.
The aim of the pilot Regional Support Programme was to extend the support rendered efficiently to regions. As the region always knows the best what the regional troubles are, the selection committee also listened to a voice of regional experience spoken by a representative of the Regional Authority. Encompassing eleven local projects of regional development, the Programme supported mainly integration of the physically and socially impaired and education.

31


Unconventional green areas and two ponds – one with aquatic plants and the other with pebble stones – constitute remarkable natural elements of the ground level.

34
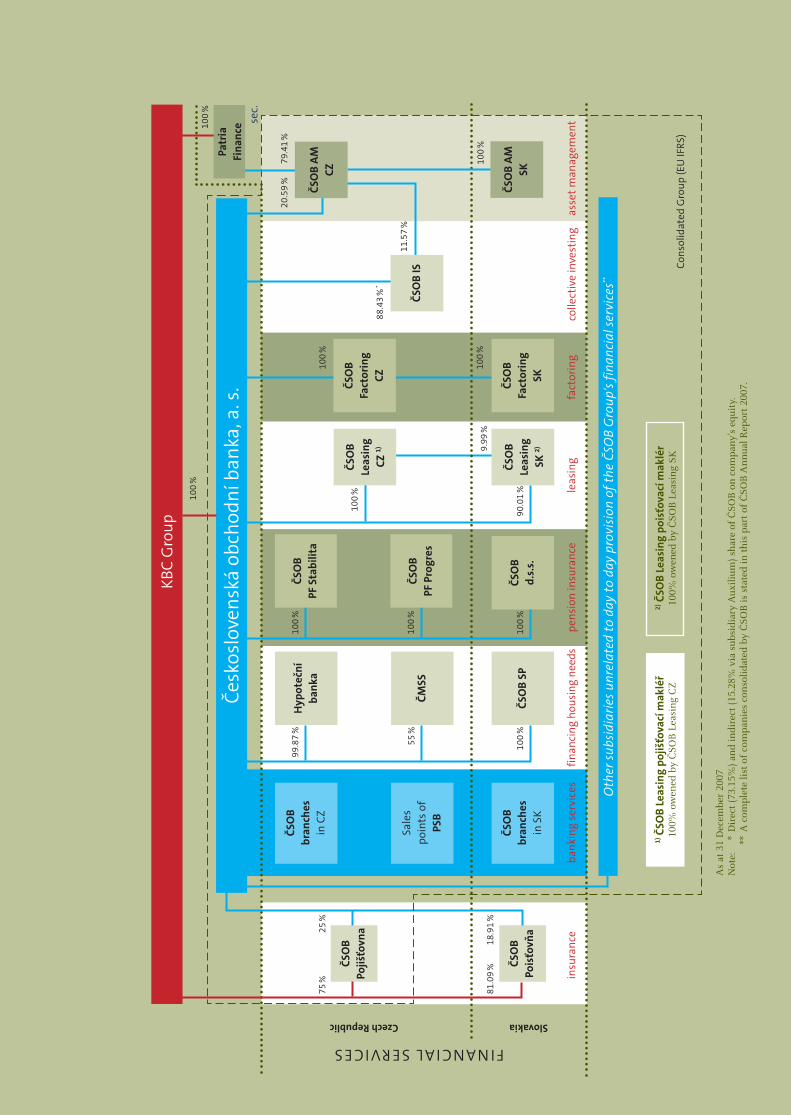
ČSOB GroupThe ČSOB Group operated in 2007 in the Czech Republic, but also in Slovakia. As at 31 December 2007, ČSOB had ownership interests in 41 legal entities and, in addition to ČSOB, other 37 companies were included in the group of con-solidated companies. There were 13 subsidiaries offering financial services. The scope of financial services rendered by ČSOB would not be com-plete without three affiliated companies – ČSOB Pojišťovna, ČSOB Poisťovňa and Patria Finance.
In 2007, Zemský PF merged with ČSOB PF Progres.
The ČSOB Group offers its clients the following types of services:
– Banking services – Building savings and mortgages – Pension insurance – Leasing – Factoring – Asset management – Collective investing – Securities trading – Insurance
Companies of the ČSOB Group
Cons
olid
ated
Gro
up (E
U IF
RS)
ČSO
B br
anch
esin
CZ
KBC
Gro
up
Česk
oslo
vens
ká o
bcho
dní b
anka
, a. s
.
Sale
s po
ints
of
PSB
ČSO
B br
anch
esin
SK
Hyp
oteč
ní
bank
a
ČMSS
ČSO
B SP
ČSO
B Le
asin
g SK
2)
Czech Republic Slovakia
ČSO
BPo
jišťo
vna
ČSO
BPo
isťo
vňa
75 %
81.0
9 %
25 %
18.9
1 %
99.8
7 %
55 %
100
%10
0 %
100
%
100
%
90.0
1 %
100
%
9.99
%
ČSO
B Fa
ctor
ing
CZ
100
%
100
%
100
%
As
at 3
1 D
ecem
ber
2007
Not
e:
* D
irec
t (7
3.15
%)
and
indi
rect
(15
.28%
via
sub
sidi
ary
Aux
ilium
) sh
are
of Č
SOB
on
com
pan
y’s
equi
ty.
**
A c
ompl
ete
list
of c
ompa
nie
s co
nso
lidat
ed b
y Č
SOB
is s
tate
d in
thi
s pa
rt o
f Č
SOB
An
nua
l Rep
ort
2007
.
bank
ing
serv
ices
finan
cing
hou
sing
nee
dspe
nsio
n in
sura
nce
leas
ing
fact
orin
gin
sura
nce
ČSO
B Fa
ctor
ing
SK
ČSO
B Le
asin
gCZ
1)
ČSO
Bd.
s.s.
ČSO
BPF
Sta
bilit
a
ČSO
BPF
Pro
gres
1) Č
SOB
Leas
ing
pojiš
ťova
cí m
aklé
ř10
0% o
wen
ed b
y Č
SOB
Lea
sin
g C
Z
2) Č
SOB
Leas
ing
pois
ťova
cí m
aklé
r10
0% o
wen
ed b
y Č
SOB
Lea
sin
g SK
FINANCIAL SERVICES
Oth
er s
ubsi
diar
ies
unre
late
d to
day
to
day
prov
isio
n of
the
ČSO
B G
roup
's fi
nanc
ial s
ervi
ces**
100
%
88.4
3 %
*
20.5
9 %
79.4
1 %
asse
t m
anag
emen
tco
llect
ive
inve
stin
g
100
%
sec.
11.5
7 %
Patr
ia
Fina
nce
ČSO
B A
MSK
ČSO
B A
MCZ
ČSO
B IS
36
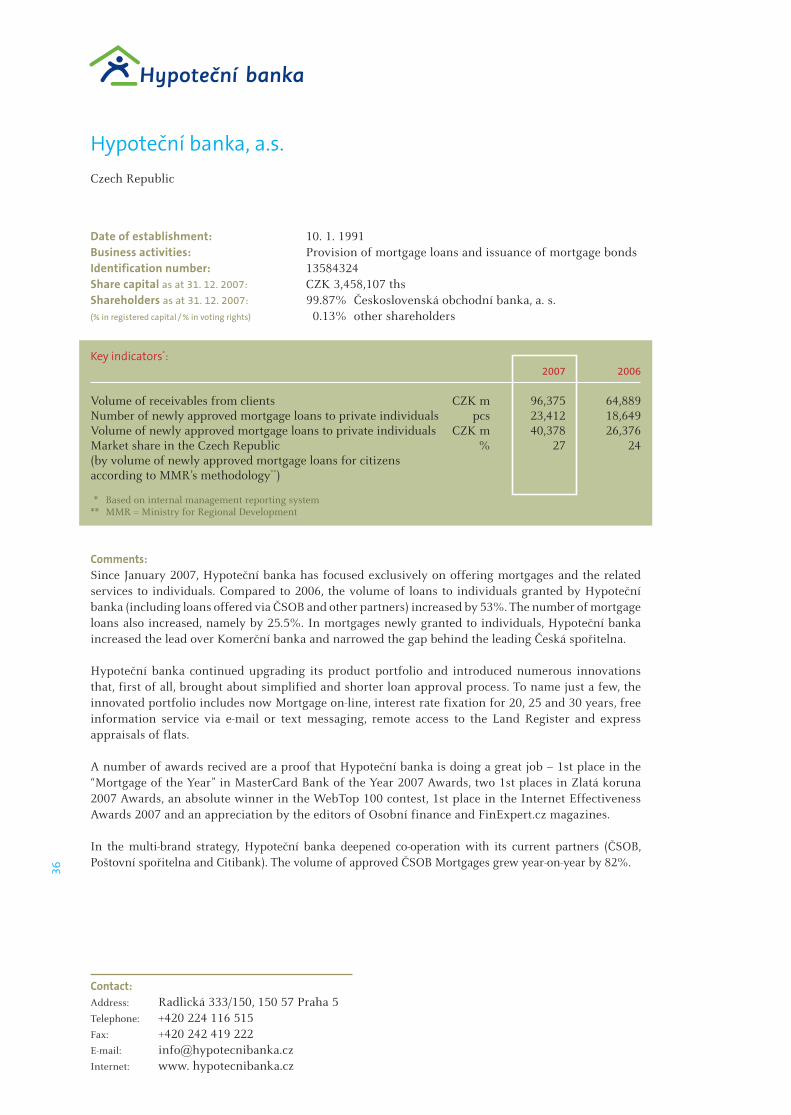
Contact:Address: Radlická 333/150, 150 57 Praha 5Telephone: +420 224 116 515Fax: +420 242 419 222E-mail: [email protected]: www. hypotecnibanka.cz
Hypoteční banka, a.s.Czech Republic
Date of establishment: 10. 1. 1991Business activities: Provision of mortgage loans and issuance of mortgage bondsIdentification number: 13584324Share capital as at 31. 12. 2007: CZK 3,458,107 thsShareholders as at 31. 12. 2007: 99.87% Československá obchodní banka, a. s.(% in registered capital / % in voting rights) 0.13% other shareholders
Key indicators*: 2007 2006
Volume of receivables from clients CZK m 96,375 64,889Number of newly approved mortgage loans to private individuals pcs 23,412 18,649Volume of newly approved mortgage loans to private individuals CZK m 40,378 26,376Market share in the Czech Republic % 27 24(by volume of newly approved mortgage loans for citizensaccording to MMR’s methodology**)
* Based on internal management reporting system** MMR = Ministry for Regional Development
Comments:Since January 2007, Hypoteční banka has focused exclusively on offering mortgages and the related services to individuals. Compared to 2006, the volume of loans to individuals granted by Hypoteční banka (including loans offered via ČSOB and other partners) increased by 53%. The number of mortgage loans also increased, namely by 25.5%. In mortgages newly granted to individuals, Hypoteční banka increased the lead over Komerční banka and narrowed the gap behind the leading Česká spořitelna.
Hypoteční banka continued upgrading its product portfolio and introduced numerous innovations that, first of all, brought about simplified and shorter loan approval process. To name just a few, the innovated portfolio includes now Mortgage on-line, interest rate fixation for 20, 25 and 30 years, free information service via e-mail or text messaging, remote access to the Land Register and express appraisals of flats.
A number of awards recived are a proof that Hypoteční banka is doing a great job – 1st place in the “Mortgage of the Year” in MasterCard Bank of the Year 2007 Awards, two 1st places in Zlatá koruna 2007 Awards, an absolute winner in the WebTop 100 contest, 1st place in the Internet Effectiveness Awards 2007 and an appreciation by the editors of Osobní finance and FinExpert.cz magazines.
In the multi-brand strategy, Hypoteční banka deepened co-operation with its current partners (ČSOB, Poštovní spořitelna and Citibank). The volume of approved ČSOB Mortgages grew year-on-year by 82%.
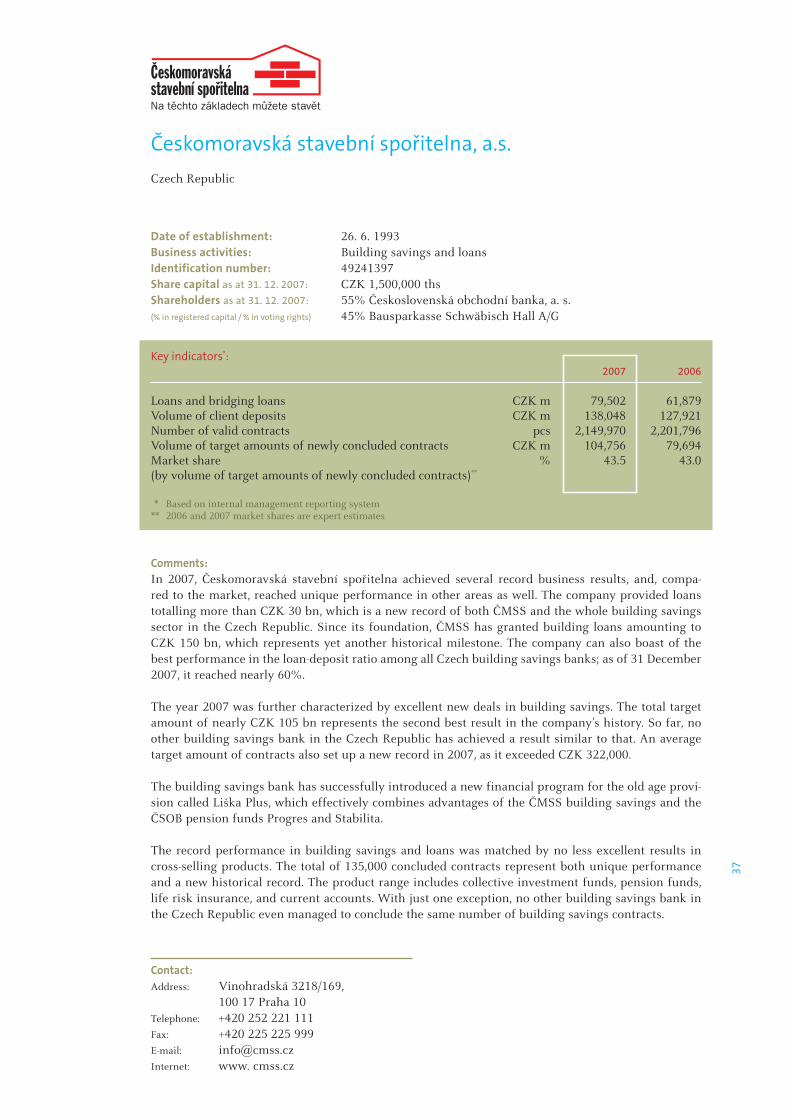
37
Contact:Address: Vinohradská 3218/169, 100 17 Praha 10Telephone: +420 252 221 111Fax: +420 225 225 999E-mail: [email protected]: www. cmss.cz
Českomoravská stavební spořitelna, a.s.Czech Republic
Date of establishment: 26. 6. 1993Business activities: Building savings and loansIdentification number: 49241397Share capital as at 31. 12. 2007: CZK 1,500,000 thsShareholders as at 31. 12. 2007: 55% Československá obchodní banka, a. s.(% in registered capital / % in voting rights) 45% Bausparkasse Schwäbisch Hall A/G
Key indicators*: 2007 2006
Loans and bridging loans CZK m 79,502 61,879Volume of client deposits CZK m 138,048 127,921Number of valid contracts pcs 2,149,970 2,201,796Volume of target amounts of newly concluded contracts CZK m 104,756 79,694Market share % 43.5 43.0(by volume of target amounts of newly concluded contracts)**
* Based on internal management reporting system** 2006 and 2007 market shares are expert estimates
Comments:In 2007, Českomoravská stavební spořitelna achieved several record business results, and, compa-red to the market, reached unique performance in other areas as well. The company provided loans totalling more than CZK 30 bn, which is a new record of both ČMSS and the whole building savings sector in the Czech Republic. Since its foundation, ČMSS has granted building loans amounting to CZK 150 bn, which represents yet another historical milestone. The company can also boast of the best performance in the loan-deposit ratio among all Czech building savings banks; as of 31 December 2007, it reached nearly 60%.
The year 2007 was further characterized by excellent new deals in building savings. The total target amount of nearly CZK 105 bn represents the second best result in the company’s history. So far, no other building savings bank in the Czech Republic has achieved a result similar to that. An average target amount of contracts also set up a new record in 2007, as it exceeded CZK 322,000.
The building savings bank has successfully introduced a new financial program for the old age provi-sion called Liška Plus, which effectively combines advantages of the ČMSS building savings and the ČSOB pension funds Progres and Stabilita.
The record performance in building savings and loans was matched by no less excellent results in cross-selling products. The total of 135,000 concluded contracts represent both unique performance and a new historical record. The product range includes collective investment funds, pension funds, life risk insurance, and current accounts. With just one exception, no other building savings bank in the Czech Republic even managed to conclude the same number of building savings contracts.
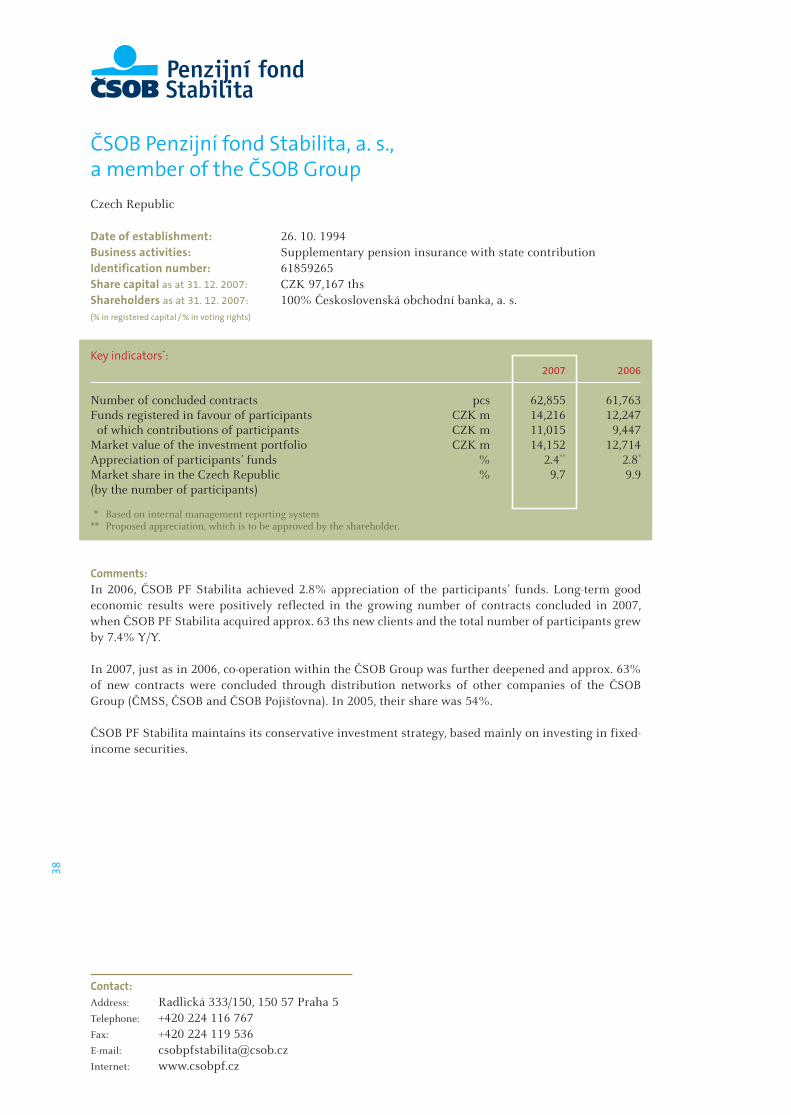
38
Contact:Address: Radlická 333/150, 150 57 Praha 5Telephone: +420 224 116 767Fax: +420 224 119 536E-mail: [email protected]: www.csobpf.cz
ČSOB Penzijní fond Stabilita, a. s., a member of the ČSOB GroupCzech Republic
Date of establishment: 26. 10. 1994Business activities: Supplementary pension insurance with state contributionIdentification number: 61859265Share capital as at 31. 12. 2007: CZK 97,167 thsShareholders as at 31. 12. 2007: 100% Československá obchodní banka, a. s.(% in registered capital / % in voting rights)
Key indicators*: 2007 2006
Number of concluded contracts pcs 62,855 61,763Funds registered in favour of participants CZK m 14,216 12,247 of which contributions of participants CZK m 11,015 9,447Market value of the investment portfolio CZK m 14,152 12,714Appreciation of participants’ funds % 2.4** 2.8*
Market share in the Czech Republic % 9.7 9.9(by the number of participants)
* Based on internal management reporting system** Proposed appreciation, which is to be approved by the shareholder.
Comments:In 2006, ČSOB PF Stabilita achieved 2.8% appreciation of the participants’ funds. Long-term good economic results were positively reflected in the growing number of contracts concluded in 2007, when ČSOB PF Stabilita acquired approx. 63 ths new clients and the total number of participants grew by 7.4% Y/Y.
In 2007, just as in 2006, co-operation within the ČSOB Group was further deepened and approx. 63% of new contracts were concluded through distribution networks of other companies of the ČSOB Group (ČMSS, ČSOB and ČSOB Pojišťovna). In 2005, their share was 54%.
ČSOB PF Stabilita maintains its conservative investment strategy, based mainly on investing in fixed-income securities.

39
Contact:Address: Radlická 333/150, 150 57 Praha 5Telephone: +420 224 116 766Fax: +420 224 119 541E-mail: [email protected]: www.csobpf.cz
ČSOB Penzijní fond Progres, a. s.,a member of the ČSOB GroupCzech Republic
Date of establishment: 14. 2. 1995Business activities: Supplementary pension insurance with state contributionIdentification number: 60917776Share capital as at 31. 12. 2007: CZK 120,000 thsShareholders as at 31. 12. 2007: 100% Československá obchodní banka, a. s.(% in registered capital / % in voting rights)
Key indicators*: 2007 2006
Number of concluded contracts pcs 62,738 64,649Funds registered in favour of participants CZK m 5,466 3,383 of which contributions of participants CZK m 4,432 2,786Market value of the investment portfolio CZK m 5,393 3,437Appreciation of participants’ funds % 2.4** 2.3Market share in the Czech Republic % 5.7 4.4(by the number of participants)
* Based on internal management reporting system** Proposed appreciation, which is to be approved by the shareholder.
Comments:For the period of years 2002 to 2006, ČSOB PF Progres achieved the highest average appreciation of the clients’ funds in the supplementary pension insurance market. This performance also resulted in the growth of contracts concluded in 2007. ČSOB PF Progres acquired approx. 63 ths new clients (mainly thanks to co-operation with ČMSS) and increased its market share by 1.3% measured by the number of participants, which ranks ČSOB PF Progres among the fastest growing pension funds in the market.
As in previous years, when ČSOB PF Progres won a number of prestigious awards (1st place in Zlatá koruna 2006 award, 2nd place in the Zlatý Měšec 2006 poll), last year ČSOB PF Progres took 1st place in Zlatá koruna 2007 award for the best pension fund.
During 2007, Zemský PF merged with ČSOB PF Progres. The merger was successfully completed with registration in the Register of Companies on 31 December 2007. As at the date of the merger, Zemský PF had 13,737 clients and managed funds registered in favour of participants in the amount of CZK 631 m.
ČSOB PF Progres applies a dynamic investment strategy focusing mainly on young clients, where the length of savings is supposed to be longer.
40
Contact:Address: Na Pankráci 310/60, 140 00 Praha 4Telephone: +420 222 012 111Fax: +420 271 128 027E-mail: [email protected]: www.csobleasing.cz
ČSOB Leasing, a.s.Czech Republic
Date of establishment: 31. 10. 1995Business activities: Financial services (financial and operational leasing, customer
credits, hire-purchase)Identification number: 63998980Share capital as at 31. 12. 2007: CZK 3,000,000 thsShareholders as at 31. 12. 2007: 100% Československá obchodní banka, a. s.(% in registered capital / % in voting rights)
Key indicators*: 2007 2006
Volume of new leasing turnover in the Czech Republic CZK m 25,450 21,625Number of concluded contracts in the Czech Republic pcs 39,280 32,431Relevant market share in the Czech Republic measured % 15.51 15.72by volume of transactions**
* Based on internal management reporting system** The overall market includes the leasing market of movables and the relevant market of hire-purchase and consumer loans.
Comments:ČSOB Leasing CZ is the most significant leasing company with a nation wide branch network. Since 2001, ČSOB Leasing CZ has been a stable leader of the leasing market with the highest market share. In 2007, the company increased again its lead over the main peers in the leasing market.
ČSOB Leasing CZ provides financing of all types of new and used cars (passenger cars, utility cars and lorries), motorcycles and machines, equipment, capital equipment and information technologies.
ČSOB Leasing CZ provides its clients from the group of both private individuals and corporate entities with a complete range of financial products: financial leasing, consumer loan, hire purchase and opera-ting leasing (including Full service leasing, Fleet management and LeaseBack). All ČSOB Leasing’s pro-ducts are offered with corresponding services, in particular complete insurance.
ČSOB Leasing CZ is the only universal leasing company in the Czech leasing market to hold the inter-nationally recognized ISO 9001:2000 certificate.
41
Contact:Address: Benešovská 2538/40, 101 00 Praha 10Telephone: +420 267 184 805Fax: +420 267 184 822E-mail: [email protected]: www.csobfactoring.cz
ČSOB Factoring, a.s.Czech Republic
Date of establishment: 16. 7. 1992Business activities: FactoringIdentification number: 45794278Share capital as at 31. 12. 2007: CZK 70,800 thsShareholders as at 31. 12. 2007: 100% Československá obchodní banka, a. s.(% in registered capital / % in voting rights)
Key indicators*: 2007 2006
Turnover of receivables CZK bn 27.1 19.5Market share in the Czech Republic % 21.3 18.6(by turnover of factoring receivables)
* Based on internal management reporting system
Comments:In 2007, ČSOB Factoring CZ succeeded in accelerating the rise of turnover and, compared to 2006, increased this basic indicator by almost 40%. The outstanding business result is positively reflected in the income statement and the achieved profit of CZK 145.34 m (according to CAS) is record-breaking in the company’s history. The reported turnover was a comeback to the leading position on the market made after ages. The increase of market share combined with traditional profitability maintained shows the ability to keep high standard of services provided, take the advantage of synergy within the Group and have a good control of risk at the same time.
At the end of 2007, ČSOB Factoring CZ financed approximately 300 clients with almost CZK 4 bn. Within the ČSOB Group, ČSOB Factoring CZ serves entrepreneurs who look for a suitable alternative to standard banking products or use additional services in the area of management of receivables and securing of risk . Traditional factoring financing provided on the basis of assignation of receivables is often combined with additional sources and ČSOB Factoring CZ, therefore, offers its clients compre-hensive financial solutions.
42
Contact:Address: Radlická 333/150, 150 57 Praha 5Telephone: +420 224 116 702Fax: +420 224 119 548E-mail: [email protected]: www.csobam.cz
ČSOB Asset Management, a.s., a member of the ČSOB GroupCzech Republic
Date of establishment: 31. 12. 1995Business activities: Client asset managementIdentification number: 63999463Share capital as at 31. 12. 2007: CZK 34,000 thsShareholders as at 31. 12. 2007: (% in registered capital) 79.41% Patria Finance, a.s. 20.59% Československá obchodní banka, a. s.
(% in voting rights) 20.59% Patria Finance, a.s. 52.94% Československá obchodní banka, a. s. 26.47% KBC Asset Management NV
Key indicators: 2007 2006
Assets under management* CZK bn 105.5 85.8
* Volume of assets according to AKAT methodology (institutions, private individuals and foreign funds)
Comments:ČSOB AM CZ provides its clients with investment services of securities management and is one of the leading companies in this market. Among clients of the company are insurance companies, pen-sion funds, municipalities, trading, production and energy companies, trade unions, foundations and other non-profit companies and also private individuals. The company also manages assets of specific foreign funds from the KBC Group.
In 2007, the volume of managed assets grew in all segments mainly thanks to the ability to offer clients sophisticated “tailor-made” services. The highest growth dynamics of assets under management was recorded in the segment of small and medium enterprises with annual growth over 50%.
ČSOB AM CZ also established ČSOB Property fund, a fund of qualified investors, with a strategy of direct investments in first-class commercial real estate in Central and Eastern Europe. The first invest-ment made by the fund was the PWC Business Community Center in Prague worth approximately EUR 35 m. In 2007, the company paid out dividends to shareholders amounting to CZK 95 m.
43
Contact:Address: Radlická 333/150, 150 57 Praha 5Telephone: +420 224 116 702Fax: +420 224 119 548E-mail: [email protected]: www.csobinvest.cz
ČSOB Investiční společnost, a.s., a member of the ČSOB GroupCzech Republic
Date of establishment: 3. 7. 1998 (transformed from O.B. INVEST, investiční společnost, spol. s r.o.)Business activities: Collective investmentIdentification number: 25677888Share capital as at 31. 12. 2007: CZK 216,000 thsShareholders as at 31. 12. 2007: (% in registered capital ) 73.15% Československá obchodní banka, a. s. 15.28% Auxilium, a.s. 11.57% ČSOB Asset Management, a.s.,
a member of the ČSOB Group
(% in voting rights) 84.72% ČSOB Asset Management, a.s., a member of the ČSOB Group
15.28% Auxilium, a.s.
Key indicators*: 2007 2006
Volume of assets under management** CZK bn 12.4 12.6Volume of assets in foreign funds*** CZK bn 79.6 61.3
* Based on internal management reporting system ** Incl. local (Czech) open ended funds offered by ČSOB IS*** Incl. foreign funds distributed by ČSOB Group in the Czech Republic
Comments:ČSOB IS is a significant company managing open ended funds. Since 1 January 2007, the company has been a distributor of KBC funds for the Czech Republic and has participated in product development for the whole ČSOB Group CZ. This also enables to strengthen synergies throughout the KBC Group.
In 2007, ČSOB IS continued strengthening its position in the market of open ended funds and con-firmed its role of the main innovator especially in guaranteed funds. The company introduced two new funds: ČSOB akciový fond – Střední a Východní Evropa and ČSOB korporátní fond. ČSOB IS in cooperation with KBC AM introduced 8 new funds and 66 guaranteed funds.
In 2007, the company paid out dividends to shareholders in the amount of CZK 150 m.
A list of funds managed by ČSOB IS as at 31 December 2007: ČSOB bond mix, ČSOB akciový mix, ČSOB bohatství, ČSOB středoevropský, ČSOB nadační, ČSOB dluhopisových příležitostí, ČSOB realitní mix, ČSOB bytových družstev, ČSOB korporátní, ČSOB akciový fond – Střední a Východní Evropa, ČSOB Property fund.
44
Contact:Address: Jungmannova 24, 110 00 Praha 1Telephone: +420 221 424 111Fax: +420 221 424 222E-mail: [email protected]: www.patria.cz
Patria Finance, a.s.Czech Republic
Date of establishment: 23. 5. 1994Business activities: Securities trading and consultancy services in the field of corporate financeIdentification number: 60197226Share capital as at 31. 12. 2007: CZK 100,000 thsShareholders as at 31. 12. 2007: 100% KBC Securities NV(% in registered capital / % in voting rights)
Comments:The scope of business performed by Patria Finance, a.s. and its subsidiaries (Patria Online, a.s., Patria Direct, a.s. and Patria Finance CF, a.s.) comprises investment banking, including securities trading and consultancy in management and financing of companies. Broker services for clients are offered via an Internet portal. The Patria Group conducts its own financial research and provides information from the financial market through the Internet portal at www.patria.cz .
In 2007, security trading focused exclusively on stock markets. Patria Finance maintained a leading position in the volume of shares trades carried out on the Prague Stock Exchange and further increa-sed the volume of trading in foreign securities.
Income from advisory services for mergers and acquisitions increased significantly in 2007. Patria was a lead manager for several IPOs on domestic and foreign capital markets.
In 2007, consolidated net profit of the Patria Group exceeded CZK 230 m. The number of clients for whom securities trading is mediated via Internet exceeded 7,800.
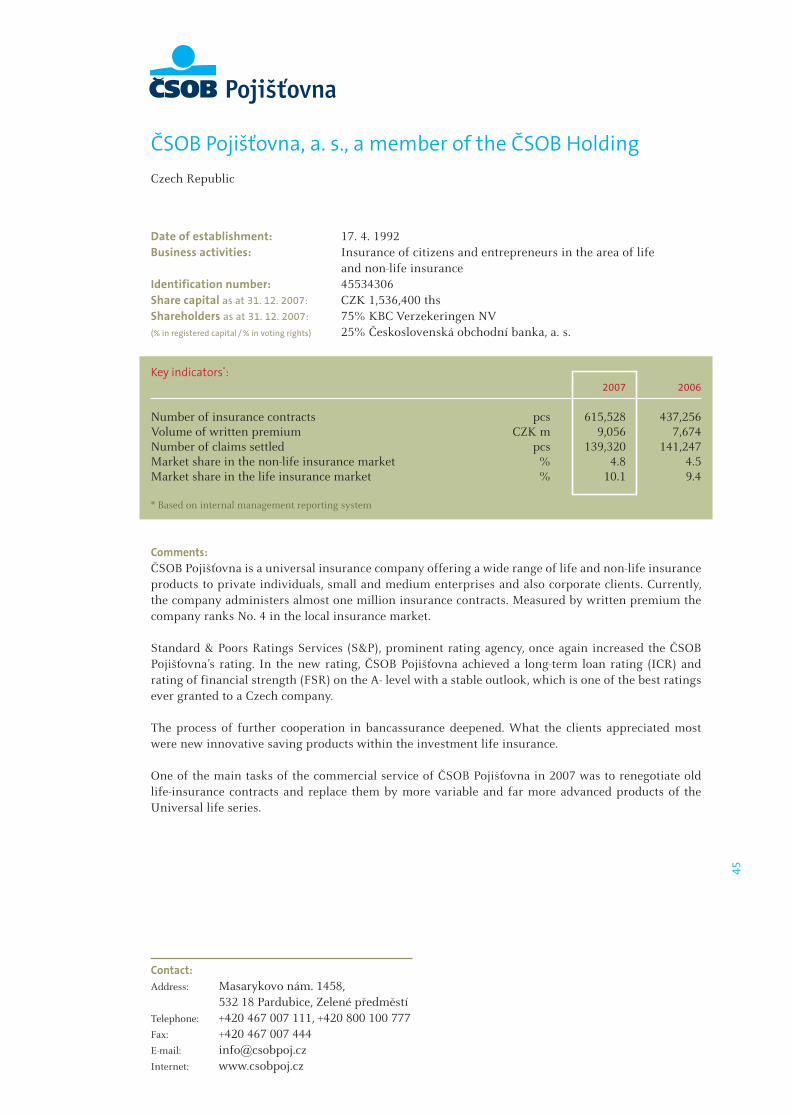
45
Contact:Address: Masarykovo nám. 1458, 532 18 Pardubice, Zelené předměstíTelephone: +420 467 007 111, +420 800 100 777Fax: +420 467 007 444E-mail: [email protected]: www.csobpoj.cz
ČSOB Pojišťovna, a. s., a member of the ČSOB HoldingCzech Republic
Date of establishment: 17. 4. 1992Business activities: Insurance of citizens and entrepreneurs in the area of life and non-life insuranceIdentification number: 45534306Share capital as at 31. 12. 2007: CZK 1,536,400 thsShareholders as at 31. 12. 2007: 75% KBC Verzekeringen NV(% in registered capital / % in voting rights) 25% Československá obchodní banka, a. s.
Key indicators*: 2007 2006
Number of insurance contracts pcs 615,528 437,256Volume of written premium CZK m 9,056 7,674Number of claims settled pcs 139,320 141,247Market share in the non-life insurance market % 4.8 4.5Market share in the life insurance market % 10.1 9.4
* Based on internal management reporting system
Comments:ČSOB Pojišťovna is a universal insurance company offering a wide range of life and non-life insurance products to private individuals, small and medium enterprises and also corporate clients. Currently, the company administers almost one million insurance contracts. Measured by written premium the company ranks No. 4 in the local insurance market.
Standard & Poors Ratings Services (S&P), prominent rating agency, once again increased the ČSOB Pojišťovna’s rating. In the new rating, ČSOB Pojišťovna achieved a long-term loan rating (ICR) and rating of financial strength (FSR) on the A- level with a stable outlook, which is one of the best ratings ever granted to a Czech company.
The process of further cooperation in bancassurance deepened. What the clients appreciated most were new innovative saving products within the investment life insurance.
One of the main tasks of the commercial service of ČSOB Pojišťovna in 2007 was to renegotiate old life-insurance contracts and replace them by more variable and far more advanced products of the Universal life series.
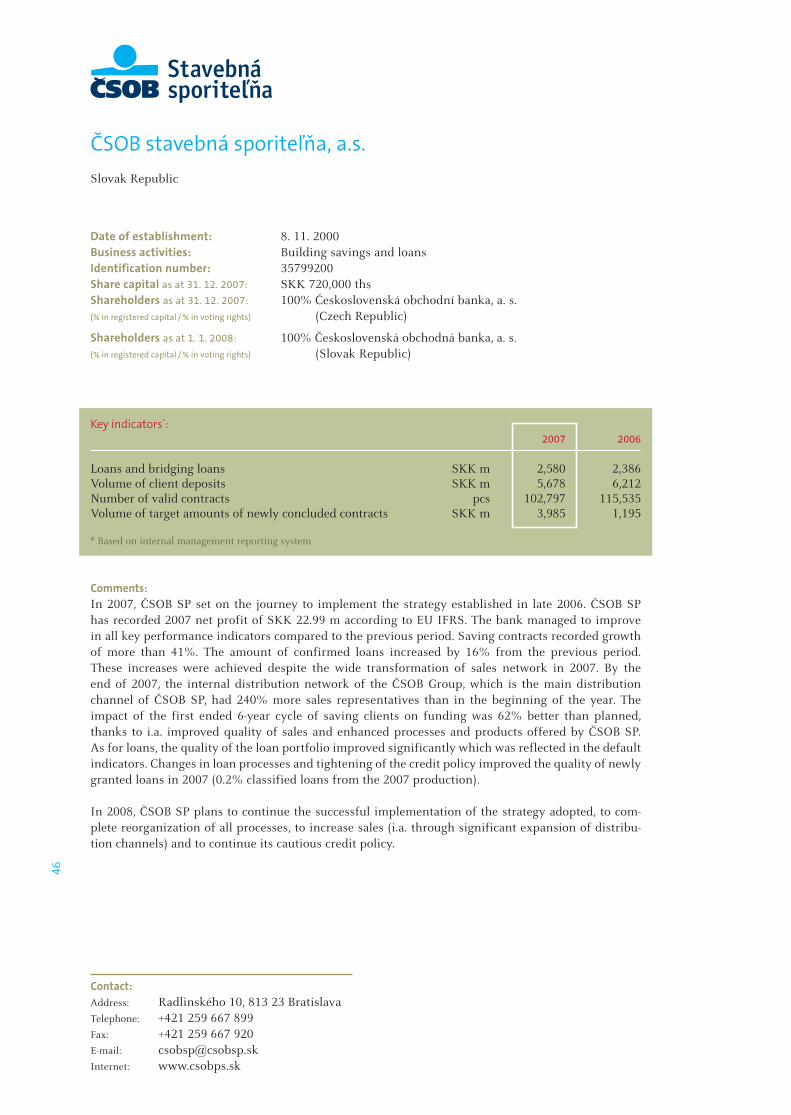
46
Contact:Address: Radlinského 10, 813 23 BratislavaTelephone: +421 259 667 899Fax: +421 259 667 920E-mail: [email protected]: www.csobps.sk
ČSOB stavebná sporiteľňa, a.s.Slovak Republic
Date of establishment: 8. 11. 2000Business activities: Building savings and loansIdentification number: 35799200Share capital as at 31. 12. 2007: SKK 720,000 thsShareholders as at 31. 12. 2007: 100% Československá obchodní banka, a. s. (% in registered capital / % in voting rights) (Czech Republic)
Shareholders as at 1. 1. 2008: 100% Československá obchodná banka, a. s. (% in registered capital / % in voting rights) (Slovak Republic)
Key indicators*: 2007 2006
Loans and bridging loans SKK m 2,580 2,386Volume of client deposits SKK m 5,678 6,212Number of valid contracts pcs 102,797 115,535Volume of target amounts of newly concluded contracts SKK m 3,985 1,195
* Based on internal management reporting system
Comments:In 2007, ČSOB SP set on the journey to implement the strategy established in late 2006. ČSOB SP has recorded 2007 net profit of SKK 22.99 m according to EU IFRS. The bank managed to improve in all key performance indicators compared to the previous period. Saving contracts recorded growth of more than 41%. The amount of confirmed loans increased by 16% from the previous period. These increases were achieved despite the wide transformation of sales network in 2007. By the end of 2007, the internal distribution network of the ČSOB Group, which is the main distribution channel of ČSOB SP, had 240% more sales representatives than in the beginning of the year. The impact of the first ended 6-year cycle of saving clients on funding was 62% better than planned, thanks to i.a. improved quality of sales and enhanced processes and products offered by ČSOB SP. As for loans, the quality of the loan portfolio improved significantly which was reflected in the default indicators. Changes in loan processes and tightening of the credit policy improved the quality of newly granted loans in 2007 (0.2% classified loans from the 2007 production).
In 2008, ČSOB SP plans to continue the successful implementation of the strategy adopted, to com-plete reorganization of all processes, to increase sales (i.a. through significant expansion of distribu-tion channels) and to continue its cautious credit policy.
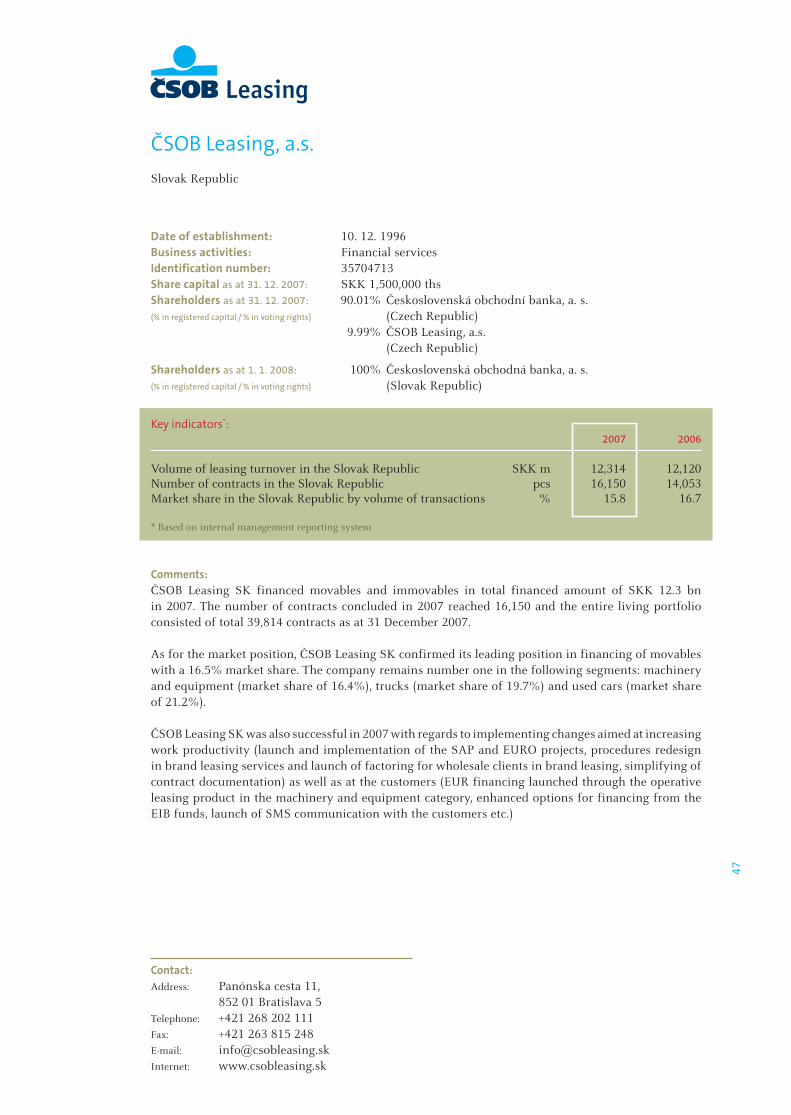
47
Contact:Address: Panónska cesta 11, 852 01 Bratislava 5Telephone: +421 268 202 111Fax: +421 263 815 248E-mail: [email protected]: www.csobleasing.sk
ČSOB Leasing, a.s.Slovak Republic
Date of establishment: 10. 12. 1996Business activities: Financial servicesIdentification number: 35704713Share capital as at 31. 12. 2007: SKK 1,500,000 thsShareholders as at 31. 12. 2007: 90.01% Československá obchodní banka, a. s.(% in registered capital / % in voting rights) (Czech Republic) 9.99% ČSOB Leasing, a.s.
(Czech Republic)
Shareholders as at 1. 1. 2008: 100% Československá obchodná banka, a. s.(% in registered capital / % in voting rights) (Slovak Republic)
Key indicators*: 2007 2006
Volume of leasing turnover in the Slovak Republic SKK m 12,314 12,120Number of contracts in the Slovak Republic pcs 16,150 14,053Market share in the Slovak Republic by volume of transactions % 15.8 16.7
* Based on internal management reporting system
Comments:ČSOB Leasing SK financed movables and immovables in total financed amount of SKK 12.3 bn in 2007. The number of contracts concluded in 2007 reached 16,150 and the entire living portfolio consisted of total 39,814 contracts as at 31 December 2007.
As for the market position, ČSOB Leasing SK confirmed its leading position in financing of movables with a 16.5% market share. The company remains number one in the following segments: machinery and equipment (market share of 16.4%), trucks (market share of 19.7%) and used cars (market share of 21.2%).
ČSOB Leasing SK was also successful in 2007 with regards to implementing changes aimed at increasing work productivity (launch and implementation of the SAP and EURO projects, procedures redesign in brand leasing services and launch of factoring for wholesale clients in brand leasing, simplifying of contract documentation) as well as at the customers (EUR financing launched through the operative leasing product in the machinery and equipment category, enhanced options for financing from the EIB funds, launch of SMS communication with the customers etc.)

48
Contact:Address: Gagarinova 7/a, 821 03 BratislavaTelephone: +421 248 208 001 (operator)Fax: +421 243 415 590E-mail: [email protected]: www.csobfactoring.sk
ČSOB Factoring a.s.Slovak Republic
Date of establishment: 24. 2. 1997Business activities: FactoringIdentification number: 35710063Share capital as at 31. 12. 2007: SKK 30,000 thsStruktura vlastníků k 31. 12. 2007: 100% ČSOB Factoring, a.s. (% in registered capital / % in voting rights) (Czech Republic)
Shareholders as at 1. 1. 2008: 100% Československá obchodná banka, a. s. (% in registered capital / % in voting rights) (Slovak Republic)
Key indicators*: 2007 2006
Turnover of receivables SKK m 4,123 4,270Market share in the Slovak Republic % 8.9 9.5(by total turnover of receivables)
* Based on internal management reporting system
Comments:ČSOB Factoring SK provides its clients with modern financial services relating to financing and com-prehensive management of receivables. Domestic recourse factoring remains the main product. The services provided as a standard also include export factoring, services connected with taking over risk of customer insolvency and solutions tailored to clients’ needs.
In 2007, the company reported turnover of assigned receivables from factoring transactions in the amount of SKK 4,123 m. The company ranked fifth in the Slovak factoring market with a 8.9% share.
The company is using a highly sophisticated information system FACTORLINK, which allows clients to have on-line access to open receivables, surveys of payments etc.
49
Contact:Address: Kolárska 6, 815 63 BratislavaTelephone: +421 800 123 723Fax: +421 252 962 769E-mail: [email protected]: www.csobdss.sk
ČSOB d.s.s., a.s.Slovak Republic
Date of establishment: 20. 10. 2004Business activities: Pension savingsIdentification number: 35904305Share capital as at 31. 12. 2007: SKK 360,000 thsShareholders as at 31. 12. 2007: 100% Československá obchodní banka, a. s. (% in registered capital / % in voting rights) (Czech Republic)
Shareholders as at 1. 1. 2008: 100% Československá obchodná banka, a. s. (% in registered capital / % in voting rights) (Slovak Republic)
Key indicators*: 2007 2006
Assets under management SKK m 2,874 1,590
* Based on internal management reporting system
Comments:ČSOB d.s.s. was established in the autumn of 2004 in connection with pension reform in Slovakia. In 2005, the company started its business activities, i.e. conclusion of retirement pension savings contracts. In April 2005, the company met a condition requiring it to acquire at least 50,000 clients according to Act No. 43/2004 Coll. on Retirement Pension Savings. As at 31 December 2007, the com-pany had more than 104,000 clients.
In compliance with the Act, ČSOB d.s.s. offers three pension funds: a conservative fund, a balanced fund and a growth fund. To sell its products, it is primarily using the distribution network of the ČSOB Group.
The AUM increased considerably in 2007 along with a slight growth in the number of clients. The latter was due to the distribution of market in the previous period; nonetheless, the company kept its market share. The pension savings legislation was amended in 2007 which also concerns the clients of ČSOB d.s.s.; these changes will be in force during 2008.
50
Contact:Address: Kolárska 6, 815 63 BratislavaTelephone: +421 259 667 465Fax: +421 252 962 769E-mail: [email protected]: www.csobinvesticie.sk
ČSOB Asset Management, správ. spol., a.s.Slovak Republic
Date of establishment: 10. 6. 2004Business activities: Client asset managementIdentification number: 35889446Share capital as at 31. 12. 2007: SKK 60,000 thsShareholders as at 31. 12. 2007: 100% Československá obchodní banka, a. s. (% in registered capital / % in voting rights) (Czech Republic)
Shareholders as at 1. 1. 2008: 100% Československá obchodná banka, a. s. (% in registered capital / % in voting rights) (Slovak Republic)
Key indicators*: 2007 2006
Individual asset management SKK m 5,866 4,077Mutual funds SKK m 18,507 14,057
* Based on internal management reporting system
Comments:ČSOB AM SK provides its clients with services in the area of individual asset management and colle-ctive investing. In 2005, the company received a license for distribution of KBC mutual funds sold in the Slovak Republic. Since 2005, the company has been managing the portfolio of ČSOB Poisťovňa and portfolios of clients of the private bank in Slovakia.
In 2007, ČSOB AM SK offered its clients nine local funds, of which three for clients of the private bank. Eight of them were launched in 2006. At the end of the year, the company started to manage the KBC Renta Slovakrenta fund registered in Luxemburg. In 2007, the company further strengthened its fourth place on the Slovak market of mutual funds and its market share in Slovakia exceeded 11%.
51
Contact:Address: Vajnorská 100/B, P.O. Box 20, 831 04 Bratislava 29Telephone: +421 248 248 200Fax: +421 248 248 400E-mail: [email protected]: www.csobpoistovna.sk
ČSOB Poisťovňa, a. s.Slovak Republic
Date of establishment: 1. 1. 1992*
Business activities: Insurance of citizens and entrepreneurs in the area of life and non-life insurance
Identification number: 31325416Share capital as at 31. 12. 2007: SKK 838,000 thsShareholders as at 31. 12. 2007: 81.09% KBC Insurance NV(% in registered capital / % in voting rights) 18.91% Československá obchodní banka, a. s. (Czech Republic)
Shareholders as at 1. 1. 2008: 81.09% KBC Insurance NV(% in registered capital / % in voting rights) 18.91% Československá obchodní banka, a. s. (Czech Republic)
*Date of certificate of incorporation 9 June,1992.
Key indicators*: 2007 2006
Number of new insurance contracts pcs 84,075 77,773Volume of written premium SKK m 1,955 1,914Number of claims settled pcs 38,555 18,672Market share of the non-life insurance market % 2.43 3.14Market share of the life insurance market % 4.35 4.03
* Based on internal management reporting system
Comments:ČSOB Poisťovňa is a universal insurance company providing a wide range of life and non-life insu-rance products and insurance of citizens’ property. In addition, it offers insurance of entrepreneurs and their property, insurance covering risk connected with business activities and liability insurance. It also provides quality insurance services to large industrial enterprises and business organisations.
ČSOB Poisťovňa is using the services of major world reinsurers with the highest rating awarded by Standard & Poor’s (AAA to BBB-), which safely cover the writing capacity of the company. ČSOB Poisťovňa itself was awarded a rating by CRA RATING Agency (second highest possible degree of international rating awarded to companies in Slovakia, expressing the solvency and quality of the insurance company and its ability to fulfil its commitments to clients). Besides its own sales network, ČSOB Poisťovňa is also using branches of ČSOB in Slovakia and services of exclusive financial advi-sors and insurance brokerage companies.
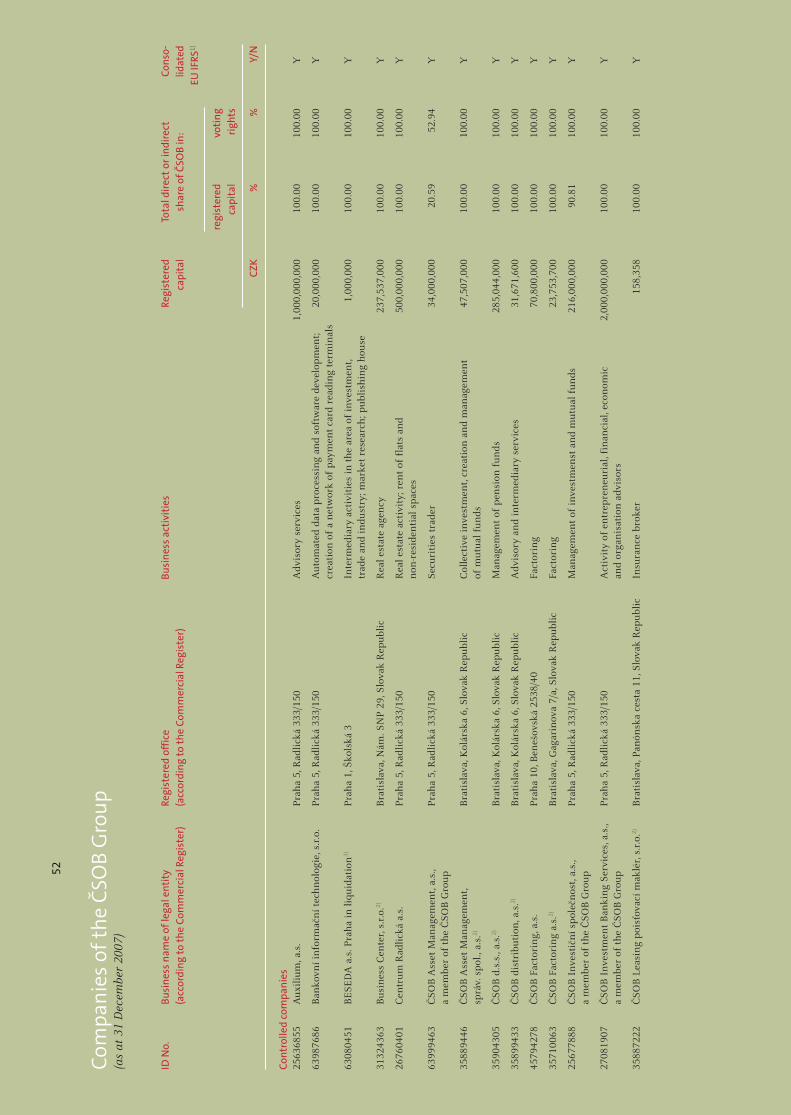
Com
pani
es o
f the
ČSO
B G
roup
(a
s at
31
Dec
embe
r 20
07)
ID N
o.
Busi
ness
nam
e of
lega
l ent
ity
Regi
ster
ed o
ffic
e Bu
sine
ss a
ctiv
itie
s Re
gist
ered
To
tal d
irec
t or
indi
rect
Cons
o-
(acc
ordi
ng to
the
Com
mer
cial
Reg
iste
r)
(acc
ordi
ng to
the
Com
mer
cial
Reg
iste
r)
capi
tal
shar
e of
ČSO
B in
:
lidat
ed
EU
IFRS
1)
regi
ster
ed
voti
ng
cap
ital
ri
ghts
CZ
K %
%
Y/
N
Cont
rolle
d co
mpa
nies
2563
6855
A
uxil
ium
, a.s
. P
rah
a 5,
Rad
lick
á 33
3/15
0 A
dvis
ory
serv
ices
1,
000,
000,
000
100.
00
100.
00
Y
6398
7686
B
anko
vní i
nfo
rmač
ní t
ech
nol
ogie
, s.r
.o.
Pra
ha
5, R
adli
cká
333/
150
Aut
omat
ed d
ata
pro
cess
ing
and
soft
war
e de
velo
pm
ent;
20
,000
,000
10
0.00
10
0.00
Y
cr
eati
on o
f a
net
wor
k of
pay
men
t ca
rd r
eadi
ng
term
inal
s
6308
0451
B
ESE
DA
a.s
. Pra
ha
in li
quid
atio
n3)
Pra
ha
1, Š
kols
ká 3
In
term
edia
ry a
ctiv
itie
s in
th
e ar
ea o
f in
vest
men
t,
1,00
0,00
0 10
0.00
10
0.00
Y
tr
ade
and
indu
stry
; mar
ket
rese
arch
; pub
lish
ing
hou
se
3132
4363
B
usin
ess
Cen
ter,
s.r
.o.2)
B
rati
slav
a, N
ám. S
NP
29,
Slo
vak
Rep
ubli
c R
eal e
stat
e ag
ency
23
7,53
7,00
0 10
0.00
10
0.00
Y
2676
0401
C
entr
um R
adli
cká
a.s.
P
rah
a 5,
Rad
lick
á 33
3/15
0 R
eal e
stat
e ac
tivi
ty; r
ent
of f
lats
an
d
500,
000,
000
100.
00
100.
00
Y
non
-res
iden
tial
sp
aces
6399
9463
Č
SOB
Ass
et M
anag
emen
t, a.
s.,
Pra
ha
5, R
adli
cká
333/
150
Secu
riti
es t
rade
r 34
,000
,000
20
.59
52.9
4 Y
a
mem
ber
of t
he
ČSO
B G
roup
3588
9446
Č
SOB
Ass
et M
anag
emen
t,
Bra
tisl
ava,
Kol
ársk
a 6,
Slo
vak
Rep
ubli
c C
olle
ctiv
e in
vest
men
t, cr
eati
on a
nd
man
agem
ent
47
,507
,000
10
0.00
10
0.00
Y
sp
ráv.
sp
ol.,
a.s.
2)
of
mut
ual f
unds
3590
4305
Č
SOB
d.s
.s.,
a.s.
2)
Bra
tisl
ava,
Kol
ársk
a 6,
Slo
vak
Rep
ubli
c M
anag
emen
t of
pen
sion
fun
ds
285,
044,
000
100.
00
100.
00
Y
3589
9433
Č
SOB
dis
trib
utio
n, a
.s.2)
B
rati
slav
a, K
olár
ska
6, S
lova
k R
epub
lic
Adv
isor
y an
d in
term
edia
ry s
ervi
ces
31,6
71,6
00
100.
00
100.
00
Y
4579
4278
Č
SOB
Fac
tori
ng,
a.s
. P
rah
a 10
, Ben
ešov
ská
2538
/40
Fact
orin
g 70
,800
,000
10
0.00
10
0.00
Y
3571
0063
Č
SOB
Fac
tori
ng
a.s.
2)
Bra
tisl
ava,
Gag
arin
ova
7/a,
Slo
vak
Rep
ubli
c Fa
ctor
ing
23,7
53,7
00
100.
00
100.
00
Y
2567
7888
Č
SOB
In
vest
ičn
í sp
oleč
nos
t, a.
s.,
Pra
ha
5, R
adli
cká
333/
150
Man
agem
ent
of in
vest
men
st a
nd
mut
ual f
unds
21
6,00
0,00
0 90
.81
100.
00
Y
a m
embe
r of
th
e Č
SOB
Gro
up
2708
1907
Č
SOB
In
vest
men
t B
anki
ng
Serv
ices
, a.s
.,
Pra
ha
5, R
adli
cká
333/
150
Act
ivit
y of
en
trep
ren
euri
al, f
inan
cial
, eco
nom
ic
2,00
0,00
0,00
0 10
0.00
10
0.00
Y
a
mem
ber
of t
he
ČSO
B G
roup
and
orga
nis
atio
n a
dvis
ors
3588
7222
Č
SOB
Lea
sin
g p
oisť
ovac
í mak
lér,
s.r
.o.2)
B
rati
slav
a, P
anón
ska
cest
a 11
, Slo
vak
Rep
ubli
c In
sura
nce
bro
ker
158,
358
100.
00
100.
00
Y
52

2715
1221
Č
SOB
Lea
sin
g p
ojiš
ťova
cí m
aklé
ř, s
.r.o
. P
rah
a 4,
Na
Pan
krác
i 60/
310
Insu
ran
ce b
roke
r 2,
000,
000
100.
00
100.
00
Y
6399
8980
Č
SOB
Lea
sin
g, a
.s.
Pra
ha
4, N
a Pa
nkr
áci 3
10/6
0 Le
asin
g 3,
000,
000,
000
100.
00
100.
00
Y
3570
4713
Č
SOB
Lea
sin
g, a
.s.2)
B
rati
slav
a, P
anón
ska
cest
a 11
, Slo
vak
Rep
ubli
c Le
asin
g 1,
187,
685,
000
100.
00
100.
00
Y
6091
7776
Č
SOB
Pen
zijn
í fon
d P
rogr
es, a
. s.,
P
rah
a 5,
Rad
lick
á 33
3/15
0 Pe
nsi
on in
sura
nce
12
0,00
0,00
0 10
0.00
10
0.00
Y
a
mem
ber
of t
he
ČSO
B G
roup
6185
9265
Č
SOB
Pen
zijn
í fon
d St
abil
ita,
a. s
.,
Pra
ha
5, R
adli
cká
333/
150
Pen
sion
insu
ran
ce
97,1
67,0
00
100.
00
100.
00
Y
a m
embe
r of
th
e Č
SOB
Gro
up
2792
4068
Č
SOB
Pro
per
ty f
und,
clo
sed-
ende
d
Pra
ha
5, R
adli
cká
333/
150
Col
lect
ive
inve
stm
ent
50,0
00,0
00
20.5
9 10
0.00
Y
in
vest
men
t fu
nd,
a.s
.,
a m
embe
r of
th
e Č
SOB
Gro
up4)
3579
9200
Č
SOB
sta
vebn
á sp
orit
eľň
a, a
.s.2)
B
rati
slav
a, R
adli
nsk
ého
10, S
lova
k R
epub
lic
Bui
ldin
g sa
vin
gs b
ank
570,
088,
800
100.
00
100.
00
Y
6125
1950
E
urin
cass
o, s
.r.o
. P
rah
a 10
, Ben
ešov
ská
2538
/40
Act
ivit
y of
eco
nom
ic a
nd
orga
nis
atio
n a
dvis
ors;
1,
000,
000
10
0.00
10
0.00
Y
re
cove
ry o
f re
ceiv
able
s
9999
9999
FA
P in
vest
S.A
. 2
rue
de l’
Ave
nir
, L-1
147
Luxe
mbu
rg,
Hol
din
g of
fin
anci
al in
vest
men
st a
sset
s 82
5,22
0 94
.91
100.
00
Y
Lu
cem
burs
ko
1358
4324
H
ypot
ečn
í ban
ka a
.s.
Pra
ha
5, R
adli
cká
333/
150
Mor
tgag
e ba
nki
ng
3,45
8,10
7,00
0 99
.87
99.8
7 Y
2561
7184
M
erri
on P
rop
erti
es, s
.r.o
.5)
Pra
ha
1, N
a P
říko
pě
19/1
096,
PSČ
117
19
Rea
l est
ate
acti
vity
10
0,00
0 20
.59
100.
00
Y
0000
0949
M
OT
OK
OV
a.s
., in
liqu
idat
ion
P
rah
a 8,
Th
ámov
a 18
1/20
W
hol
esal
e of
mac
hin
es a
nd
tech
nic
al e
quip
men
t 62
,000
,000
69
.09
69.0
9 Y
0054
8219
M
OT
OK
OV
In
tern
atio
nal
a.s
. P
rah
a 8,
Th
ámov
a 18
1/20
O
ther
fin
anci
al in
term
edia
ry a
ctiv
ity
430,
000,
000
94.9
1 94
.91
Y
9999
9999
Se
mex
Met
all u
nd
Mas
chin
en G
mbH
D
r. G
eorg
Sch
äfer
Str
asse
17,
Sa
le a
nd
pur
chas
e of
goo
ds, i
mp
ort,
dist
ribu
tion
an
d sa
le
77,5
70,6
80
94.9
1 10
0.00
Y
9343
7 Fu
rth
im W
ald,
SR
N
of t
ract
ors,
far
m m
ach
inar
y an
d ty
res
9999
9999
Te
e Sq
uare
Lim
ited
, Ltd
. B
riti
sh V
irgi
n I
slan
ds, T
orto
la, R
oad
Tow
n,
Adv
isor
y se
rvic
es f
or in
vest
men
t fu
nds
7,
413,
860
100.
00
100.
00
Y
T
hir
d Fl
oor,
Th
e G
enev
a P
lace
, P.O
.Box
986
in
th
e C
arib
bean
are
a
Join
t ve
ntur
e49
2413
97
Čes
kom
orav
ská
stav
ebn
í sp
ořit
eln
a, a
.s.
Pra
ha
10, V
inoh
rads
ká 3
218/
169
Bui
ldin
g sa
vin
gs b
ank
1,50
0,00
0,00
0 55
.00
55.0
0 Y
53
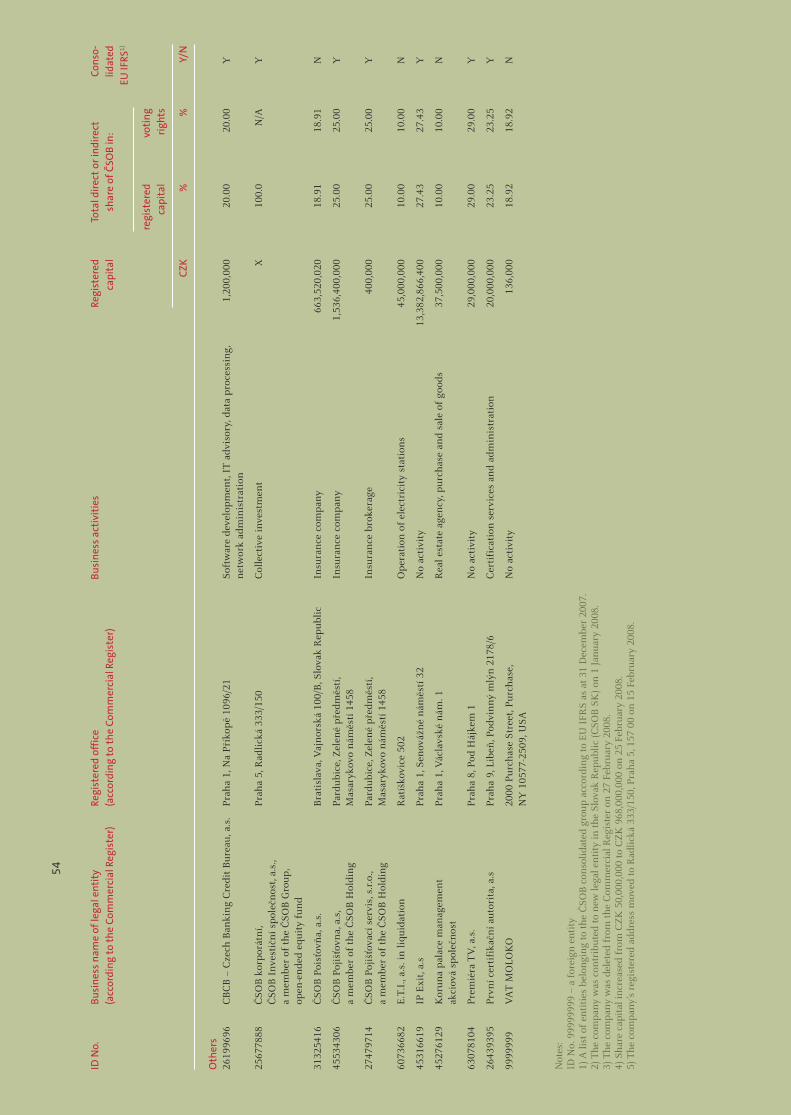
ID N
o.
Busi
ness
nam
e of
lega
l ent
ity
Regi
ster
ed o
ffic
e Bu
sine
ss a
ctiv
itie
s Re
gist
ered
To
tal d
irec
t or
indi
rect
Cons
o-
(acc
ordi
ng to
the
Com
mer
cial
Reg
iste
r)
(acc
ordi
ng to
the
Com
mer
cial
Reg
iste
r)
capi
tal
shar
e of
ČSO
B in
:
lidat
ed
EU
IFRS
1)
regi
ster
ed
voti
ng
cap
ital
ri
ghts
CZ
K %
%
Y/
N
Oth
ers
2619
9696
C
BC
B –
Cze
ch B
anki
ng
Cre
dit
Bur
eau,
a.s
. P
rah
a 1,
Na
Pří
kop
ě 10
96/2
1 So
ftw
are
deve
lop
men
t, IT
adv
isor
y, d
ata
pro
cess
ing,
1,
200,
000
20.0
0 20
.00
Y
net
wor
k ad
min
istr
atio
n
2567
7888
Č
SOB
kor
por
átn
í,
Pra
ha
5, R
adli
cká
333/
150
Col
lect
ive
inve
stm
ent
X
100.
0 N
/A
Y
ČSO
B I
nve
stič
ní s
pol
ečn
ost,
a.s.
,
a m
embe
r of
th
e Č
SOB
Gro
up,
op
en-e
nde
d eq
uity
fun
d
3132
5416
Č
SOB
Poi
sťov
ňa,
a.s
. B
rati
slav
a, V
ajn
orsk
á 10
0/B
, Slo
vak
Rep
ubli
c In
sura
nce
com
pan
y 66
3,52
0,02
0 18
.91
18.9
1 N
4553
4306
Č
SOB
Poj
išťo
vna,
a.s
, Pa
rdub
ice,
Zel
ené
pře
dměs
tí,
Insu
ran
ce c
omp
any
1,53
6,40
0,00
0 25
.00
25.0
0 Y
a
mem
ber
of t
he
ČSO
B H
oldi
ng
M
asar
ykov
o n
áměs
tí 1
458
2747
9714
Č
SOB
Poj
išťo
vací
ser
vis,
s.r
.o.,
Pa
rdub
ice,
Zel
ené
pře
dměs
tí,
Insu
ran
ce b
roke
rage
40
0,00
0 25
.00
25.0
0 Y
a
mem
ber
of t
he
ČSO
B H
oldi
ng
M
asar
ykov
o n
áměs
tí 1
458
6073
6682
E
.T.I
., a.
s. in
liqu
idat
ion
R
atíš
kovi
ce 5
02
Op
erat
ion
of
elec
tric
ity
stat
ion
s 45
,000
,000
10
.00
10.0
0 N
4531
6619
IP
Exi
t, a.
s P
rah
a 1,
Sen
ováž
né
nám
ěstí
32
No
acti
vity
13
,382
,866
,400
27
.43
27.4
3 Y
4527
6129
K
orun
a p
alac
e m
anag
emen
t
Pra
ha
1, V
ácla
vské
nám
. 1
Rea
l est
ate
agen
cy, p
urch
ase
and
sale
of
good
s
37,5
00,0
00
10.0
0 10
.00
N
akci
ová
spol
ečn
ost
6307
8104
P
rem
iéra
TV
, a.s
. P
rah
a 8,
Pod
Háj
kem
1
No
acti
vity
29
,000
,000
29
.00
29.0
0 Y
2643
9395
P
rvn
í cer
tifi
kačn
í aut
orit
a, a
.s
Pra
ha
9, L
ibeň
, Pod
vin
ný
mlý
n 2
178/
6 C
erti
fica
tion
ser
vice
s an
d ad
min
istr
atio
n
20,0
00,0
00
23.2
5 23
.25
Y
9999
999
VA
T M
OLO
KO
20
00 P
urch
ase
Stre
et, P
urch
ase,
N
o ac
tivi
ty
136,
000
18.9
2 18
.92
N
N
Y 1
0577
-250
9, U
SA
Not
es:
ID N
o. 9
9999
999
– a
fore
ign
en
tity
1) A
list
of
enti
ties
bel
ongi
ng
to t
he Č
SOB
con
solid
ated
gro
up a
ccor
din
g to
EU
IFR
S as
at
31 D
ecem
ber
2007
.2)
The
com
pany
was
con
trib
uted
to
new
lega
l en
tity
in t
he S
lova
k R
epub
lic (
CSO
B S
K)
on 1
Jan
uary
200
8.3)
The
com
pany
was
del
eted
fro
m t
he C
omm
erci
al R
egis
ter
on 2
7 Fe
brua
ry 2
008.
4) S
hare
cap
ital
incr
ease
d fr
om C
ZK
50,
000,
000
to C
ZK
968
,000
,000
on
25
Febr
uary
200
8.5)
The
com
pany
’s r
egis
tere
d ad
dres
s m
oved
to
Rad
lická
333
/150
, Pra
ha 5
, 157
00
on 1
5 Fe
brua
ry 2
008.
54

55

Eurincasso, s r.o.Indirect property share: 100.00 %Share of voting rights: 100.00 %
ČSOB Property fund, closed-end-ed investment fund, a.s.Indirect property share: 20.59 %Share of voting rights: 100.00 %
Merrion properties, s r.o.Indirect property share: 20.59 %Share of voting rights: 100.00 %
ČSOB Factoring a.s. (SK)Indirect property share: 100.00 % Share of voting rights: 100.00 %
ČSOB Leasing poisťovací maklér s.r.o.Indirect property share: 100.00 %Share of voting rights: 100.00 %
ČSOB Leasing pojišťovací makléř s.r.oIndirect property share: 100.00 %Share of voting rights: 100.00 %
Scheme of companies controlled by ČSOB (as at 31 December 2007)
Hypoteční banka, a.s.Direct property share: 99.87 %Share of voting rights: 99.87 %
ČSOB Leasing, a.s. (CZ)Direct property share: 100.00 %Share of voting rights: 100.00 %
ČSOB Penzijní fond Progres, a. s., member of the ČSOB GroupDirect property share: 100.00 %Share of voting rights: 100.00 %
ČSOB Investiční společnost, a.s., member of the ČSOB GroupDirect property share: 73.15 %Indirect property share: 17.66 %Share of voting rights: 100.00 %
ČSOB Asset Management, správ. spol., a.s.Direct property share: 100.00 %Share of voting rights: 100.00 %
Centrum Radlická a.s.Direct property share: 100.00 %Share of voting rights: 100.00 %
ČSOB Asset Management, a.s.,member of the ČSOB GroupDirect property share: 20.59 %Share of voting rights: 52.94 %
Českomoravská stavební spořitelna, a.s.Direct property share: 55.00 %Share of voting rights: 55.00 %
ČSOB Leasing, a.s. (SK)Direct property share: 90.01 %Indirect property share: 9.99 %Share of voting rights: 100.00 %
ČSOB stavebná spořiteľňa, a.s.Direct property share: 100.00 %Share of voting rights: 100.00 %
ČSOB Factoring, a.s. (CZ) Direct property share: 100.00 %Share of voting rights: 100.00 %
ČSOB Penzijní fond Stabilita, a. s., člen skupiny ČSOBDirect property share: 100.00 %Share of voting rights: 100.00 %
ČSOB d.s.s., a.s.Direct property share: 100.00 %Share of voting rights: 100.00 %
Auxilium, a.s.Direct property share: 100.00 %Share of voting rights: 100.00 %
Československá obchodní banka, a. s.
56
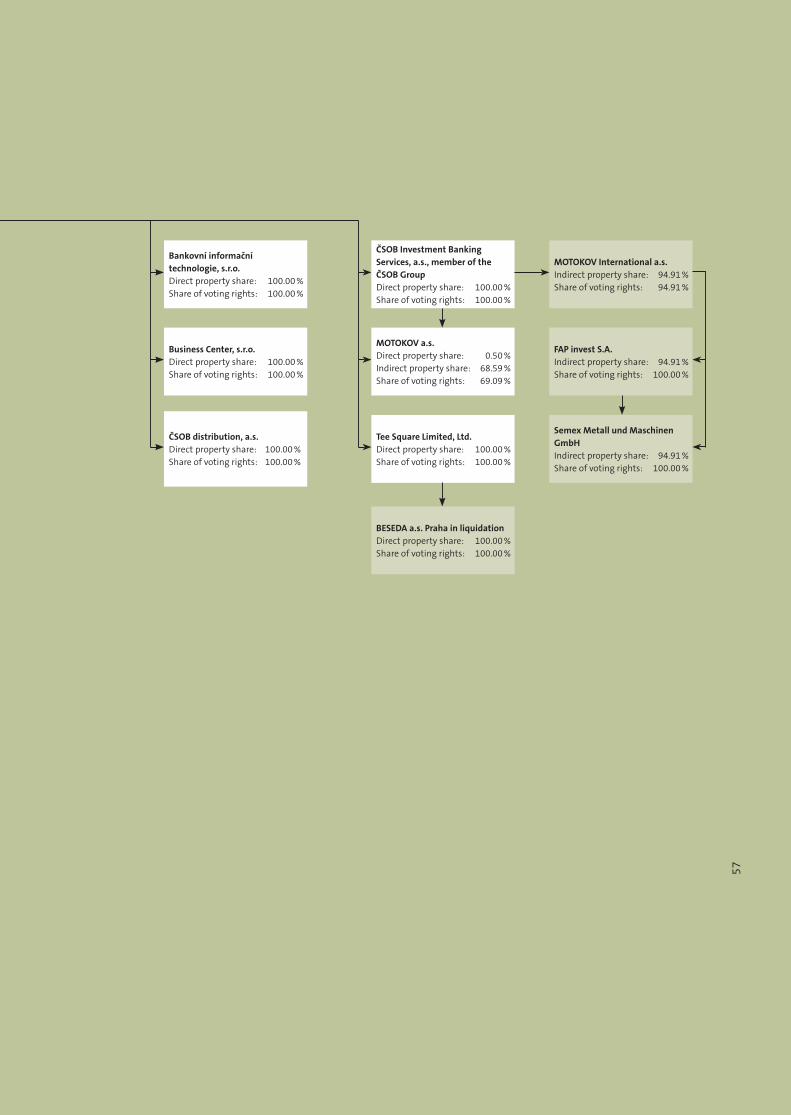
Semex Metall und Maschinen GmbHIndirect property share: 94.91 %Share of voting rights: 100.00 %
FAP invest S.A. Indirect property share: 94.91 %Share of voting rights: 100.00 %
MOTOKOV International a.s.Indirect property share: 94.91 %Share of voting rights: 94.91 %
ČSOB Investment Banking Services, a.s., member of the ČSOB GroupDirect property share: 100.00 %Share of voting rights: 100.00 %
BESEDA a.s. Praha in liquidation Direct property share: 100.00 %Share of voting rights: 100.00 %
Tee Square Limited, Ltd. Direct property share: 100.00 %Share of voting rights: 100.00 %
MOTOKOV a.s.Direct property share: 0.50 %Indirect property share: 68.59 % Share of voting rights: 69.09 %
Business Center, s.r.o.Direct property share: 100.00 %Share of voting rights: 100.00 %
Bankovní informační technologie, s.r.o.Direct property share: 100.00 %Share of voting rights: 100.00 %
ČSOB distribution, a.s.Direct property share: 100.00 %Share of voting rights: 100.00 %
57


The size of the roof is 7,000 m2. There are six similar landscape gardens with hills and monticules covered with meadow and wooded with groves of multi-trunk trees and shrubs. Directions in which they face cardinal points determine their concepts. The northern gardens follow up the character of the Radlice Valley while gardens facing the south are planted with a variety of woods resembling the sunny Mediterranean.
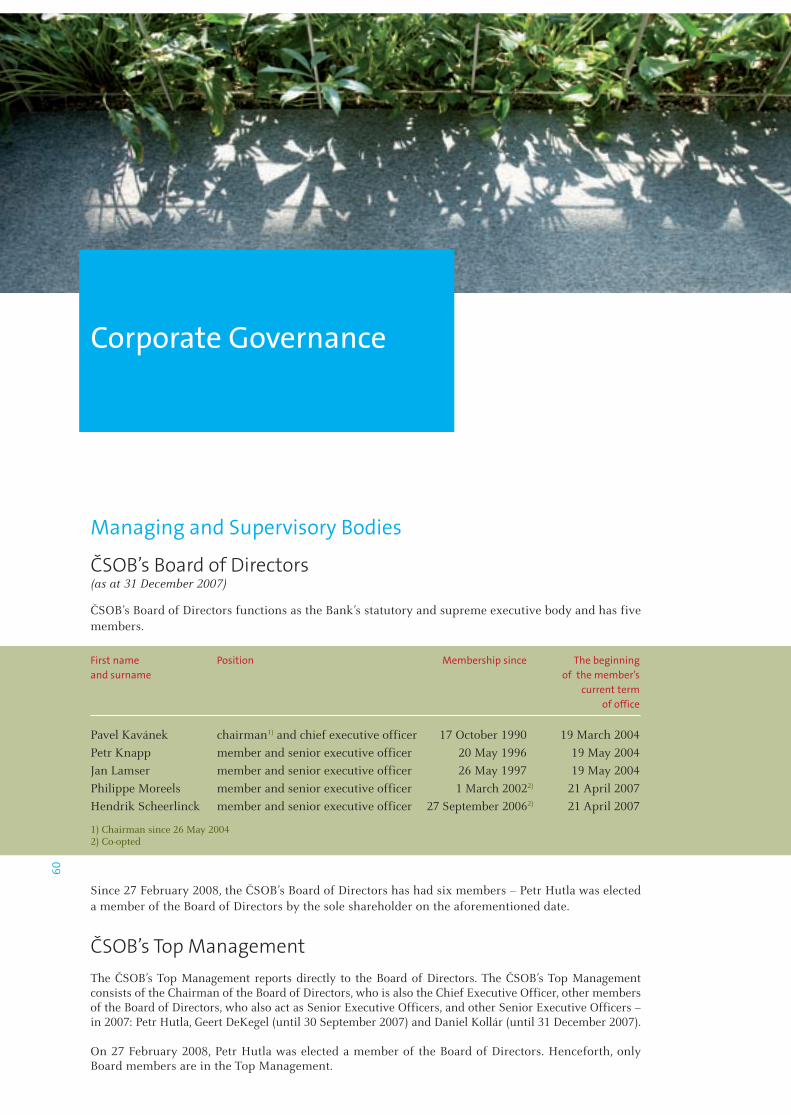
Managing and Supervisory Bodies
ČSOB’s Board of Directors(as at 31 December 2007)
ČSOB’s Board of Directors functions as the Bank’s statutory and supreme executive body and has five members.
First name Position Membership since The beginning and surname of the member’s current term of office
Pavel Kavánek chairman1) and chief executive officer 17 October 1990 19 March 2004
Petr Knapp member and senior executive officer 20 May 1996 19 May 2004
Jan Lamser member and senior executive officer 26 May 1997 19 May 2004
Philippe Moreels member and senior executive officer 1 March 20022) 21 April 2007
Hendrik Scheerlinck member and senior executive officer 27 September 20062) 21 April 2007
1) Chairman since 26 May 20042) Co-opted
Since 27 February 2008, the ČSOB’s Board of Directors has had six members – Petr Hutla was elected a member of the Board of Directors by the sole shareholder on the aforementioned date.
ČSOB’s Top ManagementThe ČSOB’s Top Management reports directly to the Board of Directors. The ČSOB’s Top Management consists of the Chairman of the Board of Directors, who is also the Chief Executive Officer, other members of the Board of Directors, who also act as Senior Executive Officers, and other Senior Executive Officers – in 2007: Petr Hutla, Geert DeKegel (until 30 September 2007) and Daniel Kollár (until 31 December 2007).
On 27 February 2008, Petr Hutla was elected a member of the Board of Directors. Henceforth, only Board members are in the Top Management.
Corporate Governance
60
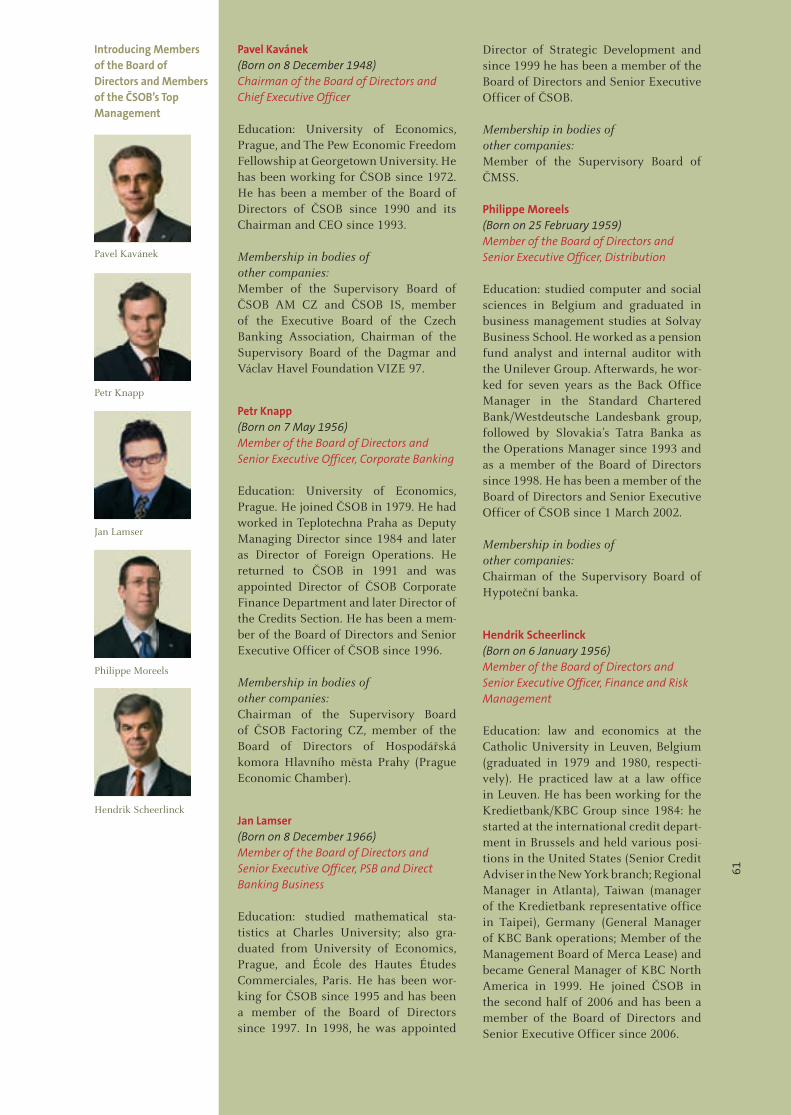
Introducing Members of the Board of Directors and Members of the ČSOB’s Top Management
Pavel Kavánek
Petr Knapp
Jan Lamser
Philippe Moreels
Hendrik Scheerlinck
Pavel Kavánek (Born on 8 December 1948)Chairman of the Board of Directors and Chief Executive Officer
Education: University of Economics, Prague, and The Pew Economic Freedom Fellowship at Georgetown University. He has been working for ČSOB since 1972. He has been a member of the Board of Directors of ČSOB since 1990 and its Chairman and CEO since 1993.
Membership in bodies of other companies:Member of the Supervisory Board of ČSOB AM CZ and ČSOB IS, member of the Executive Board of the Czech Banking Association, Chairman of the Supervisory Board of the Dagmar and Václav Havel Foundation VIZE 97.
Petr Knapp (Born on 7 May 1956)Member of the Board of Directors and Senior Executive Officer, Corporate Banking
Education: University of Economics, Prague. He joined ČSOB in 1979. He had worked in Teplotechna Praha as Deputy Managing Director since 1984 and later as Director of Foreign Operations. He returned to ČSOB in 1991 and was appointed Director of ČSOB Corporate Finance Department and later Director of the Credits Section. He has been a mem-ber of the Board of Directors and Senior Executive Officer of ČSOB since 1996.
Membership in bodies of other companies:Chairman of the Supervisory Board of ČSOB Factoring CZ, member of the Board of Directors of Hospodářská komora Hlavního města Prahy (Prague Economic Chamber).
Jan Lamser (Born on 8 December 1966)Member of the Board of Directors and Senior Executive Officer, PSB and Direct Banking Business
Education: studied mathematical sta-tistics at Charles University; also gra-duated from University of Economics, Prague, and École des Hautes Études Commerciales, Paris. He has been wor-king for ČSOB since 1995 and has been a member of the Board of Directors since 1997. In 1998, he was appointed
Director of Strategic Development and since 1999 he has been a member of the Board of Directors and Senior Executive Officer of ČSOB.
Membership in bodies of other companies:Member of the Supervisory Board of ČMSS.
Philippe Moreels (Born on 25 February 1959)Member of the Board of Directors and Senior Executive Officer, Distribution
Education: studied computer and social sciences in Belgium and graduated in business management studies at Solvay Business School. He worked as a pension fund analyst and internal auditor with the Unilever Group. Afterwards, he wor-ked for seven years as the Back Office Manager in the Standard Chartered Bank/Westdeutsche Landesbank group, followed by Slovakia’s Tatra Banka as the Operations Manager since 1993 and as a member of the Board of Directors since 1998. He has been a member of the Board of Directors and Senior Executive Officer of ČSOB since 1 March 2002.
Membership in bodies of other companies:Chairman of the Supervisory Board of Hypoteční banka.
Hendrik Scheerlinck (Born on 6 January 1956)Member of the Board of Directors and Senior Executive Officer, Finance and Risk Management
Education: law and economics at the Catholic University in Leuven, Belgium (graduated in 1979 and 1980, respecti-vely). He practiced law at a law office in Leuven. He has been working for the Kredietbank/KBC Group since 1984: he started at the international credit depart-ment in Brussels and held various posi-tions in the United States (Senior Credit Adviser in the New York branch; Regional Manager in Atlanta), Taiwan (manager of the Kredietbank representative office in Taipei), Germany (General Manager of KBC Bank operations; Member of the Management Board of Merca Lease) and became General Manager of KBC North America in 1999. He joined ČSOB in the second half of 2006 and has been a member of the Board of Directors and Senior Executive Officer since 2006.
61
62
Petr Hutla (Born on 24 August 1959)Senior Executive Officer, Human Resources and Facilities
Education: Graduated from the Czech Technical University, Faculty of Electrical Engineering. Petr Hutla worked for Tesla Pardubice in 1983 – 1993, as Economic Associate Director of Tesla Pardubice – RSD since 1991. He has been working for ČSOB since 1993: first as branch manager in Pardubice and main branch manager in Hradec Králové, then as branch manager in Prague 1 in 1997 – 2000. He then served as Senior Director, Corporate Accounts (2001 – 2005). He has worked as Senior Executive Officer since 2005: Personnel and Strategic Management (2005 – 2006), Human Resources and Facilities (since 2006). Since 27 February 2008, Petr Hutla has been a member of the Board of Directors.
Membership in bodies of other companies:Member of the Board of Trustees of Czech Technical University in Prague and member of the Board of Directors of the Nadace Karla Pavlíka (foundation).
Geert DeKegel(Born on 22 May 1962)Senior Executive Officer, Banking & Investment Products (until 30 September 2007)
Graduated from the Catholic University at Leuven, School of Sociology, in 1985. Since 1988 Geert had worked for Kredietbank – retail-branch manager in 1988 – 1996; KBC retail-branch manager since 1996. In 1999 he joined ĆSOB. Geert DeKegel worked in the position of Senior Executive Officer, Banking & Investment Products, from 1 May 2006 to 30 September 2007.
Daniel Kollár(Born on 1 December 1969)Senior Executive Officer of ČSOB SK, a foreign branch (until 31 December 2007)
Graduated from Slovak Technical and Economic University in Bratislava. In 1993 – 1994, he worked in ELV.S.Senec as export manager. In 1994 – 1996, he worked in OPUS Trading a.s. as a member of the Board of Directors and chief exe-cutive officer. In 1997 – 2004, he worked in ČSOB Leasing SK as chairman of the Board of Directors and chief executive officer. Daniel Kollár worked in ČSOB in the position Senior Executive Officer of ČSOB SK, a Slovak branch, from 1 June 2004 to 31 December 2007. Since 1 January 2008 he has been a Chairman of the Board of Directors and Chief Executive Officer of Československá obchodná banka, a. s., residing at Michalská 18, Bratislava, Postal Code 815 63, Slovak Republic.
Membership in bodies of other companies:Chairman of the Supervisory Boards of ČSOB Leasing SK, ČSOB SP a Business Center, member of the Supervisory Board of ČSOB AM SK and the Deposit Protection Fund.
ČSOB’s Supervisory Board(as at 31 December 2007) ČSOB’s Supervisory Board has nine members and oversees the performance of the Board of Directors.
First name and surname Position Membership The beginning of the since member’s current term of office
Jan Švejnar chairman1) 9 October 20032) 19 May 2004Jan Oscar Cyriel Vanhevel member 22 April 2006 22 April 2006John Arthur Hollows member 22 April 2006 22 April 2006Patrick Roland Vanden Avenne member 22 April 2006 22 April 2006Riet Docx member 1 December 20042) 20 April 2005Hendrik George Adolphe Gerard Soete member 24 February 20072) 21 April 2007František Hupka member3) 23 June 2005 23 June 2005Libuše Gregorová member3) 23 June 2005 23 June 2005Martina Kopecká member3) 23 June 2005 23 June 2005
1) Chairman since 9 June 20042) Co-opted3) Elected by employees
62
63
Introducing Members of the Supervisory Board
Jan Švejnar (Born on 2 October 1952) Chairman of the Supervisory Board
Education: Industrial and Work Relations – Cornell University; Ph.D. in Economics – Princeton University. An independent econo-mist living abroad since 1970. Since 1992, he has evenly divided his work capacity between activities in Prague and the USA. He has prima-rily devoted his academic career to economies in transition and, generally, to economic deve-lopment. He is a Professor at the University of Michigan Business School.
Membership in bodies of other companies:Chairman of the Board of the Center for Economic Research and Graduate Education (CERGE) of Charles University, member of the Academic Council of Faculty of Social Sciences of Charles University, member of the Board of the BOHEMIAE Foundation in liquidation.
Jan Vanhevel (Born on 10 September 1948) Member of the Supervisory Board
Education: The Catholic University in Leuven, with a degree in law, and the Flemish University of Economics VLECHO, with a degree in finan-cial management. From 1971 until now, he has worked in various managerial positions in the sector of financial services. He has acquired wide experience in legal services departments, in the credits area and in the area of corporate banking management and process management. In April 1996, he became a member of the Executive Committee of Kredietbank and, after its mer-ger with other entities giving birth to KBC, he became (in June 1998) Managing Director and member of the Executive Committee of the KBC Group. In 2006, he was appointed CEO Central and Eastern Europe supervising and responsible for banking and insurance activities for KBC Group. In 2007 he was appointed CEO Central and Eastern Europe and Russia for KBC Group in eight countries in Central and Eastern Europe.
Membership in bodies of other companies:Chairman of the Board of Directors of A Banka (Serbia); member of the Board of Directors in: KBC Verzekeringen (Belgium), K&H Bank (Hungary) and Absolut Bank (Russia); President/Chairman of the Supervisory Board in: Warta TuiR (Poland), Warta TunZ (Poland), K&H Insurance (Hungary), ČSOB Pojišťovna and ČSOB Poisťovňa; mem-ber of the Supervisory Board in: KredytBank (Poland), NLB Bank (Slovenia), DZI Insurance (Bulgaria), DZI Health Insurance (Bulgaria) and ČSOB SK (since 1 January 2008). Chairman of the Board of Directors of FEBELFIN (Belgian Banking
Federation) and member of the European Banking Federation, member of the Board of Directors of Flanders-China Chamber of Commerce.
John Hollows (Born on 12 April 1956)Member of the Supervisory Board
Education: Sydney Sussex College at the University in Cambridge, with a degree in economics and law. His professional career is connected with banking and with work in Industrial and Commercial Chambers. He gained experience in the area of financial services at Barclays Bank in London and Taipei and at KBC in Hong Kong, Shanghai, Singapore and Budapest. He held senior manage-rial positions in credits departments and in areas such as export finance, corporate and investment banking and treasury. He also focused on cost management. From August 2003 to April 2006, he was general manager of K&H Bank (KBC Group) in Budapest. He came to the Supervisory Board of ČSOB as manager of the Central and Eastern Europe Business Unit of KBC.
Membership in bodies of other companies:Member of the Board of Directors in: K&H (Hungary) and A Banka (Serbia); member of the Supervisory Board in: ČSOB AM CZ, ČSOB PF Stabilita, ČSOB PF Progres, ČSOB AM SK, KredytBank (Poland), NLB (Slovenia) and ČSOB SK (since 1 January 2008).
Patrick Vanden Avenne (Born on 15 February 1954) Member of the Supervisory Board
Education: The Catholic University in Leuven (Belgium), with a degree in economics and law, and Stanford University (USA), with a degree in business administration. He owns and manages a number of companies in the food processing industries and in logistics. As an outstanding shareholder of KBC, he has participated in the corporate governance of KBC Group since 1993. He has also been in managerial positions in Almanij (a parent company of the KBC Group), Gevaert NV and, later, in KBC Bank and KBC Insurance. After the merger of Almanij and KBC in 2005, he was appointed to the position of Director of KBC Bank and became a member of the Audit Committee at KBC Bank.
Membership in bodies of other companies:Member of the Supervisory Boards at the Catholic Universities in Leuven and Kortrijk, member of the managing committees of the Flemish Employers Union (VOKA) and the Belgian Federation of Food Industry (Bemefa).
64
Riet Docx (Born on 15 September 1950) Member of the Supervisory Board
Education: Economic studies at Antwerp University. Between 1976 and 1994, she worked in institutions operating in the banking and ins-urance sector. She held managerial positions in Benelux Bank and in the insurance companies Omniver NV and Omniver Leven NV. Since 1994, Mrs. Riet Docx has been working for KBC. In January 2005, she was appointed Executive Manager responsible for coordination of ban-king activities in Central European countries at the KBC Directorate for Central Europe.
Membership in bodies of other companies:Member of the Board of Directors of A Banka (Serbia); member of the Supervisory Board in: K&H (Hungary), NLB (Slovenia) and ČSOB SK (since 1 January 2008).
Hendrik Soete (Born on 9 November 1950) Member of the Supervisory Board
Education: The Catholic University in Leuven. In 1977, he started working as Production Manager for Procter & Gamble and he worked as Production Manager for Lacsoons Diary from 1980. At present, Hendrik G. Soete is working as Chief Executive Officer of the Belgian Group AVEVE. He became a member of the Supervisory Board of ČSOB in 2007.
Membership in bodies of other companies:Member of the Board of Directors of several com-panies, namely of: the KBC Group, affiliates of the AVEVE Group, Boerenbond and its Financial Holding; Chairman of the Board of Directors of Intercoop Europe (Switzerland).
František Hupka (Born on 13 April 1971) Member of the Supervisory Board elected by employees
In 1991, he joined ČSOB as an IT support speci-alist. At the present time, he is Chairman of the Working Committee of Trade Unions.
Membership in bodies of other companies:Member of the Board of Directors of the Occupational Health Insurance Company for Employees of the Banking, Insurance and Building Industry (OZP).
Libuše Gregorová (Born on 25 July 1959) Member of the Supervisory Board elected by employees
Education: She graduated from the University of Economics, Prague. She joined ČSOB in 1989 and worked as IT manager from 1996 to 1998. Since 1998, she has been an analyst and
application developer. Since 1 January 2006 she has been manager of Credits and Deposits Products – Analysis.
Membership in bodies of other companies:Member of the Board of Directors of Bytové družstvo Vojáčkova 612 (housing cooperative).
Martina Kopecká (Born on 19 September 1969) Member of the Supervisory Board elected by employees
Education: She graduated from the University of Economics, Prague. She has been working at the ČSOB Pardubice branch since 1994, and in the position of Corporate Banker for Retail / SME clients since 2002.
Changes in the Supervisory Board in 2007On their meeting held on 23 February 2007, the Supervisory Board co-opted its new member Hendrik Georges Adolphe Gerard Soete to replace Anne Fossemalle who had represented EBRD. The General Meeting of ČSOB, held on 20 April 2007, approved the election of Hendrik Soete as a regular member of the Supervisory Board.
The work address of all members of the Board of Directors and the members of the ČSOB’s Top Management as well as all the members of the Supervisory Board is:
Československá obchodní banka, a. s.Radlická 333/150Praha 5Postal Code 150 57, Czech Republic
Conflict of Interestsunder Commission Regulation (EC) No 809/2004
ČSOB hereby declares that it is not aware of any potential conflict of interests between any of the duties of any member of the Board of Directors, the ČSOB’s Top Management and the Supervisory Board to ČSOB and their private interests and / or other duties.
Note: ČSOB, pursuant to the applicable Czech legal princi-ples, does not regard entering into banking transactions by the members of the Board of Directors, the members of the ČSOB’s Top Management and the members of the Superviso-ry Board of ČSOB under standard terms as a conflict of inte-rests between the duties of these persons to ČSOB and their private interests and / or other duties..
65
Emoluments and benefits of Members of the Top Management and the Supervisory BoardInformation in accordance with the Act No. 256/2004 Coll., Act on Business Activities on the Capital Market (also known as the Act on undertakings on the capital market), section 118, paragraph 3, provi-sions c), d) and e).
Remuneration and Income in Kind (Section 118, paragraph 3, provision c)
In 2007, members of the Top Management and the Supervisory Board received the following remune-ration and income in kind from both ČSOB and persons controlled by ČSOB:
Monetary Income Income in Kind Received from Received from
ČSOB Persons ČSOB Persons controlled controlled by by ČSOB ČSOB
Members of the Board of Directors CZK ths 322,322 - 7,447 -Other Members of the Top Management CZK ths 25,481 - 3,616 -Members of the Supervisory Board CZK ths 2,496 - - -
The Chairman of the Board of Directors, who is also the Chief Executive Officer, other Members of the Board of Directors, who also act as Senior Executive Officers, and other Senior Executive Officers constitute the ČSOB’s Top Management (see Managing and Supervisory Bodies).
The income of the Chairman and Members of the Board of Directors in 2007 included: CZK 34,711 ths under the Contract on the Performance of the Line Management Function, a bonus of CZK 18,841 ths under the Contract on the Performance of the Function of the Chairman / Member of the Board of Directors and an extra bonus of CZK 268,770 ths for the ČSOB Net Consolidated Profit growth in the period from 1 January 2004 to 31 December 2006. The bonus and the extra bonus were approved by the General Meeting on 20 April 2007.
Shares issued by ČSOB(Section 118, paragraph 3, provision d)
As at 31 December 2007, the Members of the Board of Directors did not own any shares issued by ČSOB. The Members of the Board of Directors do not have any purchase option on ČSOB shares.
The members of the Board of Directors, their next of kin, other Members of the Top Management and their next of kin own neither shares, nor purchase options on ČSOB shares.
Principles of Remuneration (Section 118, Paragraph 3, provision e)
Members of the Board of Directors
Remuneration of the Members of the ČSOB’s Board of Directors consists of a fixed
component, pursuant to the Contract on the Performance of the Line Management Function, and a variable (bonus) component applicable under the Contract on the Performance of the Function of the Member of the Board of Directors. The variable component is approximately half of the total income. The Remuneration Rules were set by the Compensation Committee of the Supervisory Board, whose Members in 2007 were Jan Švejnar, Jan Vanhevel and John Hollows. The relative change of earnings per share (EPS), i.e. the change in net consolidated profit per share between 1 January and 31 December of the reported year, is the main KPI to determine the variable component.
The amount of the variable component is calcu-lated by the Compensation Committee using the audited accounts. Final approval is given by the General Meeting.
Other Members of the Top Management
Other Members of the Top Management rece-ive their remuneration based on the ČSOB Remuneration Rules. The variable component is calculated in accordance with the main KPIs achieved. Remuneration of a KBC expatriate is based on the KBC Expatriation Remuneration Principles and also includes the KPIs criterion.
Note: KBC expatriates are originally KBC employees who we-re seconded to ČSOB within the KBC expatriation program-me for selected managers, and became regular employees of ČSOB and tax residents of the Czech Republic.
Members of the Supervisory Board
The Chairman of the Supervisory Board is con-tracted for a fix income per year that is set and confirmed by the Compensation Committee and approved by the General Meeting. Members
66
elected by employees are compensated for the function that they discharge in the Bank in accor-dance with the ČSOB Remuneration Rules and do not receive any extra remuneration for their Supervisory Board membership. Other members (KBC employees) receive neither income from ČSOB for their Supervisory Board membership, nor any extra remuneration from KBC.
Contingent emoluments due to members of the company bodies or to employeesInformation pursuant to Section 20, Clause 7, Slovak Act N. 431/2002 Coll., Accounting Act
Information on all agreements entered by and between ČSOB and members of the company bodies or employees based on which an emolu-ment is due to them should their employment or membership be terminated by resignation, letter of resignation submitted by an employee, discharge from position, notice of dismissal ser-ved by employer without cause, or should their membership or employment be terminated in consequence of an offer for takeover:
Pursuant to Section 20, Clause 7, Act No. 431/2002 Coll., Accounting Act, as amended, any emoluments are stipulated by the Collective Agreement compliant with the Labour Code and the said emoluments increase with the length of the employment contract with the employer. Members of the top management, including members of the ČSOB Board of Directors and the ČSOB Supervisory Board, have no emoluments established in addition to the framework set out by the applicable provisions of the Labour Code and the Collective Agreement.
67
Corporate Governance Policy
Corporate governance and administration
Corporate governance and administration of Československá obchodní banka, a. s. are based on the OECD principles and, while executing them, experience collected by the KBC Group, ČSOB’s shareholder, is extensively exploited. ČSOB professes principles formulated in the Code of Governance and seeks to observe them consistently in its day-to-day activities.
The members of the Board of Directors are elected by the company’s General Meeting. They went through mandatory assessment by the Czech National Bank, where their professional qualifi-cations were thoroughly examined. In compli-ance with the Banking Act, the Bank’s Board of Directors composes of executive members only. To combine the position of Chairman of the Board of Directors with that of the Chief Executive Officer corresponds with this require-ment. Shareholders and clients of the Bank receive regular reports including all relevant data on the members of the Board of Directors and their professional and personal qualifications as required by the by applicable laws.
The ČSOB’s Board of Directors performs its tasks within the framework of competencies defined for the statutory body by the Articles of Association and relevant management docu-ments of the company. The Board of Directors fulfils its tasks with due professional care and bears full responsibility for them as required by the Commercial Code. The Board of Directors remained unchanged in 2007.
The Board of Directors meets regularly, usually once a week, and follows a fixed agenda based on the strategic schedule of main topics and other documents of more operational a nature submitted for discussion individually by the Board members. The members of the Board of Directors receive timely information and make their decisions on the basis of these duly proc-essed documents in accordance with the rules of procedure of the Board of Directors. Discussions of this top body are attended by the director of the Bank’s corporate office, who acts as secretary of the Board and is responsible for preparing the meetings and taking their minutes.
Pursuant to the Bank’s Articles of Association, the Supervisory Board of Československá obchodní banka, a. s. has nine members. Six of them are elected by the General Meeting and three of them are elected by the employees of the Bank.
In compliance with its plan of work, the Supervisory Board held four meetings in 2007, where it discussed issues falling under its competence according to the Bank’s Articles of Association. Background materials for meetings of the Supervisory Board were prepared and delivered well in advance for the members of the Supervisory Board to have enough time to study them. Meetings of the Supervisory Board are also regularly attended by the members of the Board of Directors, who personally presented materials to be discussed. During its meetings, the Supervisory Board raised requirements for additional materials, and these requirements were always satisfied at the next session.
Both working bodies of the Supervisory Board, the Audit Committee and the Compensation Committee, held regular meetings and informed the Supervisory Board about their activities. The Supervisory Board approved recommendations of the two Committees regarding some matters discussed.
In compliance with its competencies, the Supervisory Board selected an external audi-tor for the Bank. The auditor regularly attends meetings of the Audit Committee, thus provid-ing for an independent, comprehensive and qualified opinion of whether the Bank’s finan-cial statements express the situation and per-formance of the Bank correctly in all material respects. Pursuant to the Rules of Conduct of the Supervisory Board, administrative and organi-zational support is provided by the Bank’s cor-porate office, whose director is responsible for taking the minutes of the meetings.
In 2007, a significant change occurred in ČSOB altering the ČSOB’s shareholder structure: KBC Bank NV became the only shareholder of ČSOB. On 12 June 2007 this change was entered in the Register of Companies and on 14 June 2007 the transfer of the Bank’s securities held by minor ČSOB shareholders to KBS was registered in the Securities Centre. Thus, KBC met its long-term objective to control 100% of ČSOB shares.
Rules for appointing and removing members of the statutory bodies and for amending the Articles of AssociationInformation pursuant to Section 20, Clause 7, Slovak Act No. 431/2002 Coll., Accounting Act
Members of the Board of Directors are elected and removed by the General Meeting. Re-election of a member of the Board of Directors shall be possible.
68
Should any member of the Board of Directors die, resign, be removed, or should any mem-ber’s term be otherwise terminated, the General Meeting shall elect a new member of the Board of Directors, except as stated in the clause below. In case that the number of the Board members decreases, but not below one half of the prescri-bed number, the Board of Directors may appoint substitute members to fill the vacancies until the next General Meeting session.
The term of a Board member is 5 years.
The term of a Board member expires when a new member of the Board of Directors is elected, but no later than after the lapse of three months from the termination of such member’s term, except for cases when a member of the Board of Directors dies, resigns or is removed, upon the occurrence of which the expiration may happen on other times.
A member of the Board of Directors can resign by giving a written notice delivered to the Board of Directors or to the General Meeting. The Board of Directors is obliged to discuss the resignation at the nearest meeting held after the notice has been delivered. The term expires on the day when the Board of Directors discussed, or should have discussed, the resignation. If a member of the Board of Directors announces his/her resignation on a Board meeting then his/her term expires within two months after such noti-fication, unless the Board of Directors approves another time of expiration upon the resigning member’s request.
ČSOB’s Articles of Association may be amended by no less than two thirds of shareholders pre-sent at a General Meeting, unless the amendment is in consequence of the increase of share capital by the Board of Directors, or an amendment is induced by other legal facts.
Should a General Meeting adopt a resolution inducing a change of the Articles of Association then such resolution replaces a resolution on an amendment of the Articles of Association. If the resolution of a General Meeting fails to indicate
whether, or how the Articles of Association are amended, then upon such failure to indicate it is the Board of Directors who amends the Articles of Association. A notary record of the amendment of the Articles of Association will contain the approved wording of the amendment. After having the approval of the General Meeting, the Board of Directors will have the full wording of the ČSOB’s Articles of Association drafted and submit it without unnecessary delay to the applicable registration court.
Should ČSOB decide to increase or decrease the share capital, split shares or merge several shares into one share, change the type or class of shares, or restrict the transferability of shares, or change it whatsoever, the amendment of the Articles of Association becomes effective as of the day of entry of such facts in the Register of Companies. Other amendments of the Articles of Association become effective when decided by the General Meeting, unless the General Meeting’s decision to amend the Articles of Association or the appli-cable law provides for a later effective day.
Power of the statutory body, specifically the power to decide on the issuance or re-purchase of sharesInformation pursuant to Section 20, Clause 7, Slovak Act No. 431/2002 Coll., Accounting Act
The Board of Directors is a statutory body to manage ČSOB’s activities and act on ČSOB’s behalf. The Board of Directors decides on all com-pany matters, unless these fall within the powers of the General Meeting or the Supervisory Board pursuant to the applicable law or the Articles of Association. The Board of Directors is not entitled to decide on the issuance or re-purchase of shares should such issuance or re-purchase exceed the scope stipulated by the applicable legal regulations.
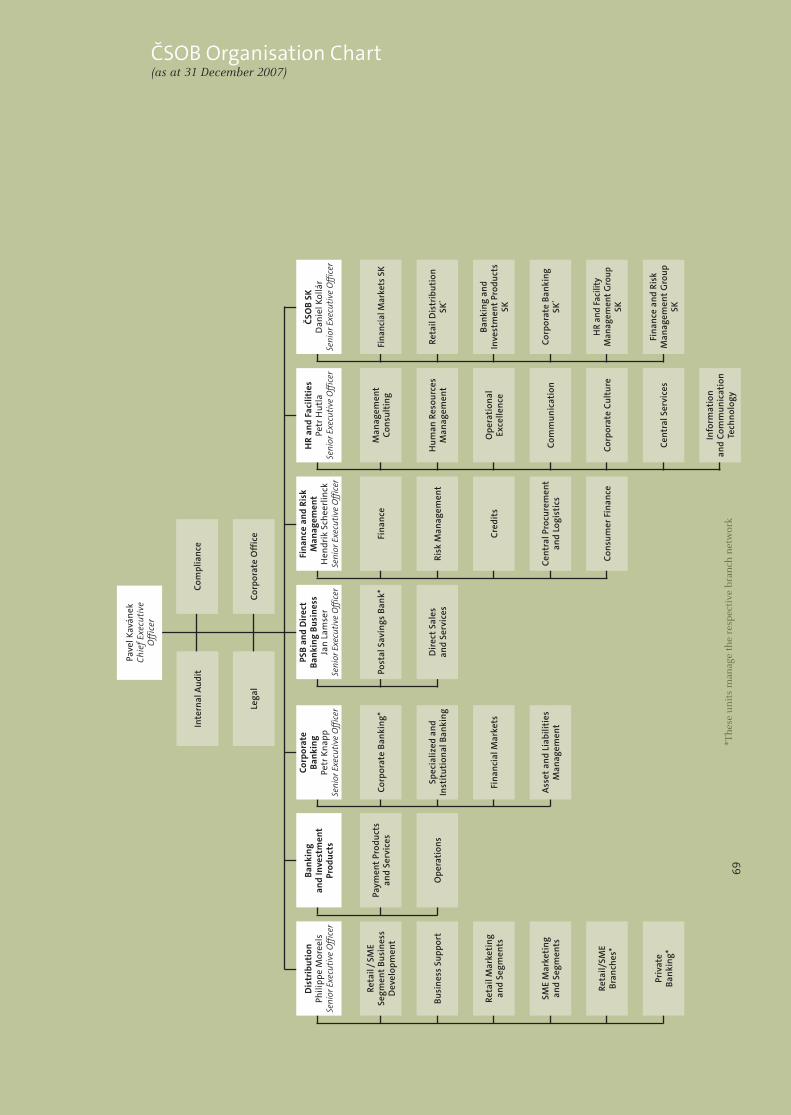
69
ČSOB Organisation Chart(as at 31 December 2007)
Pave
l Kav
ánek
Chie
f Exe
cuti
ve
Off
icer
Dis
trib
utio
nPh
ilipp
e M
oree
lsSe
nior
Exe
cuti
ve O
ffic
er
HR
and
Faci
litie
sPe
tr H
utla
Seni
or E
xecu
tive
Off
icer
ČSO
B SK
Dan
iel K
ollá
rSe
nior
Exe
cuti
ve O
ffic
er
Reta
il / S
ME
Segm
ent
Busi
ness
D
evel
opm
ent
Man
agem
ent
Cons
ulti
ngFi
nanc
ial M
arke
ts S
K
Busi
ness
Sup
port
PSB
and
Dir
ect
Bank
ing
Busi
ness
Jan
Lam
ser
Seni
or E
xecu
tive
Off
icer
Post
al S
avin
gs B
ank*
Dir
ect
Sale
s an
d Se
rvic
esH
uman
Res
ourc
es
Man
agem
ent
Reta
il D
istr
ibut
ion
SK*
Reta
il M
arke
ting
an
d Se
gmen
tsO
pera
tion
al
Exce
llenc
e
Bank
ing
and
Inve
stm
ent
Prod
ucts
SK
SME
Mar
keti
ng
and
Segm
ents
Fina
nce
and
Risk
M
anag
emen
tH
endr
ik S
chee
rlin
ckSe
nior
Exe
cuti
ve O
ffic
er
Fina
nce
Risk
Man
agem
ent
Cred
its
Cent
ral P
rocu
rem
ent
and
Logi
stic
s
Cons
umer
Fin
ance
Bank
ing
and
Inve
stm
ent
Prod
ucts
Paym
ent
Prod
ucts
an
d Se
rvic
es
Ope
rati
ons
Com
mun
icat
ion
Corp
orat
e Ba
nkin
g SK
*
Corp
orat
e Cu
ltur
eH
R an
d Fa
cilit
y M
anag
emen
t Gro
up
SK
Fina
nce
and
Risk
M
anag
emen
t G
roup
SK
Cent
ral S
ervi
ces
Info
rmat
ion
and
Com
mun
icat
ion
Tech
nolo
gy*T
hese
un
its
man
age
the
resp
ecti
ve b
ran
ch n
etw
ork
Reta
il/SM
E Br
anch
es*
Priv
ate
Bank
ing*
Com
plia
nce
Corp
orat
e O
ffic
e
Inte
rnal
Aud
it
Lega
l
Corp
orat
e Ba
nkin
gPe
tr K
napp
Seni
or E
xecu
tive
Off
icer
Corp
orat
e Ba
nkin
g*
Spec
ializ
ed a
nd
Inst
itut
iona
l Ban
king
Fina
ncia
l Mar
kets
Ass
et a
nd L
iabi
litie
s M
anag
emen
t
69

The new ČSOB building offers modern and friendly workspace. Spots and corners for rest and relaxation are a commonplace here.
1 –
Nek
onso
lidov
aná
účet
ní z
ávěr
ka
71 Financial part 72 Auditor’s opinion on the separated financial statements 73 Consolidated Financial Statements Year Ended 31 December 2007 136 Separate Financial Statements Year Ended 31 December 2007 137 Auditor’s opinion on the consolidated financial statements
Financial part
72
– Co
nsol
idat
ed F
inan
cial
Sta
tem
ents
Auditor’s opinion on the consolidated financial statements
Independent Auditor’s Report to the Shareholders of Československá obchodní banka, a. s.
We have audited the accompanying consolidated fi nancial statements of Československá obchodní banka, a. s. and its subsidiaries (“the ČSOB Group”), which comprise the consolidated balance sheet as at 31 December 2007 and the consolidated income statement, consolidated statement of changes in equity and consolidated cash fl ow statement for the year then ended, and a summary of signifi cant accounting policies and other explanatory notes. For details of the ČSOB Group, see Note 1 to the consolidated fi nancial statements.
Management’s Responsibility for the Financial Statements
Management is responsible for the preparation and fair presentation of these consolidated fi nancial statements in accordance with International Financial Reporting Standards as adopted by the European Union. This responsibility includes: designing, implementing and maintaining internal control relevant to the preparation and fair presentation of fi nancial statements that are free from material misstatement, whether due to fraud or error; selecting and applying appropriate accounting policies; and making accounting estimates that are reasonable in the circumstances.
Auditor’s Responsibility
Our responsibility is to express an opinion on these consolidated fi nancial statements based on our audit. We conducted our audit in accordance with International Standards on Auditing and implementation guidance of the Chamber of Auditors of the Czech Republic. Those standards require that we comply with ethical requirements and plan and perform the audit to obtain reasonable assurance whether the fi nancial statements are free from material misstatement.
An audit involves performing procedures to obtain audit evidence about the amounts and disclosures in the fi nancial statements. The procedures selected depend on the auditor’s judgment, including the assessment of the risks of material misstatement of the fi nancial statements, whether due to fraud or error. In making those risk assessments, the auditor considers internal control relevant to the entity’s preparation and fair presentation of the fi nancial statements in order to design audit procedures that are appropriate for the circumstances, but not for the purpose of expressing an opinion on the effectiveness of the entity’s internal control. An audit also includes evaluating the appropriateness of accounting policies used and the reasonableness of accounting estimates made by management, as well as evaluating the overall presentation of the fi nancial statements.
We believe that the audit evidence we have obtained is suffi cient and appropriate to provide a basis for our audit opinion.
Opinion
In our opinion, the consolidated fi nancial statements give a true and fair view of the fi nancial position of the ČSOB Group as at 31 December 2007, and of its fi nancial performance and its cash fl ows for the year then ended in accordance with International Financial Reporting Standards as adopted by the European Union.
Ernst & Young Audit & Advisory, s.r.o., člen koncernuLicence No. 401Represented by
Douglas Burnham Roman Hauptfl eischPartner Auditor, Licence No. 2009
9 April 2008Prague, Czech Republic
A member fi rm of Ernst & Young Global LimitedErnst & Young Audit & Advisory, s.r.o., člen koncernu with its registered offi ce at Karlovo náměstí 10,120 00 Prague 2, has been incorporated in the Commercial Register administered by the Municipal Court in Prague, Section C, entry no. 88504, under Identifi cation No. 26704153.
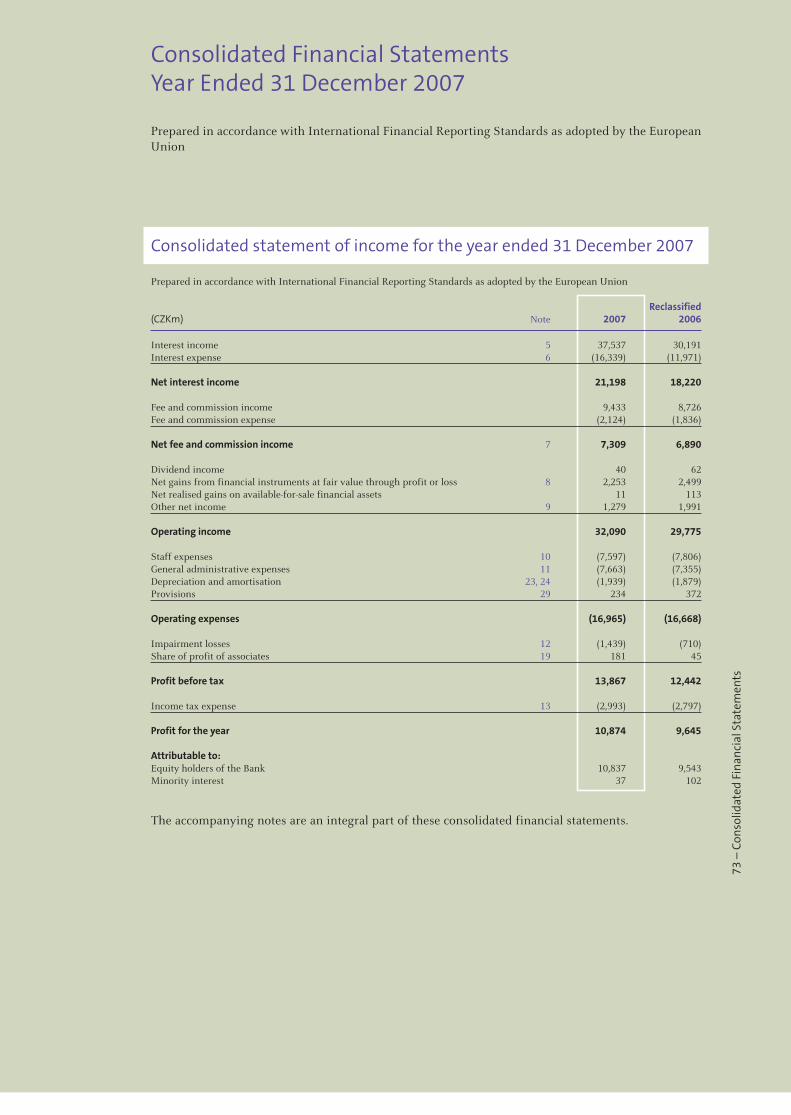
73
– Co
nsol
idat
ed F
inan
cial
Sta
tem
ents
Consolidated statement of income for the year ended 31 December 2007
Prepared in accordance with International Financial Reporting Standards as adopted by the European Union
Reclassified(CZKm) Note 2007 2006
Interest income 5 37,537 30,191Interest expense 6 (16,339) (11,971) Net interest income 21,198 18,220 Fee and commission income 9,433 8,726Fee and commission expense (2,124) (1,836) Net fee and commission income 7 7,309 6,890 Dividend income 40 62Net gains from financial instruments at fair value through profit or loss 8 2,253 2,499Net realised gains on available-for-sale financial assets 11 113Other net income 9 1,279 1,991 Operating income 32,090 29,775 Staff expenses 10 (7,597) (7,806)General administrative expenses 11 (7,663) (7,355)Depreciation and amortisation 23, 24 (1,939) (1,879)Provisions 29 234 372 Operating expenses (16,965) (16,668) Impairment losses 12 (1,439) (710)Share of profit of associates 19 181 45 Profit before tax 13,867 12,442 Income tax expense 13 (2,993) (2,797) Profit for the year 10,874 9,645 Attributable to: Equity holders of the Bank 10,837 9,543Minority interest 37 102
The accompanying notes are an integral part of these consolidated financial statements.
Consolidated Financial StatementsYear Ended 31 December 2007
Prepared in accordance with International Financial Reporting Standards as adopted by the European Union
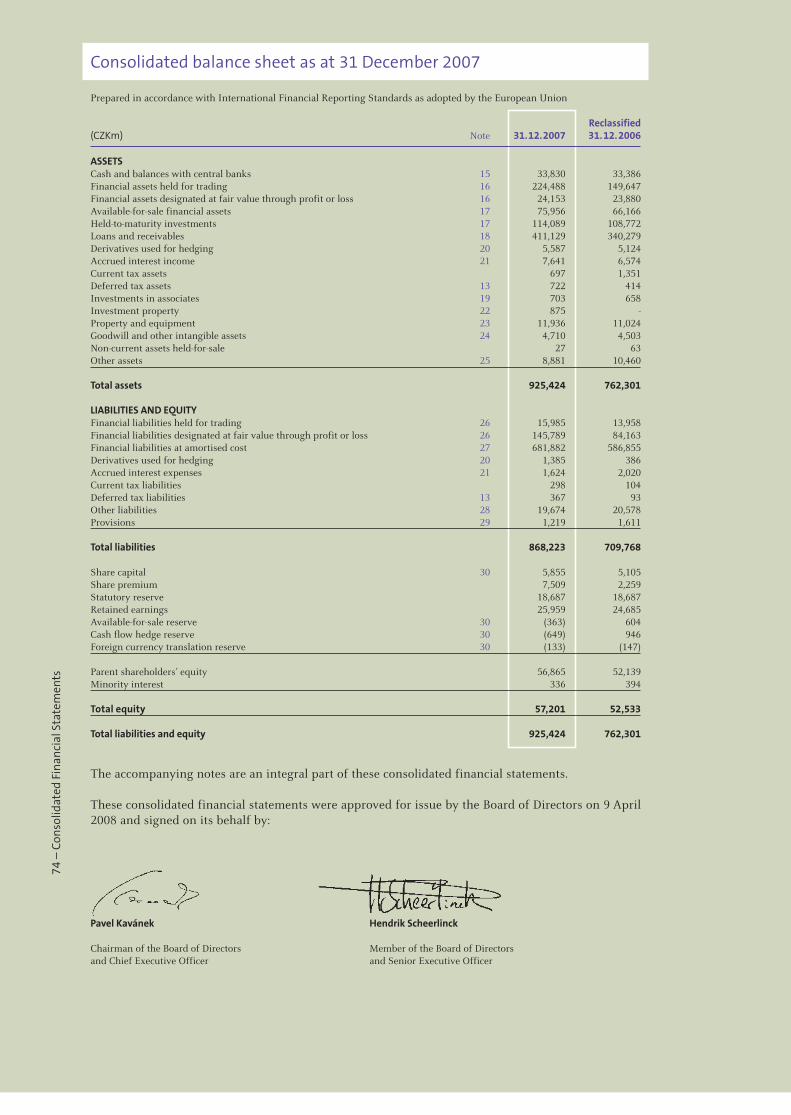
74
– Co
nsol
idat
ed F
inan
cial
Sta
tem
ents
Consolidated balance sheet as at 31 December 2007
Prepared in accordance with International Financial Reporting Standards as adopted by the European Union
Reclassified(CZKm) Note 31.12.2007 31.12.2006
ASSETS Cash and balances with central banks 15 33,830 33,386Financial assets held for trading 16 224,488 149,647Financial assets designated at fair value through profit or loss 16 24,153 23,880Available-for-sale financial assets 17 75,956 66,166Held-to-maturity investments 17 114,089 108,772Loans and receivables 18 411,129 340,279Derivatives used for hedging 20 5,587 5,124Accrued interest income 21 7,641 6,574Current tax assets 697 1,351Deferred tax assets 13 722 414Investments in associates 19 703 658Investment property 22 875 -Property and equipment 23 11,936 11,024Goodwill and other intangible assets 24 4,710 4,503Non-current assets held-for-sale 27 63Other assets 25 8,881 10,460 Total assets 925,424 762,301 LIABILITIES AND EQUITY Financial liabilities held for trading 26 15,985 13,958Financial liabilities designated at fair value through profit or loss 26 145,789 84,163Financial liabilities at amortised cost 27 681,882 586,855Derivatives used for hedging 20 1,385 386Accrued interest expenses 21 1,624 2,020Current tax liabilities 298 104Deferred tax liabilities 13 367 93Other liabilities 28 19,674 20,578Provisions 29 1,219 1,611 Total liabilities 868,223 709,768 Share capital 30 5,855 5,105Share premium 7,509 2,259Statutory reserve 18,687 18,687Retained earnings 25,959 24,685Available-for-sale reserve 30 (363) 604Cash flow hedge reserve 30 (649) 946Foreign currency translation reserve 30 (133) (147) Parent shareholders’ equity 56,865 52,139Minority interest 336 394 Total equity 57,201 52,533 Total liabilities and equity 925,424 762,301
The accompanying notes are an integral part of these consolidated financial statements.
These consolidated financial statements were approved for issue by the Board of Directors on 9 April 2008 and signed on its behalf by:
Pavel Kavánek Hendrik Scheerlinck
Chairman of the Board of Directors Member of the Board of Directorsand Chief Executive Officer and Senior Executive Officer
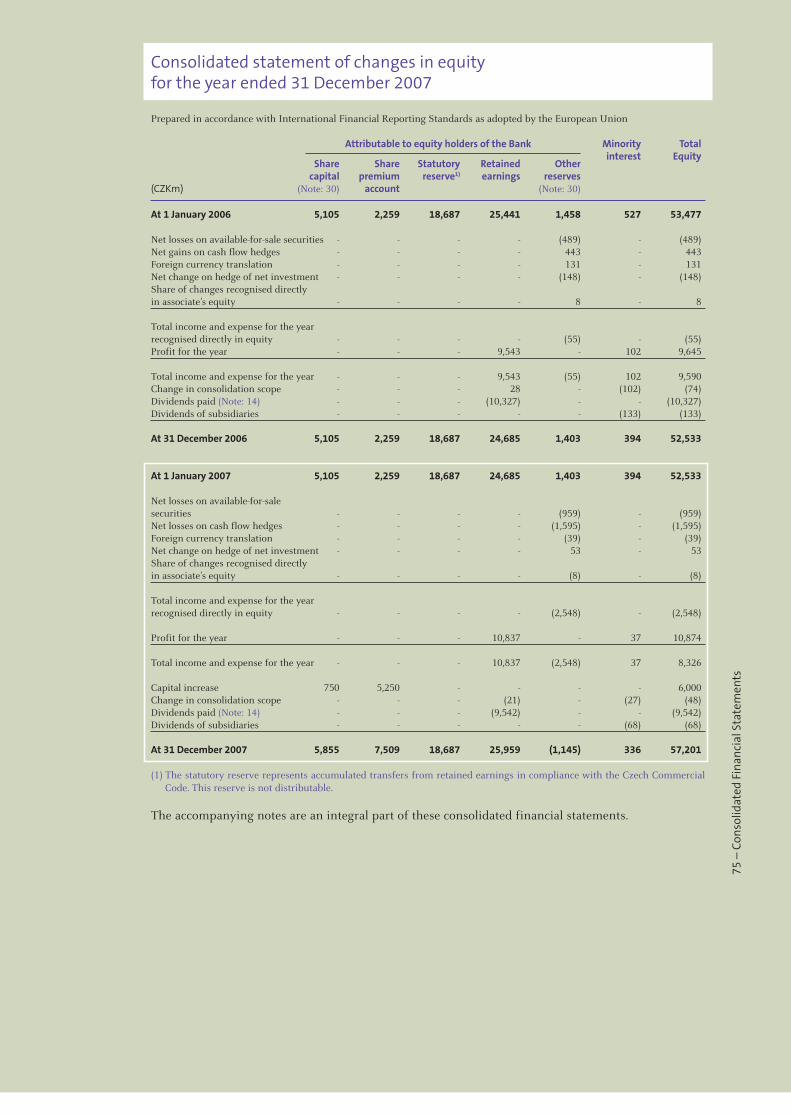
75
– Co
nsol
idat
ed F
inan
cial
Sta
tem
ents
Consolidated statement of changes in equity for the year ended 31 December 2007
Prepared in accordance with International Financial Reporting Standards as adopted by the European Union
Attributable to equity holders of the Bank Minority Total
Share Share Statutory Retained Other interest Equity
capital premium reserve1) earnings reserves (CZKm) (Note: 30) account (Note: 30)
At 1 January 2006 5,105 2,259 18,687 25,441 1,458 527 53,477 Net losses on available-for-sale securities - - - - (489) - (489)Net gains on cash flow hedges - - - - 443 - 443Foreign currency translation - - - - 131 - 131Net change on hedge of net investment - - - - (148) - (148)Share of changes recognised directly in associate’s equity - - - - 8 - 8 Total income and expense for the year recognised directly in equity - - - - (55) - (55)Profit for the year - - - 9,543 - 102 9,645 Total income and expense for the year - - - 9,543 (55) 102 9,590Change in consolidation scope - - - 28 - (102) (74)Dividends paid (Note: 14) - - - (10,327) - - (10,327)Dividends of subsidiaries - - - - - (133) (133) At 31 December 2006 5,105 2,259 18,687 24,685 1,403 394 52,533 At 1 January 2007 5,105 2,259 18,687 24,685 1,403 394 52,533
Net losses on available-for-sale securities - - - - (959) - (959)Net losses on cash flow hedges - - - - (1,595) - (1,595)Foreign currency translation - - - - (39) - (39)Net change on hedge of net investment - - - - 53 - 53Share of changes recognised directly in associate’s equity - - - - (8) - (8) Total income and expense for the year recognised directly in equity - - - - (2,548) - (2,548)
Profit for the year - - - 10,837 - 37 10,874 Total income and expense for the year - - - 10,837 (2,548) 37 8,326 Capital increase 750 5,250 - - - - 6,000Change in consolidation scope - - - (21) - (27) (48)Dividends paid (Note: 14) - - - (9,542) - - (9,542)Dividends of subsidiaries - - - - - (68) (68) At 31 December 2007 5,855 7,509 18,687 25,959 (1,145) 336 57,201
(1) The statutory reserve represents accumulated transfers from retained earnings in compliance with the Czech Commercial Code. This reserve is not distributable.
The accompanying notes are an integral part of these consolidated financial statements.
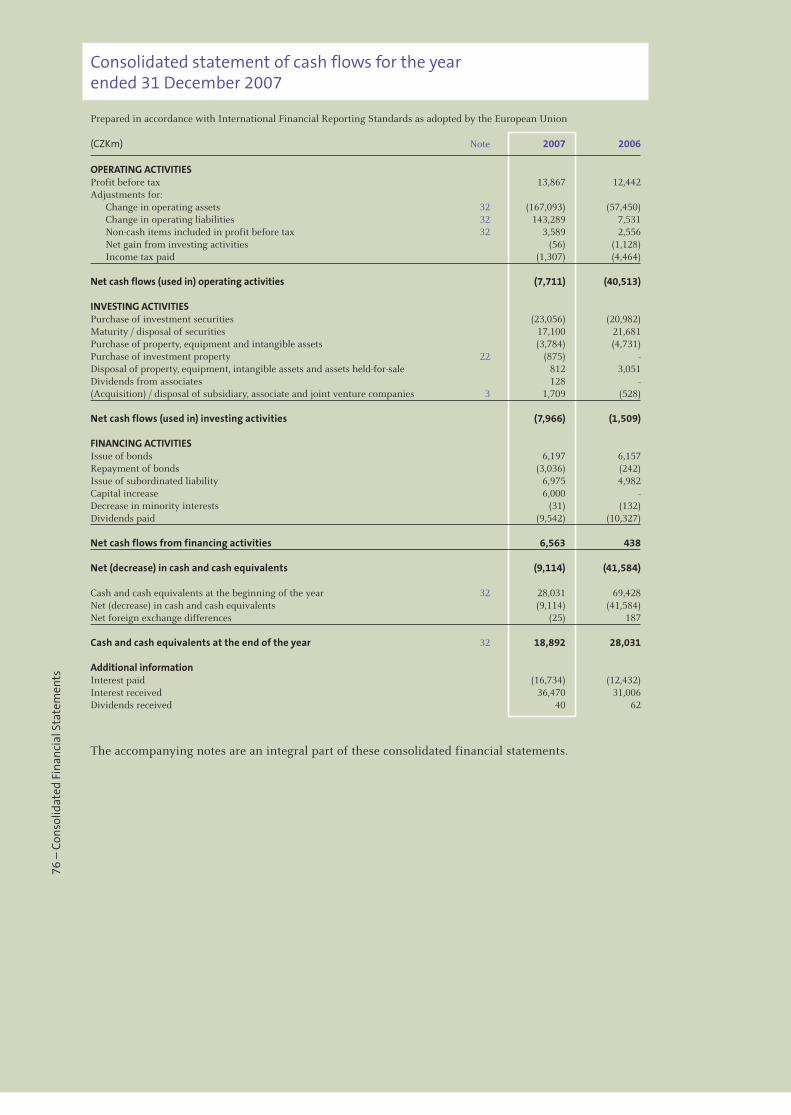
76
– Co
nsol
idat
ed F
inan
cial
Sta
tem
ents
Consolidated statement of cash flows for the year ended 31 December 2007
Prepared in accordance with International Financial Reporting Standards as adopted by the European Union
(CZKm) Note 2007 2006
OPERATING ACTIVITIES Profit before tax 13,867 12,442Adjustments for: Change in operating assets 32 (167,093) (57,450) Change in operating liabilities 32 143,289 7,531 Non-cash items included in profit before tax 32 3,589 2,556 Net gain from investing activities (56) (1,128) Income tax paid (1,307) (4,464) Net cash flows (used in) operating activities (7,711) (40,513) INVESTING ACTIVITIES Purchase of investment securities (23,056) (20,982)Maturity / disposal of securities 17,100 21,681Purchase of property, equipment and intangible assets (3,784) (4,731)Purchase of investment property 22 (875) -Disposal of property, equipment, intangible assets and assets held-for-sale 812 3,051Dividends from associates 128 -(Acquisition) / disposal of subsidiary, associate and joint venture companies 3 1,709 (528) Net cash flows (used in) investing activities (7,966) (1,509) FINANCING ACTIVITIES Issue of bonds 6,197 6,157Repayment of bonds (3,036) (242)Issue of subordinated liability 6,975 4,982Capital increase 6,000 -Decrease in minority interests (31) (132)Dividends paid (9,542) (10,327) Net cash flows from financing activities 6,563 438 Net (decrease) in cash and cash equivalents (9,114) (41,584) Cash and cash equivalents at the beginning of the year 32 28,031 69,428Net (decrease) in cash and cash equivalents (9,114) (41,584)Net foreign exchange differences (25) 187 Cash and cash equivalents at the end of the year 32 18,892 28,031
Additional informationInterest paid (16,734) (12,432)Interest received 36,470 31,006Dividends received 40 62
The accompanying notes are an integral part of these consolidated financial statements.
77
– Co
nsol
idat
ed F
inan
cial
Sta
tem
ents
Notes to the consolidated financial statements for the year ended 31 December 2007
According to International Financial Reporting Standards as adopted by the European Union
1. Corporate information
Československá obchodní banka, a. s. (the Bank or ČSOB) is a Czech joint-stock company with its registered office at Radlická 333/150 Prague 5, Czech Republic; the corporate ID is 00001350. ČSOB is a universal bank having its operations in the Czech Republic and the Slovak Republic and offering its domestic and foreign customers a wide range of financial services and products in Czech Crowns, Slovak Crowns and foreign currencies.
Furthermore, the ČSOB Group (Note: 3) provides its clients with financial services in the follow-ing areas: building savings and mortgages, asset management, collective investment, pension insurance, leasing, factoring and distribution of life and non-life insurance products.
2. Accounting policies
2.1 Basis of preparation
The consolidated financial statements have been prepared under the historical cost convention, except for available-for-sale investments, finan-cial assets and financial liabilities at fair value through profit or loss and all derivative contracts that have been measured at fair value. The consolidated financial statements are presented in millions of Czech Crowns (CZKm).
Statement of compliance
The ČSOB Group’s (Group) consolidated financial statements have been prepared in accordance with International Financial Reporting Standards as adopted by the European Union (EU IFRS).
Basis of consolidation
The consolidated financial statements include the Bank, all subsidiary companies that are controlled by the Bank (subsidiaries), all companies jointly controlled by the Bank (joint ventures) and all companies over which the Bank has significant influence (associates). The accounting policies of subsidiaries and joint ventures have been changed where necessary to ensure consistency with the policies adopted by the Group.
All intra-group balances, transactions, income and expenses, and gains and losses resulting from intra-group transactions are eliminated.
Subsidiaries are fully consolidated from the date on which control is transferred to the Group. Control is achieved when the Bank has the power to govern the financial and operating policies of an entity so as to obtain benefits from its activities. The results of subsidiaries acquired or disposed of during the year are included in the consolidated statement of income from the date of acquisition or up to the date of disposal, as appropriate.
Minority interests represent the portion of profit or loss and net assets not owned, directly or indi-rectly, by the Group and are presented separately in the consolidated statement of income and within equity in the consolidated balance sheet, separately from the parent shareholders’ equity.
Joint ventures included in the Group consolidation are proportionally consolidated, which requires that a venturer’s share of assets, liabilities, income and expenses in the joint venture to be combined with those of the venturer on a line-by-line basis. Joint control exists when two or more venturers are bound by a contractual arrangement whereby joint control is established.
2.2 Significant accounting judgements and estimates
While applying the Group’s accounting policies, the management has used its judgements and made estimates in determining the amounts recognised in the financial statements. The mostly used significant judgements and estimates are as follows:
Fair value of financial instruments
Where the fair values of financial assets and financial liabilities recorded on the balance sheet cannot be derived from active markets, they are determined using a variety of valuation techniques which include the application of mathematical models. If possible, the input to these models is taken from observable markets; if not, a degree of judgement is required to establish the fair values. The judgements include considerations of liquidity and model inputs such as correlation and volatility for longer dated derivatives.
Impairment losses on loans and advances
The Group reviews its problem loans and advances at each reporting date to assess whether an allowance for impairment should be recorded in the statement of income. In particular, judge-ment by the management is required to estimate the amount and timing of future cash flows when determining the level of allowance required. Such estimates are based on assumptions about a number of factors and actual results may differ, resulting in future changes to the allowance.
78
– Co
nsol
idat
ed F
inan
cial
Sta
tem
ents
In addition to specific allowances against individ-ually significant loans and advances, the Group also makes a collective impairment allowance against exposures which, although not specifi-cally identified as requiring a specific allowance, have a greater risk of default than when origi-nally granted. Doing this, the Group takes into consideration factors such as any deterioration in country risk, industry, and technological obsoles-cence, as well as identified structural weaknesses or deterioration in cash flows.
Deferred tax assets
Deferred tax assets are recognised for all unused tax losses to the extent that it is probable that taxable profit will be available against which the losses can be utilised. Significant management judgement is required to determine the amount of deferred tax assets that can be recognised, based upon the likely timing and level of future taxable profits together with future tax planning strategies.
2.3 Summary of significant accounting policies
The principal accounting policies applied in the preparation of these consolidated financial state-ments are set out below.
(1) Foreign currency translation
Items included in the financial statements of each of the Group’s entities are initially measured using the currency of the primary economic environment in which the entity operates („the functional currency“). The consolidated financial statements are presented in Czech Crowns, which is the Group’s presentation currency.
Foreign currency transactions are translated into the functional currency at the exchange rates prevailing at the dates of the transactions. Foreign exchange gains and losses resulting from the settlement of such transactions and from the translation of monetary assets and liabilities denominated in foreign currencies are recognised in the statement of income, except when deferred in equity as qualifying net investment hedges.
The results and financial position of all the group entities, which have a functional currency differ-ent from the presentation currency, are translated into the presentation currency as follows:
– assets and liabilities at the year-end exchange rates;
– income and expenses at average exchange rates for the year (unless this average is not a reason-able approximation of the cumulative effect of the rates prevailing on the transaction dates, in which case income and expenses are translated at the dates of the transactions);
– all resulting exchange differences are recogn-ised as a separate component of equity in the Foreign currency translation reserve.
On consolidation, exchange differences arising from the translation of the net investment in foreign entities, and of borrowings and other currency instruments designated as hedges of such investments, are taken to the Foreign currency translation reserve. When a foreign entity is sold, such exchange differences are recognised in the statement of income as part of the gain or loss on sale.
(2) Financial instruments - recognition and derecognition
Financial assets and liabilities are recognised in the balance sheet when the Group becomes a party to the contractual provisions of the financial instrument, except for „regular way“ purchases and sales of financial assets (see below). A financial asset is derecognised from the balance sheet when the contractual rights to the cash flows from the financial asset expire or are transferred. A financial liability is derecogn-ised from the balance sheet when the obligation specified in the contract is discharged, cancelled or expires.
A „regular way“ purchase or sale of a finan-cial asset is one in which the delivery of the asset is made within the time frame generally established by regulation or convention of the particular market concerned. For all categories of financial assets the Group recognises „regular way“ purchases and sales using settlement date accounting. Under settlement date accounting, a financial asset is recognised or derecognised in the balance sheet on the day it is physically transferred to or from the Group („settlement date“). The date on which the Group becomes a party to the contractual provisions of a finan-cial asset purchase or the Group loses control of the contractual rights from a financial asset sale is commonly referred to as the „trade date“. For financial assets at fair value through profit or loss and available-for-sale financial assets, fair value movements between „trade date“ and „settlement date“ in connection with purchases and sales are recognised in Net gains from financial instru-ments at fair value through profit or loss and in the Available-for-sale reserve, respectively. On the settlement date, a resulting financial asset or liability is recognised in the balance sheet at the fair value of the consideration given or received.
(3) Financial instruments - initial recognition and subsequent measurement
Classification of financial instruments depends on the purpose for which the financial instru-ments were acquired and their characteristics. All financial instruments are measured initially
79
– Co
nsol
idat
ed F
inan
cial
Sta
tem
ents
at their fair value plus, in the case of financial assets and financial liabilities not at fair value through profit or loss, any directly attributable incremental costs of acquisition or issue.
(i) Derivatives held for trading
Derivatives include foreign exchange contracts, interest rate futures, forward rate agreements, currency and interest rate swaps, currency and interest rate options. Derivatives are recorded at fair value and carried as assets when the fair value is positive and as liabilities when the fair value is negative. Changes in the fair value of derivatives held for trading are included in Net gains from financial instruments at fair value through profit or loss.
The Group occasionally purchases or issues financial instruments containing embedded derivatives. An embedded derivative is separated from the host contract and carried at fair value if the economic characteristics of the derivative are not closely related to the economic characteristics of the host contract and the hybrid instrument is not classified as at fair value through profit or loss. If a separated derivative does not qualify as a hedging derivative, it is designated as a trading derivative. To the extent that the Group cannot reliably identify and measure the embedded derivative, the entire contract is carried at fair value in the balance sheet with changes in fair value reflected in the statement of income.
(ii) Financial assets or financial liabilities at fair value through profit or loss
This category has two sub-categories: financial assets and financial liabilities held for trading, and those designated at fair value through profit or loss at inception.
Financial assets or financial liabilities held for trading, comprising financial instruments held for trading other than derivatives, are recorded in the balance sheet at fair value. Changes in fair value are recognised in Net gains from financial instruments at fair value through profit or loss. Interest income or expense is recorded in Net interest income. Dividends received are recorded in Dividend income. A financial asset or financial liability is classified in this category if acquired principally for the purpose of selling or repur-chasing in the near term.
Financial assets and financial liabilities desig-nated at fair value through profit or loss on initial recognition are classified in this category when the following criteria are met:
– the designation eliminates or significantly reduces the inconsistent treatment that would otherwise arise from measuring the assets or liabilities or recognising gains or losses on them on a different basis; or
– the assets and liabilities are part of a group of financial assets, financial liabilities or both which are managed and their performance evaluated on a fair value basis, in accordance with a documented risk management or invest-ment strategy; or
– the financial instrument contains an embedded derivative, unless the embedded derivative does not significantly modify the cash flows or it is clear, with little or no analysis, that it would not be separately recorded.
Financial assets and financial liabilities at fair value through profit or loss are recorded in the balance sheet at fair value. Changes in fair value are recorded in Net gains from financial instru-ments at fair value through profit or loss. Interest income or expense is recorded in Net interest income.
(iii) Held-to-maturity investments
Held-to-maturity investments are non-derivative financial assets with fixed or determinable payments and fixed maturities that the Group’s management has the positive intention and ability to hold to maturity. Were the Group to sell other than an insignificant amount of held-to-maturity assets, the entire category would be tainted and reclassified as available-for-sale.
After initial measurement, held-to-maturity investments are subsequently measured at amortised cost using the effective interest rate method, less any allowance for impairment. Amortised cost is calculated by taking into account any discount or premium on acquisition and fees that are an integral part of the effec-tive interest rate. The amortisation is included in Interest income. The losses arising from the impairment of such investments are recognised in the statement of income in Impairment losses.
(iv) Loans and receivables
Loans and receivables are non-derivative finan-cial assets with fixed or determinable payments that are not quoted in an active market and the Group has no intention of trading the financial asset.
After initial measurement, loans and receivables are subsequently measured at amortised cost using the effective interest rate method, less any allowance for impairment. Amortised cost is calculated by taking into account any discount or premium on acquisition and fees that are an integral part of the effective interest rate. The amortisation is included in Interest income. The losses arising from the impairment of such investments are recognised in the statement of income in Impairment losses.
80
– Co
nsol
idat
ed F
inan
cial
Sta
tem
ents
(v) Available-for-sale financial assets
Available-for-sale financial assets are those which are designated as such or do not qualify to be clas-sified as designated at fair value through profit or loss, held-to-maturity or loans and receivables.
After initial measurement, available-for-sale financial assets are subsequently measured at fair value. Unrealised gains and losses are recog-nised directly in equity in the Available-for-sale reserve on an after-tax basis, until the financial asset is derecognised or impaired, at which time the cumulative gain or loss previously recog-nised in equity is recognised in the statement of income. When an available-for-sale asset is disposed of, the unrealised gain or loss recorded in the Available-for-sale reserve is reversed and included in Net realised gains on available-for-sale financial assets. Interest income arising from available-for-sale assets calculated using the effective interest rate method is recorded sepa-rately in Net interest income. Dividends received from available-for-sale equity shares are recorded in Dividend income.
(vi) Financial liabilities at amortised cost
Financial liabilities at amortised cost are non-derivative financial liabilities where the substance of the contractual arrangement results in the Group having an obligation either to deliver cash or another financial asset to the holder.
After initial measurement, those financial liabili-ties are measured at amortised cost.
(4) Repurchase and reverse repurchase agreements
Securities sold under agreements to repurchase at a specified future date (repos) remain on the balance sheet. The corresponding cash received is recognised in the balance sheet in Financial liabilities designated at fair value through profit of loss or Financial liabilities at amortised cost, reflecting its economic substance as a loan to the Group. The difference between the sale and repurchase prices is treated as Interest expense and is accrued over the life of the agreement.
Conversely, securities purchased under agree-ments to resell at a specified future date (reverse repos) are not recognised in the balance sheet. The corresponding cash paid is recognised in the balance sheet in Financial assets held for trading or Loans and receivables. The difference between the purchase and resale prices is treated as Interest income and is accrued over the life of the agreement.
(5) Determination of fair value
The fair value of a financial instrument is the amount for which an asset could be exchanged or a liability settled between knowledgeable, willing parties in an arm’s length transaction. Financial instruments classified as financial assets and financial liabilities at fair value through profit or loss or available-for-sale are fair valued using quoted market prices if there is a published price quotation in an active public market. For finan-cial instruments that are not traded on an active public market their fair values are estimated using pricing models, quoted prices of instruments with similar characteristics, or discounted cash flows. Those fair value estimation techniques are significantly affected by assumptions used by the Group including the discount rate and estimates of future cash flows.
(6) Impairment of financial assets
The Group assesses at each balance sheet date whether there is objective evidence that a finan-cial asset or a group of financial assets is impaired. A financial asset or a group of financial assets is impaired and impairment losses are incurred if, and only if, there is objective evidence of impairment as a result of one or more events that occurred after the initial recognition of the asset (a ‘loss event’) and that loss event (or events) has an impact on the estimated future cash flows of the financial asset or group of assets that can be reliably estimated. Objective evidence that a finan-cial asset or a group of assets is impaired includes observable data that comes to the attention of the Group about the following loss events:
– significant financial difficulty of the issuer or obligor;
– a breach of contract, such as a default or delin-quency in interest or principal payments;
– the Group granting to the borrower, for economic or legal reasons relating to the borrower’s financial difficulty, a concession that the lender would not otherwise consider;
– it becoming probable that the borrower will enter bankruptcy or other financial reorganisation;
– the disappearance of an active market for that financial asset because of financial difficulties; or
– observable data indicating that there is a measurable decrease in the estimated future cash flows from a group of financial assets since the initial recognition of those assets, although the decrease cannot yet be identified with the individual financial assets in the group, including:

81
– Co
nsol
idat
ed F
inan
cial
Sta
tem
ents
• adverse changes in the payment status of borrowers in the group; or
• national or local economic conditions that correlate with defaults on the assets in the group.
(i) Assets carried at amortised cost
The Group first assesses whether objective evidence of impairment exists individually for financial assets that are individually significant, and indi-vidually or collectively for financial assets that are not individually significant. If the Group deter-mines that no objective evidence of impairment exists for an individually assessed financial asset, whether significant or not, it includes the asset in a group of financial assets with similar credit risk characteristics and collectively assesses them for impairment. Assets that are individually assessed for impairment and for which an impairment loss is or continues to be recognised are not included in a collective assessment of impairment.
If there is objective evidence that an impairment loss on loans and receivables or held-to-maturity investments carried at amortised cost has been incurred, the amount of the loss is measured as the difference between the asset’s carrying amount and the present value of estimated future cash flows (excluding future credit losses that have not been incurred) discounted at the financial asset’s original effective interest rate. The carrying amount of the asset is reduced through the use of an allowance account and the amount of the loss is recognised in the statement of income. If a loan or held-to-maturity investment has a variable interest rate, the discount rate for measuring any impairment loss is the current effective interest rate determined under the contract. As a practical expedient, the Group may measure impairment on the basis of an instrument’s fair value using an observable market price. The calculation of the present value of the estimated future cash flows of a collateralised financial asset reflects the cash flows that may result from foreclosure less costs for obtaining and selling the collateral.
For the purposes of a collective evaluation of impairment, financial assets are grouped on the basis of similar credit risk characteristics. Those characteristics are relevant to the estimation of future cash flows for groups of such assets by being indicative of the debtors’ ability to pay all amounts due according to the contractual terms of the assets being evaluated.
Future cash flows in a group of financial assets that are collectively evaluated for impairment are estimated on the basis of the contractual cash flows of the assets in the group and histori-cal loss experience for assets with credit risk
characteristics similar to those in the group. Historical loss experience is adjusted on the basis of current observable data to reflect the effects of current conditions that did not affect the period on which the historical loss experience is based and to remove the effects of conditions in the historical period that do not exist currently.
Estimates of changes in future cash flows for groups of assets should reflect and be direction-ally consistent with changes in related observable data from period to period. The methodology and assumptions used for estimating future cash flows are reviewed regularly by the Group to reduce any differences between loss estimates and actual loss experience.
When a loan is uncollectible, it is written-off against the related allowance for impairment. Such loans are written-off after all the necessary procedures have been completed and the amount of the loss has been determined. Subsequent recoveries of amounts previously written-off are recorded in the statement of income in Impairment losses.
If, in a subsequent period, the amount of the impairment loss decreases and the decrease can be related objectively to an event occurring after the impairment was recognised, the previ-ously recognised impairment loss is reversed by adjusting the allowance account. The amount of the reversal is recognised in the statement of income.
(ii) Assets carried at fair value
The Group assesses at each balance sheet date whether there is objective evidence that a financial asset or a group of financial assets is impaired. In the case of equity investments classified as available-for-sale, a significant or prolonged decline in the fair value of the secu-rity below its cost is considered in determining whether the assets are impaired. If any such evidence exists for available-for-sale financial assets, the cumulative loss - measured as the difference between the acquisition cost and the current fair value, less any impairment loss on that financial asset previously recognised in profit or loss - is removed from equity and recog-nised in the statement of income. Impairment losses recognised in the statement of income on equity instruments are not reversed through the statement of income. If, in a subsequent period, the fair value of a debt instrument classified as available-for-sale increases and the increase can be objectively related to an event occurring after the impairment loss was recognised in profit or loss, the impairment loss is reversed through the statement of income.
82
– Co
nsol
idat
ed F
inan
cial
Sta
tem
ents
(iii) Renegotiated loans
Where possible, the Group seeks to restructure loans rather than to take possession of collat-eral. This may involve extending the payment arrangements and the agreement of new loan conditions. Once the terms have been renegoti-ated, the loan is no longer considered past due, however, the rating of the client cannot be improved only based on the restructuring. The management continuously reviews renegotiated loans to ensure that all criteria are met and that future payments are likely to occur. The loans continue to be subject to an individual or collec-tive impairment assessment, calculated using the loan’s original effective interest rate.
(7) Hedge accounting
(i) Cash flow hedges
The Group uses derivatives, designated as hedg-ing on the date a contract is entered into, as cash flow hedges to manage the Group’s interest rate risk. Cash flow hedges are used to minimise the variability in cash flows of interest-earning assets or interest-earning liabilities or anticipated trans-actions caused by interest rate fluctuations. Hedge accounting is used for derivatives designated in this way provided certain criteria are met. The Group’s criteria for a derivative instrument to be accounted for as a hedge include:
– formal documentation of the hedging instru-ment, hedged item, hedging objective, strategy and relationship is prepared before hedge accounting is applied;
– the hedge is documented showing that it is expected to be highly effective in offsetting the risk in the hedged item throughout the report-ing period;
– the hedge is highly effective on an ongoing basis. A derivative is considered to be highly effective if the Group achieves offsetting changes in cash flows between 80 percent and 125 percent for the risk being hedged.
The effective portion of the change in the fair value of a cash flow hedging derivative is recorded in the Cash flow hedge reserve. The ineffective portion is recorded directly in Net gains from financial instruments at fair value through profit or loss. Amounts in the Cash flow hedge reserve are reclassified into the statement of income in a manner consistent with the earnings recognition pattern of the underlying hedged item. If a cash flow hedge is terminated or the hedge designation removed the related remaining amounts in the Cash flow hedge reserve are reclassified into earnings in the same period during which the hedged item affects income. If the hedged anticipated trans-action is no longer expected to occur the related
remaining amounts in the Cash flow hedge reserve are recognized immediately in the state-ment of income.
(ii) Hedge of a net investment in foreign operations
The hedge of a net investment in foreign opera-tions is accounted for on a similar basis to cash flow hedges. Any gain or loss on the hedging instrument relating to the effective portion of the hedge is recognised in the Foreign currency translation reserve. The gain or loss relating to the ineffective portion is recognised immediately in the statement of income. Gains and losses accumulated in equity are included in the state-ment of income when the foreign operation is disposed of.
(8) Offsetting financial instruments
Financial assets and liabilities are offset and the net amount reported in the balance sheet when there is a legally enforceable right to set off the recognised amounts and there is an intention to settle on a net basis, or realise the asset and settle the liability simultaneously.
(9) Leasing
The determination of whether an arrangement is, or contains a lease is based on the substance of the arrangement and requires an assessment of whether the fulfilment of the arrangement is dependent on the use of a specific asset or assets and the arrangement conveys a right to use the asset.
(i) Group company as a lessee
The leases entered into by the Group are primarily operating leases. The total payments made under operating leases are charged to the statement of income on a straight-line basis over the period of the lease.
When an operating lease is terminated before the lease period has expired, any payment required to be made to the lessor by way of penalty is recognised as an expense in the period in which termination takes place.
(ii) Group company as a lessor
Finance leases, where the Group transfers substantially all the risk and benefits inci-dental to ownership of the leased item to the lessee, are reflected as finance lease receivables in the balance sheet in Loans and receivables. A receivable is recognized over the leasing period in an amount equaling the present value of the lease payments using the implicit rate of interest and including any guaranteed residual value. All income resulting from the receivable is included in Interest income in the statement of income.
83
– Co
nsol
idat
ed F
inan
cial
Sta
tem
ents
Leases, where the Group does not transfer substantially all the risk and benefits of owner-ship of the asset, are classified as operating leases. The Group leases out certain of its properties under operating leases, thus generating rental income. Initial direct costs incurred in negotiat-ing operating leases are added to the carrying amount of the leased asset and recognized as an expense over the lease term on the same basis as rental income. Contingent rents are recognized as revenue in the period in which they are earned.
(10) Recognition of income and expenses
Revenue is recognised to the extent that it is prob-able that the economic benefits will flow to the Group and the revenue can be reliably measured. The following specific recognition criteria must also be met before revenue is recognised:
(i) Interest income and expense
For all financial instruments measured at amortised cost and interest bearing financial instruments classified as available-for-sale financial invest-ments, interest income or expense is recorded using the effective interest rate method.
The effective interest rate method is a method of calculating the amortised cost of a financial asset or a financial liability and of allocating the interest income or interest expense over the relevant period. The effective interest rate is the rate that exactly discounts estimated future cash payments or receipts through the expected life of the financial instrument or, when appropriate, a shorter period to the net carrying amount of the financial asset or financial liability. When calculating the effective interest rate, the Group estimates cash flows considering all contractual terms of the financial instrument but does not consider future credit losses. The calculation includes all fees and amounts paid or received between parties to the contract that are an inte-gral part of the effective interest rate, transaction costs and all other premiums or discounts.
(ii) Fee and commission income
Fees and commissions are generally recognised on an accrual basis when the service has been provided. Loan origination fees for loans that are probable of being drawn down, are deferred and recognised as an adjustment to the effective yield on the loan. Commissions and fees arising from negotiating, or participating in the negotia-tion of a transaction for a third party, such as the acquisition of loans, shares or other securities or the purchase or sale of businesses, are recognised on the completion of the underlying transaction. Portfolio and other management advisory and service fees are recognised based on the appli-cable service contracts. Asset management fees related to investment funds are accrued over the period for which the service is provided.
(iii) Dividend income
Revenue is recognised when the Group’s right to receive the payment is established.
(iv) Net gains from financial instruments at fair value through profit or loss
Net gains from financial instruments at fair value through profit or loss include all gains and losses from changes in the fair value of financial assets and financial liabilities held for trading and those designated at fair value through profit or loss. This includes any ineffectiveness recorded in hedging transactions.
(11) Cash and cash equivalents
For the purposes of the cash flow statement, cash and cash equivalents comprise balances with less than 3 months maturity from the date of acquisi-tion including: cash and balances with central banks (excluding mandatory minimum reserves), loans and advances to credit institutions and deposits from credit institutions.
(12) Investment property
The Group holds certain properties as investments to earn rental income, for capital appreciation or both. Investment properties are measured initially at cost, including transaction costs. Subsequent to initial recognition, investment properties are carried at cost less any accumulated depre-ciation and any accumulated impairment losses. Depreciation is calculated under the straight-line method to write-off the cost of each asset to its residual value over its estimated useful life.
(13) Investments in associates
Associates are all entities over which the Group has significant influence but not control or joint control, generally accompanying a shareholding of between 20% and 50% of the voting rights.
Investments in associates are accounted for by the equity method. The Group’s share of associates’ post-acquisition profits or losses is recognised in the statement of income, and its share of post-acquisition movements in equity is recognised in Retained earnings or in the Available-for-sale reserve.
(14) Property and equipment
Property and equipment includes Group occu-pied properties, IT and communication and other machines and equipment.
Land is carried at cost. Buildings and equipment are carried at cost less accumulated depreciation. The assets’ residual values and useful lives are reviewed, and adjusted if appropriate, at each balance sheet date.
84
– Co
nsol
idat
ed F
inan
cial
Sta
tem
ents
Depreciation is calculated under the straight-line method to write-off the cost of each asset to its residual value over its estimated useful life, as follows:
Buildings 30 yearsIT equipment 4 yearsOffice equipment 10 yearsOther 4-30 years
The assets’ residual values and useful lives are reviewed, and adjusted if appropriate, at each balance sheet date.
Gains and losses on disposals are determined by comparing the proceeds with the carrying amount. These are included as a net amount in Other net income.
Assets that are subject to depreciation are reviewed for impairment at each balance sheet date or whenever events or changes in circum-stances indicate that the carrying amount may not be recoverable. An asset’s carrying amount is written down immediately to its recoverable amount if the asset’s carrying amount is greater than its estimated recoverable amount. The recoverable amount is the higher of the asset’s fair value less costs to sell and value in use.
When it is highly probable that an asset will be sold, such an asset is classified in Non-current assets held-for-sale at the lower of its carrying amount and fair value less costs to sell.
(15) Business combinations and goodwill
The purchase method of accounting is used to account for the acquisition of subsidiaries by the Group. The cost of an acquisition is measured as the fair value of the assets given, equity instru-ments issued and liabilities incurred or assumed at the date of exchange, plus costs directly attribut-able to the acquisition. Identifiable assets acquired and liabilities and contingent liabilities assumed in a business combination are measured initially at their fair values at the acquisition date, irrespec-tive of the extent of any minority interest.
Goodwill represents the excess of the cost of the business combination over the acquirer’s interest in the net fair value of the identifiable assets, liabilities and contingent liabilities at the date of acquisition. Goodwill is tested annually for impairment and carried at cost less accumulated impairment losses.
If the cost of acquisition is less than the fair value of the net assets of the acquired business or subsidiary company, the difference is recognised directly in the statement of income.
For the purpose of impairment testing, goodwill acquired in a business combination is allocated to the cash-generating unit which is expected to benefit from the synergies of the combination. A cash-generating unit represents the lowest level within the Group at which the goodwill is monitored for internal management purposes.
(16) Intangible assets
Intangible assets include software, licences, customer relationship and other intangible assets.
Intangible assets are carried at cost less accumu-lated amortisation. The assets’ residual values and useful lives are reviewed, and adjusted if appropriate, at each balance sheet date.
Amortisation of the software and other intangible assets is calculated under the straight-line method to write-off the cost of each asset to its residual value over its estimated useful life, as follows:
Software 4 yearsOther intangible assets 5 years
Amortisation of the customer relationship is calculated under the diminishing balance method during the economic useful life. The economic useful life is the period over which the Group receives significant cash flows from the intan-gible assets.
Gains and losses on disposals are determined by comparing proceeds with the carrying amount. These are included as a net amount in Other net income.
(17) Financial guarantees
In the ordinary course of business, the Group provides financial guarantees consisting of letters of credit and letters of guarantee. Financial guar-antees are recognised in the financial statements at the higher of the amortised premium and the best estimates of expenditure required to settle any financial obligation arising as a result of the guarantee and are presented in Provisions. The fee is recognised in the statement of income in Fee and commission income. Any increase and decrease in the liability relating to financial guarantees is included in Impairment losses.
(18) Employee retirement benefits
Pensions are provided by the Czech Republic and Slovak Republic to resident employees financed by salary-based social security contributions of the employees and their employers.
85
– Co
nsol
idat
ed F
inan
cial
Sta
tem
ents
Certain Group companies contribute to a defined contribution retirement benefit scheme for participating Czech Republic and Slovak Republic employees, which is in addition to the employer social security contributions required by the Czech Republic and Slovak Republic. Contributions are charged to the statement of income as they are made.
(19) Provisions
Provisions are recognised when the Group has a present legal or constructive obligation as a result of past events, it is probable that an outflow of resources embodying economic benefits will be required to settle the obligation, and a reliable estimate of the amount of the obligation can be made.
(20) Taxes
There are two components of income tax expense: current and deferred. Current income tax expense approximates amounts to be paid or refunded for taxes for the appropriate period. Deferred tax assets and liabilities are recognised due to differences in the bases of assets and liabilities as measured by tax laws and their bases as reported in the financial statements.
All deferred tax assets are recognised to the extent that it is probable that future taxable profit will be available against which the deferred tax assets can be utilised. Deferred tax assets and liabilities are offset in the financial statements where a right of set-off exists.
Deferred tax related to the fair value movements of cash flow hedges and available-for-sale securi-ties, which are charged or credited directly to equity, is also credited or charged directly to equity and is subsequently recognised in the statement of income together with the deferred gain or loss.
The Group records a net deferred tax asset under Deferred tax assets and a net deferred tax liability under Deferred tax liabilities.
(21) Fiduciary activities
The Group commonly acts in fiduciary activities that result in the holding or placing of assets on behalf of individuals and institutions. The assets and income arising thereon are excluded from these financial statements, as they are not assets of the Group.
(22) Segment reporting
A business segment is a group of assets and opera-tions engaged in providing products or services that are subject to risks and returns that are different from those of other business segments. A geographical segment is engaged in providing products or services within a particular economic environment that are subject to risks and returns that are different from those of segments operat-ing in other economic environments.
2.4 Future changes in accounting policies
Certain new standards, amendments and interpre-tations have been published which are mandatory for the Group’s accounting periods beginning on or after 1 January 2008 or later periods and which the Group has not early adopted. The Group is expecting to adopt them in accordance with the effective date of the standards:
IFRS 8, Operating Segments (effective from 1 January 2009)
This standard requires disclosure of information about the Group’s operating segments and replaces the requirement to determine primary and second-ary reporting segments of the Group. The Group determined that the operating segments would be the same as the business segments currently identified under IAS 14, Segment Reporting.
Other new standards, amendments or inter-pretations, the Group has not early adopted the following other new interpretations:
– IAS 23, Borrowing Costs (effective for periods beginning on or after 1 January 2009).
– IFRIC 11, IFRS 2 - Group and Treasury Share Transactions (effective for periods beginning on or after 1 March 2007).
– IFRIC 12, Service Concession Arrangements (effective for periods beginning on or after 1 January 2008).
– IFRIC 13, Customer Loyalty Programmes (effective for periods beginning on or after 1 July 2008).
– IFRIC 14, IAS 19 - The Limit on a Defined Benefit Asset, Minimum Funding Requirements and their Interaction (effective for periods begin-ning on or after 1 January 2008).
Unless otherwise described above, the new standards, amendments and interpretations are not expected to significantly affect the Group’s financial statements.
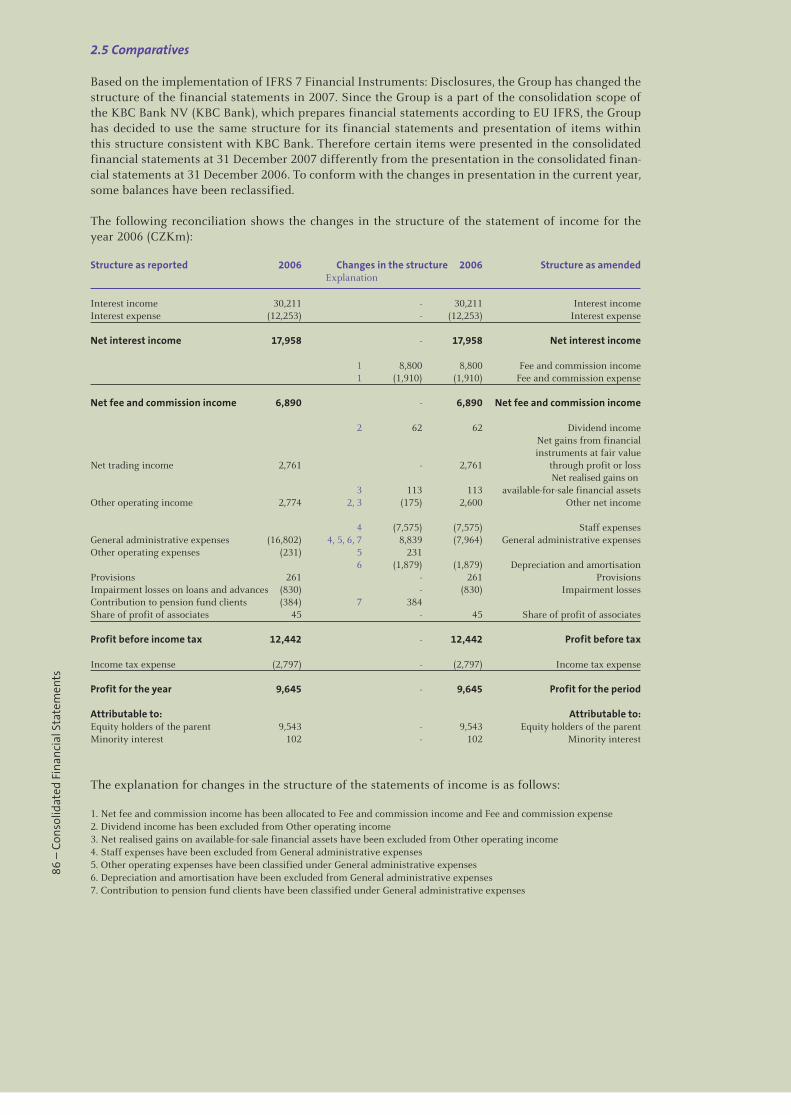
86
– Co
nsol
idat
ed F
inan
cial
Sta
tem
ents
2.5 Comparatives
Based on the implementation of IFRS 7 Financial Instruments: Disclosures, the Group has changed the structure of the financial statements in 2007. Since the Group is a part of the consolidation scope of the KBC Bank NV (KBC Bank), which prepares financial statements according to EU IFRS, the Group has decided to use the same structure for its financial statements and presentation of items within this structure consistent with KBC Bank. Therefore certain items were presented in the consolidated financial statements at 31 December 2007 differently from the presentation in the consolidated finan-cial statements at 31 December 2006. To conform with the changes in presentation in the current year, some balances have been reclassified.
The following reconciliation shows the changes in the structure of the statement of income for the year 2006 (CZKm):
Structure as reported 2006 Changes in the structure 2006 Structure as amended Explanation
Interest income 30,211 - 30,211 Interest incomeInterest expense (12,253) - (12,253) Interest expense Net interest income 17,958 - 17,958 Net interest income 1 8,800 8,800 Fee and commission income 1 (1,910) (1,910) Fee and commission expense Net fee and commission income 6,890 - 6,890 Net fee and commission income 2 62 62 Dividend income Net gains from financial instruments at fair value Net trading income 2,761 - 2,761 through profit or loss Net realised gains on 3 113 113 available-for-sale financial assetsOther operating income 2,774 2, 3 (175) 2,600 Other net income 4 (7,575) (7,575) Staff expensesGeneral administrative expenses (16,802) 4, 5, 6, 7 8,839 (7,964) General administrative expensesOther operating expenses (231) 5 231 6 (1,879) (1,879) Depreciation and amortisationProvisions 261 - 261 ProvisionsImpairment losses on loans and advances (830) - (830) Impairment lossesContribution to pension fund clients (384) 7 384 Share of profit of associates 45 - 45 Share of profit of associates Profit before income tax 12,442 - 12,442 Profit before tax Income tax expense (2,797) - (2,797) Income tax expense Profit for the year 9,645 - 9,645 Profit for the period Attributable to: Attributable to:Equity holders of the parent 9,543 - 9,543 Equity holders of the parentMinority interest 102 - 102 Minority interest
The explanation for changes in the structure of the statements of income is as follows:
1. Net fee and commission income has been allocated to Fee and commission income and Fee and commission expense2. Dividend income has been excluded from Other operating income3. Net realised gains on available-for-sale financial assets have been excluded from Other operating income4. Staff expenses have been excluded from General administrative expenses5. Other operating expenses have been classified under General administrative expenses6. Depreciation and amortisation have been excluded from General administrative expenses7. Contribution to pension fund clients have been classified under General administrative expenses
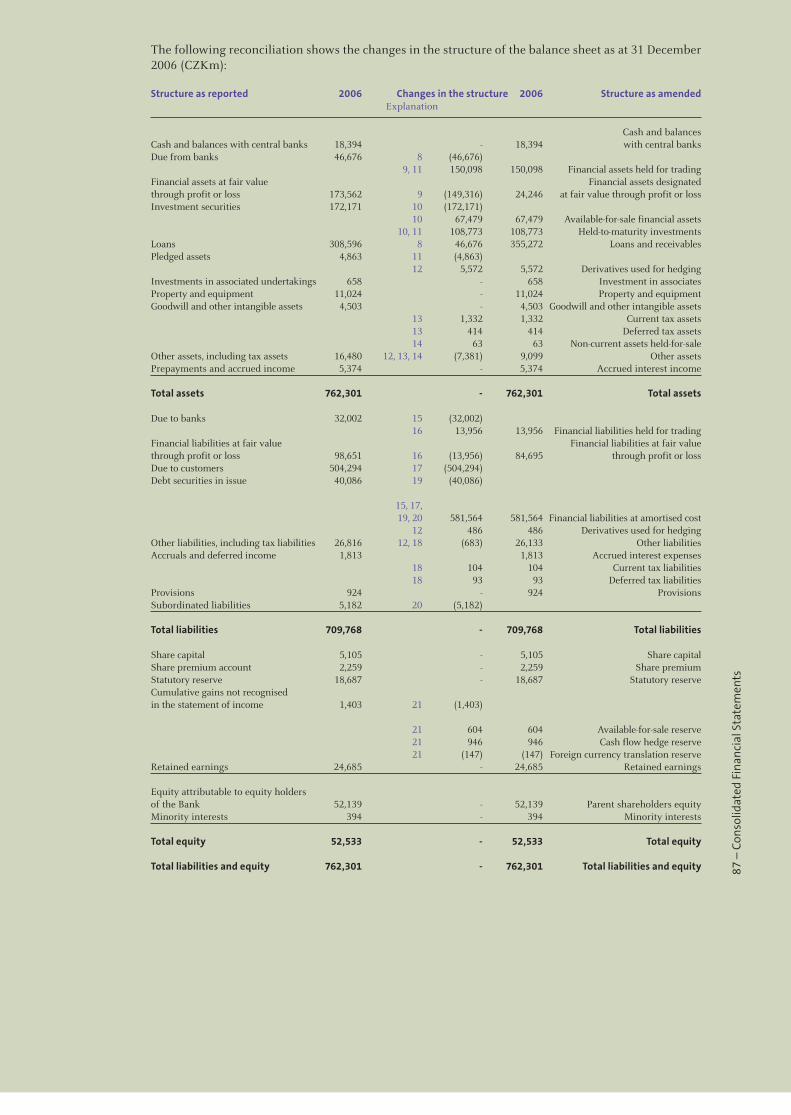
87
– Co
nsol
idat
ed F
inan
cial
Sta
tem
ents
The following reconciliation shows the changes in the structure of the balance sheet as at 31 December 2006 (CZKm):
Structure as reported 2006 Changes in the structure 2006 Structure as amended Explanation
Cash and balances Cash and balances with central banks 18,394 - 18,394 with central banksDue from banks 46,676 8 (46,676) 9, 11 150,098 150,098 Financial assets held for tradingFinancial assets at fair value Financial assets designatedthrough profit or loss 173,562 9 (149,316) 24,246 at fair value through profit or lossInvestment securities 172,171 10 (172,171) 10 67,479 67,479 Available-for-sale financial assets 10, 11 108,773 108,773 Held-to-maturity investmentsLoans 308,596 8 46,676 355,272 Loans and receivablesPledged assets 4,863 11 (4,863) 12 5,572 5,572 Derivatives used for hedgingInvestments in associated undertakings 658 - 658 Investment in associatesProperty and equipment 11,024 - 11,024 Property and equipmentGoodwill and other intangible assets 4,503 - 4,503 Goodwill and other intangible assets 13 1,332 1,332 Current tax assets 13 414 414 Deferred tax assets 14 63 63 Non-current assets held-for-saleOther assets, including tax assets 16,480 12, 13, 14 (7,381) 9,099 Other assetsPrepayments and accrued income 5,374 - 5,374 Accrued interest income Total assets 762,301 - 762,301 Total assets Due to banks 32,002 15 (32,002) 16 13,956 13,956 Financial liabilities held for tradingFinancial liabilities at fair value Financial liabilities at fair valuethrough profit or loss 98,651 16 (13,956) 84,695 through profit or lossDue to customers 504,294 17 (504,294) Debt securities in issue 40,086 19 (40,086)
15, 17, 19, 20 581,564 581,564 Financial liabilities at amortised cost 12 486 486 Derivatives used for hedgingOther liabilities, including tax liabilities 26,816 12, 18 (683) 26,133 Other liabilitiesAccruals and deferred income 1,813 1,813 Accrued interest expenses 18 104 104 Current tax liabilities 18 93 93 Deferred tax liabilitiesProvisions 924 - 924 ProvisionsSubordinated liabilities 5,182 20 (5,182) Total liabilities 709,768 - 709,768 Total liabilities Share capital 5,105 - 5,105 Share capitalShare premium account 2,259 - 2,259 Share premiumStatutory reserve 18,687 - 18,687 Statutory reserveCumulative gains not recognised in the statement of income 1,403 21 (1,403)
21 604 604 Available-for-sale reserve 21 946 946 Cash flow hedge reserve 21 (147) (147) Foreign currency translation reserveRetained earnings 24,685 - 24,685 Retained earnings Equity attributable to equity holders of the Bank 52,139 - 52,139 Parent shareholders equityMinority interests 394 - 394 Minority interests Total equity 52,533 - 52,533 Total equity Total liabilities and equity 762,301 - 762,301 Total liabilities and equity
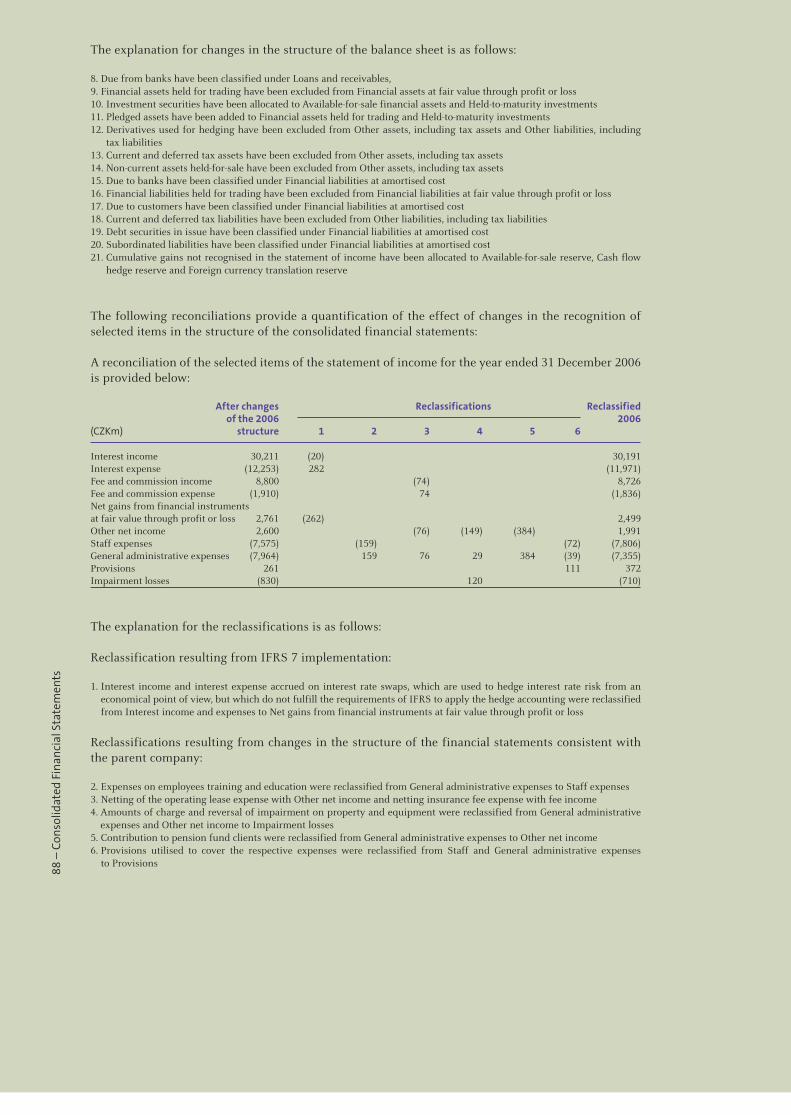
88
– Co
nsol
idat
ed F
inan
cial
Sta
tem
ents
The explanation for changes in the structure of the balance sheet is as follows:
8. Due from banks have been classified under Loans and receivables,9. Financial assets held for trading have been excluded from Financial assets at fair value through profit or loss10. Investment securities have been allocated to Available-for-sale financial assets and Held-to-maturity investments11. Pledged assets have been added to Financial assets held for trading and Held-to-maturity investments12. Derivatives used for hedging have been excluded from Other assets, including tax assets and Other liabilities, including
tax liabilities13. Current and deferred tax assets have been excluded from Other assets, including tax assets14. Non-current assets held-for-sale have been excluded from Other assets, including tax assets15. Due to banks have been classified under Financial liabilities at amortised cost16. Financial liabilities held for trading have been excluded from Financial liabilities at fair value through profit or loss17. Due to customers have been classified under Financial liabilities at amortised cost18. Current and deferred tax liabilities have been excluded from Other liabilities, including tax liabilities19. Debt securities in issue have been classified under Financial liabilities at amortised cost20. Subordinated liabilities have been classified under Financial liabilities at amortised cost21. Cumulative gains not recognised in the statement of income have been allocated to Available-for-sale reserve, Cash flow
hedge reserve and Foreign currency translation reserve
The following reconciliations provide a quantification of the effect of changes in the recognition of selected items in the structure of the consolidated financial statements:
A reconciliation of the selected items of the statement of income for the year ended 31 December 2006 is provided below:
After changes Reclassifications Reclassified of the 2006 2006(CZKm) structure 1 2 3 4 5 6
Interest income 30,211 (20) 30,191Interest expense (12,253) 282 (11,971)Fee and commission income 8,800 (74) 8,726Fee and commission expense (1,910) 74 (1,836)Net gains from financial instruments at fair value through profit or loss 2,761 (262) 2,499Other net income 2,600 (76) (149) (384) 1,991Staff expenses (7,575) (159) (72) (7,806)General administrative expenses (7,964) 159 76 29 384 (39) (7,355)Provisions 261 111 372Impairment losses (830) 120 (710)
The explanation for the reclassifications is as follows:
Reclassification resulting from IFRS 7 implementation:
1. Interest income and interest expense accrued on interest rate swaps, which are used to hedge interest rate risk from an economical point of view, but which do not fulfill the requirements of IFRS to apply the hedge accounting were reclassified from Interest income and expenses to Net gains from financial instruments at fair value through profit or loss
Reclassifications resulting from changes in the structure of the financial statements consistent with the parent company:
2. Expenses on employees training and education were reclassified from General administrative expenses to Staff expenses3. Netting of the operating lease expense with Other net income and netting insurance fee expense with fee income4. Amounts of charge and reversal of impairment on property and equipment were reclassified from General administrative
expenses and Other net income to Impairment losses5. Contribution to pension fund clients were reclassified from General administrative expenses to Other net income6. Provisions utilised to cover the respective expenses were reclassified from Staff and General administrative expenses
to Provisions
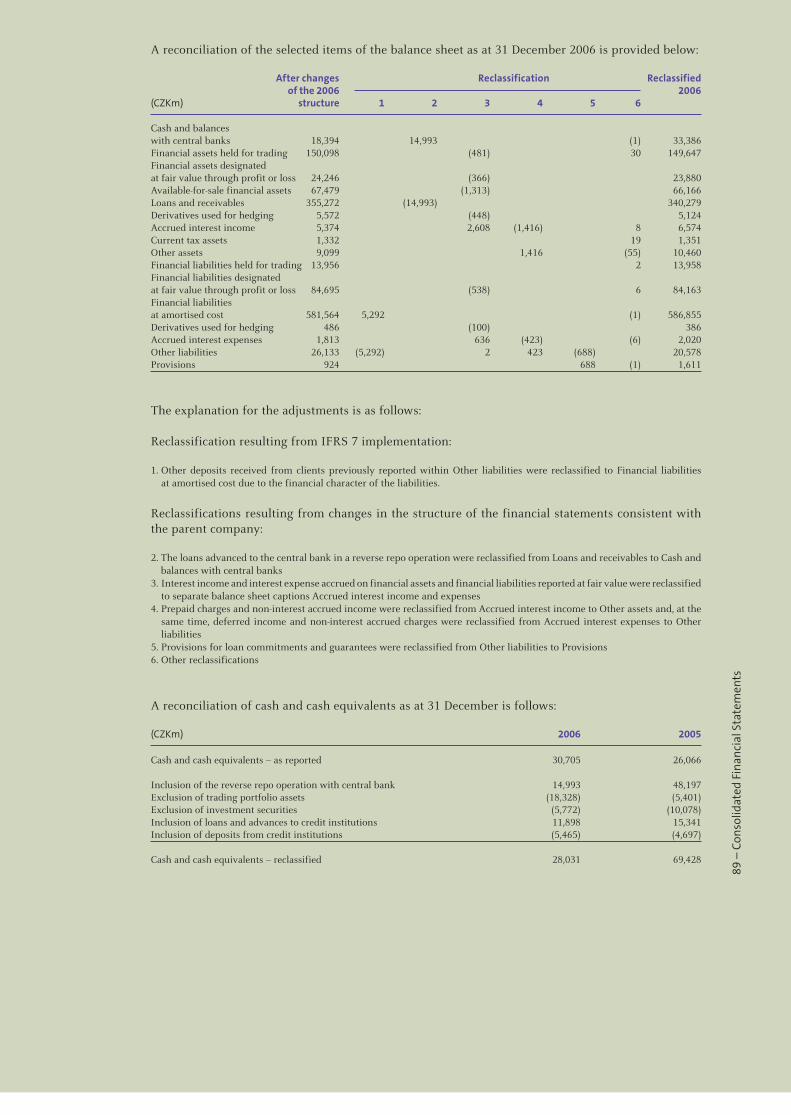
89
– Co
nsol
idat
ed F
inan
cial
Sta
tem
ents
A reconciliation of the selected items of the balance sheet as at 31 December 2006 is provided below:
After changes Reclassification Reclassified of the 2006 2006(CZKm) structure 1 2 3 4 5 6
Cash and balances with central banks 18,394 14,993 (1) 33,386Financial assets held for trading 150,098 (481) 30 149,647Financial assets designated at fair value through profit or loss 24,246 (366) 23,880Available-for-sale financial assets 67,479 (1,313) 66,166Loans and receivables 355,272 (14,993) 340,279Derivatives used for hedging 5,572 (448) 5,124Accrued interest income 5,374 2,608 (1,416) 8 6,574Current tax assets 1,332 19 1,351Other assets 9,099 1,416 (55) 10,460Financial liabilities held for trading 13,956 2 13,958Financial liabilities designated at fair value through profit or loss 84,695 (538) 6 84,163Financial liabilities at amortised cost 581,564 5,292 (1) 586,855Derivatives used for hedging 486 (100) 386Accrued interest expenses 1,813 636 (423) (6) 2,020Other liabilities 26,133 (5,292) 2 423 (688) 20,578Provisions 924 688 (1) 1,611
The explanation for the adjustments is as follows:
Reclassification resulting from IFRS 7 implementation:
1. Other deposits received from clients previously reported within Other liabilities were reclassified to Financial liabilities at amortised cost due to the financial character of the liabilities.
Reclassifications resulting from changes in the structure of the financial statements consistent with the parent company:
2. The loans advanced to the central bank in a reverse repo operation were reclassified from Loans and receivables to Cash and balances with central banks
3. Interest income and interest expense accrued on financial assets and financial liabilities reported at fair value were reclassified to separate balance sheet captions Accrued interest income and expenses
4. Prepaid charges and non-interest accrued income were reclassified from Accrued interest income to Other assets and, at the same time, deferred income and non-interest accrued charges were reclassified from Accrued interest expenses to Other liabilities
5. Provisions for loan commitments and guarantees were reclassified from Other liabilities to Provisions6. Other reclassifications
A reconciliation of cash and cash equivalents as at 31 December is follows:
(CZKm) 2006 2005
Cash and cash equivalents – as reported 30,705 26,066 Inclusion of the reverse repo operation with central bank 14,993 48,197Exclusion of trading portfolio assets (18,328) (5,401)Exclusion of investment securities (5,772) (10,078)Inclusion of loans and advances to credit institutions 11,898 15,341Inclusion of deposits from credit institutions (5,465) (4,697) Cash and cash equivalents – reclassified 28,031 69,428
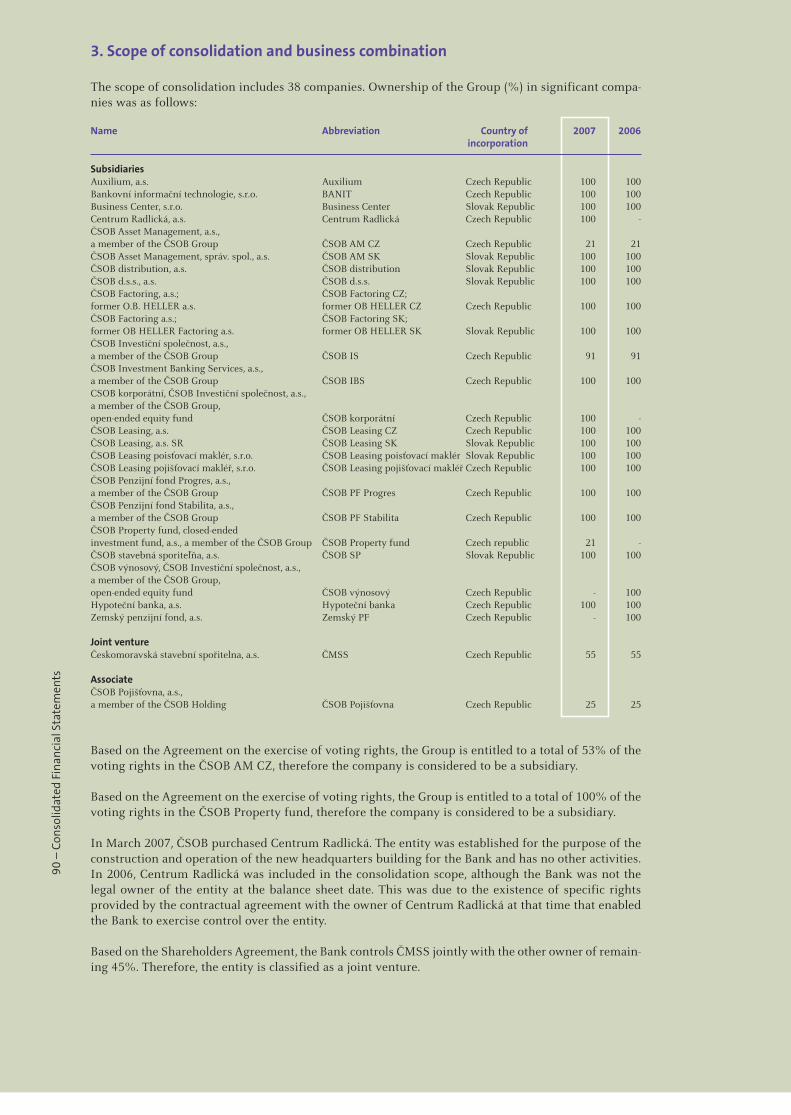
90
– Co
nsol
idat
ed F
inan
cial
Sta
tem
ents
3. Scope of consolidation and business combination
The scope of consolidation includes 38 companies. Ownership of the Group (%) in significant compa-nies was as follows:
Name Abbreviation Country of 2007 2006 incorporation
Subsidiaries Auxilium, a.s. Auxilium Czech Republic 100 100Bankovní informační technologie, s.r.o. BANIT Czech Republic 100 100Business Center, s.r.o. Business Center Slovak Republic 100 100Centrum Radlická, a.s. Centrum Radlická Czech Republic 100 -ČSOB Asset Management, a.s., a member of the ČSOB Group ČSOB AM CZ Czech Republic 21 21ČSOB Asset Management, správ. spol., a.s. ČSOB AM SK Slovak Republic 100 100ČSOB distribution, a.s. ČSOB distribution Slovak Republic 100 100ČSOB d.s.s., a.s. ČSOB d.s.s. Slovak Republic 100 100ČSOB Factoring, a.s.; ČSOB Factoring CZ; former O.B. HELLER a.s. former OB HELLER CZ Czech Republic 100 100ČSOB Factoring a.s.; ČSOB Factoring SK; former OB HELLER Factoring a.s. former OB HELLER SK Slovak Republic 100 100ČSOB Investiční společnost, a.s., a member of the ČSOB Group ČSOB IS Czech Republic 91 91ČSOB Investment Banking Services, a.s., a member of the ČSOB Group ČSOB IBS Czech Republic 100 100CSOB korporátní, ČSOB Investiční společnost, a.s., a member of the ČSOB Group, open-ended equity fund ČSOB korporátní Czech Republic 100 -ČSOB Leasing, a.s. ČSOB Leasing CZ Czech Republic 100 100ČSOB Leasing, a.s. SR ČSOB Leasing SK Slovak Republic 100 100ČSOB Leasing poisťovací maklér, s.r.o. ČSOB Leasing poisťovací maklér Slovak Republic 100 100ČSOB Leasing pojišťovací makléř, s.r.o. ČSOB Leasing pojišťovací makléř Czech Republic 100 100ČSOB Penzijní fond Progres, a.s., a member of the ČSOB Group ČSOB PF Progres Czech Republic 100 100ČSOB Penzijní fond Stabilita, a.s., a member of the ČSOB Group ČSOB PF Stabilita Czech Republic 100 100ČSOB Property fund, closed-ended investment fund, a.s., a member of the ČSOB Group ČSOB Property fund Czech republic 21 -ČSOB stavebná sporiteľňa, a.s. ČSOB SP Slovak Republic 100 100ČSOB výnosový, ČSOB Investiční společnost, a.s., a member of the ČSOB Group, open-ended equity fund ČSOB výnosový Czech Republic - 100Hypoteční banka, a.s. Hypoteční banka Czech Republic 100 100Zemský penzijní fond, a.s. Zemský PF Czech Republic - 100 Joint venture Českomoravská stavební spořitelna, a.s. ČMSS Czech Republic 55 55 Associate ČSOB Pojišťovna, a.s., a member of the ČSOB Holding ČSOB Pojišťovna Czech Republic 25 25
Based on the Agreement on the exercise of voting rights, the Group is entitled to a total of 53% of the voting rights in the ČSOB AM CZ, therefore the company is considered to be a subsidiary.
Based on the Agreement on the exercise of voting rights, the Group is entitled to a total of 100% of the voting rights in the ČSOB Property fund, therefore the company is considered to be a subsidiary.
In March 2007, ČSOB purchased Centrum Radlická. The entity was established for the purpose of the construction and operation of the new headquarters building for the Bank and has no other activities. In 2006, Centrum Radlická was included in the consolidation scope, although the Bank was not the legal owner of the entity at the balance sheet date. This was due to the existence of specific rights provided by the contractual agreement with the owner of Centrum Radlická at that time that enabled the Bank to exercise control over the entity.
Based on the Shareholders Agreement, the Bank controls ČMSS jointly with the other owner of remain-ing 45%. Therefore, the entity is classified as a joint venture.
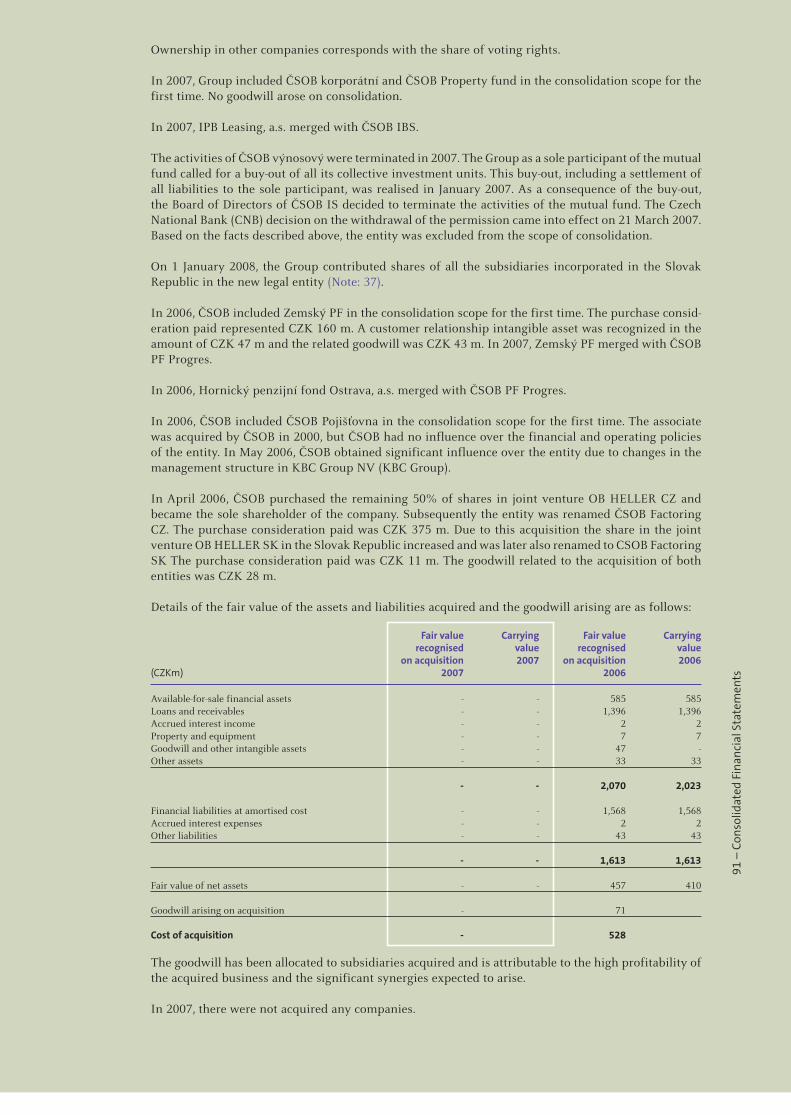
91
– Co
nsol
idat
ed F
inan
cial
Sta
tem
ents
Ownership in other companies corresponds with the share of voting rights.
In 2007, Group included ČSOB korporátní and ČSOB Property fund in the consolidation scope for the first time. No goodwill arose on consolidation.
In 2007, IPB Leasing, a.s. merged with ČSOB IBS.
The activities of ČSOB výnosový were terminated in 2007. The Group as a sole participant of the mutual fund called for a buy-out of all its collective investment units. This buy-out, including a settlement of all liabilities to the sole participant, was realised in January 2007. As a consequence of the buy-out, the Board of Directors of ČSOB IS decided to terminate the activities of the mutual fund. The Czech National Bank (CNB) decision on the withdrawal of the permission came into effect on 21 March 2007. Based on the facts described above, the entity was excluded from the scope of consolidation.
On 1 January 2008, the Group contributed shares of all the subsidiaries incorporated in the Slovak Republic in the new legal entity (Note: 37).
In 2006, ČSOB included Zemský PF in the consolidation scope for the first time. The purchase consid-eration paid represented CZK 160 m. A customer relationship intangible asset was recognized in the amount of CZK 47 m and the related goodwill was CZK 43 m. In 2007, Zemský PF merged with ČSOB PF Progres.
In 2006, Hornický penzijní fond Ostrava, a.s. merged with ČSOB PF Progres.
In 2006, ČSOB included ČSOB Pojišťovna in the consolidation scope for the first time. The associate was acquired by ČSOB in 2000, but ČSOB had no influence over the financial and operating policies of the entity. In May 2006, ČSOB obtained significant influence over the entity due to changes in the management structure in KBC Group NV (KBC Group).
In April 2006, ČSOB purchased the remaining 50% of shares in joint venture OB HELLER CZ and became the sole shareholder of the company. Subsequently the entity was renamed ČSOB Factoring CZ. The purchase consideration paid was CZK 375 m. Due to this acquisition the share in the joint venture OB HELLER SK in the Slovak Republic increased and was later also renamed to CSOB Factoring SK The purchase consideration paid was CZK 11 m. The goodwill related to the acquisition of both entities was CZK 28 m.
Details of the fair value of the assets and liabilities acquired and the goodwill arising are as follows:
Fair value Carrying Fair value Carrying recognised value recognised value on acquisition 2007 on acquisition 2006 (CZKm) 2007 2006
Available-for-sale financial assets - - 585 585Loans and receivables - - 1,396 1,396Accrued interest income - - 2 2Property and equipment - - 7 7Goodwill and other intangible assets - - 47 -Other assets - - 33 33 - - 2,070 2,023 Financial liabilities at amortised cost - - 1,568 1,568Accrued interest expenses - - 2 2Other liabilities - - 43 43
- - 1,613 1,613 Fair value of net assets - - 457 410 Goodwill arising on acquisition - 71
Cost of acquisition - 528
The goodwill has been allocated to subsidiaries acquired and is attributable to the high profitability of the acquired business and the significant synergies expected to arise.
In 2007, there were not acquired any companies.
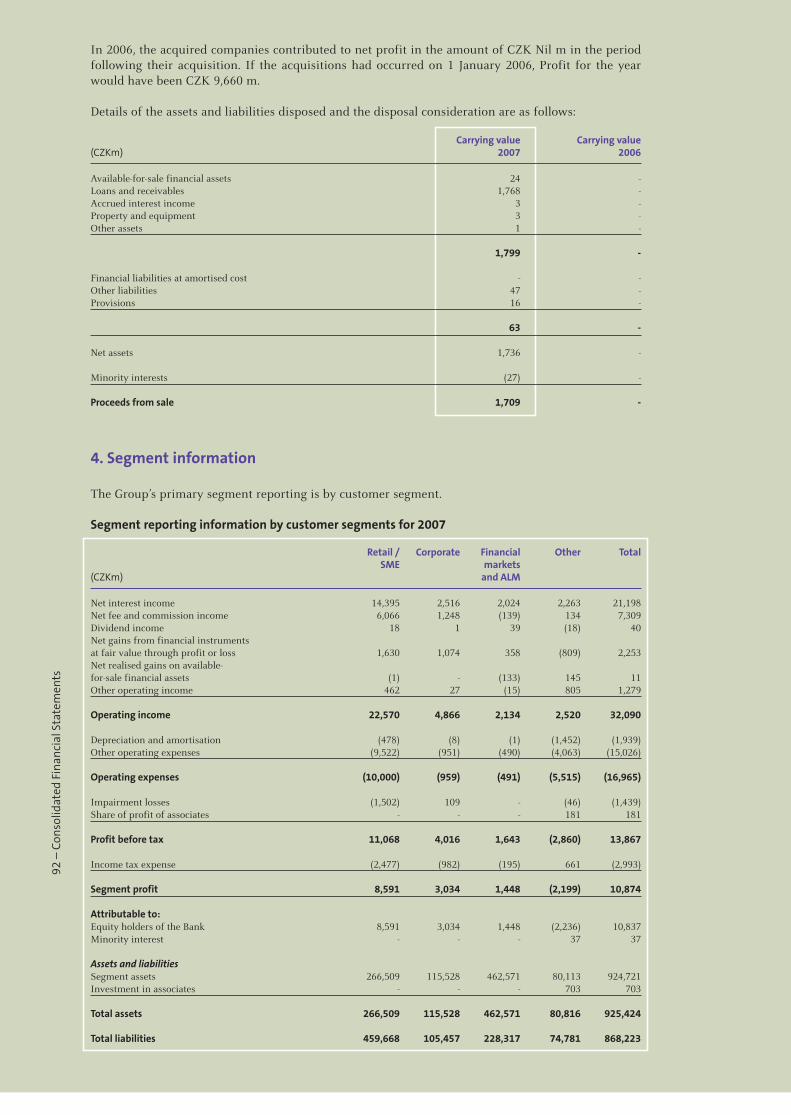
92
– Co
nsol
idat
ed F
inan
cial
Sta
tem
ents
In 2006, the acquired companies contributed to net profit in the amount of CZK Nil m in the period following their acquisition. If the acquisitions had occurred on 1 January 2006, Profit for the year would have been CZK 9,660 m.
Details of the assets and liabilities disposed and the disposal consideration are as follows:
Carrying value Carrying value(CZKm) 2007 2006
Available-for-sale financial assets 24 -Loans and receivables 1,768 -Accrued interest income 3 -Property and equipment 3 -Other assets 1 -
1,799 - Financial liabilities at amortised cost - -Other liabilities 47 -Provisions 16 -
63 - Net assets 1,736 - Minority interests (27) - Proceeds from sale 1,709 -
4. Segment information
The Group’s primary segment reporting is by customer segment.
Segment reporting information by customer segments for 2007
Retail / Corporate Financial Other Total SME markets (CZKm) and ALM
Net interest income 14,395 2,516 2,024 2,263 21,198Net fee and commission income 6,066 1,248 (139) 134 7,309Dividend income 18 1 39 (18) 40Net gains from financial instruments at fair value through profit or loss 1,630 1,074 358 (809) 2,253Net realised gains on available-for-sale financial assets (1) - (133) 145 11Other operating income 462 27 (15) 805 1,279
Operating income 22,570 4,866 2,134 2,520 32,090
Depreciation and amortisation (478) (8) (1) (1,452) (1,939)Other operating expenses (9,522) (951) (490) (4,063) (15,026)
Operating expenses (10,000) (959) (491) (5,515) (16,965)
Impairment losses (1,502) 109 - (46) (1,439)Share of profit of associates - - - 181 181
Profit before tax 11,068 4,016 1,643 (2,860) 13,867
Income tax expense (2,477) (982) (195) 661 (2,993)
Segment profit 8,591 3,034 1,448 (2,199) 10,874
Attributable to: Equity holders of the Bank 8,591 3,034 1,448 (2,236) 10,837Minority interest - - - 37 37 Assets and liabilities Segment assets 266,509 115,528 462,571 80,113 924,721Investment in associates - - - 703 703
Total assets 266,509 115,528 462,571 80,816 925,424 Total liabilities 459,668 105,457 228,317 74,781 868,223
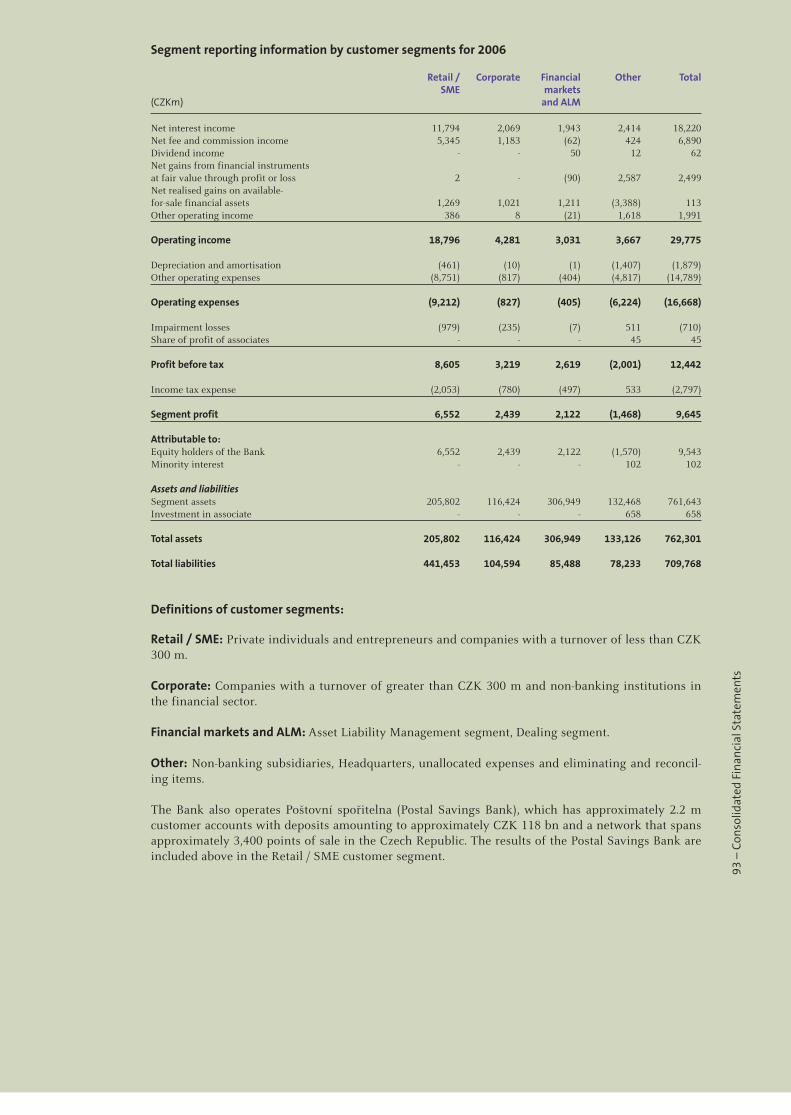
93
– Co
nsol
idat
ed F
inan
cial
Sta
tem
ents
Segment reporting information by customer segments for 2006
Retail / Corporate Financial Other Total SME markets (CZKm) and ALM
Net interest income 11,794 2,069 1,943 2,414 18,220 Net fee and commission income 5,345 1,183 (62) 424 6,890 Dividend income - - 50 12 62Net gains from financial instruments at fair value through profit or loss 2 - (90) 2,587 2,499 Net realised gains on available-for-sale financial assets 1,269 1,021 1,211 (3,388) 113Other operating income 386 8 (21) 1,618 1,991
Operating income 18,796 4,281 3,031 3,667 29,775
Depreciation and amortisation (461) (10) (1) (1,407) (1,879)Other operating expenses (8,751) (817) (404) (4,817) (14,789)
Operating expenses (9,212) (827) (405) (6,224) (16,668)
Impairment losses (979) (235) (7) 511 (710)Share of profit of associates - - - 45 45
Profit before tax 8,605 3,219 2,619 (2,001) 12,442
Income tax expense (2,053) (780) (497) 533 (2,797)
Segment profit 6,552 2,439 2,122 (1,468) 9,645
Attributable to: Equity holders of the Bank 6,552 2,439 2,122 (1,570) 9,543 Minority interest - - - 102 102 Assets and liabilities Segment assets 205,802 116,424 306,949 132,468 761,643 Investment in associate - - - 658 658
Total assets 205,802 116,424 306,949 133,126 762,301 Total liabilities 441,453 104,594 85,488 78,233 709,768
Definitions of customer segments:
Retail / SME: Private individuals and entrepreneurs and companies with a turnover of less than CZK 300 m.
Corporate: Companies with a turnover of greater than CZK 300 m and non-banking institutions in the financial sector.
Financial markets and ALM: Asset Liability Management segment, Dealing segment.
Other: Non-banking subsidiaries, Headquarters, unallocated expenses and eliminating and reconcil-ing items.
The Bank also operates Poštovní spořitelna (Postal Savings Bank), which has approximately 2.2 m customer accounts with deposits amounting to approximately CZK 118 bn and a network that spans approximately 3,400 points of sale in the Czech Republic. The results of the Postal Savings Bank are included above in the Retail / SME customer segment.
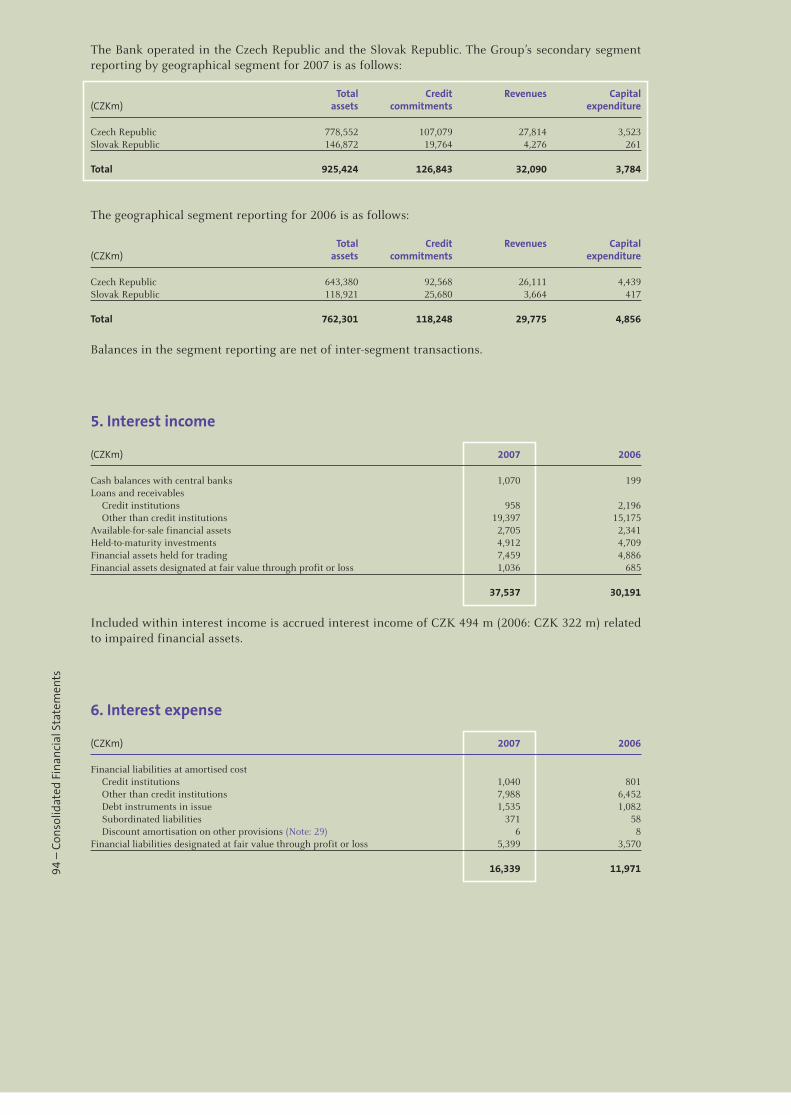
94
– Co
nsol
idat
ed F
inan
cial
Sta
tem
ents
The Bank operated in the Czech Republic and the Slovak Republic. The Group’s secondary segment reporting by geographical segment for 2007 is as follows:
Total Credit Revenues Capital(CZKm) assets commitments expenditure
Czech Republic 778,552 107,079 27,814 3,523Slovak Republic 146,872 19,764 4,276 261 Total 925,424 126,843 32,090 3,784
The geographical segment reporting for 2006 is as follows:
Total Credit Revenues Capital(CZKm) assets commitments expenditure
Czech Republic 643,380 92,568 26,111 4,439Slovak Republic 118,921 25,680 3,664 417 Total 762,301 118,248 29,775 4,856
Balances in the segment reporting are net of inter-segment transactions.
5. Interest income
(CZKm) 2007 2006
Cash balances with central banks 1,070 199Loans and receivables Credit institutions 958 2,196 Other than credit institutions 19,397 15,175Available-for-sale financial assets 2,705 2,341Held-to-maturity investments 4,912 4,709Financial assets held for trading 7,459 4,886Financial assets designated at fair value through profit or loss 1,036 685 37,537 30,191
Included within interest income is accrued interest income of CZK 494 m (2006: CZK 322 m) related to impaired financial assets.
6. Interest expense
(CZKm) 2007 2006
Financial liabilities at amortised cost Credit institutions 1,040 801 Other than credit institutions 7,988 6,452 Debt instruments in issue 1,535 1,082 Subordinated liabilities 371 58 Discount amortisation on other provisions (Note: 29) 6 8Financial liabilities designated at fair value through profit or loss 5,399 3,570 16,339 11,971
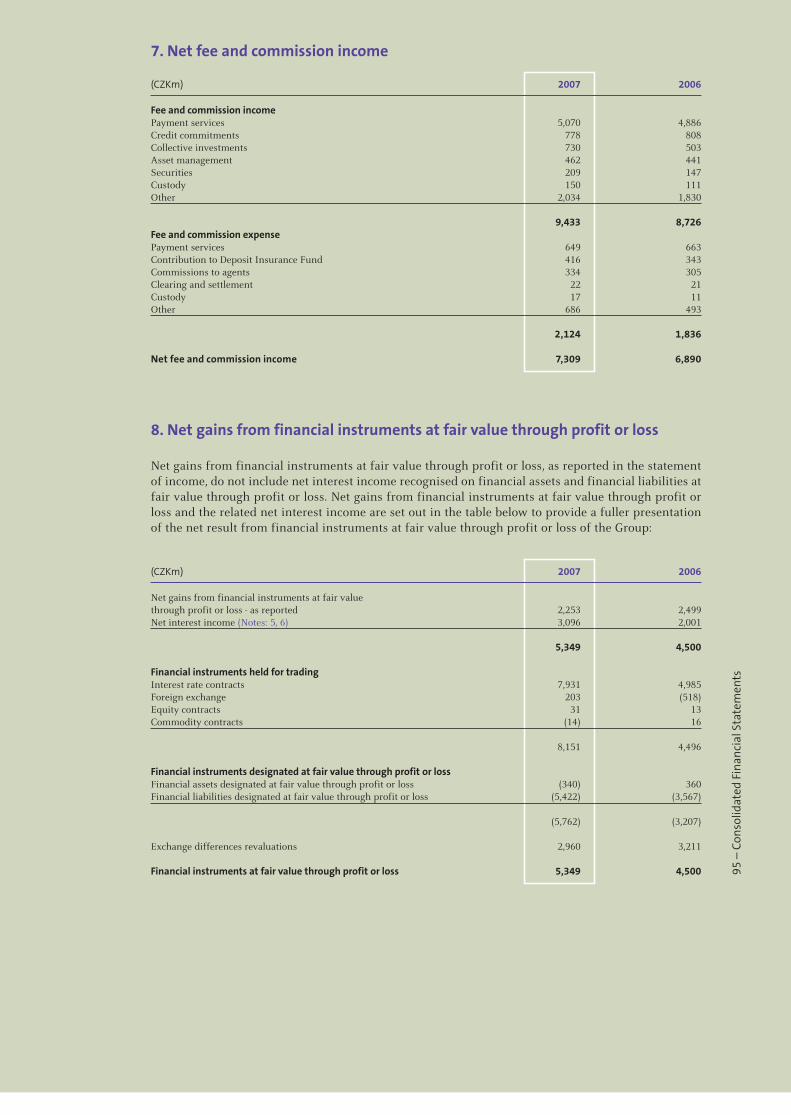
95
– Co
nsol
idat
ed F
inan
cial
Sta
tem
ents
7. Net fee and commission income
(CZKm) 2007 2006
Fee and commission income Payment services 5,070 4,886Credit commitments 778 808Collective investments 730 503Asset management 462 441Securities 209 147Custody 150 111Other 2,034 1,830 9,433 8,726Fee and commission expense Payment services 649 663Contribution to Deposit Insurance Fund 416 343Commissions to agents 334 305Clearing and settlement 22 21Custody 17 11Other 686 493 2,124 1,836 Net fee and commission income 7,309 6,890
8. Net gains from financial instruments at fair value through profit or loss
Net gains from financial instruments at fair value through profit or loss, as reported in the statement of income, do not include net interest income recognised on financial assets and financial liabilities at fair value through profit or loss. Net gains from financial instruments at fair value through profit or loss and the related net interest income are set out in the table below to provide a fuller presentation of the net result from financial instruments at fair value through profit or loss of the Group:
(CZKm) 2007 2006
Net gains from financial instruments at fair valuethrough profit or loss - as reported 2,253 2,499Net interest income (Notes: 5, 6) 3,096 2,001 5,349 4,500 Financial instruments held for trading Interest rate contracts 7,931 4,985Foreign exchange 203 (518)Equity contracts 31 13Commodity contracts (14) 16 8,151 4,496
Financial instruments designated at fair value through profit or loss Financial assets designated at fair value through profit or loss (340) 360Financial liabilities designated at fair value through profit or loss (5,422) (3,567) (5,762) (3,207) Exchange differences revaluations 2,960 3,211 Financial instruments at fair value through profit or loss 5,349 4,500
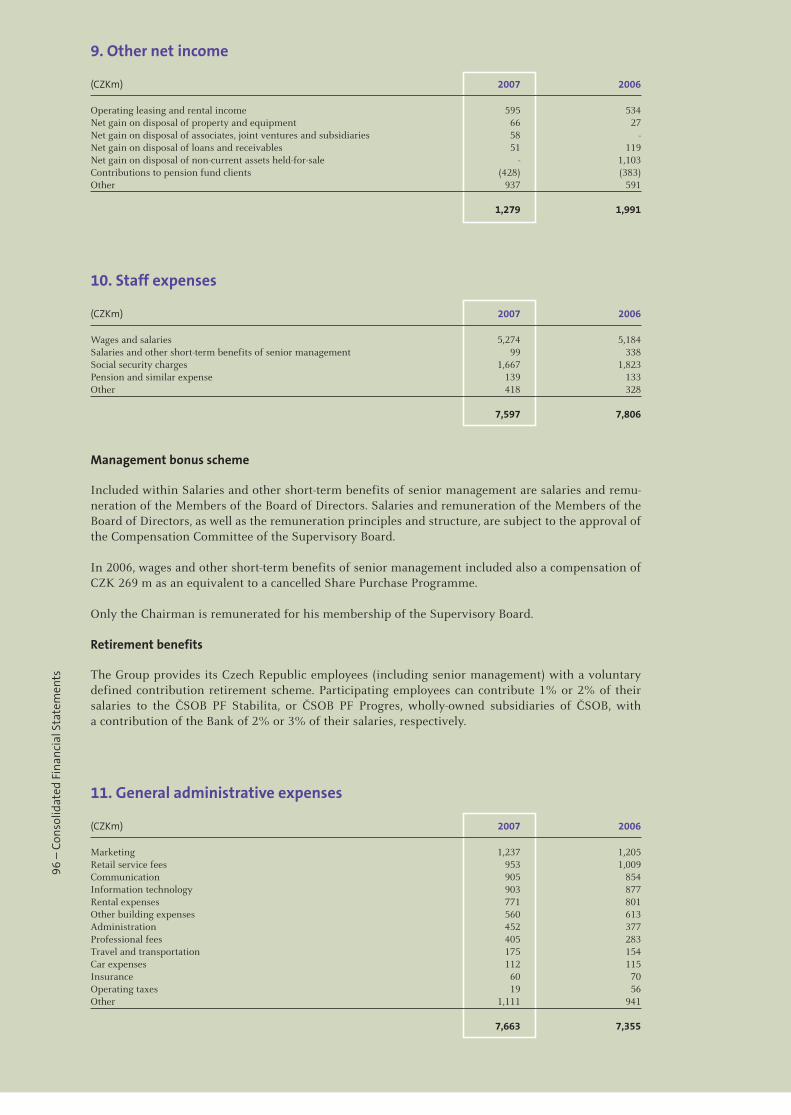
96
– Co
nsol
idat
ed F
inan
cial
Sta
tem
ents
9. Other net income
(CZKm) 2007 2006
Operating leasing and rental income 595 534Net gain on disposal of property and equipment 66 27Net gain on disposal of associates, joint ventures and subsidiaries 58 -Net gain on disposal of loans and receivables 51 119Net gain on disposal of non-current assets held-for-sale - 1,103Contributions to pension fund clients (428) (383)Other 937 591 1,279 1,991
10. Staff expenses
(CZKm) 2007 2006
Wages and salaries 5,274 5,184Salaries and other short-term benefits of senior management 99 338Social security charges 1,667 1,823Pension and similar expense 139 133Other 418 328 7,597 7,806
Management bonus scheme
Included within Salaries and other short-term benefits of senior management are salaries and remu-neration of the Members of the Board of Directors. Salaries and remuneration of the Members of the Board of Directors, as well as the remuneration principles and structure, are subject to the approval of the Compensation Committee of the Supervisory Board.
In 2006, wages and other short-term benefits of senior management included also a compensation of CZK 269 m as an equivalent to a cancelled Share Purchase Programme.
Only the Chairman is remunerated for his membership of the Supervisory Board.
Retirement benefits
The Group provides its Czech Republic employees (including senior management) with a voluntary defined contribution retirement scheme. Participating employees can contribute 1% or 2% of their salaries to the ČSOB PF Stabilita, or ČSOB PF Progres, wholly-owned subsidiaries of ČSOB, with a contribution of the Bank of 2% or 3% of their salaries, respectively.
11. General administrative expenses
(CZKm) 2007 2006
Marketing 1,237 1,205Retail service fees 953 1,009Communication 905 854Information technology 903 877Rental expenses 771 801Other building expenses 560 613Administration 452 377Professional fees 405 283Travel and transportation 175 154Car expenses 112 115Insurance 60 70Operating taxes 19 56Other 1,111 941 7,663 7,355
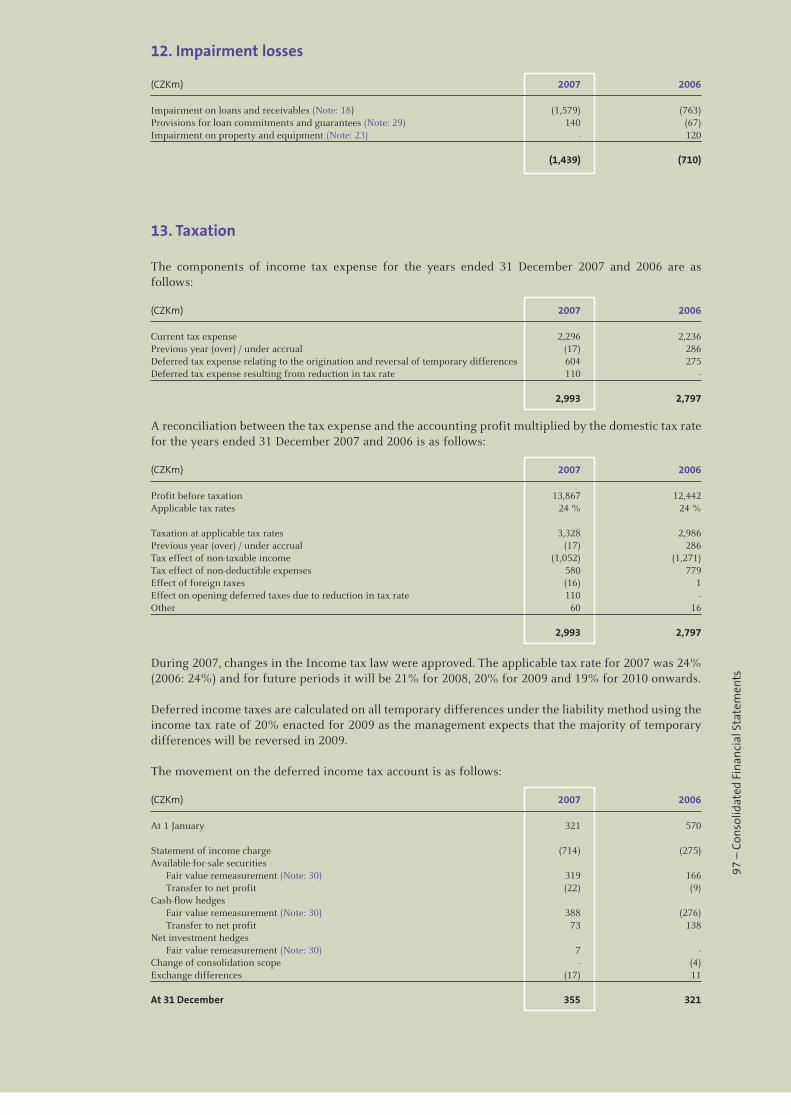
97
– Co
nsol
idat
ed F
inan
cial
Sta
tem
ents
12. Impairment losses
(CZKm) 2007 2006
Impairment on loans and receivables (Note: 18) (1,579) (763)Provisions for loan commitments and guarantees (Note: 29) 140 (67)Impairment on property and equipment (Note: 23) - 120 (1,439) (710)
13. Taxation
The components of income tax expense for the years ended 31 December 2007 and 2006 are as follows:
(CZKm) 2007 2006
Current tax expense 2,296 2,236Previous year (over) / under accrual (17) 286Deferred tax expense relating to the origination and reversal of temporary differences 604 275Deferred tax expense resulting from reduction in tax rate 110 - 2,993 2,797
A reconciliation between the tax expense and the accounting profit multiplied by the domestic tax rate for the years ended 31 December 2007 and 2006 is as follows:
(CZKm) 2007 2006
Profit before taxation 13,867 12,442Applicable tax rates 24 % 24 % Taxation at applicable tax rates 3,328 2,986Previous year (over) / under accrual (17) 286Tax effect of non-taxable income (1,052) (1,271)Tax effect of non-deductible expenses 580 779Effect of foreign taxes (16) 1Effect on opening deferred taxes due to reduction in tax rate 110 -Other 60 16 2,993 2,797
During 2007, changes in the Income tax law were approved. The applicable tax rate for 2007 was 24% (2006: 24%) and for future periods it will be 21% for 2008, 20% for 2009 and 19% for 2010 onwards.
Deferred income taxes are calculated on all temporary differences under the liability method using the income tax rate of 20% enacted for 2009 as the management expects that the majority of temporary differences will be reversed in 2009.
The movement on the deferred income tax account is as follows:
(CZKm) 2007 2006
At 1 January 321 570 Statement of income charge (714) (275)Available-for-sale securities Fair value remeasurement (Note: 30) 319 166 Transfer to net profit (22) (9)Cash-flow hedges Fair value remeasurement (Note: 30) 388 (276) Transfer to net profit 73 138Net investment hedges Fair value remeasurement (Note: 30) 7 -Change of consolidation scope - (4)Exchange differences (17) 11
At 31 December 355 321
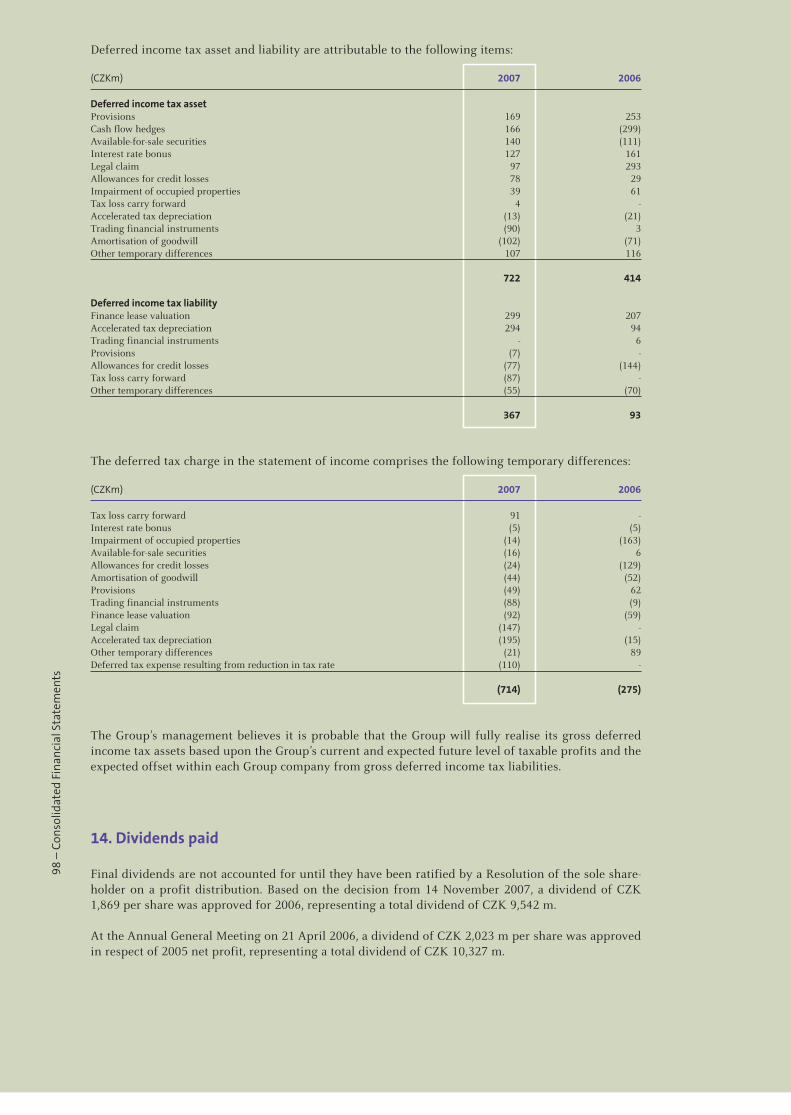
98
– Co
nsol
idat
ed F
inan
cial
Sta
tem
ents
Deferred income tax asset and liability are attributable to the following items:
(CZKm) 2007 2006
Deferred income tax asset Provisions 169 253Cash flow hedges 166 (299)Available-for-sale securities 140 (111)Interest rate bonus 127 161Legal claim 97 293Allowances for credit losses 78 29Impairment of occupied properties 39 61Tax loss carry forward 4 -Accelerated tax depreciation (13) (21)Trading financial instruments (90) 3Amortisation of goodwill (102) (71)Other temporary differences 107 116 722 414 Deferred income tax liability Finance lease valuation 299 207Accelerated tax depreciation 294 94Trading financial instruments - 6Provisions (7) -Allowances for credit losses (77) (144)Tax loss carry forward (87) -Other temporary differences (55) (70) 367 93
The deferred tax charge in the statement of income comprises the following temporary differences:
(CZKm) 2007 2006
Tax loss carry forward 91 -Interest rate bonus (5) (5)Impairment of occupied properties (14) (163)Available-for-sale securities (16) 6Allowances for credit losses (24) (129)Amortisation of goodwill (44) (52)Provisions (49) 62Trading financial instruments (88) (9)Finance lease valuation (92) (59)Legal claim (147) -Accelerated tax depreciation (195) (15)Other temporary differences (21) 89Deferred tax expense resulting from reduction in tax rate (110) - (714) (275)
The Group’s management believes it is probable that the Group will fully realise its gross deferred income tax assets based upon the Group’s current and expected future level of taxable profits and the expected offset within each Group company from gross deferred income tax liabilities.
14. Dividends paid
Final dividends are not accounted for until they have been ratified by a Resolution of the sole share-holder on a profit distribution. Based on the decision from 14 November 2007, a dividend of CZK 1,869 per share was approved for 2006, representing a total dividend of CZK 9,542 m.
At the Annual General Meeting on 21 April 2006, a dividend of CZK 2,023 m per share was approved in respect of 2005 net profit, representing a total dividend of CZK 10,327 m.
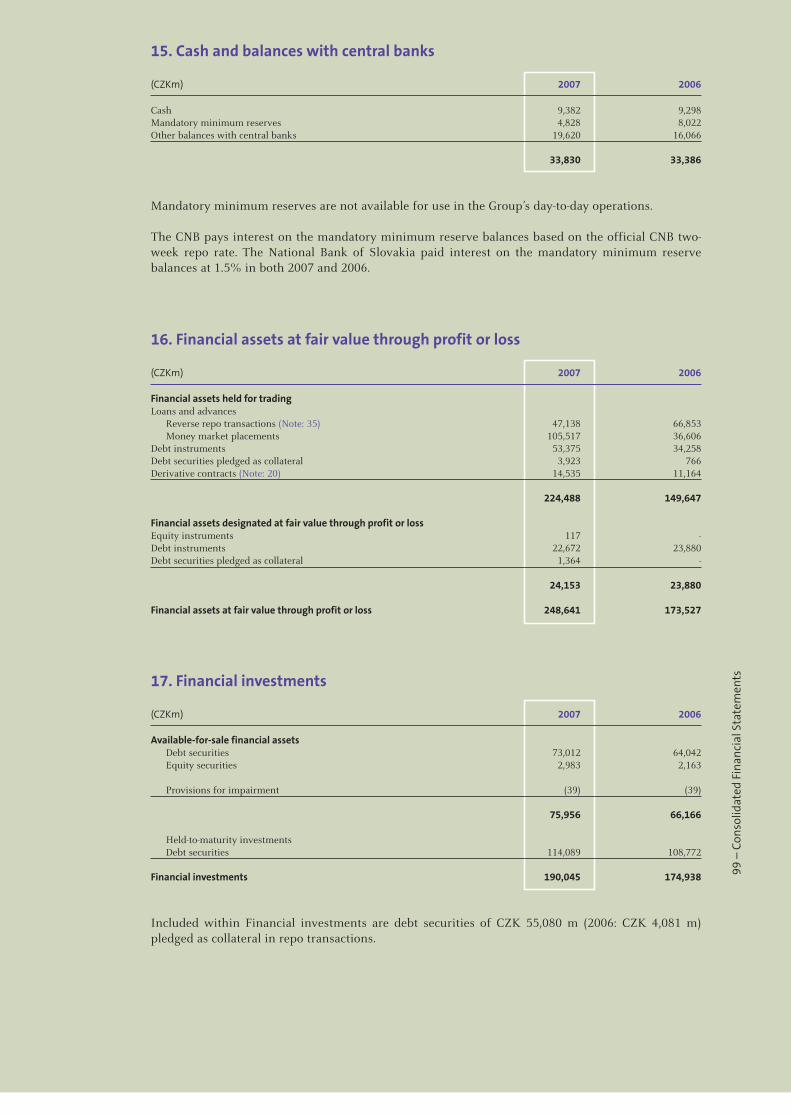
99
– Co
nsol
idat
ed F
inan
cial
Sta
tem
ents
15. Cash and balances with central banks
(CZKm) 2007 2006
Cash 9,382 9,298Mandatory minimum reserves 4,828 8,022Other balances with central banks 19,620 16,066 33,830 33,386
Mandatory minimum reserves are not available for use in the Group’s day-to-day operations.
The CNB pays interest on the mandatory minimum reserve balances based on the official CNB two-week repo rate. The National Bank of Slovakia paid interest on the mandatory minimum reserve balances at 1.5% in both 2007 and 2006.
16. Financial assets at fair value through profit or loss
(CZKm) 2007 2006
Financial assets held for trading Loans and advances Reverse repo transactions (Note: 35) 47,138 66,853 Money market placements 105,517 36,606Debt instruments 53,375 34,258Debt securities pledged as collateral 3,923 766Derivative contracts (Note: 20) 14,535 11,164 224,488 149,647
Financial assets designated at fair value through profit or loss Equity instruments 117 -Debt instruments 22,672 23,880Debt securities pledged as collateral 1,364 - 24,153 23,880 Financial assets at fair value through profit or loss 248,641 173,527
17. Financial investments
(CZKm) 2007 2006
Available-for-sale financial assets Debt securities 73,012 64,042 Equity securities 2,983 2,163 Provisions for impairment (39) (39) 75,956 66,166 Held-to-maturity investments Debt securities 114,089 108,772 Financial investments 190,045 174,938
Included within Financial investments are debt securities of CZK 55,080 m (2006: CZK 4,081 m) pledged as collateral in repo transactions.

100
– C
onso
lidat
ed F
inan
cial
Sta
tem
ents
18. Loans and receivables
(CZKm) 2007 2006
Analysed by category of borrower Central government 11,298 11,486Non credit institutions 4,754 5,178Credit institutions 19,382 31,002Corporate 204,790 169,750Retail 178,204 129,868 Gross loans 418,428 347,284 Allowance for impairment losses (7,299) (7,005) 411,129 340,279
Of which finance lease receivables may be analysed as follows:
(CZKm) 2007 2006
Gross investment in finance leases, receivable 45,968 36,269At not more than one year 20,643 18,512At more than one but not more than five years 24,751 17,317At more than five years 574 440 Unearned future finance income on finance leases (4,403) (1,515) Net investment in finance leases 41,565 34,754At not more than one year 18,355 17,691At more than one but not more than five years 22,701 16,665At more than five years 509 398 Accumulated allowance for uncollectible minimum lease payments receivable 424 842
Finance lease receivables are fully collateralised by the leased items. Leasing companies maintain legal ownership of the respective collateral.
The following is a reconciliation of the individual and collective allowances for impairment losses on loans and receivables for 2006 and 2007:
Individual Collective Total(CZKm) impairment impairment
At 1 January 2006 5,420 945 6,365
Additions through business combinations (5) 1 (4)Net increase in allowances for credit losses 701 62 763Write-offs (845) - (845)Recoveries 700 - 700Foreign currency translation 20 6 26 At 31 December 2006 5,991 1,014 7,005 Net increase / (decrease) in allowances for credit losses 1,919 (340) 1,579Write-offs (1,193) - (1,193)Transfers (5) 5 -Foreign currency translation (87) (5) (92)
At 31 December 2007 6,625 674 7,299
The gross amount of loans and receivables individually determined to be impaired, before deduct-ing any individually assessed impairment allowance at 31 December 2007 amounts to CZK 9,925 m (31 December 2006: CZK 9,245 m).
The fair value of collateral held by the Group relating to loans individually determined to be impaired at 31 December 2007 amounts to CZK 3,730 m (31 December 2006: CZK 3,455 m). The collateral consists of cash, securities, guarantees received, properties and equipments.
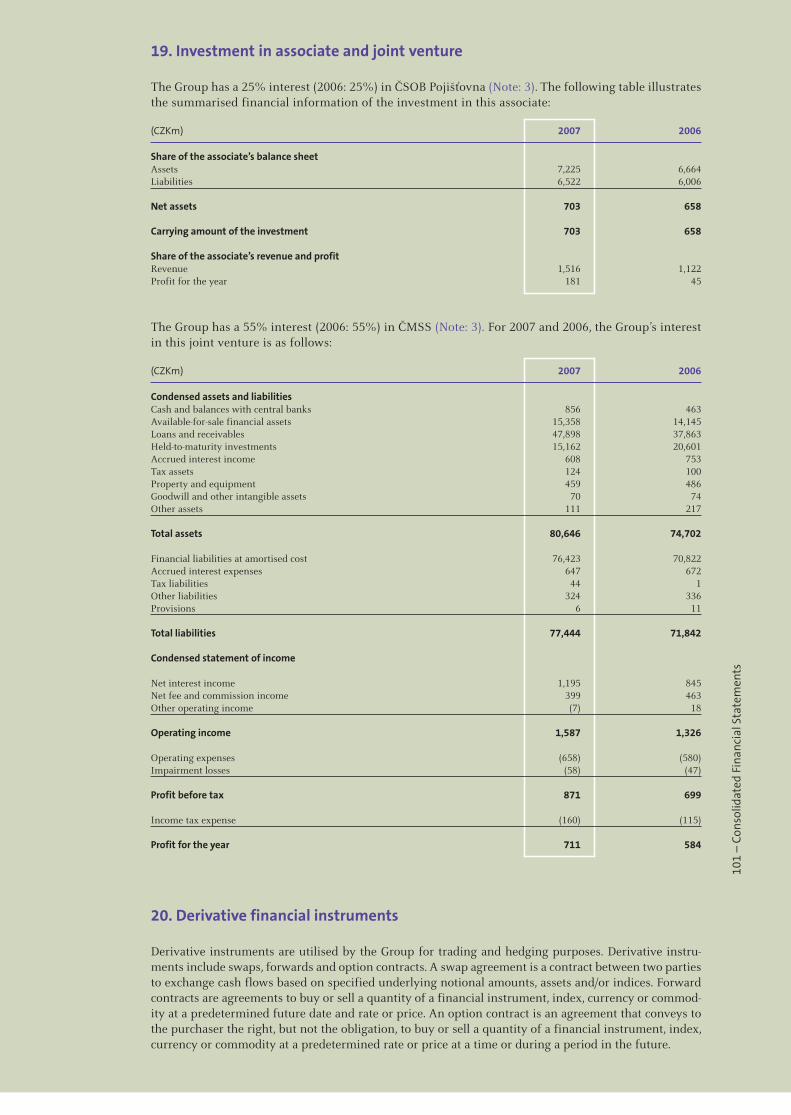
101
– C
onso
lidat
ed F
inan
cial
Sta
tem
ents
19. Investment in associate and joint venture
The Group has a 25% interest (2006: 25%) in ČSOB Pojišťovna (Note: 3). The following table illustrates the summarised financial information of the investment in this associate:
(CZKm) 2007 2006
Share of the associate’s balance sheet Assets 7,225 6,664Liabilities 6,522 6,006 Net assets 703 658 Carrying amount of the investment 703 658 Share of the associate’s revenue and profit Revenue 1,516 1,122Profit for the year 181 45
The Group has a 55% interest (2006: 55%) in ČMSS (Note: 3). For 2007 and 2006, the Group’s interest in this joint venture is as follows:
(CZKm) 2007 2006
Condensed assets and liabilities Cash and balances with central banks 856 463Available-for-sale financial assets 15,358 14,145Loans and receivables 47,898 37,863Held-to-maturity investments 15,162 20,601Accrued interest income 608 753Tax assets 124 100Property and equipment 459 486Goodwill and other intangible assets 70 74Other assets 111 217
Total assets 80,646 74,702 Financial liabilities at amortised cost 76,423 70,822Accrued interest expenses 647 672Tax liabilities 44 1Other liabilities 324 336Provisions 6 11
Total liabilities 77,444 71,842 Condensed statement of income Net interest income 1,195 845Net fee and commission income 399 463Other operating income (7) 18
Operating income 1,587 1,326
Operating expenses (658) (580)Impairment losses (58) (47)
Profit before tax 871 699
Income tax expense (160) (115)
Profit for the year 711 584
20. Derivative financial instruments
Derivative instruments are utilised by the Group for trading and hedging purposes. Derivative instru-ments include swaps, forwards and option contracts. A swap agreement is a contract between two parties to exchange cash flows based on specified underlying notional amounts, assets and/or indices. Forward contracts are agreements to buy or sell a quantity of a financial instrument, index, currency or commod-ity at a predetermined future date and rate or price. An option contract is an agreement that conveys to the purchaser the right, but not the obligation, to buy or sell a quantity of a financial instrument, index, currency or commodity at a predetermined rate or price at a time or during a period in the future.
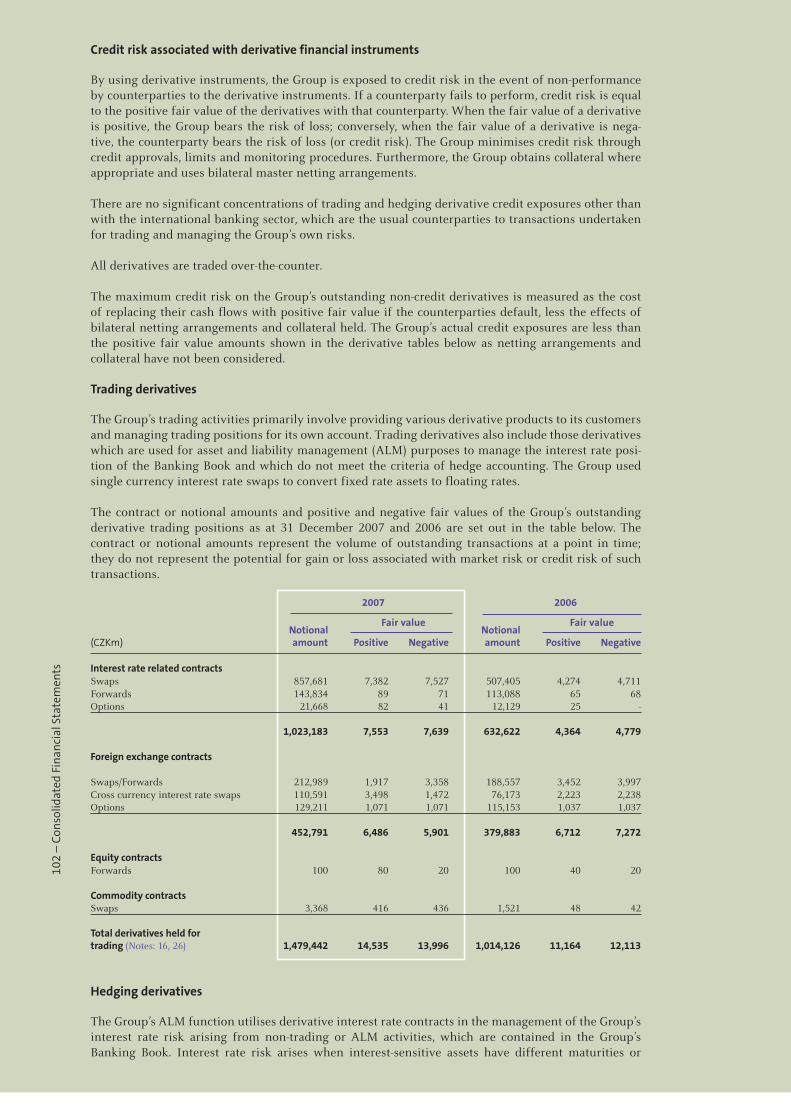
102
– C
onso
lidat
ed F
inan
cial
Sta
tem
ents
Credit risk associated with derivative financial instruments
By using derivative instruments, the Group is exposed to credit risk in the event of non-performance by counterparties to the derivative instruments. If a counterparty fails to perform, credit risk is equal to the positive fair value of the derivatives with that counterparty. When the fair value of a derivative is positive, the Group bears the risk of loss; conversely, when the fair value of a derivative is nega-tive, the counterparty bears the risk of loss (or credit risk). The Group minimises credit risk through credit approvals, limits and monitoring procedures. Furthermore, the Group obtains collateral where appropriate and uses bilateral master netting arrangements.
There are no significant concentrations of trading and hedging derivative credit exposures other than with the international banking sector, which are the usual counterparties to transactions undertaken for trading and managing the Group’s own risks.
All derivatives are traded over-the-counter.
The maximum credit risk on the Group’s outstanding non-credit derivatives is measured as the cost of replacing their cash flows with positive fair value if the counterparties default, less the effects of bilateral netting arrangements and collateral held. The Group’s actual credit exposures are less than the positive fair value amounts shown in the derivative tables below as netting arrangements and collateral have not been considered.
Trading derivatives
The Group’s trading activities primarily involve providing various derivative products to its customers and managing trading positions for its own account. Trading derivatives also include those derivatives which are used for asset and liability management (ALM) purposes to manage the interest rate posi-tion of the Banking Book and which do not meet the criteria of hedge accounting. The Group used single currency interest rate swaps to convert fixed rate assets to floating rates.
The contract or notional amounts and positive and negative fair values of the Group’s outstanding derivative trading positions as at 31 December 2007 and 2006 are set out in the table below. The contract or notional amounts represent the volume of outstanding transactions at a point in time; they do not represent the potential for gain or loss associated with market risk or credit risk of such transactions.
2007 2006
Notional
Fair value Notional
Fair value
(CZKm) amount Positive Negative amount Positive Negative
Interest rate related contracts Swaps 857,681 7,382 7,527 507,405 4,274 4,711Forwards 143,834 89 71 113,088 65 68Options 21,668 82 41 12,129 25 - 1,023,183 7,553 7,639 632,622 4,364 4,779 Foreign exchange contracts Swaps/Forwards 212,989 1,917 3,358 188,557 3,452 3,997Cross currency interest rate swaps 110,591 3,498 1,472 76,173 2,223 2,238Options 129,211 1,071 1,071 115,153 1,037 1,037 452,791 6,486 5,901 379,883 6,712 7,272 Equity contracts Forwards 100 80 20 100 40 20 Commodity contracts Swaps 3,368 416 436 1,521 48 42 Total derivatives held for trading (Notes: 16, 26) 1,479,442 14,535 13,996 1,014,126 11,164 12,113
Hedging derivatives
The Group’s ALM function utilises derivative interest rate contracts in the management of the Group’s interest rate risk arising from non-trading or ALM activities, which are contained in the Group’s Banking Book. Interest rate risk arises when interest-sensitive assets have different maturities or
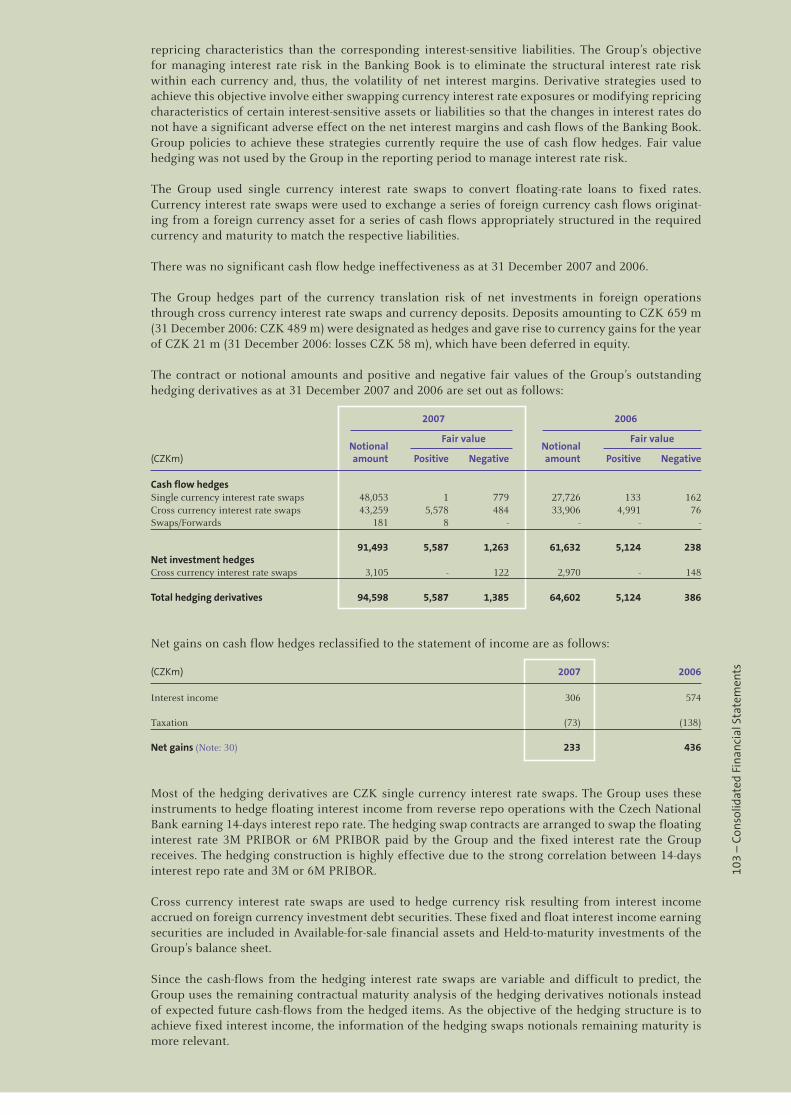
103
– C
onso
lidat
ed F
inan
cial
Sta
tem
ents
repricing characteristics than the corresponding interest-sensitive liabilities. The Group’s objective for managing interest rate risk in the Banking Book is to eliminate the structural interest rate risk within each currency and, thus, the volatility of net interest margins. Derivative strategies used to achieve this objective involve either swapping currency interest rate exposures or modifying repricing characteristics of certain interest-sensitive assets or liabilities so that the changes in interest rates do not have a significant adverse effect on the net interest margins and cash flows of the Banking Book. Group policies to achieve these strategies currently require the use of cash flow hedges. Fair value hedging was not used by the Group in the reporting period to manage interest rate risk.
The Group used single currency interest rate swaps to convert floating-rate loans to fixed rates. Currency interest rate swaps were used to exchange a series of foreign currency cash flows originat-ing from a foreign currency asset for a series of cash flows appropriately structured in the required currency and maturity to match the respective liabilities.
There was no significant cash flow hedge ineffectiveness as at 31 December 2007 and 2006.
The Group hedges part of the currency translation risk of net investments in foreign operations through cross currency interest rate swaps and currency deposits. Deposits amounting to CZK 659 m (31 December 2006: CZK 489 m) were designated as hedges and gave rise to currency gains for the year of CZK 21 m (31 December 2006: losses CZK 58 m), which have been deferred in equity.
The contract or notional amounts and positive and negative fair values of the Group’s outstanding hedging derivatives as at 31 December 2007 and 2006 are set out as follows:
2007 2006
Notional
Fair value Notional
Fair value
(CZKm) amount Positive Negative amount Positive Negative
Cash flow hedges Single currency interest rate swaps 48,053 1 779 27,726 133 162Cross currency interest rate swaps 43,259 5,578 484 33,906 4,991 76Swaps/Forwards 181 8 - - - -
91,493 5,587 1,263 61,632 5,124 238Net investment hedges Cross currency interest rate swaps 3,105 - 122 2,970 - 148 Total hedging derivatives 94,598 5,587 1,385 64,602 5,124 386
Net gains on cash flow hedges reclassified to the statement of income are as follows:
(CZKm) 2007 2006
Interest income 306 574 Taxation (73) (138) Net gains (Note: 30) 233 436
Most of the hedging derivatives are CZK single currency interest rate swaps. The Group uses these instruments to hedge floating interest income from reverse repo operations with the Czech National Bank earning 14-days interest repo rate. The hedging swap contracts are arranged to swap the floating interest rate 3M PRIBOR or 6M PRIBOR paid by the Group and the fixed interest rate the Group receives. The hedging construction is highly effective due to the strong correlation between 14-days interest repo rate and 3M or 6M PRIBOR.
Cross currency interest rate swaps are used to hedge currency risk resulting from interest income accrued on foreign currency investment debt securities. These fixed and float interest income earning securities are included in Available-for-sale financial assets and Held-to-maturity investments of the Group’s balance sheet.
Since the cash-flows from the hedging interest rate swaps are variable and difficult to predict, the Group uses the remaining contractual maturity analysis of the hedging derivatives notionals instead of expected future cash-flows from the hedged items. As the objective of the hedging structure is to achieve fixed interest income, the information of the hedging swaps notionals remaining maturity is more relevant.
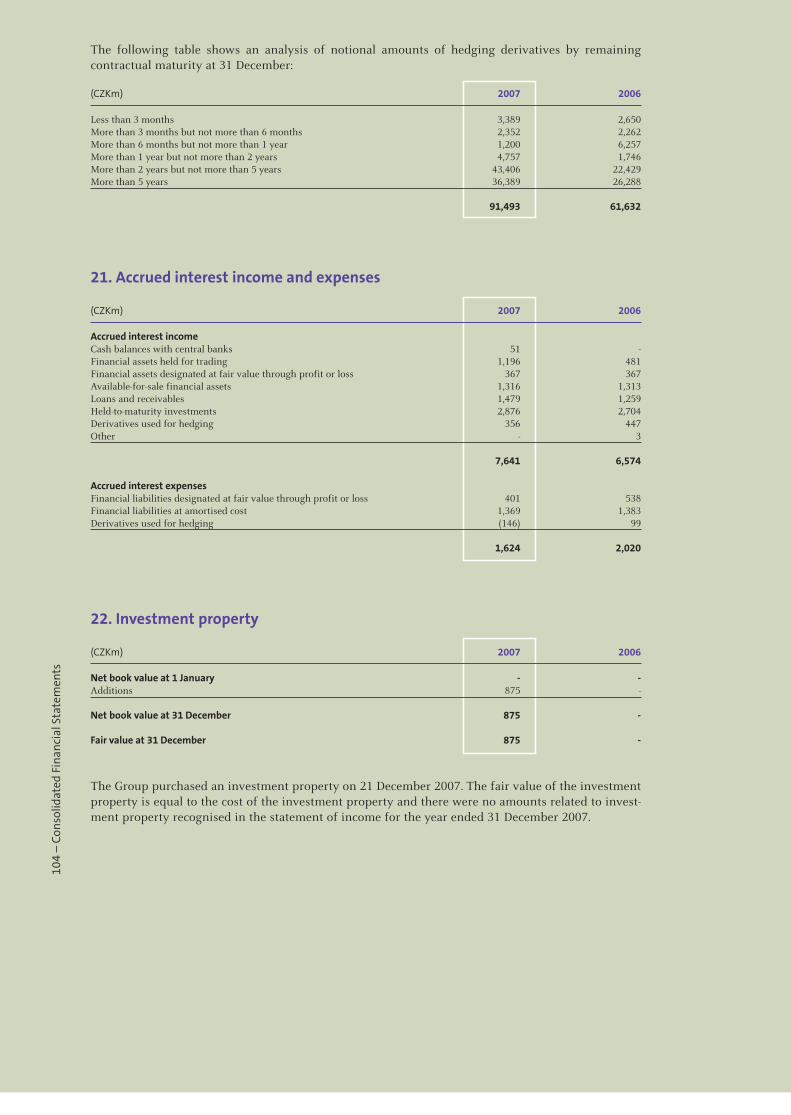
104
– C
onso
lidat
ed F
inan
cial
Sta
tem
ents
The following table shows an analysis of notional amounts of hedging derivatives by remaining contractual maturity at 31 December:
(CZKm) 2007 2006
Less than 3 months 3,389 2,650More than 3 months but not more than 6 months 2,352 2,262More than 6 months but not more than 1 year 1,200 6,257More than 1 year but not more than 2 years 4,757 1,746More than 2 years but not more than 5 years 43,406 22,429More than 5 years 36,389 26,288 91,493 61,632
21. Accrued interest income and expenses
(CZKm) 2007 2006
Accrued interest income Cash balances with central banks 51 -Financial assets held for trading 1,196 481Financial assets designated at fair value through profit or loss 367 367Available-for-sale financial assets 1,316 1,313Loans and receivables 1,479 1,259Held-to-maturity investments 2,876 2,704Derivatives used for hedging 356 447Other - 3 7,641 6,574
Accrued interest expenses Financial liabilities designated at fair value through profit or loss 401 538Financial liabilities at amortised cost 1,369 1,383Derivatives used for hedging (146) 99 1,624 2,020
22. Investment property
(CZKm) 2007 2006
Net book value at 1 January - -Additions 875 - Net book value at 31 December 875 - Fair value at 31 December 875 -
The Group purchased an investment property on 21 December 2007. The fair value of the investment property is equal to the cost of the investment property and there were no amounts related to invest-ment property recognised in the statement of income for the year ended 31 December 2007.
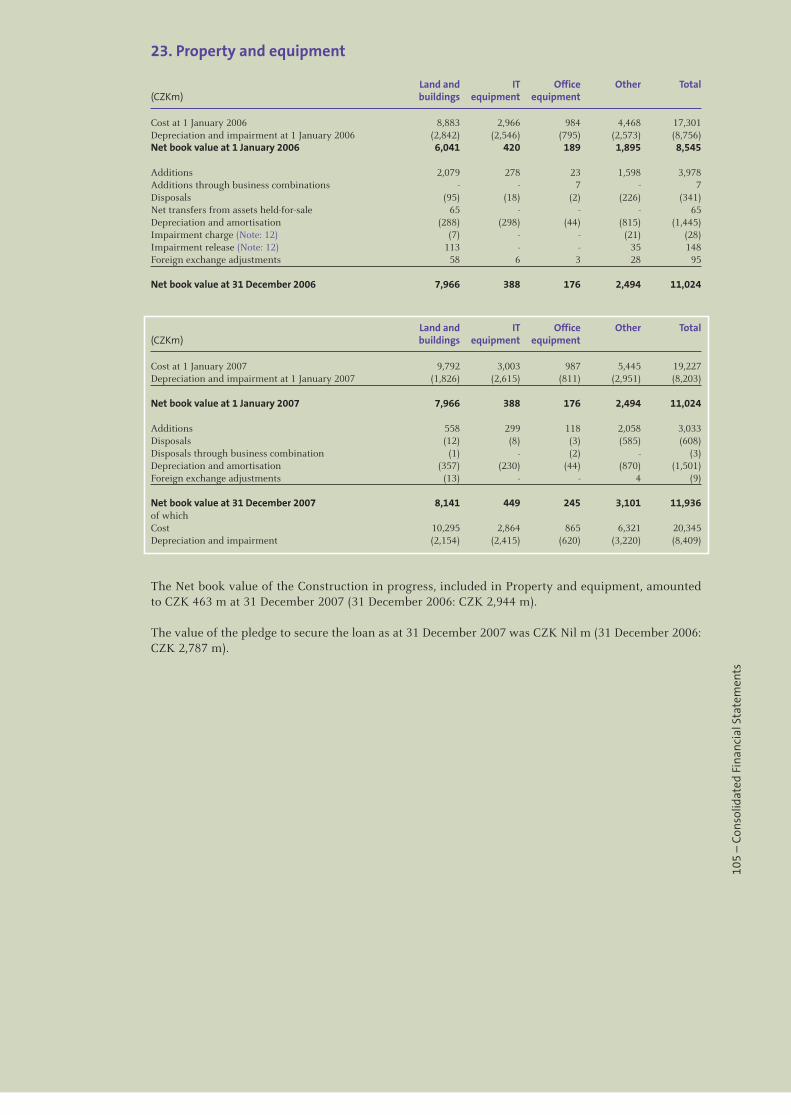
105
– C
onso
lidat
ed F
inan
cial
Sta
tem
ents
23. Property and equipment
Land and IT Office Other Total(CZKm) buildings equipment equipment
Cost at 1 January 2006 8,883 2,966 984 4,468 17,301Depreciation and impairment at 1 January 2006 (2,842) (2,546) (795) (2,573) (8,756)Net book value at 1 January 2006 6,041 420 189 1,895 8,545 Additions 2,079 278 23 1,598 3,978Additions through business combinations - - 7 - 7Disposals (95) (18) (2) (226) (341)Net transfers from assets held-for-sale 65 - - - 65Depreciation and amortisation (288) (298) (44) (815) (1,445)Impairment charge (Note: 12) (7) - - (21) (28)Impairment release (Note: 12) 113 - - 35 148Foreign exchange adjustments 58 6 3 28 95 Net book value at 31 December 2006 7,966 388 176 2,494 11,024
Land and IT Office Other Total(CZKm) buildings equipment equipment
Cost at 1 January 2007 9,792 3,003 987 5,445 19,227Depreciation and impairment at 1 January 2007 (1,826) (2,615) (811) (2,951) (8,203)
Net book value at 1 January 2007 7,966 388 176 2,494 11,024 Additions 558 299 118 2,058 3,033Disposals (12) (8) (3) (585) (608)Disposals through business combination (1) - (2) - (3)Depreciation and amortisation (357) (230) (44) (870) (1,501)Foreign exchange adjustments (13) - - 4 (9) Net book value at 31 December 2007 8,141 449 245 3,101 11,936of which Cost 10,295 2,864 865 6,321 20,345Depreciation and impairment (2,154) (2,415) (620) (3,220) (8,409)
The Net book value of the Construction in progress, included in Property and equipment, amounted to CZK 463 m at 31 December 2007 (31 December 2006: CZK 2,944 m).
The value of the pledge to secure the loan as at 31 December 2007 was CZK Nil m (31 December 2006: CZK 2,787 m).
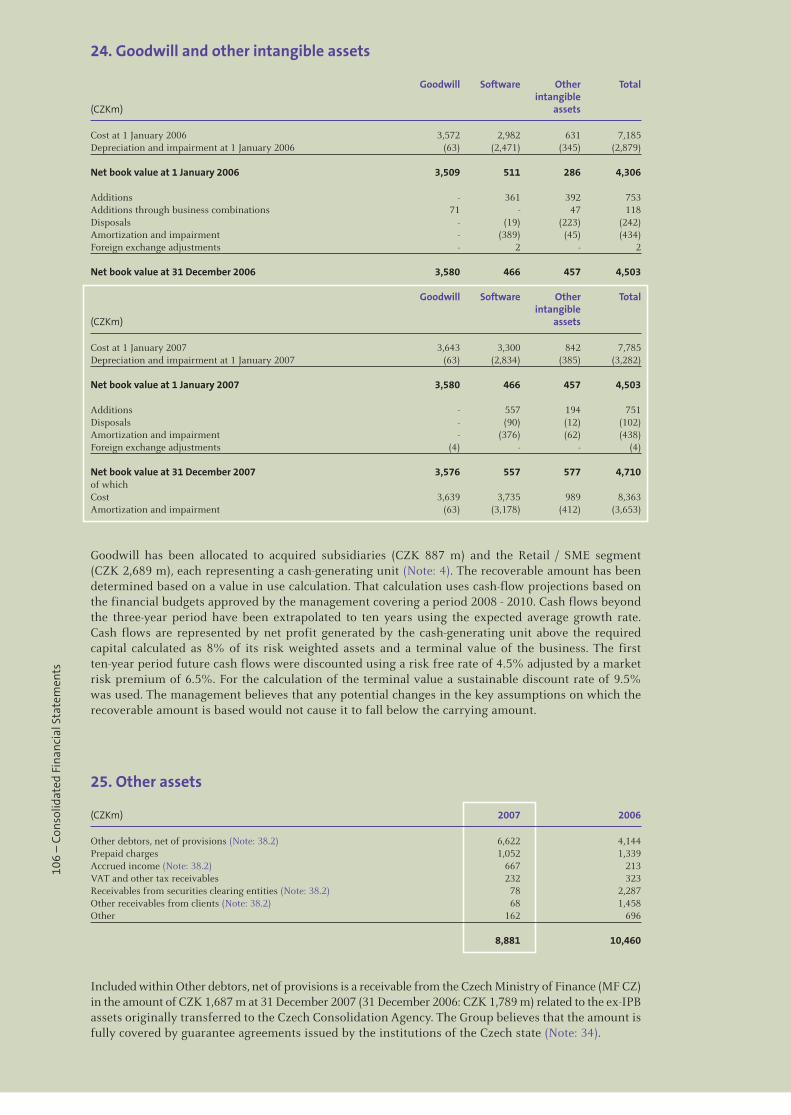
106
– C
onso
lidat
ed F
inan
cial
Sta
tem
ents
24. Goodwill and other intangible assets
Goodwill Software Other Total intangible (CZKm) assets
Cost at 1 January 2006 3,572 2,982 631 7,185Depreciation and impairment at 1 January 2006 (63) (2,471) (345) (2,879)
Net book value at 1 January 2006 3,509 511 286 4,306
Additions - 361 392 753Additions through business combinations 71 - 47 118Disposals - (19) (223) (242)Amortization and impairment - (389) (45) (434)Foreign exchange adjustments - 2 - 2 Net book value at 31 December 2006 3,580 466 457 4,503
Goodwill Software Other Total intangible(CZKm) assets
Cost at 1 January 2007 3,643 3,300 842 7,785Depreciation and impairment at 1 January 2007 (63) (2,834) (385) (3,282)
Net book value at 1 January 2007 3,580 466 457 4,503 Additions - 557 194 751Disposals - (90) (12) (102)Amortization and impairment - (376) (62) (438)Foreign exchange adjustments (4) - - (4) Net book value at 31 December 2007 3,576 557 577 4,710of which Cost 3,639 3,735 989 8,363Amortization and impairment (63) (3,178) (412) (3,653)
Goodwill has been allocated to acquired subsidiaries (CZK 887 m) and the Retail / SME segment (CZK 2,689 m), each representing a cash-generating unit (Note: 4). The recoverable amount has been determined based on a value in use calculation. That calculation uses cash-flow projections based on the financial budgets approved by the management covering a period 2008 - 2010. Cash flows beyond the three-year period have been extrapolated to ten years using the expected average growth rate. Cash flows are represented by net profit generated by the cash-generating unit above the required capital calculated as 8% of its risk weighted assets and a terminal value of the business. The first ten-year period future cash flows were discounted using a risk free rate of 4.5% adjusted by a market risk premium of 6.5%. For the calculation of the terminal value a sustainable discount rate of 9.5% was used. The management believes that any potential changes in the key assumptions on which the recoverable amount is based would not cause it to fall below the carrying amount.
25. Other assets
(CZKm) 2007 2006
Other debtors, net of provisions (Note: 38.2) 6,622 4,144Prepaid charges 1,052 1,339Accrued income (Note: 38.2) 667 213VAT and other tax receivables 232 323Receivables from securities clearing entities (Note: 38.2) 78 2,287Other receivables from clients (Note: 38.2) 68 1,458Other 162 696 8,881 10,460
Included within Other debtors, net of provisions is a receivable from the Czech Ministry of Finance (MF CZ) in the amount of CZK 1,687 m at 31 December 2007 (31 December 2006: CZK 1,789 m) related to the ex-IPB assets originally transferred to the Czech Consolidation Agency. The Group believes that the amount is fully covered by guarantee agreements issued by the institutions of the Czech state (Note: 34).
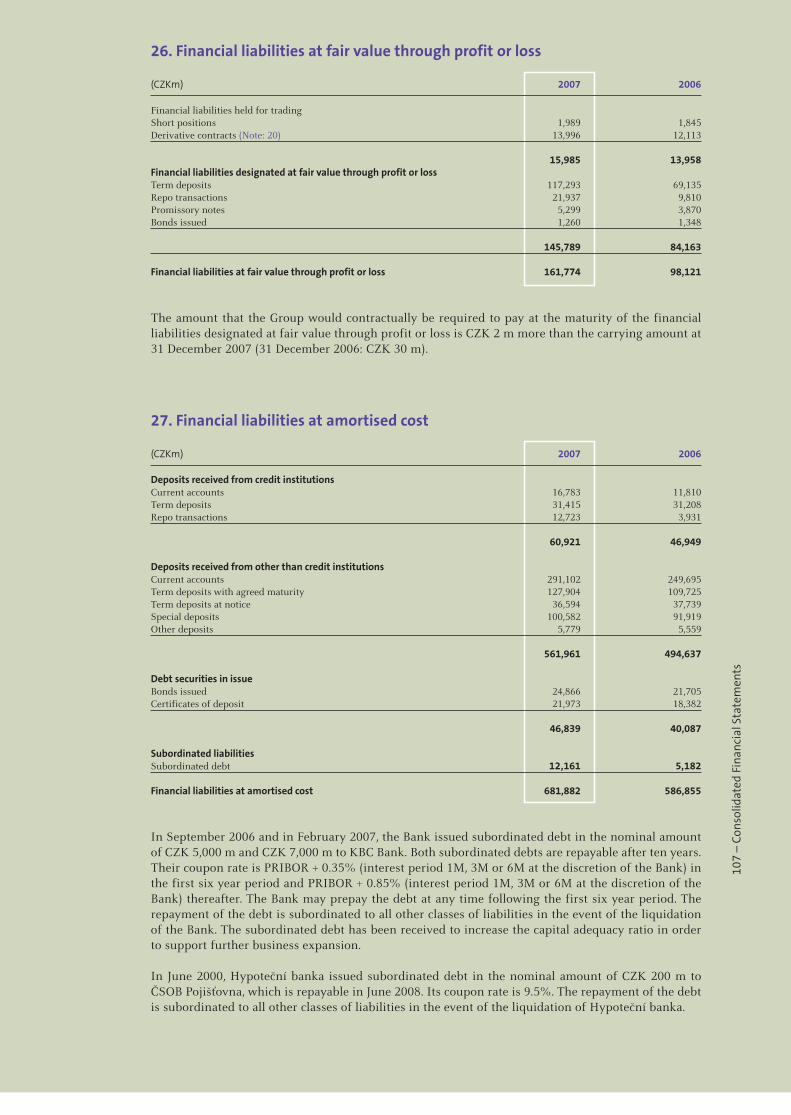
107
– C
onso
lidat
ed F
inan
cial
Sta
tem
ents
26. Financial liabilities at fair value through profit or loss
(CZKm) 2007 2006
Financial liabilities held for trading Short positions 1,989 1,845Derivative contracts (Note: 20) 13,996 12,113 15,985 13,958Financial liabilities designated at fair value through profit or loss Term deposits 117,293 69,135Repo transactions 21,937 9,810Promissory notes 5,299 3,870Bonds issued 1,260 1,348 145,789 84,163 Financial liabilities at fair value through profit or loss 161,774 98,121
The amount that the Group would contractually be required to pay at the maturity of the financial liabilities designated at fair value through profit or loss is CZK 2 m more than the carrying amount at 31 December 2007 (31 December 2006: CZK 30 m).
27. Financial liabilities at amortised cost
(CZKm) 2007 2006
Deposits received from credit institutions Current accounts 16,783 11,810Term deposits 31,415 31,208Repo transactions 12,723 3,931 60,921 46,949
Deposits received from other than credit institutions Current accounts 291,102 249,695Term deposits with agreed maturity 127,904 109,725Term deposits at notice 36,594 37,739Special deposits 100,582 91,919Other deposits 5,779 5,559 561,961 494,637
Debt securities in issue Bonds issued 24,866 21,705Certificates of deposit 21,973 18,382
46,839 40,087
Subordinated liabilities Subordinated debt 12,161 5,182 Financial liabilities at amortised cost 681,882 586,855
In September 2006 and in February 2007, the Bank issued subordinated debt in the nominal amount of CZK 5,000 m and CZK 7,000 m to KBC Bank. Both subordinated debts are repayable after ten years. Their coupon rate is PRIBOR + 0.35% (interest period 1M, 3M or 6M at the discretion of the Bank) in the first six year period and PRIBOR + 0.85% (interest period 1M, 3M or 6M at the discretion of the Bank) thereafter. The Bank may prepay the debt at any time following the first six year period. The repayment of the debt is subordinated to all other classes of liabilities in the event of the liquidation of the Bank. The subordinated debt has been received to increase the capital adequacy ratio in order to support further business expansion.
In June 2000, Hypoteční banka issued subordinated debt in the nominal amount of CZK 200 m to ČSOB Pojišťovna, which is repayable in June 2008. Its coupon rate is 9.5%. The repayment of the debt is subordinated to all other classes of liabilities in the event of the liquidation of Hypoteční banka.
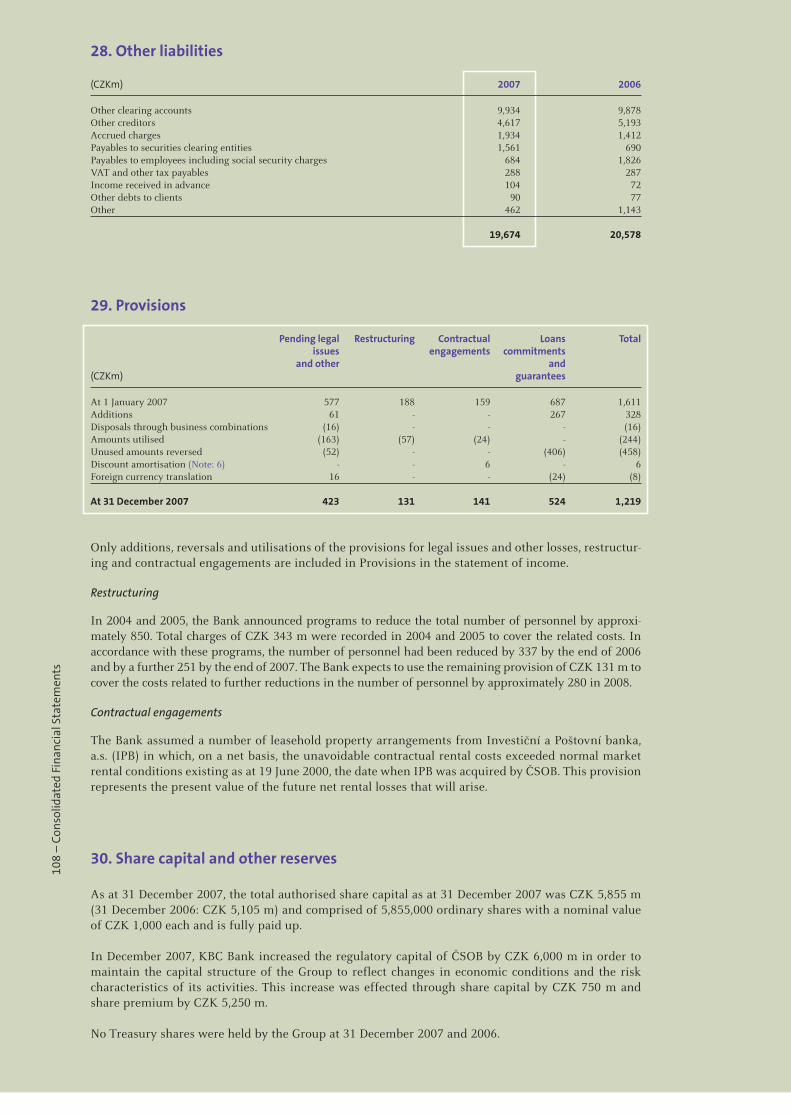
108
– C
onso
lidat
ed F
inan
cial
Sta
tem
ents
28. Other liabilities
(CZKm) 2007 2006
Other clearing accounts 9,934 9,878Other creditors 4,617 5,193Accrued charges 1,934 1,412Payables to securities clearing entities 1,561 690Payables to employees including social security charges 684 1,826VAT and other tax payables 288 287Income received in advance 104 72Other debts to clients 90 77Other 462 1,143 19,674 20,578
29. Provisions
Pending legal Restructuring Contractual Loans Total issues engagements commitments and other and (CZKm) guarantees
At 1 January 2007 577 188 159 687 1,611Additions 61 - - 267 328Disposals through business combinations (16) - - - (16)Amounts utilised (163) (57) (24) - (244) Unused amounts reversed (52) - - (406) (458)Discount amortisation (Note: 6) - - 6 - 6Foreign currency translation 16 - - (24) (8) At 31 December 2007 423 131 141 524 1,219
Only additions, reversals and utilisations of the provisions for legal issues and other losses, restructur-ing and contractual engagements are included in Provisions in the statement of income.
Restructuring
In 2004 and 2005, the Bank announced programs to reduce the total number of personnel by approxi-mately 850. Total charges of CZK 343 m were recorded in 2004 and 2005 to cover the related costs. In accordance with these programs, the number of personnel had been reduced by 337 by the end of 2006 and by a further 251 by the end of 2007. The Bank expects to use the remaining provision of CZK 131 m to cover the costs related to further reductions in the number of personnel by approximately 280 in 2008.
Contractual engagements
The Bank assumed a number of leasehold property arrangements from Investiční a Poštovní banka, a.s. (IPB) in which, on a net basis, the unavoidable contractual rental costs exceeded normal market rental conditions existing as at 19 June 2000, the date when IPB was acquired by ČSOB. This provision represents the present value of the future net rental losses that will arise.
30. Share capital and other reserves
As at 31 December 2007, the total authorised share capital as at 31 December 2007 was CZK 5,855 m (31 December 2006: CZK 5,105 m) and comprised of 5,855,000 ordinary shares with a nominal value of CZK 1,000 each and is fully paid up.
In December 2007, KBC Bank increased the regulatory capital of ČSOB by CZK 6,000 m in order to maintain the capital structure of the Group to reflect changes in economic conditions and the risk characteristics of its activities. This increase was effected through share capital by CZK 750 m and share premium by CZK 5,250 m.
No Treasury shares were held by the Group at 31 December 2007 and 2006.
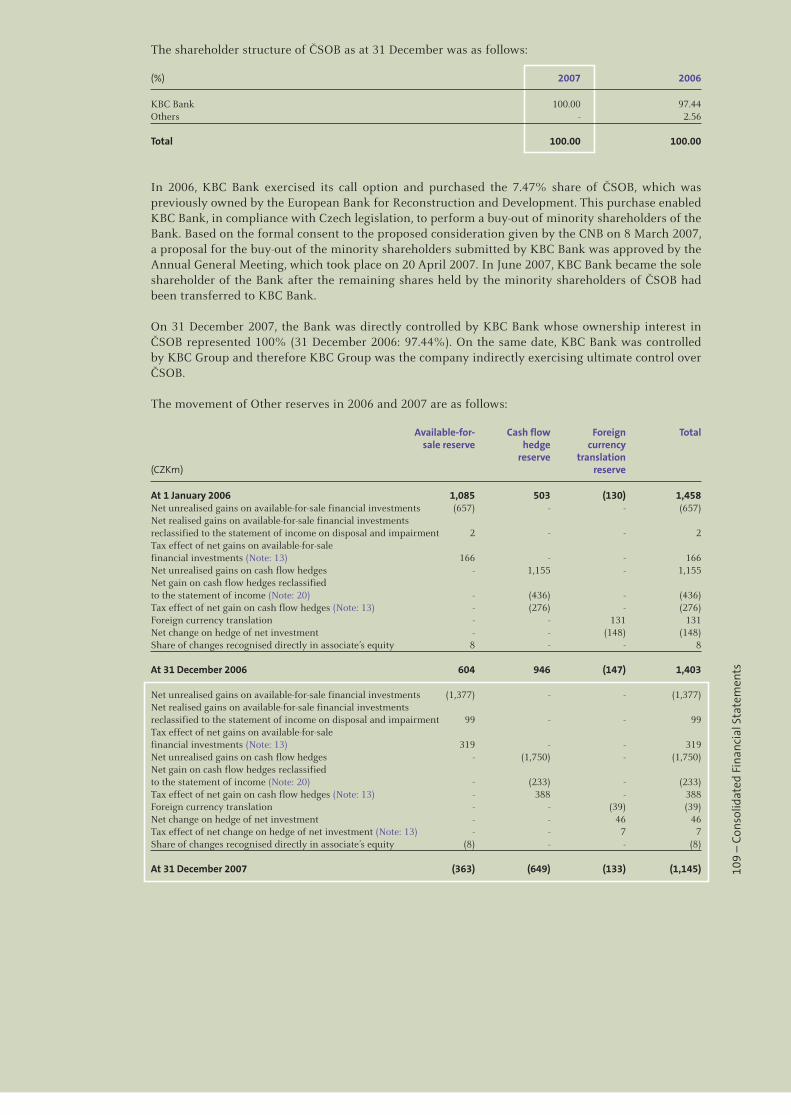
109
– C
onso
lidat
ed F
inan
cial
Sta
tem
ents
The shareholder structure of ČSOB as at 31 December was as follows:
(%) 2007 2006
KBC Bank 100.00 97.44Others - 2.56 Total 100.00 100.00
In 2006, KBC Bank exercised its call option and purchased the 7.47% share of ČSOB, which was previously owned by the European Bank for Reconstruction and Development. This purchase enabled KBC Bank, in compliance with Czech legislation, to perform a buy-out of minority shareholders of the Bank. Based on the formal consent to the proposed consideration given by the CNB on 8 March 2007, a proposal for the buy-out of the minority shareholders submitted by KBC Bank was approved by the Annual General Meeting, which took place on 20 April 2007. In June 2007, KBC Bank became the sole shareholder of the Bank after the remaining shares held by the minority shareholders of ČSOB had been transferred to KBC Bank.
On 31 December 2007, the Bank was directly controlled by KBC Bank whose ownership interest in ČSOB represented 100% (31 December 2006: 97.44%). On the same date, KBC Bank was controlled by KBC Group and therefore KBC Group was the company indirectly exercising ultimate control over ČSOB.
The movement of Other reserves in 2006 and 2007 are as follows:
Available-for- Cash flow Foreign Total sale reserve hedge currency reserve translation(CZKm) reserve
At 1 January 2006 1,085 503 (130) 1,458Net unrealised gains on available-for-sale financial investments (657) - - (657)Net realised gains on available-for-sale financial investments reclassified to the statement of income on disposal and impairment 2 - - 2Tax effect of net gains on available-for-sale financial investments (Note: 13) 166 - - 166Net unrealised gains on cash flow hedges - 1,155 - 1,155Net gain on cash flow hedges reclassified to the statement of income (Note: 20) - (436) - (436)Tax effect of net gain on cash flow hedges (Note: 13) - (276) - (276)Foreign currency translation - - 131 131Net change on hedge of net investment - - (148) (148)Share of changes recognised directly in associate’s equity 8 - - 8 At 31 December 2006 604 946 (147) 1,403
Net unrealised gains on available-for-sale financial investments (1,377) - - (1,377)Net realised gains on available-for-sale financial investments reclassified to the statement of income on disposal and impairment 99 - - 99Tax effect of net gains on available-for-sale financial investments (Note: 13) 319 - - 319Net unrealised gains on cash flow hedges - (1,750) - (1,750)Net gain on cash flow hedges reclassified to the statement of income (Note: 20) - (233) - (233)Tax effect of net gain on cash flow hedges (Note: 13) - 388 - 388Foreign currency translation - - (39) (39)Net change on hedge of net investment - - 46 46Tax effect of net change on hedge of net investment (Note: 13) - - 7 7Share of changes recognised directly in associate’s equity (8) - - (8) At 31 December 2007 (363) (649) (133) (1,145)
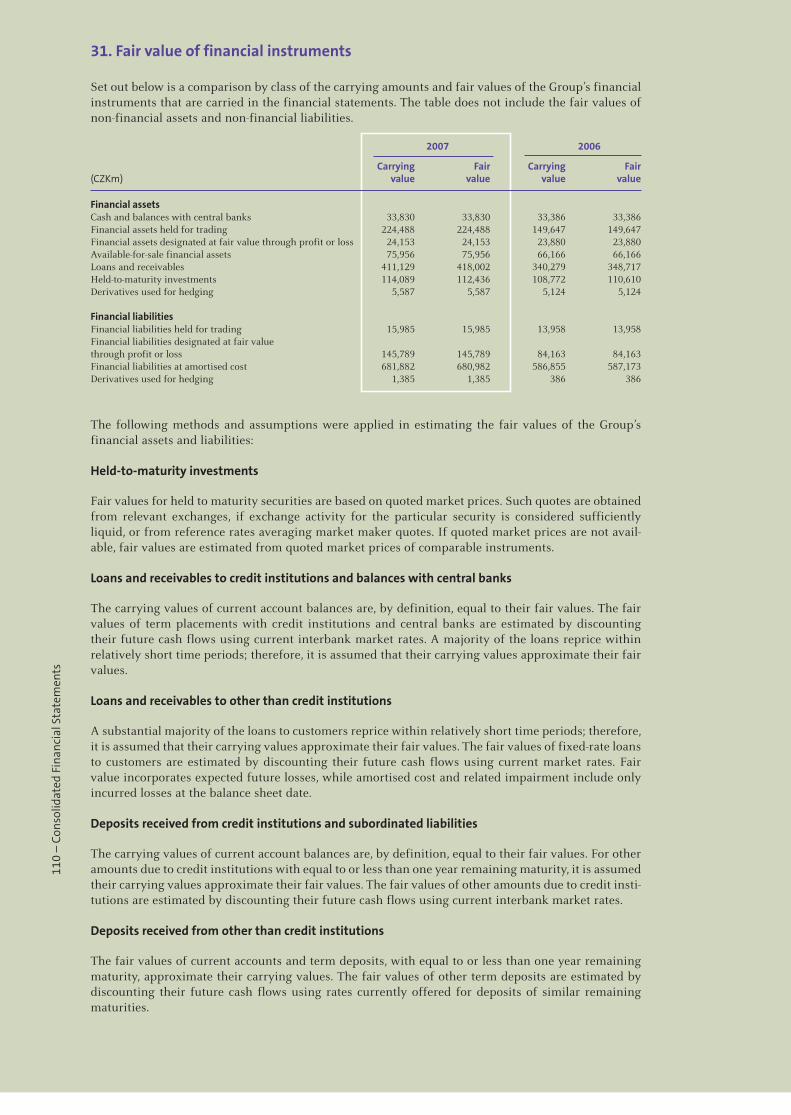
110
– C
onso
lidat
ed F
inan
cial
Sta
tem
ents
31. Fair value of financial instruments
Set out below is a comparison by class of the carrying amounts and fair values of the Group’s financial instruments that are carried in the financial statements. The table does not include the fair values of non-financial assets and non-financial liabilities.
2007 2006
Carrying Fair Carrying Fair(CZKm) value value value value
Financial assets Cash and balances with central banks 33,830 33,830 33,386 33,386Financial assets held for trading 224,488 224,488 149,647 149,647Financial assets designated at fair value through profit or loss 24,153 24,153 23,880 23,880Available-for-sale financial assets 75,956 75,956 66,166 66,166Loans and receivables 411,129 418,002 340,279 348,717Held-to-maturity investments 114,089 112,436 108,772 110,610Derivatives used for hedging 5,587 5,587 5,124 5,124 Financial liabilities Financial liabilities held for trading 15,985 15,985 13,958 13,958Financial liabilities designated at fair value through profit or loss 145,789 145,789 84,163 84,163Financial liabilities at amortised cost 681,882 680,982 586,855 587,173Derivatives used for hedging 1,385 1,385 386 386
The following methods and assumptions were applied in estimating the fair values of the Group’s financial assets and liabilities:
Held-to-maturity investments
Fair values for held to maturity securities are based on quoted market prices. Such quotes are obtained from relevant exchanges, if exchange activity for the particular security is considered sufficiently liquid, or from reference rates averaging market maker quotes. If quoted market prices are not avail-able, fair values are estimated from quoted market prices of comparable instruments.
Loans and receivables to credit institutions and balances with central banks
The carrying values of current account balances are, by definition, equal to their fair values. The fair values of term placements with credit institutions and central banks are estimated by discounting their future cash flows using current interbank market rates. A majority of the loans reprice within relatively short time periods; therefore, it is assumed that their carrying values approximate their fair values.
Loans and receivables to other than credit institutions
A substantial majority of the loans to customers reprice within relatively short time periods; therefore, it is assumed that their carrying values approximate their fair values. The fair values of fixed-rate loans to customers are estimated by discounting their future cash flows using current market rates. Fair value incorporates expected future losses, while amortised cost and related impairment include only incurred losses at the balance sheet date.
Deposits received from credit institutions and subordinated liabilities
The carrying values of current account balances are, by definition, equal to their fair values. For other amounts due to credit institutions with equal to or less than one year remaining maturity, it is assumed their carrying values approximate their fair values. The fair values of other amounts due to credit insti-tutions are estimated by discounting their future cash flows using current interbank market rates.
Deposits received from other than credit institutions
The fair values of current accounts and term deposits, with equal to or less than one year remaining maturity, approximate their carrying values. The fair values of other term deposits are estimated by discounting their future cash flows using rates currently offered for deposits of similar remaining maturities.
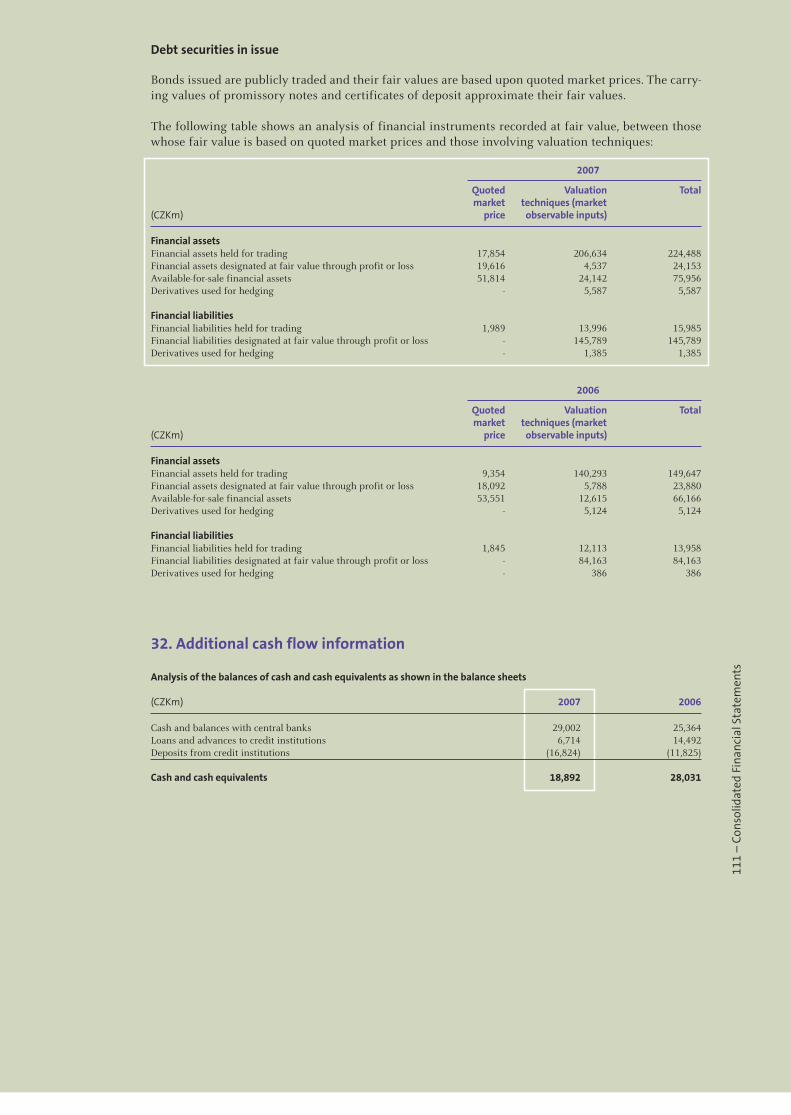
111
– C
onso
lidat
ed F
inan
cial
Sta
tem
ents
Debt securities in issue
Bonds issued are publicly traded and their fair values are based upon quoted market prices. The carry-ing values of promissory notes and certificates of deposit approximate their fair values.
The following table shows an analysis of financial instruments recorded at fair value, between those whose fair value is based on quoted market prices and those involving valuation techniques:
2007
Quoted Valuation Total market techniques (market(CZKm) price observable inputs)
Financial assets Financial assets held for trading 17,854 206,634 224,488Financial assets designated at fair value through profit or loss 19,616 4,537 24,153Available-for-sale financial assets 51,814 24,142 75,956Derivatives used for hedging - 5,587 5,587 Financial liabilities Financial liabilities held for trading 1,989 13,996 15,985Financial liabilities designated at fair value through profit or loss - 145,789 145,789Derivatives used for hedging - 1,385 1,385
2006
Quoted Valuation Total market techniques (market(CZKm) price observable inputs)
Financial assets Financial assets held for trading 9,354 140,293 149,647Financial assets designated at fair value through profit or loss 18,092 5,788 23,880Available-for-sale financial assets 53,551 12,615 66,166Derivatives used for hedging - 5,124 5,124 Financial liabilities Financial liabilities held for trading 1,845 12,113 13,958Financial liabilities designated at fair value through profit or loss - 84,163 84,163Derivatives used for hedging - 386 386
32. Additional cash flow information
Analysis of the balances of cash and cash equivalents as shown in the balance sheets
(CZKm) 2007 2006
Cash and balances with central banks 29,002 25,364Loans and advances to credit institutions 6,714 14,492Deposits from credit institutions (16,824) (11,825) Cash and cash equivalents 18,892 28,031
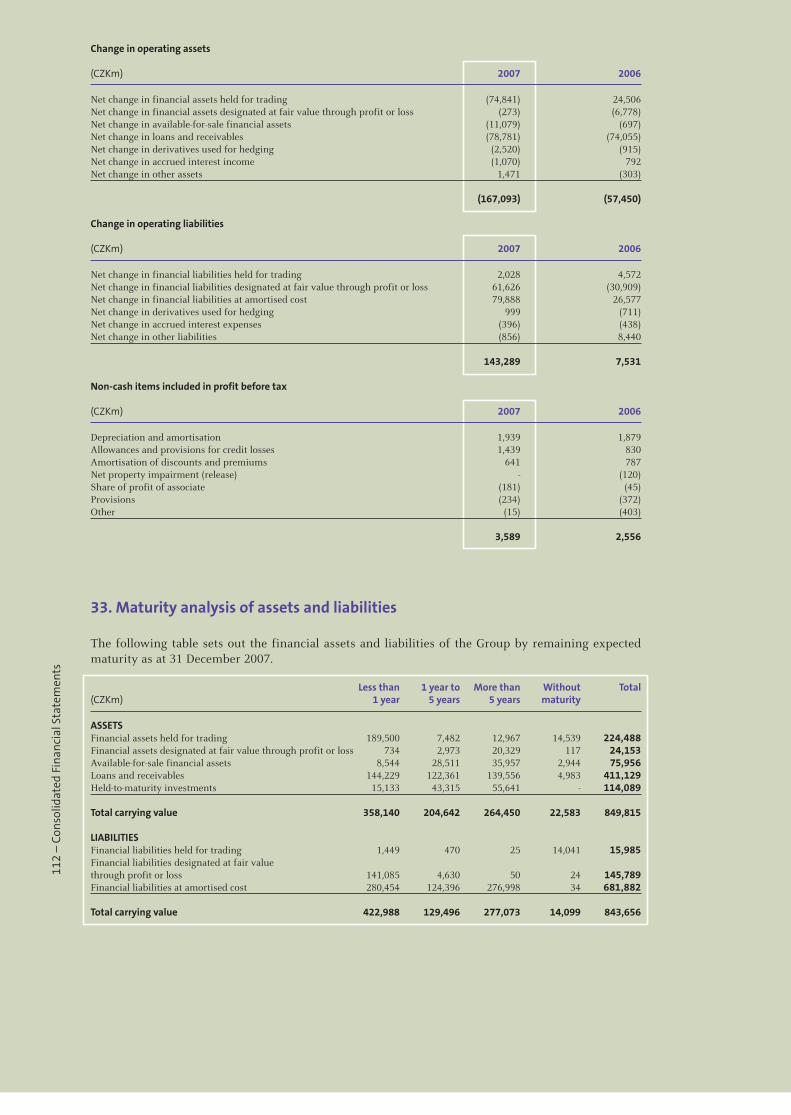
112
– C
onso
lidat
ed F
inan
cial
Sta
tem
ents
Change in operating assets
(CZKm) 2007 2006
Net change in financial assets held for trading (74,841) 24,506Net change in financial assets designated at fair value through profit or loss (273) (6,778)Net change in available-for-sale financial assets (11,079) (697)Net change in loans and receivables (78,781) (74,055)Net change in derivatives used for hedging (2,520) (915)Net change in accrued interest income (1,070) 792Net change in other assets 1,471 (303) (167,093) (57,450)
Change in operating liabilities
(CZKm) 2007 2006
Net change in financial liabilities held for trading 2,028 4,572Net change in financial liabilities designated at fair value through profit or loss 61,626 (30,909)Net change in financial liabilities at amortised cost 79,888 26,577Net change in derivatives used for hedging 999 (711)Net change in accrued interest expenses (396) (438)Net change in other liabilities (856) 8,440 143,289 7,531
Non-cash items included in profit before tax
(CZKm) 2007 2006
Depreciation and amortisation 1,939 1,879Allowances and provisions for credit losses 1,439 830Amortisation of discounts and premiums 641 787Net property impairment (release) - (120)Share of profit of associate (181) (45)Provisions (234) (372)Other (15) (403) 3,589 2,556
33. Maturity analysis of assets and liabilities
The following table sets out the financial assets and liabilities of the Group by remaining expected maturity as at 31 December 2007.
Less than 1 year to More than Without Total(CZKm) 1 year 5 years 5 years maturity
ASSETS Financial assets held for trading 189,500 7,482 12,967 14,539 224,488Financial assets designated at fair value through profit or loss 734 2,973 20,329 117 24,153Available-for-sale financial assets 8,544 28,511 35,957 2,944 75,956Loans and receivables 144,229 122,361 139,556 4,983 411,129Held-to-maturity investments 15,133 43,315 55,641 - 114,089 Total carrying value 358,140 204,642 264,450 22,583 849,815
LIABILITIES Financial liabilities held for trading 1,449 470 25 14,041 15,985Financial liabilities designated at fair value through profit or loss 141,085 4,630 50 24 145,789Financial liabilities at amortised cost 280,454 124,396 276,998 34 681,882 Total carrying value 422,988 129,496 277,073 14,099 843,656
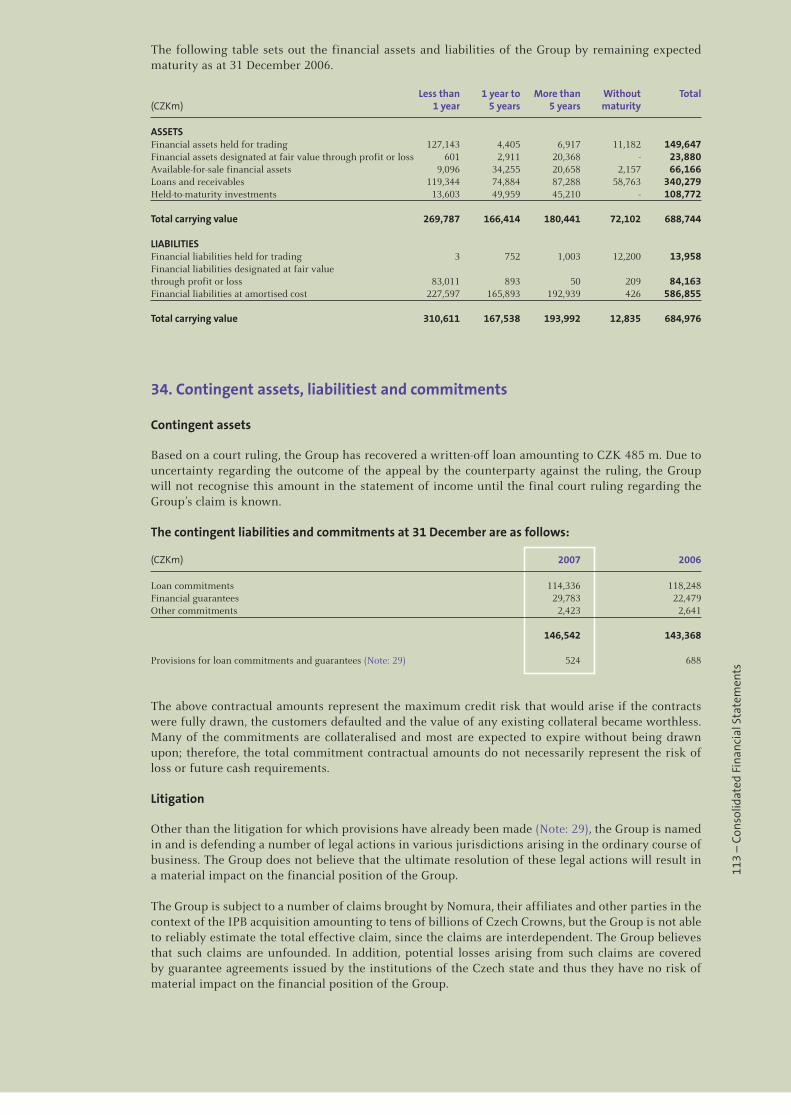
113
– C
onso
lidat
ed F
inan
cial
Sta
tem
ents
The following table sets out the financial assets and liabilities of the Group by remaining expected maturity as at 31 December 2006.
Less than 1 year to More than Without Total(CZKm) 1 year 5 years 5 years maturity
ASSETS Financial assets held for trading 127,143 4,405 6,917 11,182 149,647Financial assets designated at fair value through profit or loss 601 2,911 20,368 - 23,880Available-for-sale financial assets 9,096 34,255 20,658 2,157 66,166Loans and receivables 119,344 74,884 87,288 58,763 340,279Held-to-maturity investments 13,603 49,959 45,210 - 108,772 Total carrying value 269,787 166,414 180,441 72,102 688,744 LIABILITIES Financial liabilities held for trading 3 752 1,003 12,200 13,958Financial liabilities designated at fair value through profit or loss 83,011 893 50 209 84,163Financial liabilities at amortised cost 227,597 165,893 192,939 426 586,855 Total carrying value 310,611 167,538 193,992 12,835 684,976
34. Contingent assets, liabilitiest and commitments
Contingent assets
Based on a court ruling, the Group has recovered a written-off loan amounting to CZK 485 m. Due to uncertainty regarding the outcome of the appeal by the counterparty against the ruling, the Group will not recognise this amount in the statement of income until the final court ruling regarding the Group’s claim is known.
The contingent liabilities and commitments at 31 December are as follows:
(CZKm) 2007 2006
Loan commitments 114,336 118,248Financial guarantees 29,783 22,479Other commitments 2,423 2,641 146,542 143,368 Provisions for loan commitments and guarantees (Note: 29) 524 688
The above contractual amounts represent the maximum credit risk that would arise if the contracts were fully drawn, the customers defaulted and the value of any existing collateral became worthless. Many of the commitments are collateralised and most are expected to expire without being drawn upon; therefore, the total commitment contractual amounts do not necessarily represent the risk of loss or future cash requirements.
Litigation
Other than the litigation for which provisions have already been made (Note: 29), the Group is named in and is defending a number of legal actions in various jurisdictions arising in the ordinary course of business. The Group does not believe that the ultimate resolution of these legal actions will result in a material impact on the financial position of the Group.
The Group is subject to a number of claims brought by Nomura, their affiliates and other parties in the context of the IPB acquisition amounting to tens of billions of Czech Crowns, but the Group is not able to reliably estimate the total effective claim, since the claims are interdependent. The Group believes that such claims are unfounded. In addition, potential losses arising from such claims are covered by guarantee agreements issued by the institutions of the Czech state and thus they have no risk of material impact on the financial position of the Group.
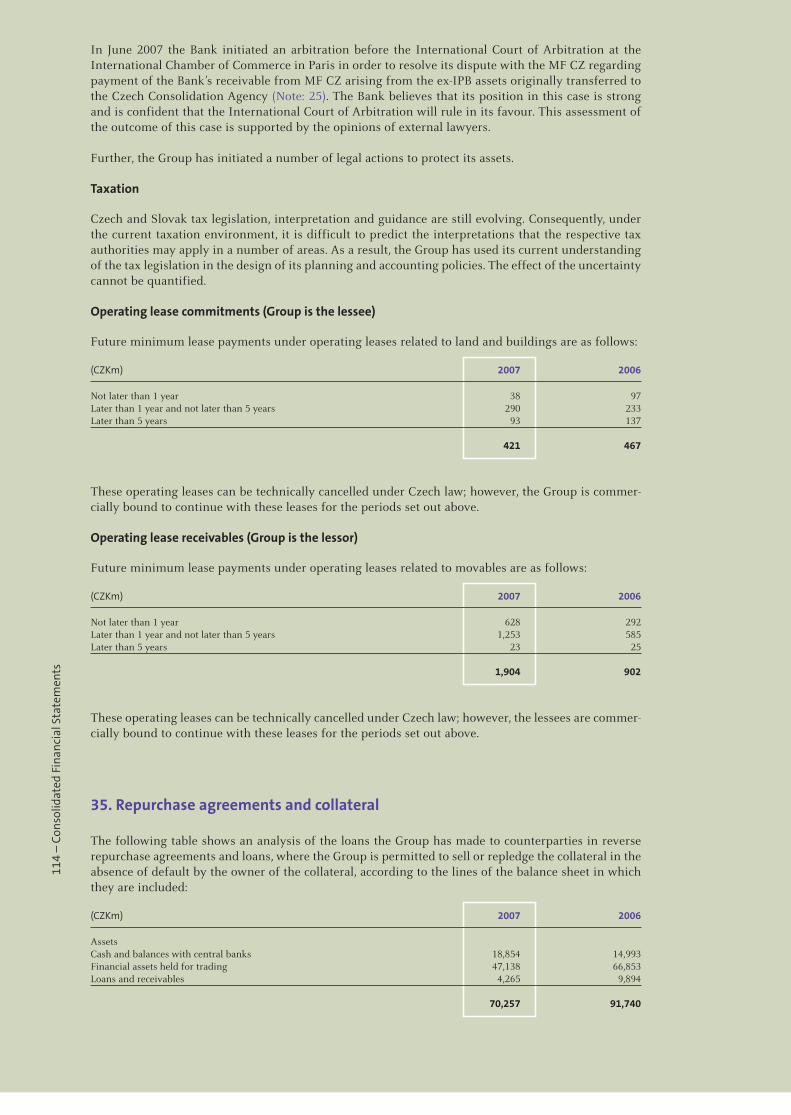
114
– C
onso
lidat
ed F
inan
cial
Sta
tem
ents
In June 2007 the Bank initiated an arbitration before the International Court of Arbitration at the International Chamber of Commerce in Paris in order to resolve its dispute with the MF CZ regarding payment of the Bank’s receivable from MF CZ arising from the ex-IPB assets originally transferred to the Czech Consolidation Agency (Note: 25). The Bank believes that its position in this case is strong and is confident that the International Court of Arbitration will rule in its favour. This assessment of the outcome of this case is supported by the opinions of external lawyers.
Further, the Group has initiated a number of legal actions to protect its assets.
Taxation
Czech and Slovak tax legislation, interpretation and guidance are still evolving. Consequently, under the current taxation environment, it is difficult to predict the interpretations that the respective tax authorities may apply in a number of areas. As a result, the Group has used its current understanding of the tax legislation in the design of its planning and accounting policies. The effect of the uncertainty cannot be quantified.
Operating lease commitments (Group is the lessee)
Future minimum lease payments under operating leases related to land and buildings are as follows:
(CZKm) 2007 2006
Not later than 1 year 38 97Later than 1 year and not later than 5 years 290 233Later than 5 years 93 137
421 467
These operating leases can be technically cancelled under Czech law; however, the Group is commer-cially bound to continue with these leases for the periods set out above.
Operating lease receivables (Group is the lessor)
Future minimum lease payments under operating leases related to movables are as follows:
(CZKm) 2007 2006
Not later than 1 year 628 292Later than 1 year and not later than 5 years 1,253 585Later than 5 years 23 25
1,904 902
These operating leases can be technically cancelled under Czech law; however, the lessees are commer-cially bound to continue with these leases for the periods set out above.
35. Repurchase agreements and collateral
The following table shows an analysis of the loans the Group has made to counterparties in reverse repurchase agreements and loans, where the Group is permitted to sell or repledge the collateral in the absence of default by the owner of the collateral, according to the lines of the balance sheet in which they are included:
(CZKm) 2007 2006
Assets Cash and balances with central banks 18,854 14,993Financial assets held for trading 47,138 66,853Loans and receivables 4,265 9,894 70,257 91,740
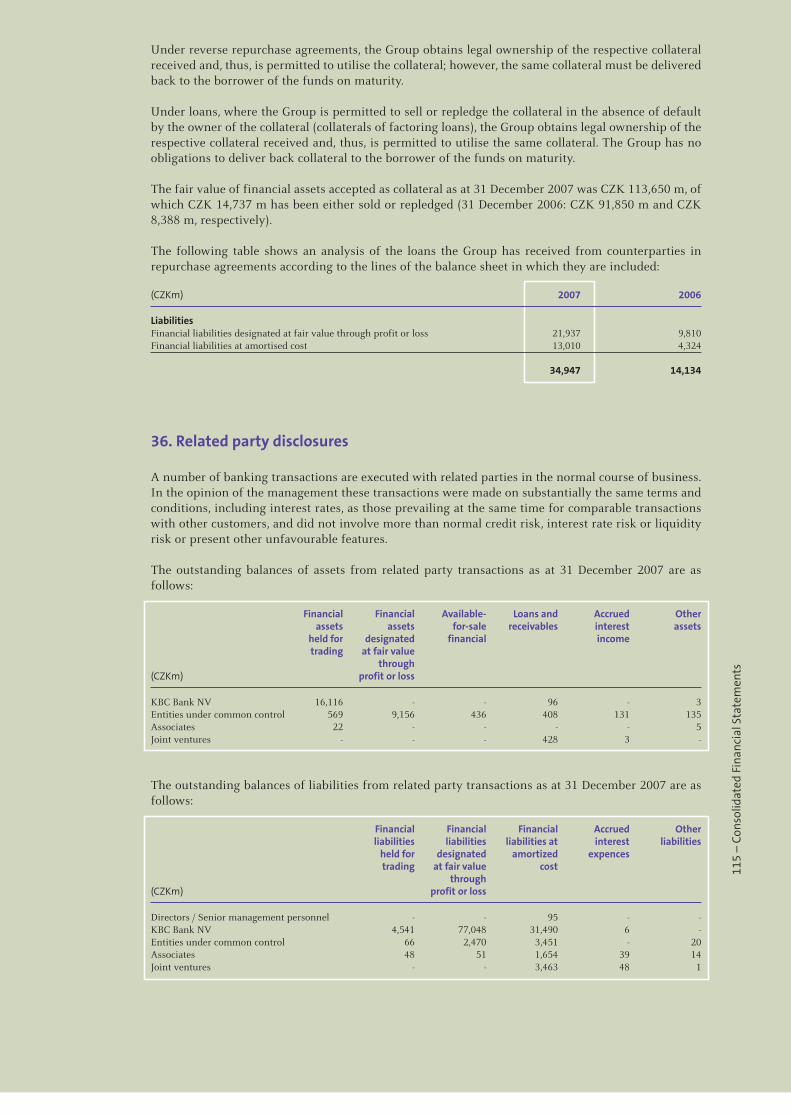
115
– C
onso
lidat
ed F
inan
cial
Sta
tem
ents
Under reverse repurchase agreements, the Group obtains legal ownership of the respective collateral received and, thus, is permitted to utilise the collateral; however, the same collateral must be delivered back to the borrower of the funds on maturity.
Under loans, where the Group is permitted to sell or repledge the collateral in the absence of default by the owner of the collateral (collaterals of factoring loans), the Group obtains legal ownership of the respective collateral received and, thus, is permitted to utilise the same collateral. The Group has no obligations to deliver back collateral to the borrower of the funds on maturity.
The fair value of financial assets accepted as collateral as at 31 December 2007 was CZK 113,650 m, of which CZK 14,737 m has been either sold or repledged (31 December 2006: CZK 91,850 m and CZK 8,388 m, respectively).
The following table shows an analysis of the loans the Group has received from counterparties in repurchase agreements according to the lines of the balance sheet in which they are included:
(CZKm) 2007 2006
Liabilities Financial liabilities designated at fair value through profit or loss 21,937 9,810Financial liabilities at amortised cost 13,010 4,324 34,947 14,134
36. Related party disclosures
A number of banking transactions are executed with related parties in the normal course of business. In the opinion of the management these transactions were made on substantially the same terms and conditions, including interest rates, as those prevailing at the same time for comparable transactions with other customers, and did not involve more than normal credit risk, interest rate risk or liquidity risk or present other unfavourable features.
The outstanding balances of assets from related party transactions as at 31 December 2007 are as follows:
Financial Financial Available- Loans and Accrued Other assets assets for-sale receivables interest assets held for designated financial income trading at fair value through(CZKm) profit or loss
KBC Bank NV 16,116 - - 96 - 3Entities under common control 569 9,156 436 408 131 135Associates 22 - - - - 5Joint ventures - - - 428 3 -
The outstanding balances of liabilities from related party transactions as at 31 December 2007 are as follows:
Financial Financial Financial Accrued Other liabilities liabilities liabilities at interest liabilities held for designated amortized expences trading at fair value cost through(CZKm) profit or loss
Directors / Senior management personnel - - 95 - -KBC Bank NV 4,541 77,048 31,490 6 -Entities under common control 66 2,470 3,451 - 20Associates 48 51 1,654 39 14Joint ventures - - 3,463 48 1
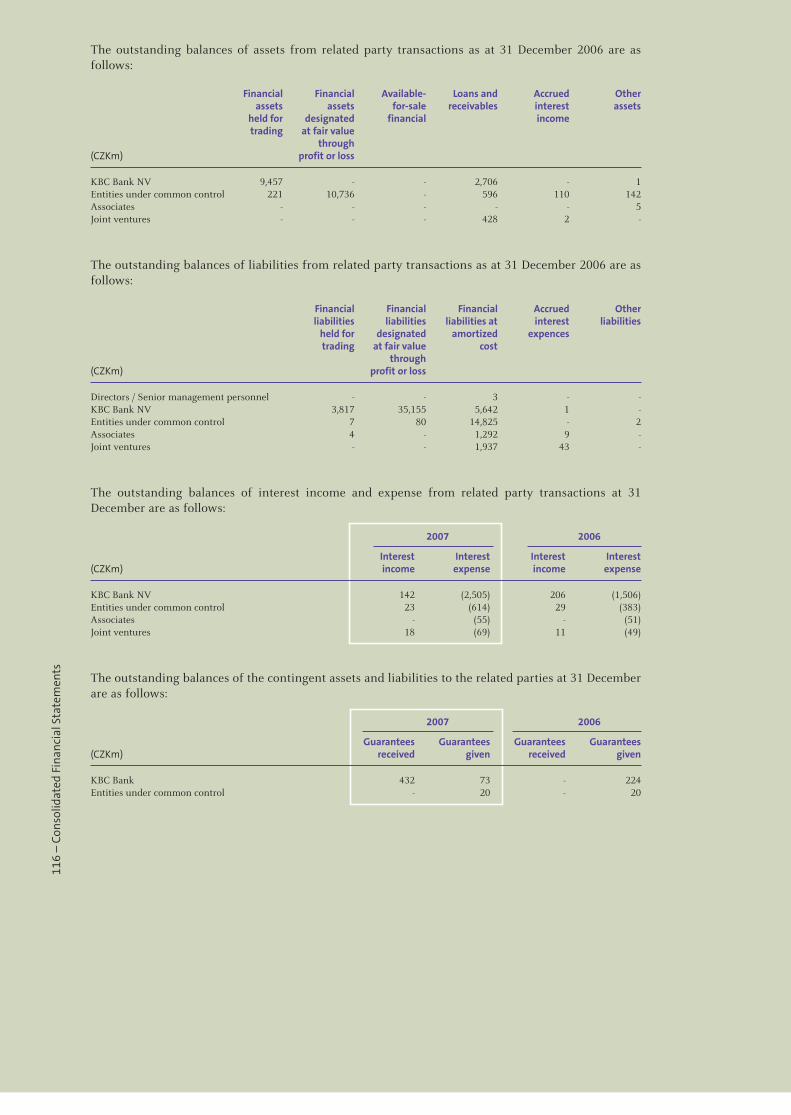
116
– C
onso
lidat
ed F
inan
cial
Sta
tem
ents
The outstanding balances of assets from related party transactions as at 31 December 2006 are as follows:
Financial Financial Available- Loans and Accrued Other assets assets for-sale receivables interest assets held for designated financial income trading at fair value through(CZKm) profit or loss
KBC Bank NV 9,457 - - 2,706 - 1Entities under common control 221 10,736 - 596 110 142Associates - - - - - 5Joint ventures - - - 428 2 -
The outstanding balances of liabilities from related party transactions as at 31 December 2006 are as follows:
Financial Financial Financial Accrued Other liabilities liabilities liabilities at interest liabilities held for designated amortized expences trading at fair value cost through(CZKm) profit or loss
Directors / Senior management personnel - - 3 - -KBC Bank NV 3,817 35,155 5,642 1 -Entities under common control 7 80 14,825 - 2Associates 4 - 1,292 9 -Joint ventures - - 1,937 43 -
The outstanding balances of interest income and expense from related party transactions at 31 December are as follows:
2007 2006
Interest Interest Interest Interest(CZKm) income expense income expense
KBC Bank NV 142 (2,505) 206 (1,506)Entities under common control 23 (614) 29 (383)Associates - (55) - (51)Joint ventures 18 (69) 11 (49)
The outstanding balances of the contingent assets and liabilities to the related parties at 31 December are as follows:
2007 2006
Guarantees Guarantees Guarantees Guarantees(CZKm) received given received given
KBC Bank 432 73 - 224Entities under common control - 20 - 20
117
– C
onso
lidat
ed F
inan
cial
Sta
tem
ents
37. Events after the balance sheet date
MF CZ receivable
As described in Notes 25 and 34, ČSOB has initiated an arbitration before the International Court of Arbitration at the International Chamber of Commerce in Paris in order to resolve its dispute with the MF CZ regarding payment of the Bank’s receivable in the amount of CZK 1,656 m plus related accrued interest in the amount of CZK 122 m from MF CZ arising from the ex-IPB assets originally transferred to the Czech Consolidation Agency.
On 21 March 2008, the CNB has instructed the Bank to derecognize the receivable. Although the Bank’s management believe, on the basis of legal opinions received, that the receivable is fully recoverable, in order to comply with the requirements of the regulator the intention of the Bank’s management is to derecognize this receivable in 2008.
Transformation of business in Slovakia
In 2007, KBC Bank, as the sole shareholder of the Bank, decided to establish a new legal entity in the Slovak Republic, for KBC Group strategic reasons and with the aim of management in both countries (Czech and Slovak Republics) reporting directly to the KBC Group. The foundation agreement of Československá obchodná banka, a.s. (ČSOB SK) was signed on 14 August 2007, with an effective date of 1 January 2008.
The structure of shareholders of ČSOB SK is as follows:
Share on capital Fair value of share of capital (%) (SKKm)
ČSOB 56.74 11,408KBC Bank 39.80 8,000ČSOB Leasing CZ 2.02 407ČSOB Factoring CZ 1.44 289 Total 100.00 20,104
The share of ČSOB is represented by non-cash contribution of assets and liabilities recorded in the books of ČSOB Slovakia branch as at 31 December 2007 and additional deposit of shares of all the ČSOB subsidiaries incorporated in the Slovak Republic (Note: 3).
The KBC Bank share is represented by a cash deposit.
The ČSOB Leasing CZ and ČSOB Factoring CZ shares are represented by their shares in ČSOB Leasing SK and ČSOB Factoring SK.
Based on the Agreement on the exercise of voting rights signed on 14 August 2007, the execution of the voting rights of all other shareholders was transferred to KBC Bank. Therefore, form 1 January 2008, ČSOB SK has been controlled by KBC Bank.
The transaction is held between entities under common control and is treated as a reorganisation of the currently existing group. Starting on 1 January 2008, the ČSOB Group’s subsidiaries in the Slovak Republic are excluded from the ČSOB Group consolidation scope. These shares as well as the deposited assets and liabilities are replaced by the share in ČSOB SK.
The net assets contributed by ČSOB Group to ČSOB SK represent CZK 5,161 m. The main effects on the ČSOB consolidated financial statements are shown below.
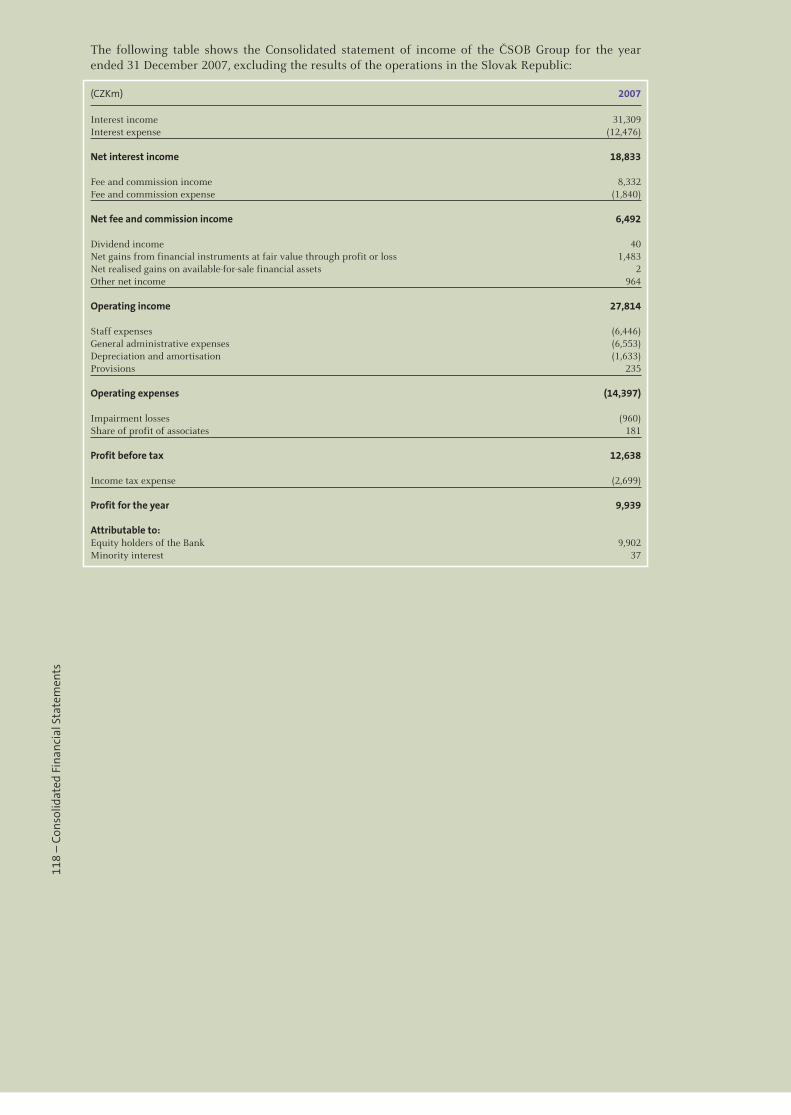
118
– C
onso
lidat
ed F
inan
cial
Sta
tem
ents
The following table shows the Consolidated statement of income of the ČSOB Group for the year ended 31 December 2007, excluding the results of the operations in the Slovak Republic:
(CZKm) 2007
Interest income 31,309Interest expense (12,476) Net interest income 18,833 Fee and commission income 8,332Fee and commission expense (1,840) Net fee and commission income 6,492 Dividend income 40Net gains from financial instruments at fair value through profit or loss 1,483Net realised gains on available-for-sale financial assets 2Other net income 964 Operating income 27,814 Staff expenses (6,446)General administrative expenses (6,553)Depreciation and amortisation (1,633)Provisions 235 Operating expenses (14,397) Impairment losses (960)Share of profit of associates 181 Profit before tax 12,638 Income tax expense (2,699) Profit for the year 9,939 Attributable to: Equity holders of the Bank 9,902Minority interest 37
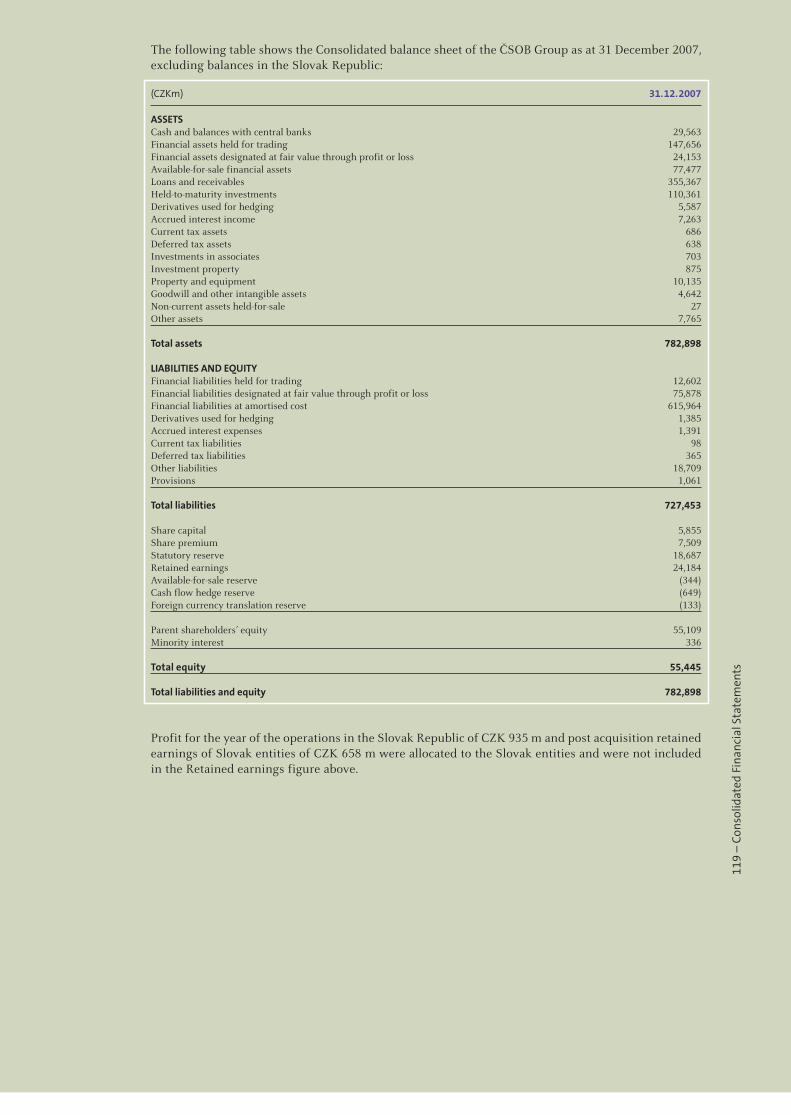
119
– C
onso
lidat
ed F
inan
cial
Sta
tem
ents
The following table shows the Consolidated balance sheet of the ČSOB Group as at 31 December 2007, excluding balances in the Slovak Republic:
(CZKm) 31.12.2007
ASSETS Cash and balances with central banks 29,563Financial assets held for trading 147,656Financial assets designated at fair value through profit or loss 24,153Available-for-sale financial assets 77,477Loans and receivables 355,367Held-to-maturity investments 110,361Derivatives used for hedging 5,587Accrued interest income 7,263Current tax assets 686Deferred tax assets 638Investments in associates 703Investment property 875Property and equipment 10,135Goodwill and other intangible assets 4,642Non-current assets held-for-sale 27Other assets 7,765 Total assets 782,898 LIABILITIES AND EQUITY Financial liabilities held for trading 12,602Financial liabilities designated at fair value through profit or loss 75,878Financial liabilities at amortised cost 615,964Derivatives used for hedging 1,385Accrued interest expenses 1,391Current tax liabilities 98Deferred tax liabilities 365Other liabilities 18,709Provisions 1,061 Total liabilities 727,453 Share capital 5,855Share premium 7,509Statutory reserve 18,687Retained earnings 24,184Available-for-sale reserve (344)Cash flow hedge reserve (649)Foreign currency translation reserve (133) Parent shareholders’ equity 55,109Minority interest 336 Total equity 55,445 Total liabilities and equity 782,898
Profit for the year of the operations in the Slovak Republic of CZK 935 m and post acquisition retained earnings of Slovak entities of CZK 658 m were allocated to the Slovak entities and were not included in the Retained earnings figure above.
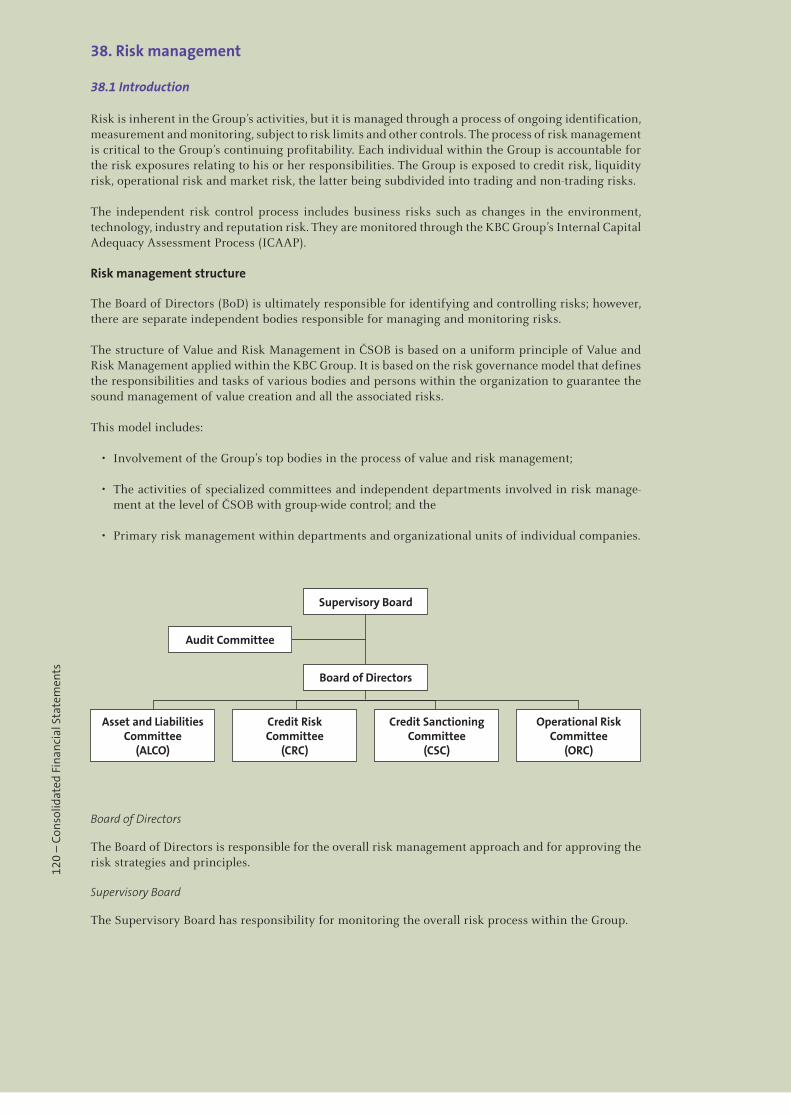
120
– C
onso
lidat
ed F
inan
cial
Sta
tem
ents
38. Risk management
38.1 Introduction
Risk is inherent in the Group’s activities, but it is managed through a process of ongoing identification, measurement and monitoring, subject to risk limits and other controls. The process of risk management is critical to the Group’s continuing profitability. Each individual within the Group is accountable for the risk exposures relating to his or her responsibilities. The Group is exposed to credit risk, liquidity risk, operational risk and market risk, the latter being subdivided into trading and non-trading risks.
The independent risk control process includes business risks such as changes in the environment, technology, industry and reputation risk. They are monitored through the KBC Group’s Internal Capital Adequacy Assessment Process (ICAAP).
Risk management structure
The Board of Directors (BoD) is ultimately responsible for identifying and controlling risks; however, there are separate independent bodies responsible for managing and monitoring risks.
The structure of Value and Risk Management in ČSOB is based on a uniform principle of Value and Risk Management applied within the KBC Group. It is based on the risk governance model that defines the responsibilities and tasks of various bodies and persons within the organization to guarantee the sound management of value creation and all the associated risks.
This model includes:
• Involvement of the Group’s top bodies in the process of value and risk management;
• The activities of specialized committees and independent departments involved in risk manage-ment at the level of ČSOB with group-wide control; and the
• Primary risk management within departments and organizational units of individual companies.
Supervisory Board
Audit Committee
Board of Directors
Asset and LiabilitiesCommittee
(ALCO)
Credit RiskCommittee
(CRC)
Credit SanctioningCommittee
(CSC)
Operational RiskCommittee
(ORC)
Board of Directors
The Board of Directors is responsible for the overall risk management approach and for approving the risk strategies and principles.
Supervisory Board
The Supervisory Board has responsibility for monitoring the overall risk process within the Group.
121
– C
onso
lidat
ed F
inan
cial
Sta
tem
ents
Risk committees
Asset and liability committee
The ALCO has overall responsibility for the development of the market and liquidity risk strategy and implementing principles, frameworks, policies and limits for the Group’s investment portfolio. It is responsible for fundamental risk issues and manages and monitors relevant risk decisions.
Credit risk committee
The CRC has overall responsibility for the development of the credit risk strategy and implementing principles, frameworks, policies and limits. It is responsible for fundamental risk issues and manages and monitors relevant risk decisions.
Credit risk sanctioning committee
The CSC is a committee entrusted with the Group-wide responsibility and authority to take decisions on (individual) credit applications falling within the delegated decision powers of the CSC. As such it acts in principle as the highest decision committee for the ČSOB Group.
Operational risk committee
The ORC has overall responsibility for the development of the operation risk strategy and imple-menting principles, frameworks, policies and limits. It is responsible for fundamental risk issues and manages and monitors relevant risk decisions.
Other bodies
Senior Executive Officers (SEO) responsible for Financial Markets and Risk Management
These two SEOs have overall responsibility for the development of the market risk strategy and imple-menting principles, frameworks, policies and limits for the trading portfolio of the Group. They are responsible for fundamental risk issues and manage and monitor relevant risk decisions.
Value and Risk Management (VRM)
The Value and Risk Management unit is responsible for implementing and maintaining risk related procedures to ensure an independent control process (except for credit risk). VRM is also responsible for monitoring compliance with risk principles, policies and limits, across the Group. VRM is respon-sible for the independent control of risks (except for credit risk), including monitoring the risk of exposures against limits and the assessment of risks of new products and structured transactions. This unit also ensures the complete capture of the risks in risk measurement and reporting systems.
Credits unit
The Credits unit is responsible for implementing and maintaining credit risk related procedures to ensure an independent control process. The Credits unit is also responsible for monitoring compliance with credit risk principles, policies and limits, across the Group.
The Credits unit is responsible for the independent control of credit risk, including monitoring the risk of exposures against limits and the assessment of risks of new products and structured transactions. This unit also ensures the complete capture of the risks in risk measurement and reporting systems.
Asset and liability management unit (ALM)
The Group’s ALM unit is responsible for managing assets and liabilities of the Group’s investment portfolio. It is also primarily responsible for the funding and liquidity risks of the Group.
Financial Markets unit (FM)
The Group’s FM unit is responsible for managing assets and liabilities of the Group’s trading portfolio
122
– C
onso
lidat
ed F
inan
cial
Sta
tem
ents
Internal audit
Risk management processes throughout the Group are audited annually by the Internal Audit function, that examines both the adequacy of the procedures and the Group’s compliance with the procedures. Internal Audit discusses the results of all assessments with the management, and reports its findings and recommendations to the Audit Committee.
Risk measurement and reporting systems
The Group’s risks are measured using a method which reflects both the expected loss likely to arise in normal circumstances and unexpected losses, which are an estimate of the ultimate actual loss based on statistical models. The models make use of probabilities derived from historical experience, adjusted to reflect the economic environment. The Group also runs worse case scenarios that would arise when extreme events that are unlikely to occur do, in fact, occur.
Monitoring and controlling risks is primarily performed based on limits established by the Group. These limits reflect the business strategy and market environment of the Group as well as the level of risk that the Group is willing to accept, with additional emphasis on selected industries. In addition, the Group monitors and measures the overall risk bearing capacity in relation to the aggregate risk exposure across all risk types and activities.
Information compiled from all businesses is examined and processed in order to analyse, control and identify risks when they arise. This information is presented and explained to the Board of Directors, the ALCO, and the CRC. The reports include aggregate credit exposure, credit metric forecasts, hold limit exceptions, Value at Risk (VaR), interest rate sensitivities, interest rate gaps, liquidity ratios and risk profile changes. Once a quarter, the Supervisory Board receives a comprehensive risk report designed to provide all information necessary to assess and conclude on the risks of the Group.
A daily report is given to the senior management and all other relevant members of the Group on the use of market limits and analysis of VaR in trading book. A weekly report is given to the senior management and all other relevant members on interest rate sensitivities and liquidity in the non-trading book.
Risk mitigation
As part of its overall risk management, the Group uses derivatives and other instruments to manage exposures resulting from changes in interest rates, foreign currencies, equity risks, credit risks, and exposures arising from forecast transactions.
The risk profile is assessed before entering into hedge transactions, that are authorised by the appro-priate level of seniority within the Group. The effectiveness of hedges is assessed by the Middle Office (based on economic considerations rather than the IFRS hedge accounting criteria). The effectiveness of all hedge relationships is monitored by the unit quarterly. In situations of ineffectiveness, the Group will enter into a new hedge relationship to mitigate risk on a continuous basis.
Excessive risk concentration
Concentrations arise when a number of counterparties are engaged in similar business activities, or activities in the same geographic region, or have similar economic features that would cause their ability to meet contractual obligations to be similarly affected by changes in economic, political or other conditions. Concentrations indicate the relative sensitivity of the Group’s performance to devel-opments affecting a particular industry or geographical location.
In order to avoid excessive concentrations of risk, the Group’s policies and procedures include specific guidelines to focus on maintaining a diversified portfolio. Identified concentrations of credit risks are controlled and managed accordingly. Selective hedging is used within the Group to manage risk concentrations at both the relationship and industry levels.
Basel II
The new rules according the Basel Committee on Banking Supervision (Basel II) came into force in the Czech Republic in the middle of 2007. The new banking law significantly changed the requirements for risk management and added other options for the calculation of capital requirements. Among others, the Group implemented the Internal Rating Based Foundation (IRBF) approach during 2007. From that moment on the Group calculates its regulatory capital requirements for credit risk using this approach. Credit risk regulatory capital requirements for the previous year (2006) are reported according to Basel I (Standard method). As a consequence the figures for the credit risk requirements are not fully comparable for the years 2007 and 2006.
123
– C
onso
lidat
ed F
inan
cial
Sta
tem
ents
38.2 Credit risk
Credit risk is a potential shortfall relative to the value expected as a consequence of the non-payment or non-performance by an obligor (a borrower, guarantor, counterparty to an inter-professional trans-action, or issuer of a debt instrument), due to that party’s insolvency or lack of willingness to pay, or to events or measures taken by the political or monetary authorities of a particular country. The latter is also referred to as ‘country risk’.
The Group manages and controls credit risk by setting limits on the amount of risk it is willing to accept for individual counterparties and for geographical and industry concentrations, The Group monitors exposures in relation to these limits.
The Group has established a credit quality review process to provide early identification of possi-ble changes in the creditworthiness of counterparties. This includes regular collateral revisions. Counterparty limits are established by the use of a credit risk classification system, which assigns each counterparty a risk rating (Probability of Default, PD rating). Risk ratings are subject to regular revision. The credit quality review process allows the Group to assess the potential loss as a result of the risks to which it is exposed and to take corrective action.
Corporate and large SME credits
The Group has developed and implemented internal rating models / tools within credit process for Corporates, SMEs, municipalities, housing cooperatives and other clients. The models were built in compliance with Basel II regulations, that allow using their output (Probability of Default) for capital adequacy calculations. The non-retail models produce rating grades on a unified KBC “PD master scale”. Rating grades 1-9 are used for non-default/normal clients while rating grades 10-12 are used for clients in default. Each rating grade is associated with a predefined range of probability of default (e.g. a client carrying PD rating 3 has a probability of default between 0.20% - 0.40%). Clients with PD rating 8, 9 are considered as “weak normal” and the management of such files is monitored by the Bad Debts unit.
Validation of the model is performed by an independent person from the Value and Risk Management unit and finally approved by the KBC Group Model Committee. The whole “model lifecycle” is defined in the KBC Model Management Framework unified for the KBC Group.
The Group expects to further improve predictive power of the models in line with increasing number of available data.
The Group applies models developed by the KBC Group to assess the quality of sovereign and banking counterparts. These models are validated in KBC as well.
Acceptance Process
The acceptance process for Corporate and large SME clients is organized in three steps. First, the relationship manager of the introducing entity prepares a written credit proposal. In a second step, an advisor independent of the business line (i.e. reporting to Credits) screens the proposal and prepares a recommendation. Credit files that carry only limited expected loss can be approved by a Head of a Corporate Branch. Finally, a decision is made at the appropriate decision-making level (committee). The “four eyes” principle is always respected. The decision always includes an approved counterparty rating.
The newly created rating models that assign to each client a specific probability of default enable determining the level of potential risk and adapt the acceptance process accordingly. Thus, the Group can modify the acceptance authority, follow a simpler framework in cases with lower risk, adjust price policy, set more precisely monitoring rules, implement advanced risk control based on the portfolio system, etc. The new rating models were integrated into specialized rating tools, that can be used also for pricing purposes.
Retail and small SME credits
The Group has implemented the Internal Rating Based (IRB) approach to calculate a capital require-ment. This includes the development of scorecards for retail portfolios within the Group, estimates of key parameters such as PD, Exposure at Default (EAD) and Loss Given Default (LGD) within defined homogenous sets of exposures (so called pools) and a process of regular recalculation, validation and monitoring. Basel II scorecards are used in the application process so that they influence the incoming population. All models have to follow standards maintained within the KBC Group via the Model management framework and have to be approved by local the Credit Risk committee and the Group Model committee.
124
– C
onso
lidat
ed F
inan
cial
Sta
tem
ents
Acceptance process
The retail acceptance process is based on a number of internally developed scorecards and uses access to external data sources (Credit Bureaus) that bring additional information about a client’s risk profile. Each application process runs on an in-house developed scorecard. These decision support tools allow complex control over the newly accepted risks. Scorecards are typically based on both socio-demographic and behavioural data. The acceptance process also covers pre-approved limits for existing clients.
Portfolio risk management
Several loss-predicting models are used to manage the risk of the major retail credit portfolios. Regular back testing of those models shows high precision of the predicted development. The use of these modelling techniques and the implemented scorecards together with management techniques signifi-cantly reduces the credit risk taken within retail portfolios, although the acceptance rate has been kept almost the same.
Derivative financial instruments
Credit risk arising from derivative financial instruments is, at any time, limited to those with positive fair values, as recorded in the balance sheet.
Credit-related commitments risk
The Group grants its customers guarantees that may require that the Group make payments on their behalf. Such payments are collected from customers based on the terms of a letter of credit. They expose the Group to similar risks to loans and are mitigated by the same control processes and policies.
The table below shows the maximum exposure to credit risk for the components of the balance sheet. The maximum exposure is shown gross without taking account of any collateral and other credit enhancements.
(CZKm) Note 2007 2006
Cash and balances with central banks 15 24,448 24,088Financial assets held for trading 16 224,488 149,647Financial assets designated at fair value through profit or loss 16 24,153 23,880Available-for-sale financial assets 17 75,956 66,166Loans and receivables 18 411,129 340,279Held-to-maturity investments 17 114,089 108,772Derivatives used for hedging 20 5,587 5,124Accrued interest income 21 7,641 6,574Other assets 25 7,435 8,102 Total 894,926 732,632 Contingent liabilities 34 32,206 25,120Commitments 34 114,336 118,248 Total 146,542 143,368 Total credit risk exposure 1,041,468 876,000
Where financial instruments are recorded at fair value the amounts shown above represent the current credit risk exposure but not the maximum risk exposure that could arise in the future as a result of changes in values.
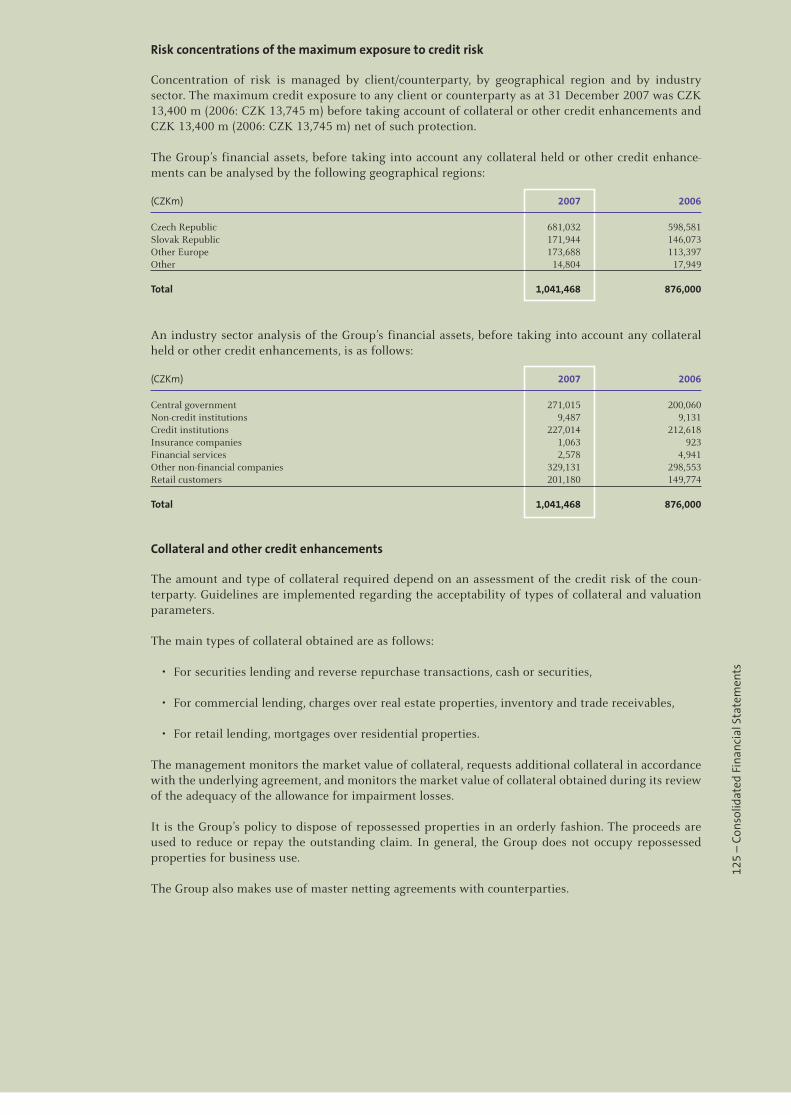
125
– C
onso
lidat
ed F
inan
cial
Sta
tem
ents
Risk concentrations of the maximum exposure to credit risk
Concentration of risk is managed by client/counterparty, by geographical region and by industry sector. The maximum credit exposure to any client or counterparty as at 31 December 2007 was CZK 13,400 m (2006: CZK 13,745 m) before taking account of collateral or other credit enhancements and CZK 13,400 m (2006: CZK 13,745 m) net of such protection.
The Group’s financial assets, before taking into account any collateral held or other credit enhance-ments can be analysed by the following geographical regions:
(CZKm) 2007 2006
Czech Republic 681,032 598,581Slovak Republic 171,944 146,073Other Europe 173,688 113,397Other 14,804 17,949 Total 1,041,468 876,000
An industry sector analysis of the Group’s financial assets, before taking into account any collateral held or other credit enhancements, is as follows:
(CZKm) 2007 2006
Central government 271,015 200,060Non-credit institutions 9,487 9,131Credit institutions 227,014 212,618Insurance companies 1,063 923Financial services 2,578 4,941Other non-financial companies 329,131 298,553Retail customers 201,180 149,774 Total 1,041,468 876,000
Collateral and other credit enhancements
The amount and type of collateral required depend on an assessment of the credit risk of the coun-terparty. Guidelines are implemented regarding the acceptability of types of collateral and valuation parameters.
The main types of collateral obtained are as follows:
• For securities lending and reverse repurchase transactions, cash or securities,
• For commercial lending, charges over real estate properties, inventory and trade receivables,
• For retail lending, mortgages over residential properties.
The management monitors the market value of collateral, requests additional collateral in accordance with the underlying agreement, and monitors the market value of collateral obtained during its review of the adequacy of the allowance for impairment losses.
It is the Group’s policy to dispose of repossessed properties in an orderly fashion. The proceeds are used to reduce or repay the outstanding claim. In general, the Group does not occupy repossessed properties for business use.
The Group also makes use of master netting agreements with counterparties.
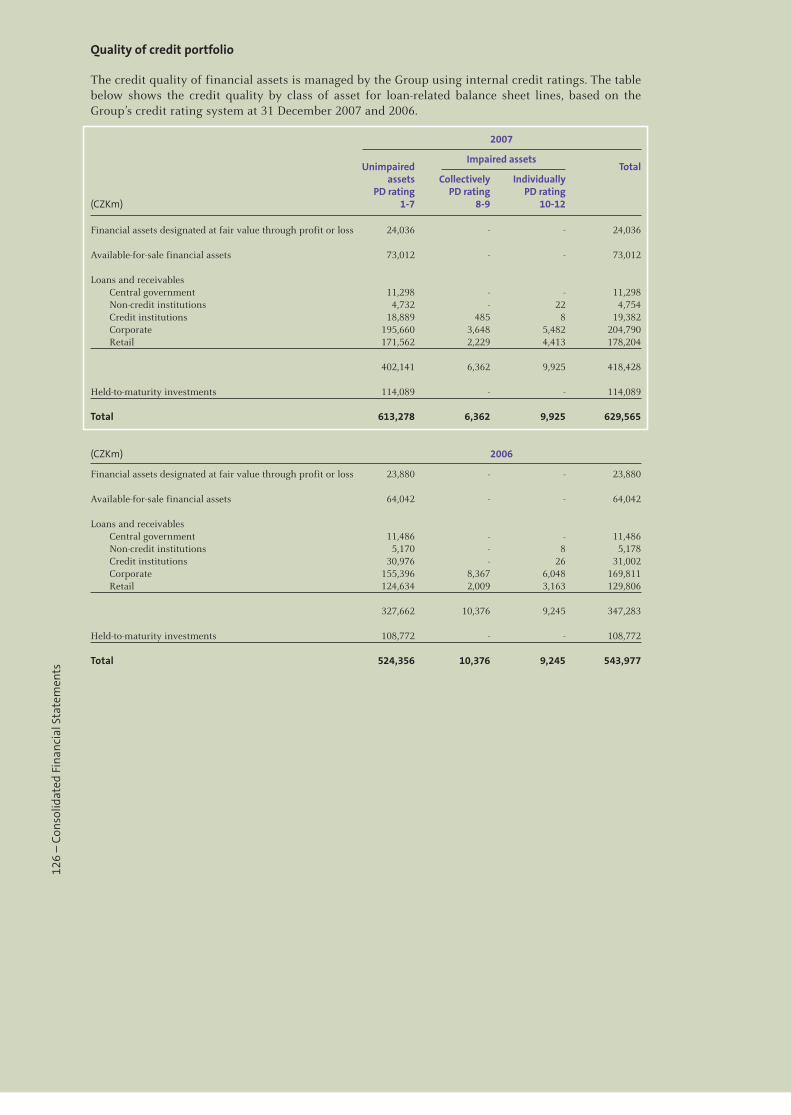
126
– C
onso
lidat
ed F
inan
cial
Sta
tem
ents
Quality of credit portfolio
The credit quality of financial assets is managed by the Group using internal credit ratings. The table below shows the credit quality by class of asset for loan-related balance sheet lines, based on the Group’s credit rating system at 31 December 2007 and 2006.
2007
Unimpaired
Impaired assets Total
assets Collectively Individually PD rating PD rating PD rating(CZKm) 1-7 8-9 10-12
Financial assets designated at fair value through profit or loss 24,036 - - 24,036 Available-for-sale financial assets 73,012 - - 73,012 Loans and receivables Central government 11,298 - - 11,298 Non-credit institutions 4,732 - 22 4,754 Credit institutions 18,889 485 8 19,382 Corporate 195,660 3,648 5,482 204,790 Retail 171,562 2,229 4,413 178,204 402,141 6,362 9,925 418,428 Held-to-maturity investments 114,089 - - 114,089 Total 613,278 6,362 9,925 629,565 (CZKm) 2006
Financial assets designated at fair value through profit or loss 23,880 - - 23,880 Available-for-sale financial assets 64,042 - - 64,042 Loans and receivables Central government 11,486 - - 11,486 Non-credit institutions 5,170 - 8 5,178 Credit institutions 30,976 - 26 31,002 Corporate 155,396 8,367 6,048 169,811 Retail 124,634 2,009 3,163 129,806 327,662 10,376 9,245 347,283 Held-to-maturity investments 108,772 - - 108,772 Total 524,356 10,376 9,245 543,977
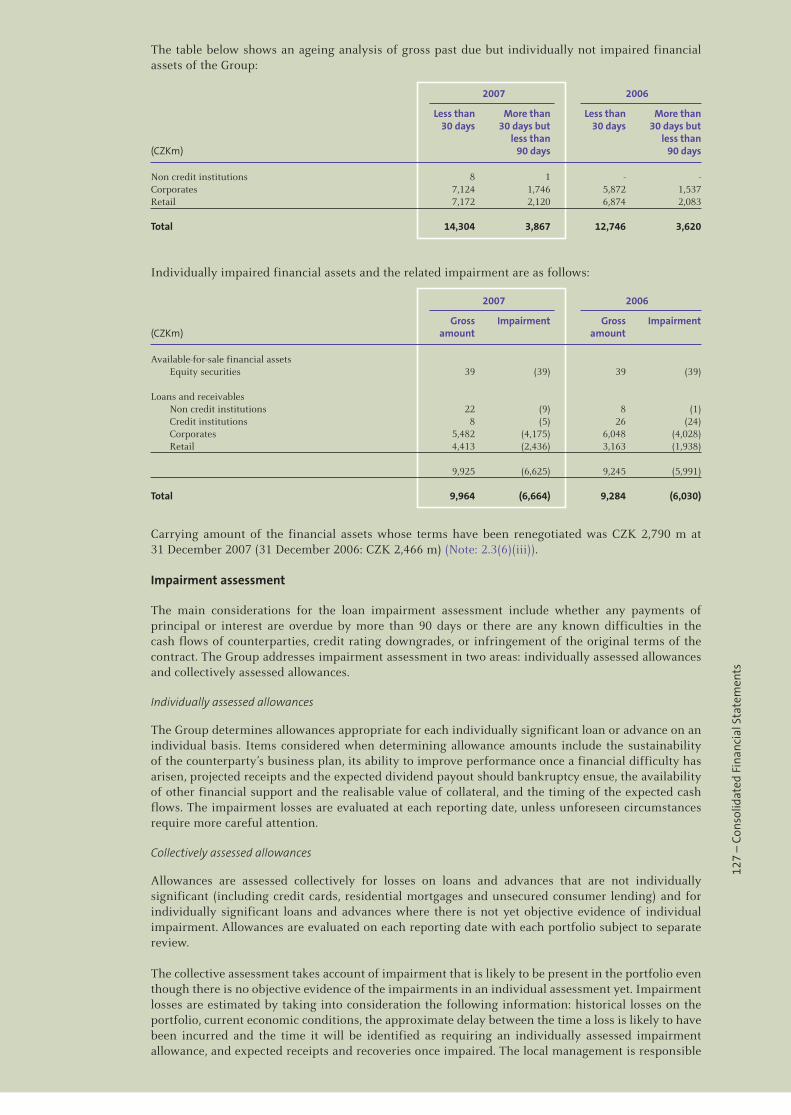
127
– C
onso
lidat
ed F
inan
cial
Sta
tem
ents
The table below shows an ageing analysis of gross past due but individually not impaired financial assets of the Group:
2007 2006
Less than More than Less than More than 30 days 30 days but 30 days 30 days but less than less than(CZKm) 90 days 90 days
Non credit institutions 8 1 - -Corporates 7,124 1,746 5,872 1,537Retail 7,172 2,120 6,874 2,083 Total 14,304 3,867 12,746 3,620
Individually impaired financial assets and the related impairment are as follows:
2007 2006
Gross Impairment Gross Impairment(CZKm) amount amount
Available-for-sale financial assets Equity securities 39 (39) 39 (39) Loans and receivables Non credit institutions 22 (9) 8 (1) Credit institutions 8 (5) 26 (24) Corporates 5,482 (4,175) 6,048 (4,028) Retail 4,413 (2,436) 3,163 (1,938) 9,925 (6,625) 9,245 (5,991) Total 9,964 (6,664) 9,284 (6,030)
Carrying amount of the financial assets whose terms have been renegotiated was CZK 2,790 m at 31 December 2007 (31 December 2006: CZK 2,466 m) (Note: 2.3(6)(iii)).
Impairment assessment
The main considerations for the loan impairment assessment include whether any payments of principal or interest are overdue by more than 90 days or there are any known difficulties in the cash flows of counterparties, credit rating downgrades, or infringement of the original terms of the contract. The Group addresses impairment assessment in two areas: individually assessed allowances and collectively assessed allowances.
Individually assessed allowances
The Group determines allowances appropriate for each individually significant loan or advance on an individual basis. Items considered when determining allowance amounts include the sustainability of the counterparty’s business plan, its ability to improve performance once a financial difficulty has arisen, projected receipts and the expected dividend payout should bankruptcy ensue, the availability of other financial support and the realisable value of collateral, and the timing of the expected cash flows. The impairment losses are evaluated at each reporting date, unless unforeseen circumstances require more careful attention.
Collectively assessed allowances
Allowances are assessed collectively for losses on loans and advances that are not individually significant (including credit cards, residential mortgages and unsecured consumer lending) and for individually significant loans and advances where there is not yet objective evidence of individual impairment. Allowances are evaluated on each reporting date with each portfolio subject to separate review.
The collective assessment takes account of impairment that is likely to be present in the portfolio even though there is no objective evidence of the impairments in an individual assessment yet. Impairment losses are estimated by taking into consideration the following information: historical losses on the portfolio, current economic conditions, the approximate delay between the time a loss is likely to have been incurred and the time it will be identified as requiring an individually assessed impairment allowance, and expected receipts and recoveries once impaired. The local management is responsible

128
– C
onso
lidat
ed F
inan
cial
Sta
tem
ents
for deciding the length of this period that can extend for as long as one year. The impairment allow-ance is then reviewed by the credit management to ensure alignment with the Group’s overall policy.
Financial guarantees and letters of credit are assessed and provision made in a similar manner as for loans.
38.3 Liquidity risk and funding management
Liquidity risk is the risk that the Group will not be able to efficiently meet both expected and unex-pected current and future cash flows and collateral needs without normal business operations being disrupted. To limit this risk, the management has arranged diversified funding sources in addition to its core deposit base, manages assets with liquidity in mind, and monitors future cash flows and liquidity on a daily basis. This incorporates an assessment of expected cash flows and the availability of high grade collateral that could be used to secure additional funding if required.
The Group maintains a portfolio of highly marketable and diverse assets that can be easily liquidated in the event of an unforeseen interruption of cash flow. In addition, the Group maintains a statutory deposit with the CNB equal to 2% of customer deposits. The liquidity position is assessed and managed under a variety of scenarios, giving due consideration to stress factors relating to both the market in general and specifically to the Group. The most important of these is to maintain limits on the Stock liquidity ratio (SLR). This is the ratio of a Group’s liquid assets (cash, short-term Group’s deposits and securities available for immediate sale) and its short term liabilities (cash outflow within 7 days, above CZK 10 m term deposits due to mature within 7 days, 5% of non-term deposits and term deposits due to mature within 7 days, 10% of credit commitments).
The ratio during the year was as follows:
(%) 2007 2006
31 December 220 503Average during the period 255 561Highest 521 1,028Lowest 191 285
Analysis of financial liabilities by remaining contractual maturity
The tables below summarise the contractual maturity profile of the Group’s financial liabilities based on the contractual undiscounted repayment obligations.
The following table sets out the financial liabilities of the Group by remaining contractual maturity as at 31 December 2007:
Less than 1 year to More than Without Total(CZKm) 1 year 5 years 5 years maturity
FINANCIAL LIABILITIES Financial liabilities held for trading 1,449 470 25 14,041 15,985Financial liabilities designated at fair value through profit or loss 141,085 4,630 50 24 145,789Financial liabilities at amortised cost 584,357 41,489 41,343 14,693 681,882 Total carrying value 726,891 46,589 41,418 28,758 843,656
The following table sets out the financial liabilities of the Group by remaining contractual maturity as at 31 December 2006:
Less than 1 year to More than Without Total(CZKm) 1 year 5 years 5 years maturity
FINANCIAL LIABILITIES Financial liabilities held for trading 3 752 1,003 12,200 13,958Financial liabilities designated at fair value through profit or loss 83,011 893 50 209 84,163Financial liabilities at amortised cost 477,572 60,770 40,896 7,617 586,855 Total carrying value 560,586 62,415 41,949 20,026 684,976

129
– C
onso
lidat
ed F
inan
cial
Sta
tem
ents
38.4 Market risk
Market risk is the risk that the fair value or future cash flows of financial instruments will fluctuate due to changes in market variables such as interest rates, foreign exchange rates, and equity prices. The Group classifies exposures to market risk into either trading or non-trading portfolios. The market risk for the trading portfolio is managed and monitored based on a historic VaR methodology that reflects the interdependency between risk variables. The secondary measure for risk management is Basic Point Value (BPV) sensitivity. Non-trading positions are managed and monitored using BPV sensitivity analyses. Except for the concentrations within foreign currency, the Group has no signifi-cant concentration of market risk.
Market risk – Trading (including financial assets and financial liabilities designated at fair value through profit or loss)
The BoD has set limits on the level of risk that may be accepted. The Group applies a VaR methodology to assess the market risk positions held and to estimate potential economic loss based upon assump-tions for various changes in market conditions. VaR is a method used to measure financial risk by estimating a potential negative change in the market value of a portfolio at a given confidence level and over a specified time horizon. The Group uses a full linear VaR model for interest rate and foreign exchange rates risk. These calculations are based on historic scenarios derived from a two-year history. The Group has neither any significant position in equity nor FX options. A small nominal technical limit is set for interest rate options; the position in this product, however, is not material.
Standard VAR calculations are supplemented with a sophisticated system of stress tests. They consist of examples of extreme, but plausible events on the financial markets to test their impact on the market value of positions currently held by the Group. The Group analyses scenarios, dependent and independent of the Group’s position. Also, real historical scenarios are evaluated on a regular basis.
To enhance the system of risk management, the Group also uses other methods of risk monitoring, such as interest rate sensitivity BPV, and stop-loss limits.
Objectives and limitations of the VaR methodology
The Group uses the historical VaR methodology to measure and monitor interest rate and foreign exchange risks in the trading book observing the relevant Basel II standards. The accuracy of estimated results is verified through back-testing.
VaR assumptions
When measuring risks, the Group applies VaR assumptions to estimate potential loss at a 99% confi-dence level that is not expected to be exceeded if the current market risk positions were to be held unchanged for 10 days. The use of a 99% confidence level means that, within a ten-day horizon, losses exceeding the VaR figure should occur, on average, not more than once every 100 days. The Group uses historical daily changes in market variables to assess possible changes in the market value of the trading portfolio based on historical data from the past 500 days.
Since VaR is an integral part of the Group’s market risk management, VaR limits have been established for all trading operations and exposures are reviewed daily against the limits by the management.
The Group received regulatory approval to use an internal VaR model for calculating of capital require-ments for interest rate and foreign exchange risks in June 2007.
Interest Foreign Effect of Global VaR(CZKm) rate exchange correlation total
31 December 2007 176 24 (27) 173Average during the period 159 10 (10) 159Highest 228 36 (36) 228Lowest 68 1 - 69
Daily losses were never greater than the 1 day VaR in 2007.
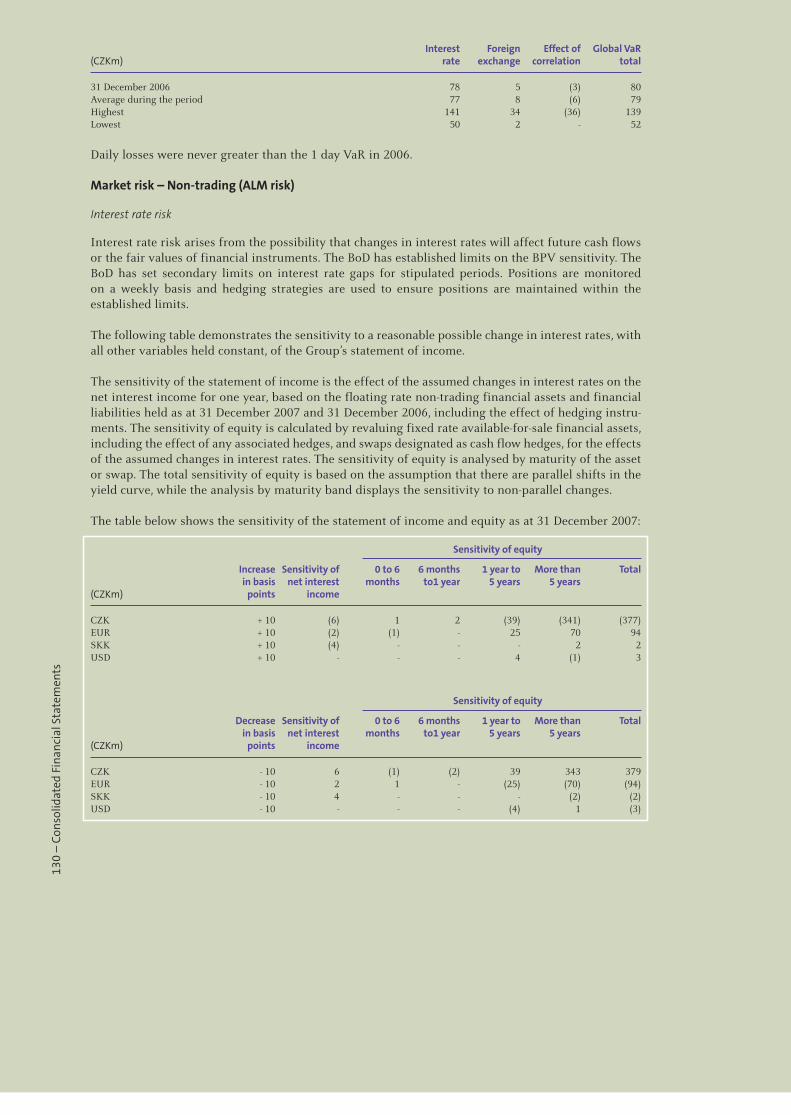
130
– C
onso
lidat
ed F
inan
cial
Sta
tem
ents
Interest Foreign Effect of Global VaR(CZKm) rate exchange correlation total
31 December 2006 78 5 (3) 80Average during the period 77 8 (6) 79Highest 141 34 (36) 139Lowest 50 2 - 52
Daily losses were never greater than the 1 day VaR in 2006.
Market risk – Non-trading (ALM risk)
Interest rate risk
Interest rate risk arises from the possibility that changes in interest rates will affect future cash flows or the fair values of financial instruments. The BoD has established limits on the BPV sensitivity. The BoD has set secondary limits on interest rate gaps for stipulated periods. Positions are monitored on a weekly basis and hedging strategies are used to ensure positions are maintained within the established limits.
The following table demonstrates the sensitivity to a reasonable possible change in interest rates, with all other variables held constant, of the Group’s statement of income.
The sensitivity of the statement of income is the effect of the assumed changes in interest rates on the net interest income for one year, based on the floating rate non-trading financial assets and financial liabilities held as at 31 December 2007 and 31 December 2006, including the effect of hedging instru-ments. The sensitivity of equity is calculated by revaluing fixed rate available-for-sale financial assets, including the effect of any associated hedges, and swaps designated as cash flow hedges, for the effects of the assumed changes in interest rates. The sensitivity of equity is analysed by maturity of the asset or swap. The total sensitivity of equity is based on the assumption that there are parallel shifts in the yield curve, while the analysis by maturity band displays the sensitivity to non-parallel changes.
The table below shows the sensitivity of the statement of income and equity as at 31 December 2007:
Sensitivity of equity
Increase Sensitivity of 0 to 6 6 months 1 year to More than Total in basis net interest months to1 year 5 years 5 years(CZKm) points income
CZK + 10 (6) 1 2 (39) (341) (377)EUR + 10 (2) (1) - 25 70 94SKK + 10 (4) - - - 2 2USD + 10 - - - 4 (1) 3
Sensitivity of equity
Decrease Sensitivity of 0 to 6 6 months 1 year to More than Total in basis net interest months to1 year 5 years 5 years (CZKm) points income
CZK - 10 6 (1) (2) 39 343 379EUR - 10 2 1 - (25) (70) (94)SKK - 10 4 - - - (2) (2)USD - 10 - - - (4) 1 (3)
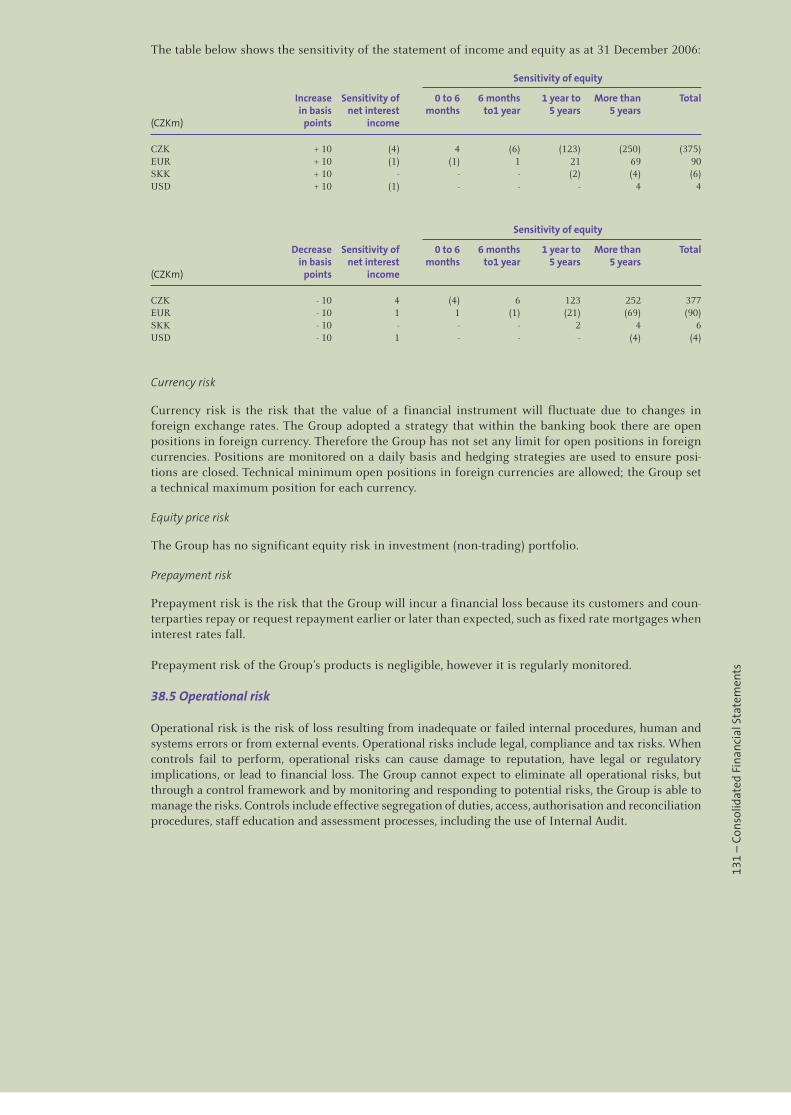
131
– C
onso
lidat
ed F
inan
cial
Sta
tem
ents
The table below shows the sensitivity of the statement of income and equity as at 31 December 2006:
Sensitivity of equity
Increase Sensitivity of 0 to 6 6 months 1 year to More than Total in basis net interest months to1 year 5 years 5 years (CZKm) points income
CZK + 10 (4) 4 (6) (123) (250) (375)EUR + 10 (1) (1) 1 21 69 90SKK + 10 - - - (2) (4) (6)USD + 10 (1) - - - 4 4
Sensitivity of equity
Decrease Sensitivity of 0 to 6 6 months 1 year to More than Total in basis net interest months to1 year 5 years 5 years (CZKm) points income
CZK - 10 4 (4) 6 123 252 377EUR - 10 1 1 (1) (21) (69) (90)SKK - 10 - - - 2 4 6USD - 10 1 - - - (4) (4)
Currency risk
Currency risk is the risk that the value of a financial instrument will fluctuate due to changes in foreign exchange rates. The Group adopted a strategy that within the banking book there are open positions in foreign currency. Therefore the Group has not set any limit for open positions in foreign currencies. Positions are monitored on a daily basis and hedging strategies are used to ensure posi-tions are closed. Technical minimum open positions in foreign currencies are allowed; the Group set a technical maximum position for each currency.
Equity price risk
The Group has no significant equity risk in investment (non-trading) portfolio.
Prepayment risk
Prepayment risk is the risk that the Group will incur a financial loss because its customers and coun-terparties repay or request repayment earlier or later than expected, such as fixed rate mortgages when interest rates fall.
Prepayment risk of the Group’s products is negligible, however it is regularly monitored.
38.5 Operational risk
Operational risk is the risk of loss resulting from inadequate or failed internal procedures, human and systems errors or from external events. Operational risks include legal, compliance and tax risks. When controls fail to perform, operational risks can cause damage to reputation, have legal or regulatory implications, or lead to financial loss. The Group cannot expect to eliminate all operational risks, but through a control framework and by monitoring and responding to potential risks, the Group is able to manage the risks. Controls include effective segregation of duties, access, authorisation and reconciliation procedures, staff education and assessment processes, including the use of Internal Audit.
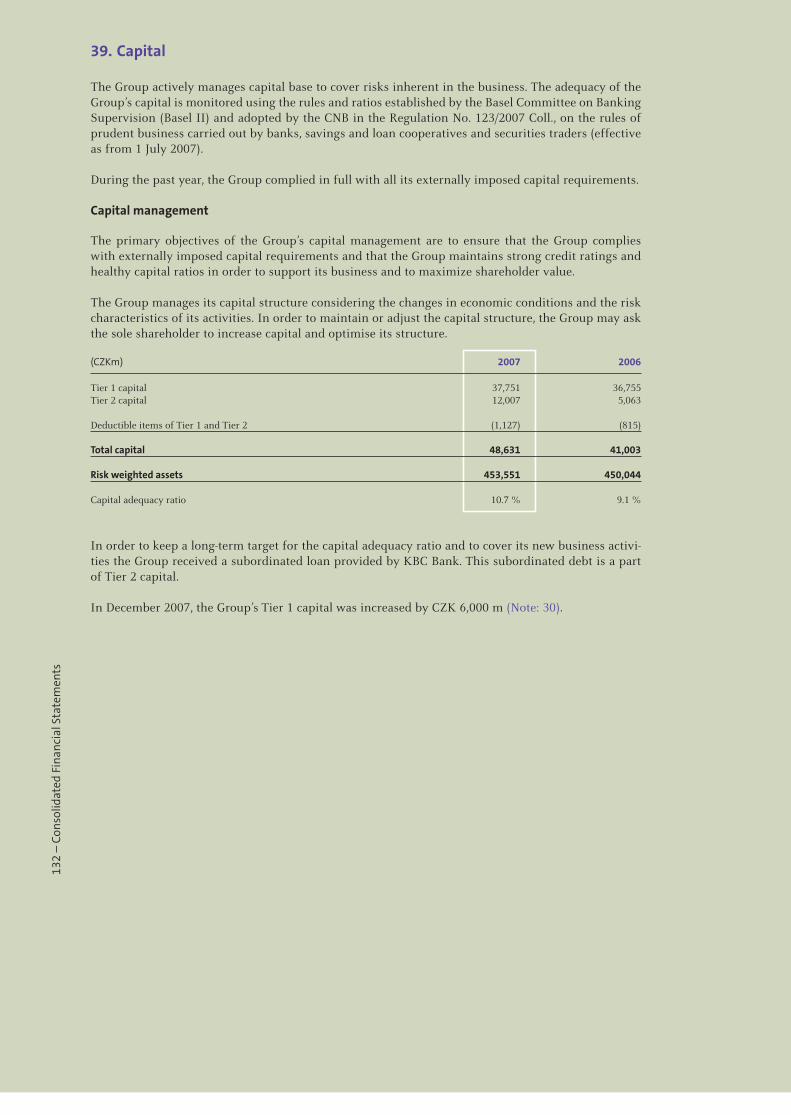
132
– C
onso
lidat
ed F
inan
cial
Sta
tem
ents
39. Capital
The Group actively manages capital base to cover risks inherent in the business. The adequacy of the Group’s capital is monitored using the rules and ratios established by the Basel Committee on Banking Supervision (Basel II) and adopted by the CNB in the Regulation No. 123/2007 Coll., on the rules of prudent business carried out by banks, savings and loan cooperatives and securities traders (effective as from 1 July 2007).
During the past year, the Group complied in full with all its externally imposed capital requirements.
Capital management
The primary objectives of the Group’s capital management are to ensure that the Group complies with externally imposed capital requirements and that the Group maintains strong credit ratings and healthy capital ratios in order to support its business and to maximize shareholder value.
The Group manages its capital structure considering the changes in economic conditions and the risk characteristics of its activities. In order to maintain or adjust the capital structure, the Group may ask the sole shareholder to increase capital and optimise its structure.
(CZKm) 2007 2006
Tier 1 capital 37,751 36,755Tier 2 capital 12,007 5,063 Deductible items of Tier 1 and Tier 2 (1,127) (815) Total capital 48,631 41,003 Risk weighted assets 453,551 450,044 Capital adequacy ratio 10.7 % 9.1 %
In order to keep a long-term target for the capital adequacy ratio and to cover its new business activi-ties the Group received a subordinated loan provided by KBC Bank. This subordinated debt is a part of Tier 2 capital.
In December 2007, the Group’s Tier 1 capital was increased by CZK 6,000 m (Note: 30).

133
– C
onso
lidat
ed F
inan
cial
Sta
tem
ents


135
– C
onso
lidat
ed F
inan
cial
Sta
tem
ents
Parts of facades are adjusted for climbing plants to enhance integration in the green surroundings. This is further bolstered by interior green systems which have a psychological function but also enhance shading and zoning and improve the quality of air.

136
– S
epar
ate
Fina
ncia
l Sta
tem
ents
Auditor’s opinion on the separated financial statements
Independent Auditor’s Report to the Shareholders of Československá obchodní banka, a. s.
We have audited the accompanying fi nancial statements of Československá obchodní banka, a. s. (“the Bank”), which comprise the balance sheet as at 31 December 2007 and the income statement, statement of changes in equity and cash fl ow statement for the year then ended, and a summary of signifi cant accounting policies and other explanatory notes. For details of the Bank, see Note 1 to the fi nancial statements.
Management’s Responsibility for the Financial Statements
Management is responsible for the preparation and fair presentation of these fi nancial statements in accordance with International Financial Reporting Standards as adopted by the European Union. This responsibility includes: designing, implementing and maintaining internal control relevant to the preparation and fair presentation of fi nancial statements that are free from material misstatement, whether due to fraud or error; selecting and applying appropriate accounting policies; and making accounting estimates that are reasonable in the circumstances.
Auditor’s Responsibility
Our responsibility is to express an opinion on these fi nancial statements based on our audit. We conducted our audit in accordance with International Standards on Auditing and implementation guidance of the Chamber of Auditors of the Czech Republic. Those standards require that we comply with ethical requirements and plan and perform the audit to obtain reasonable assurance whether the fi nancial statements are free from material misstatement.
An audit involves performing procedures to obtain audit evidence about the amounts and disclosures in the fi nancial statements. The procedures selected depend on the auditor’s judgment, including the assessment of the risks of material misstatement of the fi nancial statements, whether due to fraud or error. In making those risk assessments, the auditor considers internal control relevant to the entity’s preparation and fair presentation of the fi nancial statements in order to design audit procedures that are appropriate for the circumstances, but not for the purpose of expressing an opinion on the effectiveness of the entity’s internal control. An audit also includes evaluating the appropriateness of accounting policies used and the reasonableness of accounting estimates made by management, as well as evaluating the overall presentation of the fi nancial statements.
We believe that the audit evidence we have obtained is suffi cient and appropriate to provide a basis for our audit opinion.
Opinion
In our opinion, the fi nancial statements give a true and fair view of the fi nancial position of the Bank as at 31 December 2007, and of its fi nancial performance and its cash fl ows for the year then ended in accordance with International Financial Reporting Standards as adopted by the European Union.
Ernst & Young Audit & Advisory, s.r.o., člen koncernuLicence No. 401Represented by
Douglas Burnham Roman Hauptfl eischPartner Auditor, Licence No. 2009
9 April 2008Prague, Czech Republic
A member fi rm of Ernst & Young Global LimitedErnst & Young Audit & Advisory, s.r.o., člen koncernu with its registered offi ce at Karlovo náměstí 10,120 00 Prague 2, has been incorporated in the Commercial Register administered by the Municipal Court in Prague, Section C, entry no. 88504, under Identifi cation No. 26704153.
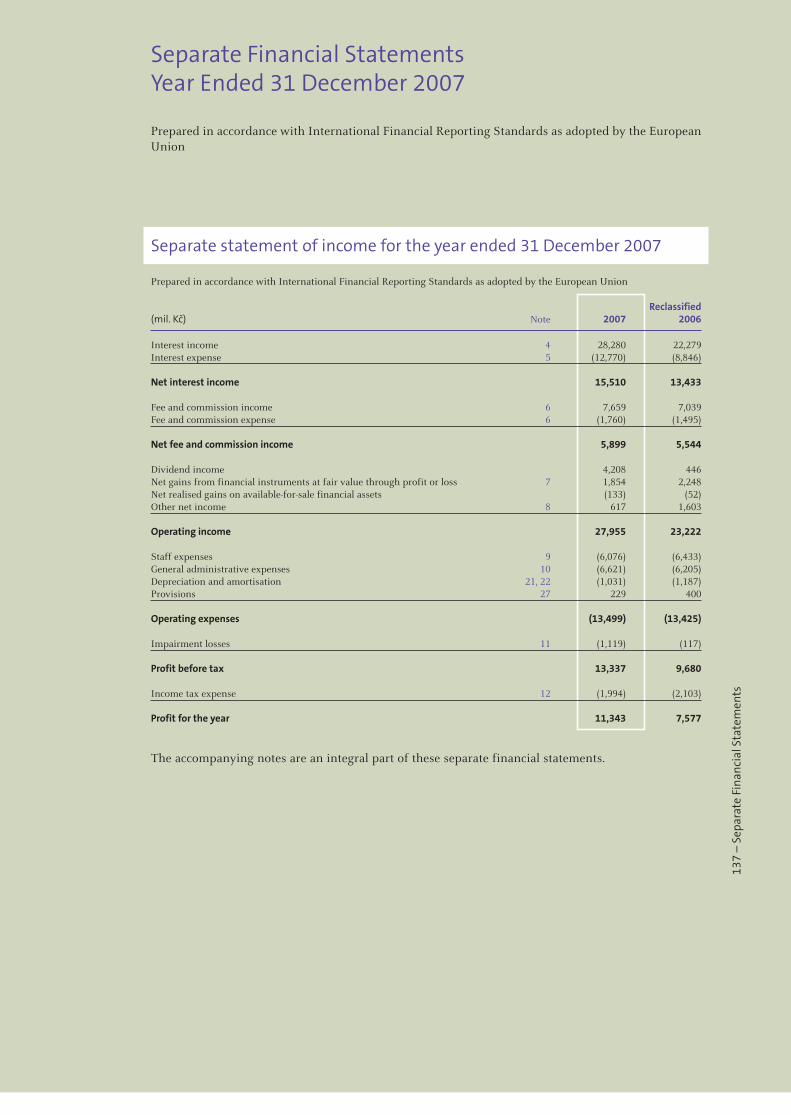
137
– S
epar
ate
Fina
ncia
l Sta
tem
ents
Separate statement of income for the year ended 31 December 2007
Prepared in accordance with International Financial Reporting Standards as adopted by the European Union
Reclassified(mil. Kč) Note 2007 2006
Interest income 4 28,280 22,279Interest expense 5 (12,770) (8,846) Net interest income 15,510 13,433 Fee and commission income 6 7,659 7,039Fee and commission expense 6 (1,760) (1,495) Net fee and commission income 5,899 5,544 Dividend income 4,208 446Net gains from financial instruments at fair value through profit or loss 7 1,854 2,248Net realised gains on available-for-sale financial assets (133) (52)Other net income 8 617 1,603 Operating income 27,955 23,222 Staff expenses 9 (6,076) (6,433)General administrative expenses 10 (6,621) (6,205)Depreciation and amortisation 21, 22 (1,031) (1,187)Provisions 27 229 400 Operating expenses (13,499) (13,425) Impairment losses 11 (1,119) (117) Profit before tax 13,337 9,680 Income tax expense 12 (1,994) (2,103) Profit for the year 11,343 7,577
The accompanying notes are an integral part of these separate financial statements.
Separate Financial StatementsYear Ended 31 December 2007
Prepared in accordance with International Financial Reporting Standards as adopted by the European Union
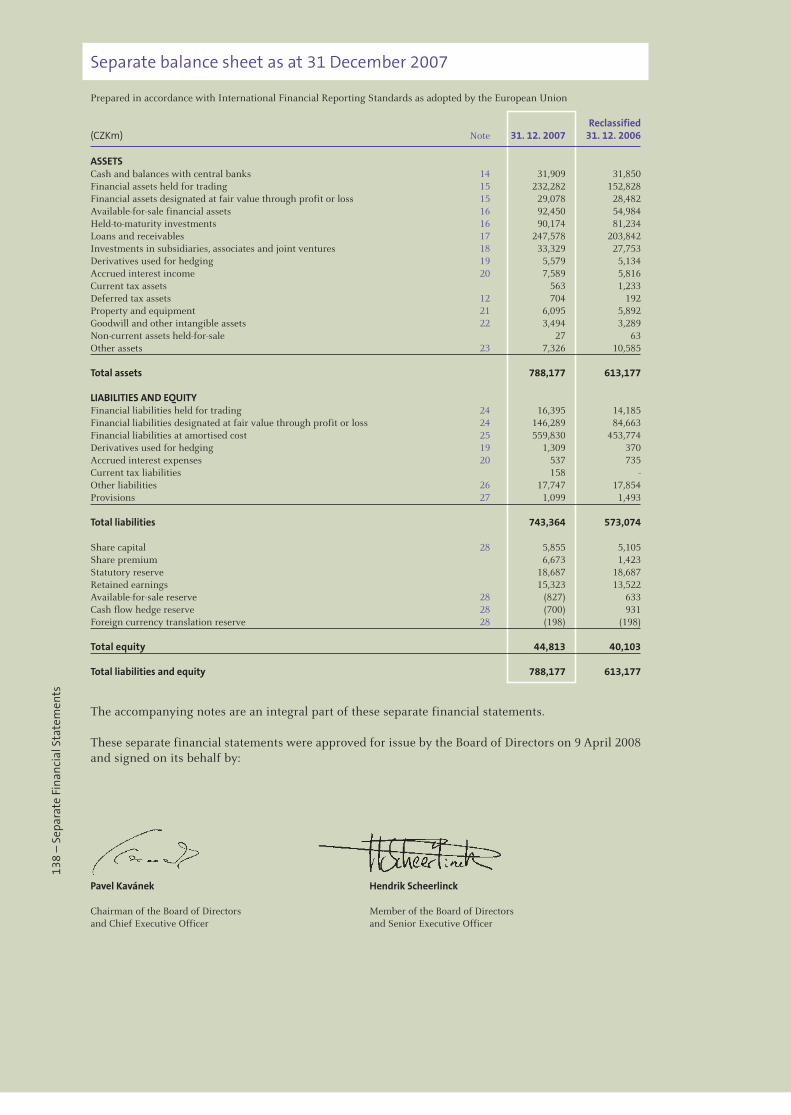
138
– S
epar
ate
Fina
ncia
l Sta
tem
ents
Separate balance sheet as at 31 December 2007
Prepared in accordance with International Financial Reporting Standards as adopted by the European Union
Reclassified(CZKm) Note 31. 12. 2007 31. 12. 2006
ASSETS Cash and balances with central banks 14 31,909 31,850Financial assets held for trading 15 232,282 152,828Financial assets designated at fair value through profit or loss 15 29,078 28,482Available-for-sale financial assets 16 92,450 54,984Held-to-maturity investments 16 90,174 81,234Loans and receivables 17 247,578 203,842Investments in subsidiaries, associates and joint ventures 18 33,329 27,753Derivatives used for hedging 19 5,579 5,134Accrued interest income 20 7,589 5,816Current tax assets 563 1,233Deferred tax assets 12 704 192Property and equipment 21 6,095 5,892Goodwill and other intangible assets 22 3,494 3,289Non-current assets held-for-sale 27 63Other assets 23 7,326 10,585 Total assets 788,177 613,177 LIABILITIES AND EQUITY Financial liabilities held for trading 24 16,395 14,185Financial liabilities designated at fair value through profit or loss 24 146,289 84,663Financial liabilities at amortised cost 25 559,830 453,774Derivatives used for hedging 19 1,309 370Accrued interest expenses 20 537 735Current tax liabilities 158 -Other liabilities 26 17,747 17,854Provisions 27 1,099 1,493 Total liabilities 743,364 573,074 Share capital 28 5,855 5,105Share premium 6,673 1,423Statutory reserve 18,687 18,687Retained earnings 15,323 13,522Available-for-sale reserve 28 (827) 633Cash flow hedge reserve 28 (700) 931Foreign currency translation reserve 28 (198) (198) Total equity 44,813 40,103 Total liabilities and equity 788,177 613,177
The accompanying notes are an integral part of these separate financial statements.
These separate financial statements were approved for issue by the Board of Directors on 9 April 2008 and signed on its behalf by:
Pavel Kavánek Hendrik Scheerlinck
Chairman of the Board of Directors Member of the Board of Directorsand Chief Executive Officer and Senior Executive Officer
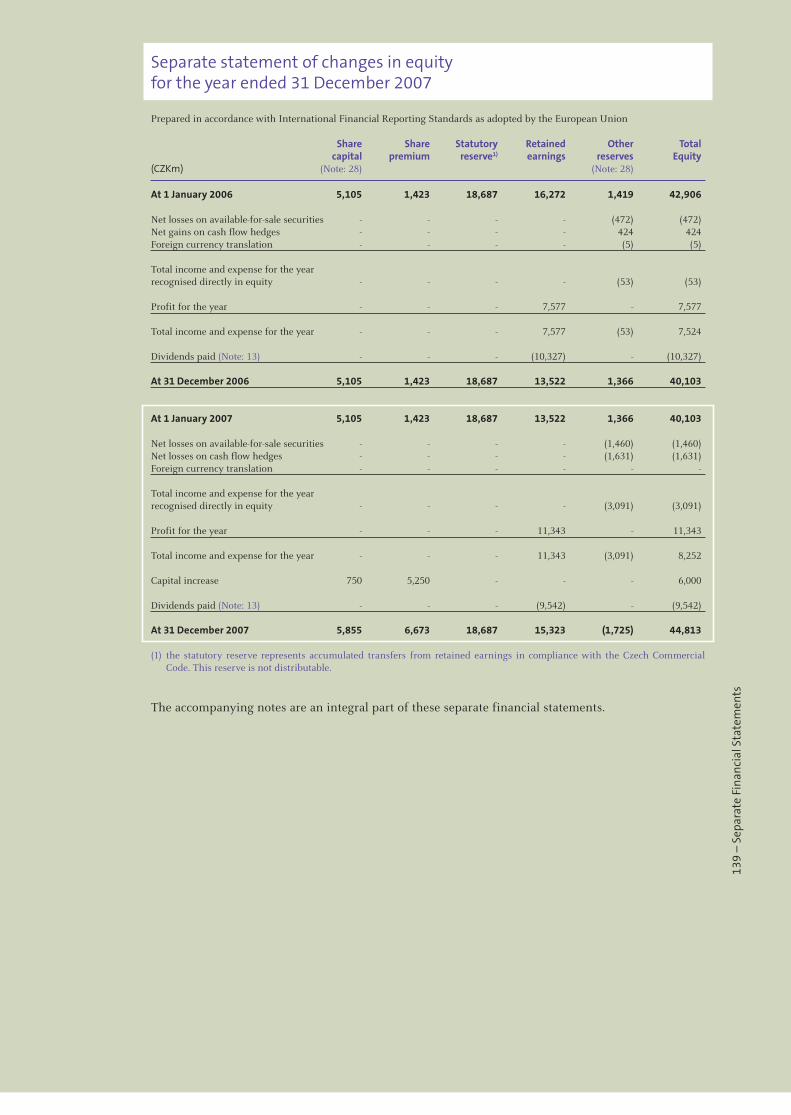
139
– S
epar
ate
Fina
ncia
l Sta
tem
ents
Separate statement of changes in equity for the year ended 31 December 2007
Prepared in accordance with International Financial Reporting Standards as adopted by the European Union
Share Share Statutory Retained Other Total capital premium reserve1) earnings reserves Equity(CZKm) (Note: 28) (Note: 28)
At 1 January 2006 5,105 1,423 18,687 16,272 1,419 42,906 Net losses on available-for-sale securities - - - - (472) (472)Net gains on cash flow hedges - - - - 424 424Foreign currency translation - - - - (5) (5)
Total income and expense for the year recognised directly in equity - - - - (53) (53) Profit for the year - - - 7,577 - 7,577 Total income and expense for the year - - - 7,577 (53) 7,524 Dividends paid (Note: 13) - - - (10,327) - (10,327) At 31 December 2006 5,105 1,423 18,687 13,522 1,366 40,103 At 1 January 2007 5,105 1,423 18,687 13,522 1,366 40,103 Net losses on available-for-sale securities - - - - (1,460) (1,460)Net losses on cash flow hedges - - - - (1,631) (1,631)Foreign currency translation - - - - - - Total income and expense for the year recognised directly in equity - - - - (3,091) (3,091) Profit for the year - - - 11,343 - 11,343 Total income and expense for the year - - - 11,343 (3,091) 8,252 Capital increase 750 5,250 - - - 6,000 Dividends paid (Note: 13) - - - (9,542) - (9,542) At 31 December 2007 5,855 6,673 18,687 15,323 (1,725) 44,813
(1) the statutory reserve represents accumulated transfers from retained earnings in compliance with the Czech Commercial Code. This reserve is not distributable.
The accompanying notes are an integral part of these separate financial statements.
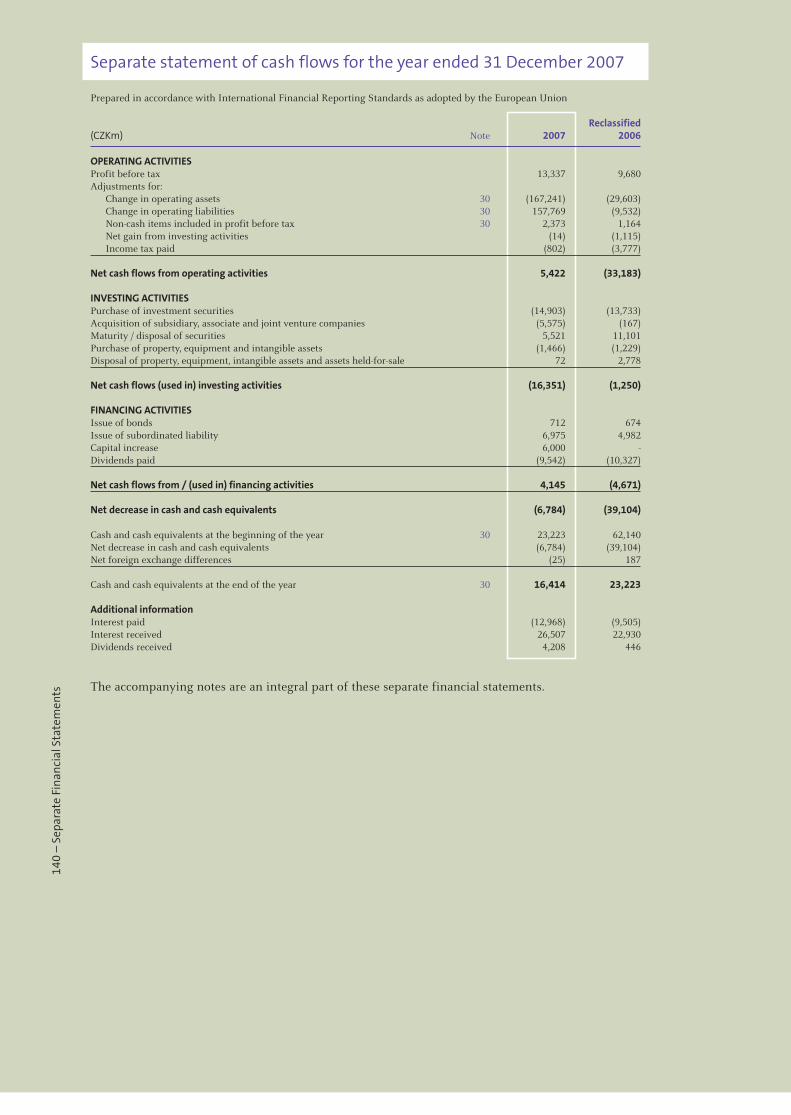
140
– S
epar
ate
Fina
ncia
l Sta
tem
ents
Separate statement of cash flows for the year ended 31 December 2007
Prepared in accordance with International Financial Reporting Standards as adopted by the European Union
Reclassified(CZKm) Note 2007 2006
OPERATING ACTIVITIES Profit before tax 13,337 9,680Adjustments for: Change in operating assets 30 (167,241) (29,603) Change in operating liabilities 30 157,769 (9,532) Non-cash items included in profit before tax 30 2,373 1,164 Net gain from investing activities (14) (1,115) Income tax paid (802) (3,777) Net cash flows from operating activities 5,422 (33,183) INVESTING ACTIVITIES Purchase of investment securities (14,903) (13,733)Acquisition of subsidiary, associate and joint venture companies (5,575) (167)Maturity / disposal of securities 5,521 11,101Purchase of property, equipment and intangible assets (1,466) (1,229)Disposal of property, equipment, intangible assets and assets held-for-sale 72 2,778 Net cash flows (used in) investing activities (16,351) (1,250) FINANCING ACTIVITIES Issue of bonds 712 674Issue of subordinated liability 6,975 4,982Capital increase 6,000 -Dividends paid (9,542) (10,327) Net cash flows from / (used in) financing activities 4,145 (4,671) Net decrease in cash and cash equivalents (6,784) (39,104) Cash and cash equivalents at the beginning of the year 30 23,223 62,140Net decrease in cash and cash equivalents (6,784) (39,104)Net foreign exchange differences (25) 187 Cash and cash equivalents at the end of the year 30 16,414 23,223
Additional informationInterest paid (12,968) (9,505)Interest received 26,507 22,930Dividends received 4,208 446
The accompanying notes are an integral part of these separate financial statements.
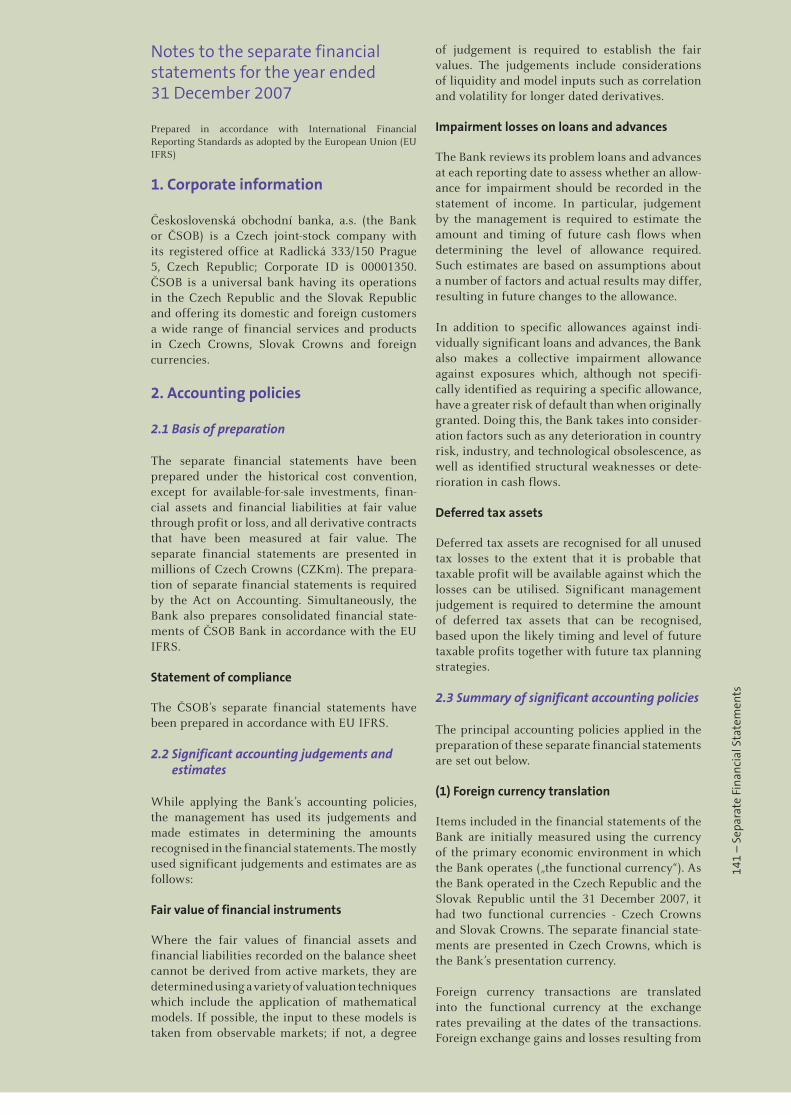
141
– S
epar
ate
Fina
ncia
l Sta
tem
ents
Notes to the separate financial statements for the year ended 31 December 2007
Prepared in accordance with International Financial Reporting Standards as adopted by the European Union (EU IFRS)
1. Corporate information
Československá obchodní banka, a.s. (the Bank or ČSOB) is a Czech joint-stock company with its registered office at Radlická 333/150 Prague 5, Czech Republic; Corporate ID is 00001350. ČSOB is a universal bank having its operations in the Czech Republic and the Slovak Republic and offering its domestic and foreign customers a wide range of financial services and products in Czech Crowns, Slovak Crowns and foreign currencies.
2. Accounting policies
2.1 Basis of preparation
The separate financial statements have been prepared under the historical cost convention, except for available-for-sale investments, finan-cial assets and financial liabilities at fair value through profit or loss, and all derivative contracts that have been measured at fair value. The separate financial statements are presented in millions of Czech Crowns (CZKm). The prepara-tion of separate financial statements is required by the Act on Accounting. Simultaneously, the Bank also prepares consolidated financial state-ments of ČSOB Bank in accordance with the EU IFRS.
Statement of compliance
The ČSOB’s separate financial statements have been prepared in accordance with EU IFRS.
2.2 Significant accounting judgements and estimates
While applying the Bank’s accounting policies, the management has used its judgements and made estimates in determining the amounts recognised in the financial statements. The mostly used significant judgements and estimates are as follows:
Fair value of financial instruments
Where the fair values of financial assets and financial liabilities recorded on the balance sheet cannot be derived from active markets, they are determined using a variety of valuation techniques which include the application of mathematical models. If possible, the input to these models is taken from observable markets; if not, a degree
of judgement is required to establish the fair values. The judgements include considerations of liquidity and model inputs such as correlation and volatility for longer dated derivatives.
Impairment losses on loans and advances
The Bank reviews its problem loans and advances at each reporting date to assess whether an allow-ance for impairment should be recorded in the statement of income. In particular, judgement by the management is required to estimate the amount and timing of future cash flows when determining the level of allowance required. Such estimates are based on assumptions about a number of factors and actual results may differ, resulting in future changes to the allowance.
In addition to specific allowances against indi-vidually significant loans and advances, the Bank also makes a collective impairment allowance against exposures which, although not specifi-cally identified as requiring a specific allowance, have a greater risk of default than when originally granted. Doing this, the Bank takes into consider-ation factors such as any deterioration in country risk, industry, and technological obsolescence, as well as identified structural weaknesses or dete-rioration in cash flows.
Deferred tax assets
Deferred tax assets are recognised for all unused tax losses to the extent that it is probable that taxable profit will be available against which the losses can be utilised. Significant management judgement is required to determine the amount of deferred tax assets that can be recognised, based upon the likely timing and level of future taxable profits together with future tax planning strategies.
2.3 Summary of significant accounting policies
The principal accounting policies applied in the preparation of these separate financial statements are set out below.
(1) Foreign currency translation
Items included in the financial statements of the Bank are initially measured using the currency of the primary economic environment in which the Bank operates („the functional currency“). As the Bank operated in the Czech Republic and the Slovak Republic until the 31 December 2007, it had two functional currencies - Czech Crowns and Slovak Crowns. The separate financial state-ments are presented in Czech Crowns, which is the Bank’s presentation currency.
Foreign currency transactions are translated into the functional currency at the exchange rates prevailing at the dates of the transactions. Foreign exchange gains and losses resulting from

142
– S
epar
ate
Fina
ncia
l Sta
tem
ents
the settlement of such transactions and from the translation of monetary assets and liabilities denominated in foreign currencies are recognised in the statement of income.
The results and financial position of the Slovak branch, which had a functional currency differ-ent from the presentation currency, are translated into the presentation currency as follows:
– assets and liabilities at the year-end exchange rates;
– income and expenses at average exchange rates for the year (unless this average is not a reason-able approximation of the cumulative effect of the rates prevailing on the transaction dates, in which case income and expenses are translated at the dates of the transactions);
– all resulting exchange differences are recogn-ised as a separate component of equity in the Foreign currency translation reserve.
(2) Investments in subsidiaries, associates and jointly controlled entities
A subsidiary is an entity which is controlled by another entity (parent entity). Control is the power to govern the financial and operating policies of an economic activity so as to obtain benefits from it.
A jointly controlled entity is a joint venture that involves the establishment of a corporation, part-nership or other entity in which each venturer has an interest. A contractual arrangement between the venturers establishes joint control over the economic activity of the entity. Joint control is the contractually agreed sharing of control over an economic activity, and exists only when the strategic, financial and operating decisions relat-ing to the activity require the unanimous consent of the parties sharing control.
Associates are all entities over which the Bank has significant influence but not control, gener-ally accompanying a shareholding of between 20% and 50% of the voting rights.
Investments in subsidiaries, associates and jointly controlled entities are carried at cost less any provision for impairment. Dividends received from investments in subsidiaries, associ-ates and jointly controlled entities are recorded in Dividend income.
(3) Financial instruments – recognition and derecognition
Financial assets and liabilities are recognised in the balance sheet when the Bank becomes a party to the contractual provisions of the financial instrument, except for „regular way“ purchases and sales of financial assets (see below). A finan-cial asset is derecognised from the balance sheet when the contractual rights to the cash flows
from the financial asset expire or are transferred. A financial liability is derecognised from the balance sheet when the obligation specified in the contract is discharged, cancelled or expires.
A „regular way“ purchase or sale of a financial asset is one in which the delivery of the asset is made within the time frame generally established by regulation or convention of the particular market concerned. For all categories of financial assets the Bank recognises „regular way“ purchases and sales using settlement date accounting. Under settlement date accounting, a financial asset is recognised or derecognised in the balance sheet on the day it is physically transferred to or from the Bank („settlement date“). The date on which the Bank becomes a party to the contractual provisions of a financial asset purchase or the Bank loses control of the contractual rights from a financial asset sale is commonly referred to as the „trade date“. For financial assets at fair value through profit or loss and available-for-sale finan-cial assets, fair value movements between „trade date“ and „settlement date“ in connection with purchases and sales are recognised in Net gains from financial instruments at fair value through profit or loss and in the Available-for-sale reserve, respectively. On the settlement date, a resulting financial asset or liability is recognised in the balance sheet at the fair value of the consider-ation given or received.
(4) Financial instruments – initial recognition and subsequent measurement
Classification of financial instruments depends on the purpose for which the financial instru-ments were acquired and their characteristics. All financial instruments are measured initially at their fair value plus, in the case of financial assets and financial liabilities not at fair value through profit or loss, any directly attributable incremental costs of acquisition or issue.
(i) Derivatives held for trading
Derivatives include foreign exchange contracts, interest rate futures, forward rate agreements, currency and interest rate swaps, currency and interest rate options. Derivatives are recorded at fair value and carried as assets when the fair value is positive and as liabilities when the fair value is negative. Changes in the fair value of derivatives held for trading are included in Net gains from financial instruments at fair value through profit or loss.
The Bank occasionally purchases or issues financial instruments containing embedded derivatives. An embedded derivative is separated from the host contract and carried at fair value if the economic characteristics of the derivative are not closely related to the economic characteristics of the host contract and the hybrid instrument is not classified as at fair value through profit or loss. If a separated derivative does not qualify as a hedging derivative, it is designated as a trading
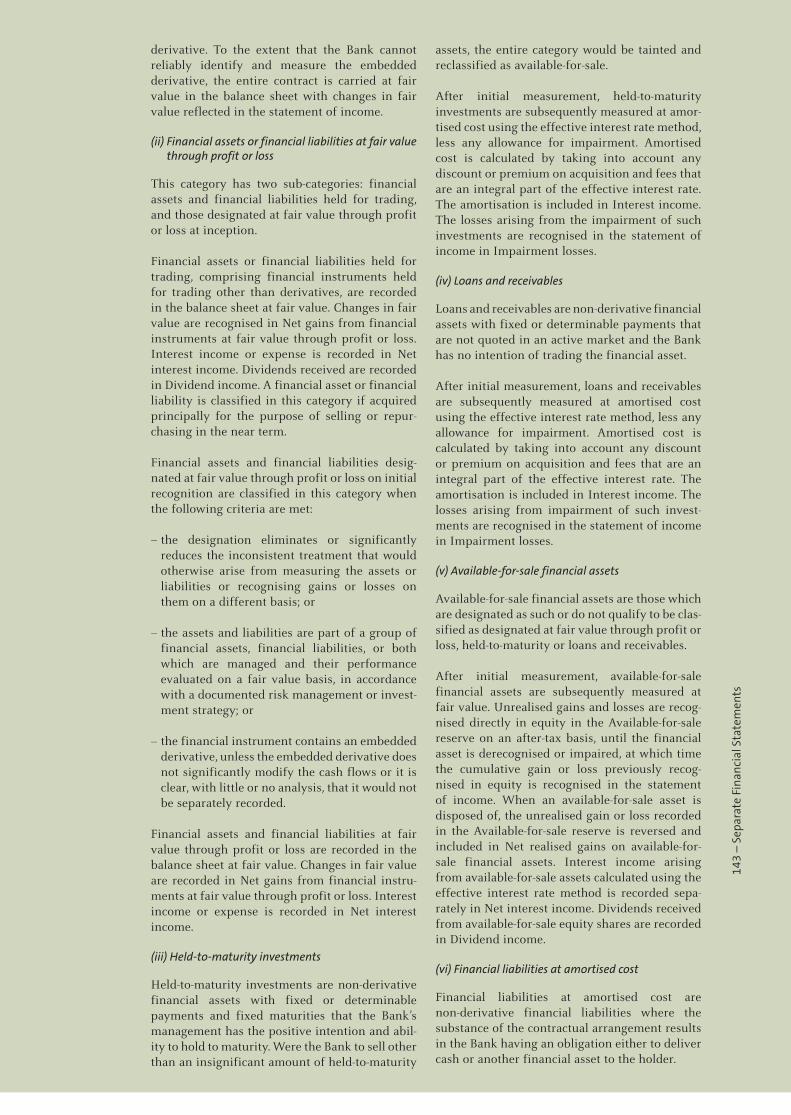
143
– S
epar
ate
Fina
ncia
l Sta
tem
ents
derivative. To the extent that the Bank cannot reliably identify and measure the embedded derivative, the entire contract is carried at fair value in the balance sheet with changes in fair value reflected in the statement of income.
(ii) Financial assets or financial liabilities at fair value through profit or loss
This category has two sub-categories: financial assets and financial liabilities held for trading, and those designated at fair value through profit or loss at inception.
Financial assets or financial liabilities held for trading, comprising financial instruments held for trading other than derivatives, are recorded in the balance sheet at fair value. Changes in fair value are recognised in Net gains from financial instruments at fair value through profit or loss. Interest income or expense is recorded in Net interest income. Dividends received are recorded in Dividend income. A financial asset or financial liability is classified in this category if acquired principally for the purpose of selling or repur-chasing in the near term.
Financial assets and financial liabilities desig-nated at fair value through profit or loss on initial recognition are classified in this category when the following criteria are met:
– the designation eliminates or significantly reduces the inconsistent treatment that would otherwise arise from measuring the assets or liabilities or recognising gains or losses on them on a different basis; or
– the assets and liabilities are part of a group of financial assets, financial liabilities, or both which are managed and their performance evaluated on a fair value basis, in accordance with a documented risk management or invest-ment strategy; or
– the financial instrument contains an embedded derivative, unless the embedded derivative does not significantly modify the cash flows or it is clear, with little or no analysis, that it would not be separately recorded.
Financial assets and financial liabilities at fair value through profit or loss are recorded in the balance sheet at fair value. Changes in fair value are recorded in Net gains from financial instru-ments at fair value through profit or loss. Interest income or expense is recorded in Net interest income.
(iii) Held-to-maturity investments
Held-to-maturity investments are non-derivative financial assets with fixed or determinable payments and fixed maturities that the Bank’s management has the positive intention and abil-ity to hold to maturity. Were the Bank to sell other than an insignificant amount of held-to-maturity
assets, the entire category would be tainted and reclassified as available-for-sale.
After initial measurement, held-to-maturity investments are subsequently measured at amor-tised cost using the effective interest rate method, less any allowance for impairment. Amortised cost is calculated by taking into account any discount or premium on acquisition and fees that are an integral part of the effective interest rate. The amortisation is included in Interest income. The losses arising from the impairment of such investments are recognised in the statement of income in Impairment losses.
(iv) Loans and receivables
Loans and receivables are non-derivative financial assets with fixed or determinable payments that are not quoted in an active market and the Bank has no intention of trading the financial asset.
After initial measurement, loans and receivables are subsequently measured at amortised cost using the effective interest rate method, less any allowance for impairment. Amortised cost is calculated by taking into account any discount or premium on acquisition and fees that are an integral part of the effective interest rate. The amortisation is included in Interest income. The losses arising from impairment of such invest-ments are recognised in the statement of income in Impairment losses.
(v) Available-for-sale financial assets
Available-for-sale financial assets are those which are designated as such or do not qualify to be clas-sified as designated at fair value through profit or loss, held-to-maturity or loans and receivables.
After initial measurement, available-for-sale financial assets are subsequently measured at fair value. Unrealised gains and losses are recog-nised directly in equity in the Available-for-sale reserve on an after-tax basis, until the financial asset is derecognised or impaired, at which time the cumulative gain or loss previously recog-nised in equity is recognised in the statement of income. When an available-for-sale asset is disposed of, the unrealised gain or loss recorded in the Available-for-sale reserve is reversed and included in Net realised gains on available-for-sale financial assets. Interest income arising from available-for-sale assets calculated using the effective interest rate method is recorded sepa-rately in Net interest income. Dividends received from available-for-sale equity shares are recorded in Dividend income.
(vi) Financial liabilities at amortised cost
Financial liabilities at amortised cost are non-derivative financial liabilities where the substance of the contractual arrangement results in the Bank having an obligation either to deliver cash or another financial asset to the holder.
144
– S
epar
ate
Fina
ncia
l Sta
tem
ents
After initial measurement, those financial liabili-ties are measured at amortised cost.
(5) Repurchase and reverse repurchase agreements
Securities sold under agreements to repurchase at a specified future date (repos) remain on the balance sheet. The corresponding cash received is recognised in the balance sheet in Financial liabilities designated at fair value through profit of loss, or Financial liabilities at amortised cost, reflecting its economic substance as a loan to the Bank. The difference between the sale and repur-chase prices is treated as Interest expense and is accrued over the life of the agreement.
Conversely, securities purchased under agree-ments to resell at a specified future date (reverse repos) are not recognised in the balance sheet. The corresponding cash paid is recognised in the balance sheet in Financial assets held for trading or Loans and receivables. The difference between the purchase and resale prices is treated as Interest income and is accrued over the life of the agreement.
(6) Determination of fair value
The fair value of a financial instrument is the amount for which an asset could be exchanged or a liability settled between knowledgeable, willing parties in an arm’s length transaction. Financial instruments classified as financial assets and financial liabilities at fair value through profit or loss or available-for-sale are fair valued using quoted market prices if there is a published price quotation in an active public market. For finan-cial instruments that are not traded on an active public market their fair values are estimated using pricing models, quoted prices of instruments with similar characteristics, or discounted cash flows. Those fair value estimation techniques are significantly affected by assumptions used by the Bank including the discount rate and estimates of future cash flows.
(7) Impairment of financial assets
The Bank assesses at each balance sheet date whether there is objective evidence that a finan-cial asset or a group of financial assets is impaired. A financial asset or a group of financial assets is impaired and impairment losses are incurred if, and only if, there is objective evidence of impairment as a result of one or more events that occurred after the initial recognition of the asset (a ‘loss event’) and that loss event (or events) has an impact on the estimated future cash flows of the financial asset or group of assets that can be reliably estimated. Objective evidence that a financial asset or a group of assets is impaired includes observable data that comes to the atten-tion of the Bank about the following loss events:
– significant financial difficulty of the issuer or obligor;
– a breach of contract, such as a default or delin-quency in interest or principal payments;
– the Bank granting to the borrower, for economic or legal reasons relating to the borrower’s financial difficulty, a concession that the lender would not otherwise consider;
– it becoming probable that the borrower will enter bankruptcy or other financial reorganisation;
– the disappearance of an active market for that financial asset because of financial difficulties; or
– observable data indicating that there is a measurable decrease in the estimated future cash flows from a group of financial assets since the initial recognition of those assets, although the decrease cannot yet be identi-fied with the individual financial assets in the group, including:
• adverse changes in the payment status of borrowers in the group; or
• national or local economic conditions that correlate with defaults on the assets in the group.
(i) Assets carried at amortised cost
The Bank first assesses whether objective evidence of impairment exists individually for financial assets that are individually significant, and individually or collectively for financial assets that are not individually significant. If the Bank determines that no objective evidence of impairment exists for an individually assessed financial asset, whether significant or not, it includes the asset in a group of financial assets with similar credit risk characteristics and collec-tively assesses them for impairment. Assets that are individually assessed for impairment and for which an impairment loss is or continues to be recognised are not included in a collective assess-ment of impairment.
If there is objective evidence that an impairment loss on loans and receivables or held-to-maturity investments carried at amortised cost has been incurred, the amount of the loss is measured as the difference between the asset’s carrying amount and the present value of estimated future cash flows (excluding future credit losses that have not been incurred) discounted at the financial asset’s original effective interest rate. The carrying amount of the asset is reduced through the use of an allowance account and the amount of the loss is recognised in the statement of income. If a loan or held-to-maturity investment has a variable interest rate, the discount rate for measuring any impairment loss is the current effective interest rate determined under the contract. As a practical expedient, the Bank may measure impairment on the basis of an instrument’s fair value using an
145
– S
epar
ate
Fina
ncia
l Sta
tem
ents
observable market price. The calculation of the present value of the estimated future cash flows of a collateralised financial asset reflects the cash flows that may result from foreclosure less costs for obtaining and selling the collateral.
For the purposes of a collective evaluation of impairment, financial assets are grouped on the basis of similar credit risk characteristics. Those characteristics are relevant to the estimation of future cash flows for groups of such assets by being indicative of the debtors’ ability to pay all amounts due according to the contractual terms of the assets being evaluated.
Future cash flows in a group of financial assets that are collectively evaluated for impairment are estimated on the basis of the contractual cash flows of the assets in the group and historical loss experience for assets with credit risk charac-teristics similar to those in the group. Historical loss experience is adjusted on the basis of current observable data to reflect the effects of current conditions that did not affect the period on which the historical loss experience is based and to remove the effects of conditions in the histori-cal period that do not exist currently.
Estimates of changes in future cash flows for groups of assets should reflect and be direction-ally consistent with changes in related observable data from period to period. The methodology and assumptions used for estimating future cash flows are reviewed regularly by the Bank to reduce any differences between loss estimates and actual loss experience.
When a loan is uncollectible, it is written-off against the related allowance for impairment. Such loans are written-off after all the necessary procedures have been completed and the amount of the loss has been determined. Subsequent recoveries of amounts previously written-off are recorded in the statement of income in Impairment losses.
If, in a subsequent period, the amount of the impairment loss decreases and the decrease can be related objectively to an event occurring after the impairment was recognised, the previ-ously recognised impairment loss is reversed by adjusting the allowance account. The amount of the reversal is recognised in the statement of income.
(ii) Assets carried at fair value
The Bank assesses at each balance sheet date whether there is objective evidence that a financial asset or a group of financial assets is impaired. In the case of equity investments classified as available-for-sale, a significant or prolonged decline in the fair value of the secu-rity below its cost is considered in determining whether the assets are impaired. If any such evidence exists for available-for-sale financial assets, the cumulative loss - measured as the
difference between the acquisition cost and the current fair value, less any impairment loss on that financial asset previously recognised in profit or loss - is removed from equity and recog-nised in the statement of income. Impairment losses recognised in the statement of income on equity instruments are not reversed through the statement of income. If, in a subsequent period, the fair value of a debt instrument classified as available-for-sale increases and the increase can be objectively related to an event occurring after the impairment loss was recognised in profit or loss, the impairment loss is reversed through the statement of income.
(iii) Renegotiated loans
Where possible, the Bank seeks to restructure loans rather than to take possession of collat-eral. This may involve extending the payment arrangements and the agreement of new loan conditions. Once the terms have been renegoti-ated, the loan is no longer considered past due, however, the rating of the client cannot be improved only based on the restructuring. The management continuously reviews renegotiated loans to ensure that all criteria are met and that future payments are likely to occur. The loans continue to be subject to an individual or collec-tive impairment assessment, calculated using the loan’s original effective interest rate.
(8) Hedge accounting
The Bank uses derivatives, designated as hedging on the date a contract is entered into, as cash flow hedges to manage the Bank’s interest rate risk. Cash flow hedges are used to minimise the vari-ability in cash flows of interest-earning assets or interest-bearing liabilities or anticipated transac-tions caused by interest rate fluctuations. Hedge accounting is used for derivatives designated in this way provided certain criteria are met. The Bank’s criteria for a derivative instrument to be accounted for as a hedge include:
– formal documentation of the hedging instru-ment, hedged item, hedging objective, strategy and relationship is prepared before hedge accounting is applied;
– the hedge is documented showing that it is expected to be highly effective in offsetting the risk in the hedged item throughout the report-ing period;
– the hedge is highly effective on an ongoing basis. A derivative is considered to be highly effective if the Bank achieves offsetting changes in cash flows between 80 percent and 125 percent for the risk being hedged.
The effective portion of the change in the fair value of a cash flow hedging derivative is recorded in the Cash flow hedge reserve. The ineffective portion is recorded directly in Net gains from financial instruments at fair value through profit
146
– S
epar
ate
Fina
ncia
l Sta
tem
ents
or loss. Amounts in the Cash flow hedge reserve are reclassified into the statement of income in a manner consistent with the earnings recognition pattern of the underlying hedged item. If a cash flow hedge is terminated or the hedge designa-tion removed the related remaining amounts in the Cash flow hedge reserve are reclassified into earnings in the same period during which the hedged item affects income. If the hedged antici-pated transaction is no longer expected to occur the related remaining amounts in the Cash flow hedge reserve are recognized immediately in the statement of income.
(9) Offsetting financial instruments
Financial assets and liabilities are offset and the net amount reported in the balance sheet when there is a legally enforceable right to set off the recognised amounts and there is an intention to settle on a net basis, or realise the asset and settle the liability simultaneously.
(10) Leasing
The determination of whether an arrangement is, or contains a lease is based on the substance of the arrangement and requires an assessment of whether the fulfilment of the arrangement is dependent on the use of a specific asset or assets and the arrangement conveys a right to use the asset.
Bank as a lessee
The leases entered into by the Bank are primarily operating leases. The total payments made under operating leases are charged to the statement of income on a straight-line basis over the period of the lease.
When an operating lease is terminated before the lease period has expired, any payment required to be made to the lessor by way of penalty is recognised as an expense in the period in which termination takes place.
(11) Recognition of income and expenses
Revenue is recognised to the extent that it is prob-able that the economic benefits will flow to the Bank and the revenue can be reliably measured. The following specific recognition criteria must also be met before revenue is recognised:
(i) Interest income and expense
For all financial instruments measured at amortised cost and interest bearing financial instruments classified as available-for-sale finan-cial investments, interest income or expense is recorded using the effective interest rate method.
The effective interest rate method is a method of calculating the amortised cost of a financial asset or a financial liability and of allocating the interest income or interest expense over the relevant period. The effective interest rate is the rate that exactly discounts estimated future cash payments or receipts through the expected life of the financial instrument or, when appropriate, a shorter period to the net carrying amount of the financial asset or financial liability. When calculating the effective interest rate, the Bank estimates cash flows considering all contractual terms of the financial instrument but does not consider future credit losses. The calculation includes all fees and amounts paid or received between parties to the contract that are an inte-gral part of the effective interest rate, transaction costs and all other premiums or discounts.
(ii) Fee and commission income
Fees and commissions are generally recognised on an accrual basis when the service has been provided. Loan origination fees for loans which are probable of being drawn down, are deferred and recognised as an adjustment to the effective yield on the loan. Commissions and fees arising from negotiating, or participating in the negotia-tion of a transaction for a third party, such as the acquisition of loans, shares or other securities or the purchase or sale of businesses, are recognised on the completion of the underlying transaction. Portfolio and other management advisory and service fees are recognised based on the appli-cable service contracts. Asset management fees related to investment funds are accrued over the period for which the service is provided.
(iii) Dividend income
Revenue is recognised when the Bank’s right to receive the payment is established.
(iv) Net gains from financial instruments at fair value through profit or loss
Net gains from financial instruments at fair value through profit or loss include all gains and losses from changes in the fair value of financial assets and financial liabilities held for trading and those designated at fair value through profit or loss. This includes any ineffectiveness recorded in hedging transactions.
(12) Cash and cash equivalents
For the purposes of the cash flow statement, cash and cash equivalents comprise balances with less than 3 months maturity from the date of acquisi-tion including: cash and balances with central banks (excluding mandatory minimum reserves), loans and advances to credit institutions and deposits from credit institutions.
147
– S
epar
ate
Fina
ncia
l Sta
tem
ents
(13) Property and equipment
Property and equipment includes Bank occupied properties, IT and communication and other machines and equipment.
Land is carried at cost. Buildings and equipment are carried at cost less accumulated depreciation. The assets’ residual values and useful lives are reviewed, and adjusted if appropriate, at each balance sheet date.
Depreciation is calculated under the straight-line method to write-off the cost of each asset to its residual value over its estimated useful life, as follows:
Buildings 30 yearsIT equipment 4 yearsOffice equipment 10 yearsOther 4-30 years
The assets’ residual values and useful lives are reviewed, and adjusted if appropriate, at each balance sheet date.
Gains and losses on disposals are determined by comparing the proceeds with the carrying amount. These are included as a net amount in Other net income.
Assets that are subject to depreciation are reviewed for impairment at each balance sheet date or whenever events or changes in circum-stances indicate that the carrying amount may not be recoverable. An asset’s carrying amount is written down immediately to its recoverable amount if the asset’s carrying amount is greater than its estimated recoverable amount. The recoverable amount is the higher of the asset’s fair value less costs to sell and value in use.
When it is highly probable that an asset will be sold, such an asset is classified in Non-current assets held-for-sale at the lower of its carrying amount and fair value less costs to sell.
(14) Goodwill
Goodwill represents the excess of the cost of the business combination over the acquirer’s interest in the net fair value of the identifiable assets, liabilities and contingent liabilities at the date of acquisition. Goodwill is tested annually for impairment and carried at cost less accumulated impairment losses.
If the cost of acquisition is less than the fair value of the net assets of the acquired business or subsidiary company, the difference is recognised directly in the statement of income.
For the purpose of impairment testing, goodwill acquired in a business combination is allocated to the cash-generating unit which is expected to benefit from the synergies of the combination.
A cash-generating unit represents the lowest level within the Bank at which the goodwill is monitored for internal management purposes.
(15) Intangible assets
Intangible assets include software, licences, customer relationship and other intangible assets.
Intangible assets are carried at cost less accumu-lated amortisation. The assets’ residual values and useful lives are reviewed, and adjusted if appropriate, at each balance sheet date.
Amortisation of the software and other intangible assets is calculated under the straight-line method to write-off the cost of each asset to its residual value over its estimated useful life, as follows:
Software 4 yearsOther intangible assets 5 years
Amortisation of the customer relationship is calculated under the diminishing balance method during the economic useful life. The economic useful life is the period over which the Bank receives significant cash flows from the intan-gible assets.
Gains and losses on disposals are determined by comparing proceeds with the carrying amount. These are included as a net amount in Other net income.
(16) Financial guarantees
In the ordinary course of business, the Bank provides financial guarantees consisting of letters of credit and letters of guarantee. Financial guar-antees are recognised in the financial statements at the higher of the amortised premium and the best estimates of expenditure required to settle any financial obligation arising as a result of the guarantee and are presented in Provisions. The fee is recognised in the statement of income in Fee and commission income. Any increase and decrease in the liability relating to financial guar-antees is included in Impairment losses.
(17) Employee retirement benefits
Pensions are provided by the Czech Republic and Slovak Republic to resident employees financed by salary-based social security contributions of the employees and their employers.
The Bank contributes to a defined contribution retirement benefit scheme for participating Czech Republic and Slovak Republic employees, which is in addition to the employer social secu-rity contributions required by the Czech Republic and Slovak Republic. Contributions are charged to the statement of income as they are made.
148
– S
epar
ate
Fina
ncia
l Sta
tem
ents
(18) Provisions
Provisions are recognised when the Bank has a present legal or constructive obligation as a result of past events, it is probable that an outflow of resources embodying economic benefits will be required to settle the obligation, and a reliable estimate of the amount of the obli-gation can be made.
(19) Taxes
There are two components of income tax expense: current and deferred. Current income tax expense approximates amounts to be paid or refunded for taxes for the appropriate period. Deferred tax assets and liabilities are recognised due to differences in the bases of assets and liabilities as measured by tax laws and their bases as reported in the financial statements.
All deferred tax assets are recognised to the extent that it is probable that future taxable profit will be available against which the deferred tax assets can be utilised. Deferred tax assets and liabilities are offset in the financial statements where a right of set-off exists.
Deferred tax related to the fair value movements of cash flow hedges and available-for-sale secu-rities, which are charged or credited directly to equity, is also credited or charged directly to equity and is subsequently recognised in the statement of income together with the deferred gain or loss.
The Bank records a net deferred tax asset under Deferred tax assets and a net deferred tax liability under Deferred tax liabilities.
(20) Fiduciary activities
The Bank commonly acts in fiduciary activities that result in the holding or placing of assets on behalf of individuals and institutions. The assets and income arising thereon are excluded from these financial statements, as they are not assets of the Bank.
(21) Segment reporting
A business segment is a group of assets and oper-ations engaged in providing products or services that are subject to risks and returns that are different from those of other business segments.
A geographical segment is engaged in providing products or services within a particular economic environment that are subject to risks and returns that are different from those of segments operat-ing in other economic environments.
2.4 Future changes in accounting policies
Certain new standards, amendments and interpre-tations have been published which are mandatory for the Bank’s accounting periods beginning on or after 1 January 2008 or later periods and which the Bank has not early adopted. The Bank is expecting to adopt them in accordance with the effective date of the standards:
IFRS 8, Operating Segments (effective from 1 January 2009)
This standard requires disclosure of information about the Bank’s operating segments and replaces the requirement to determine primary and second-ary reporting segments of the Bank. The Bank determined that the operating segments would be the same as the business segments currently identified under IAS 14, Segment Reporting.
Other new standards, amendments or inter-pretations, the Bank has not early adopted the following other new interpretations:
– IAS 23, Borrowing Costs (effective for periods beginning on or after 1 January 2009).
– IFRIC 11, IFRS 2 - Group and Treasury Share Transactions (effective for periods beginning on or after 1 March 2007).
– IFRIC 12, Service Concession Arrangements (effective for periods beginning on or after 1 January 2008).
– IFRIC 13, Customer Loyalty Programmes (effec-tive for periods beginning on or after 1 July 2008).
– IFRIC 14, IAS 19 - The Limit on a Defined Benefit Asset, Minimum Funding Requirements and their Interaction (effective for periods begin-ning on or after 1 January 2008).
Unless otherwise described above, the new standards, amendments and interpretations are not expected to significantly affect the Bank’s financial statements.
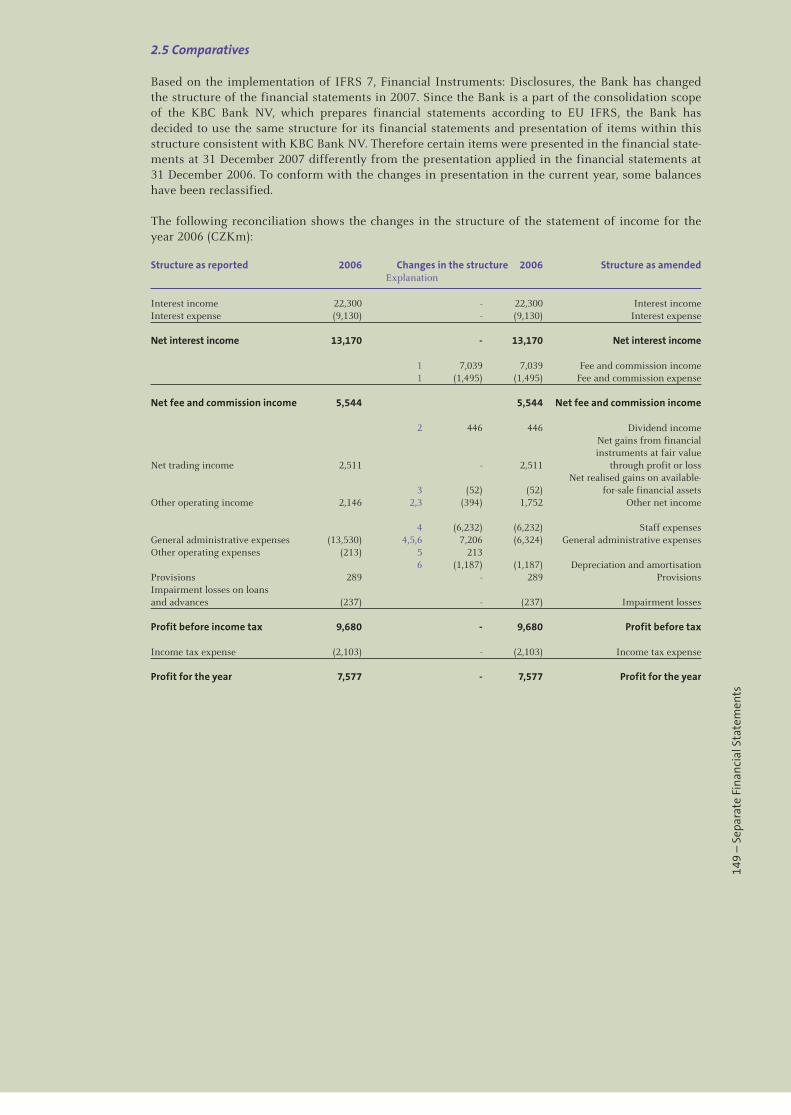
149
– S
epar
ate
Fina
ncia
l Sta
tem
ents
2.5 Comparatives
Based on the implementation of IFRS 7, Financial Instruments: Disclosures, the Bank has changed the structure of the financial statements in 2007. Since the Bank is a part of the consolidation scope of the KBC Bank NV, which prepares financial statements according to EU IFRS, the Bank has decided to use the same structure for its financial statements and presentation of items within this structure consistent with KBC Bank NV. Therefore certain items were presented in the financial state-ments at 31 December 2007 differently from the presentation applied in the financial statements at 31 December 2006. To conform with the changes in presentation in the current year, some balances have been reclassified.
The following reconciliation shows the changes in the structure of the statement of income for the year 2006 (CZKm):
Structure as reported 2006 Changes in the structure 2006 Structure as amended Explanation
Interest income 22,300 - 22,300 Interest incomeInterest expense (9,130) - (9,130) Interest expense
Net interest income 13,170 - 13,170 Net interest income
1 7,039 7,039 Fee and commission income 1 (1,495) (1,495) Fee and commission expense
Net fee and commission income 5,544 5,544 Net fee and commission income
2 446 446 Dividend income Net gains from financial instruments at fair value Net trading income 2,511 - 2,511 through profit or loss Net realised gains on available- 3 (52) (52) for-sale financial assetsOther operating income 2,146 2,3 (394) 1,752 Other net income 4 (6,232) (6,232) Staff expensesGeneral administrative expenses (13,530) 4,5,6 7,206 (6,324) General administrative expensesOther operating expenses (213) 5 213 6 (1,187) (1,187) Depreciation and amortisationProvisions 289 - 289 ProvisionsImpairment losses on loans and advances (237) - (237) Impairment losses Profit before income tax 9,680 - 9,680 Profit before tax Income tax expense (2,103) - (2,103) Income tax expense Profit for the year 7,577 - 7,577 Profit for the year
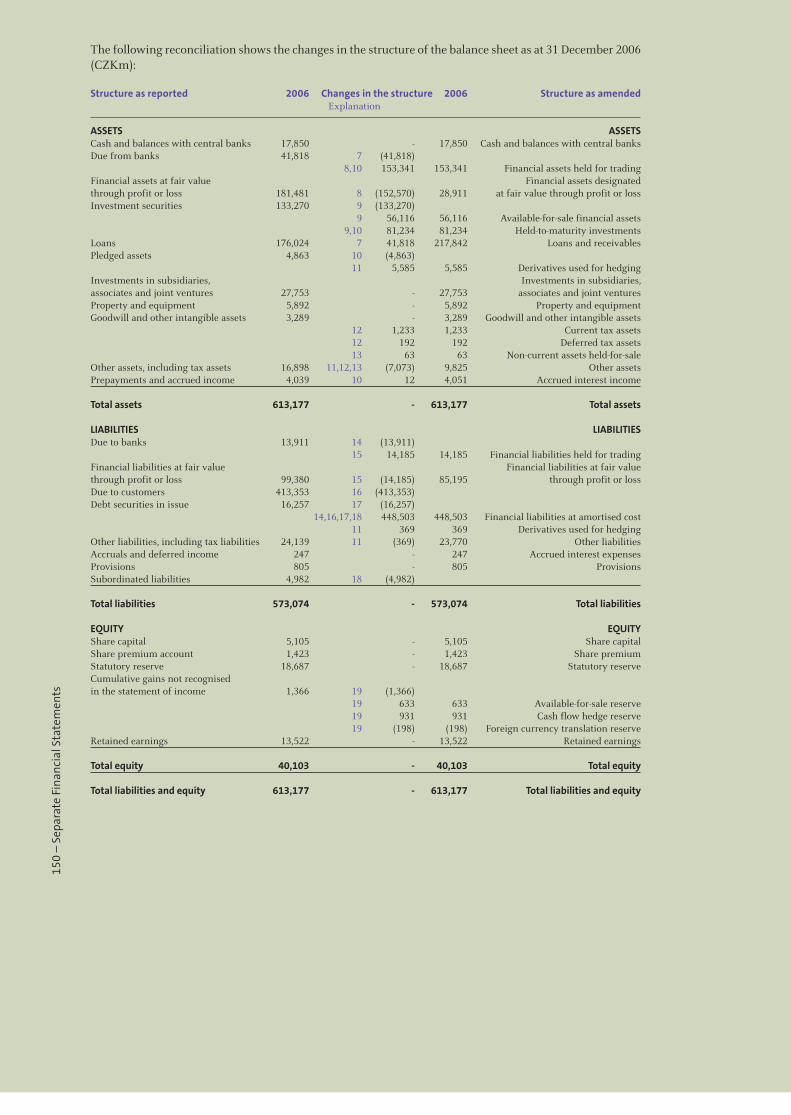
150
– S
epar
ate
Fina
ncia
l Sta
tem
ents
The following reconciliation shows the changes in the structure of the balance sheet as at 31 December 2006 (CZKm):
Structure as reported 2006 Changes in the structure 2006 Structure as amended Explanation
ASSETS ASSETSCash and balances with central banks 17,850 - 17,850 Cash and balances with central banksDue from banks 41,818 7 (41,818) 8,10 153,341 153,341 Financial assets held for tradingFinancial assets at fair value Financial assets designated through profit or loss 181,481 8 (152,570) 28,911 at fair value through profit or lossInvestment securities 133,270 9 (133,270) 9 56,116 56,116 Available-for-sale financial assets 9,10 81,234 81,234 Held-to-maturity investmentsLoans 176,024 7 41,818 217,842 Loans and receivablesPledged assets 4,863 10 (4,863) 11 5,585 5,585 Derivatives used for hedgingInvestments in subsidiaries, Investments in subsidiaries,associates and joint ventures 27,753 - 27,753 associates and joint venturesProperty and equipment 5,892 - 5,892 Property and equipmentGoodwill and other intangible assets 3,289 - 3,289 Goodwill and other intangible assets 12 1,233 1,233 Current tax assets 12 192 192 Deferred tax assets 13 63 63 Non-current assets held-for-saleOther assets, including tax assets 16,898 11,12,13 (7,073) 9,825 Other assetsPrepayments and accrued income 4,039 10 12 4,051 Accrued interest income Total assets 613,177 - 613,177 Total assets LIABILITIES LIABILITIESDue to banks 13,911 14 (13,911) 15 14,185 14,185 Financial liabilities held for tradingFinancial liabilities at fair value Financial liabilities at fair valuethrough profit or loss 99,380 15 (14,185) 85,195 through profit or lossDue to customers 413,353 16 (413,353) Debt securities in issue 16,257 17 (16,257) 14,16,17,18 448,503 448,503 Financial liabilities at amortised cost 11 369 369 Derivatives used for hedgingOther liabilities, including tax liabilities 24,139 11 (369) 23,770 Other liabilitiesAccruals and deferred income 247 - 247 Accrued interest expensesProvisions 805 - 805 ProvisionsSubordinated liabilities 4,982 18 (4,982) Total liabilities 573,074 - 573,074 Total liabilities EQUITY EQUITYShare capital 5,105 - 5,105 Share capitalShare premium account 1,423 - 1,423 Share premiumStatutory reserve 18,687 - 18,687 Statutory reserveCumulative gains not recognised in the statement of income 1,366 19 (1,366) 19 633 633 Available-for-sale reserve 19 931 931 Cash flow hedge reserve 19 (198) (198) Foreign currency translation reserveRetained earnings 13,522 - 13,522 Retained earnings Total equity 40,103 - 40,103 Total equity Total liabilities and equity 613,177 - 613,177 Total liabilities and equity
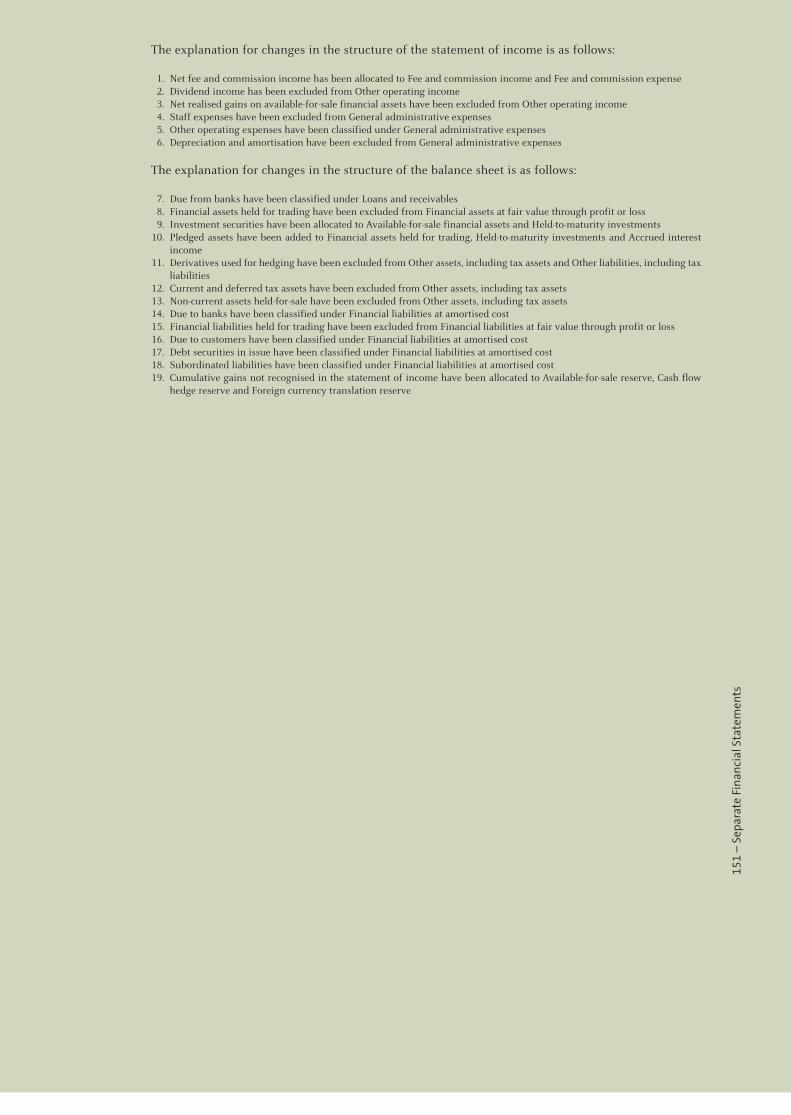
151
– S
epar
ate
Fina
ncia
l Sta
tem
ents
The explanation for changes in the structure of the statement of income is as follows:
1. Net fee and commission income has been allocated to Fee and commission income and Fee and commission expense 2. Dividend income has been excluded from Other operating income 3. Net realised gains on available-for-sale financial assets have been excluded from Other operating income 4. Staff expenses have been excluded from General administrative expenses 5. Other operating expenses have been classified under General administrative expenses 6. Depreciation and amortisation have been excluded from General administrative expenses
The explanation for changes in the structure of the balance sheet is as follows:
7. Due from banks have been classified under Loans and receivables 8. Financial assets held for trading have been excluded from Financial assets at fair value through profit or loss 9. Investment securities have been allocated to Available-for-sale financial assets and Held-to-maturity investments 10. Pledged assets have been added to Financial assets held for trading, Held-to-maturity investments and Accrued interest
income 11. Derivatives used for hedging have been excluded from Other assets, including tax assets and Other liabilities, including tax
liabilities 12. Current and deferred tax assets have been excluded from Other assets, including tax assets 13. Non-current assets held-for-sale have been excluded from Other assets, including tax assets 14. Due to banks have been classified under Financial liabilities at amortised cost 15. Financial liabilities held for trading have been excluded from Financial liabilities at fair value through profit or loss 16. Due to customers have been classified under Financial liabilities at amortised cost 17. Debt securities in issue have been classified under Financial liabilities at amortised cost 18. Subordinated liabilities have been classified under Financial liabilities at amortised cost 19. Cumulative gains not recognised in the statement of income have been allocated to Available-for-sale reserve, Cash flow
hedge reserve and Foreign currency translation reserve
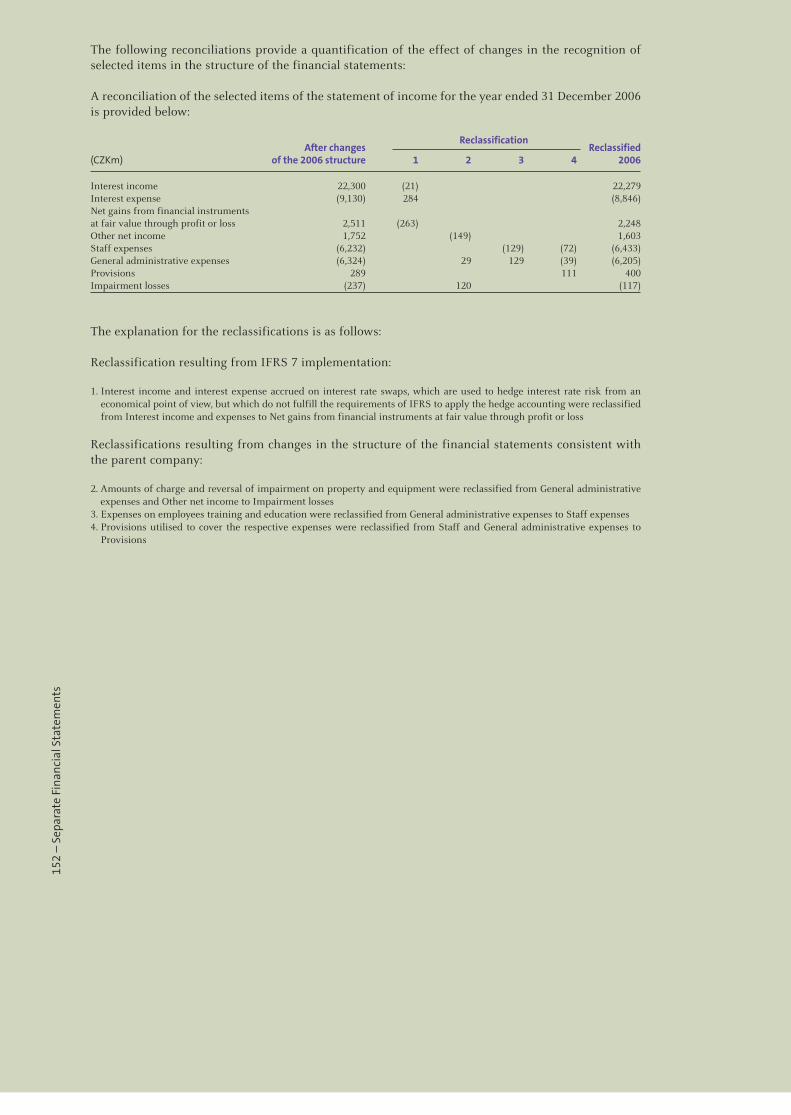
152
– S
epar
ate
Fina
ncia
l Sta
tem
ents
The following reconciliations provide a quantification of the effect of changes in the recognition of selected items in the structure of the financial statements:
A reconciliation of the selected items of the statement of income for the year ended 31 December 2006 is provided below:
After changes
Reclassification Reclassified
(CZKm) of the 2006 structure 1 2 3 4 2006
Interest income 22,300 (21) 22,279Interest expense (9,130) 284 (8,846)Net gains from financial instruments at fair value through profit or loss 2,511 (263) 2,248Other net income 1,752 (149) 1,603Staff expenses (6,232) (129) (72) (6,433)General administrative expenses (6,324) 29 129 (39) (6,205)Provisions 289 111 400Impairment losses (237) 120 (117)
The explanation for the reclassifications is as follows:
Reclassification resulting from IFRS 7 implementation:
1. Interest income and interest expense accrued on interest rate swaps, which are used to hedge interest rate risk from an economical point of view, but which do not fulfill the requirements of IFRS to apply the hedge accounting were reclassified from Interest income and expenses to Net gains from financial instruments at fair value through profit or loss
Reclassifications resulting from changes in the structure of the financial statements consistent with the parent company:
2. Amounts of charge and reversal of impairment on property and equipment were reclassified from General administrative expenses and Other net income to Impairment losses
3. Expenses on employees training and education were reclassified from General administrative expenses to Staff expenses4. Provisions utilised to cover the respective expenses were reclassified from Staff and General administrative expenses to
Provisions
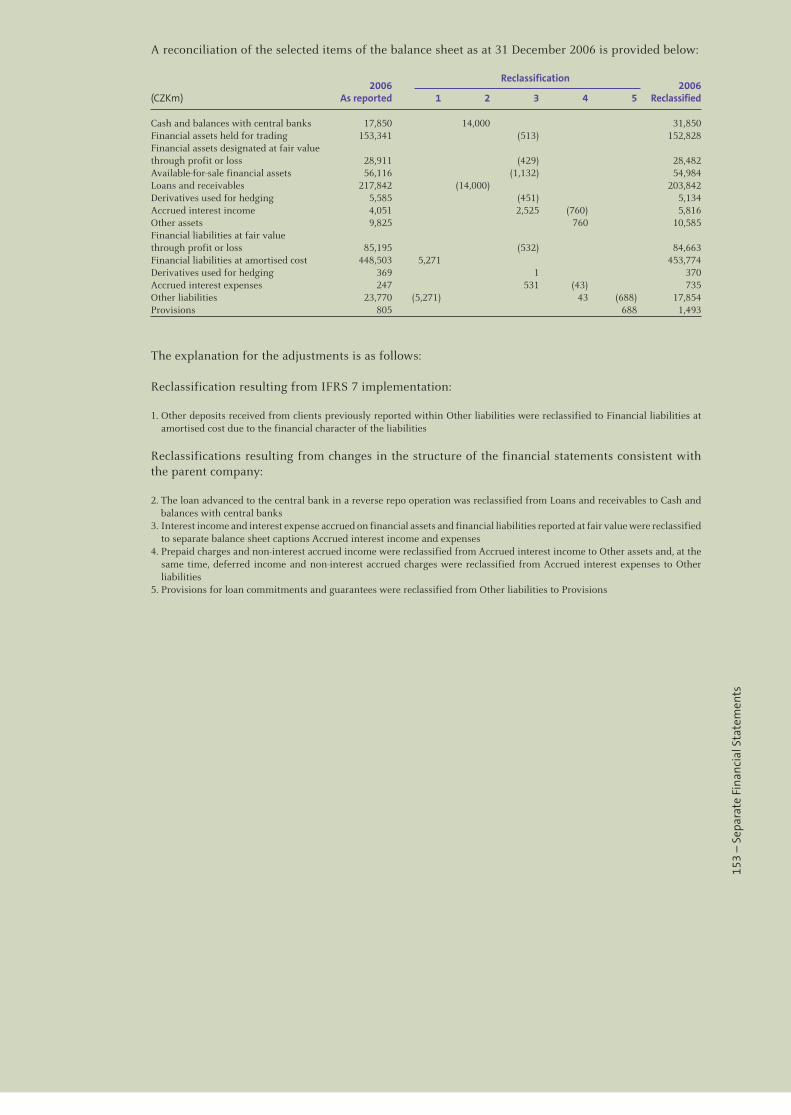
153
– S
epar
ate
Fina
ncia
l Sta
tem
ents
A reconciliation of the selected items of the balance sheet as at 31 December 2006 is provided below:
2006
Reclassification 2006
(CZKm) As reported 1 2 3 4 5 Reclassified
Cash and balances with central banks 17,850 14,000 31,850Financial assets held for trading 153,341 (513) 152,828Financial assets designated at fair value through profit or loss 28,911 (429) 28,482Available-for-sale financial assets 56,116 (1,132) 54,984Loans and receivables 217,842 (14,000) 203,842Derivatives used for hedging 5,585 (451) 5,134Accrued interest income 4,051 2,525 (760) 5,816Other assets 9,825 760 10,585Financial liabilities at fair value through profit or loss 85,195 (532) 84,663Financial liabilities at amortised cost 448,503 5,271 453,774Derivatives used for hedging 369 1 370Accrued interest expenses 247 531 (43) 735Other liabilities 23,770 (5,271) 43 (688) 17,854Provisions 805 688 1,493
The explanation for the adjustments is as follows:
Reclassification resulting from IFRS 7 implementation:
1. Other deposits received from clients previously reported within Other liabilities were reclassified to Financial liabilities at amortised cost due to the financial character of the liabilities
Reclassifications resulting from changes in the structure of the financial statements consistent with the parent company:
2. The loan advanced to the central bank in a reverse repo operation was reclassified from Loans and receivables to Cash and balances with central banks
3. Interest income and interest expense accrued on financial assets and financial liabilities reported at fair value were reclassified to separate balance sheet captions Accrued interest income and expenses
4. Prepaid charges and non-interest accrued income were reclassified from Accrued interest income to Other assets and, at the same time, deferred income and non-interest accrued charges were reclassified from Accrued interest expenses to Other liabilities
5. Provisions for loan commitments and guarantees were reclassified from Other liabilities to Provisions
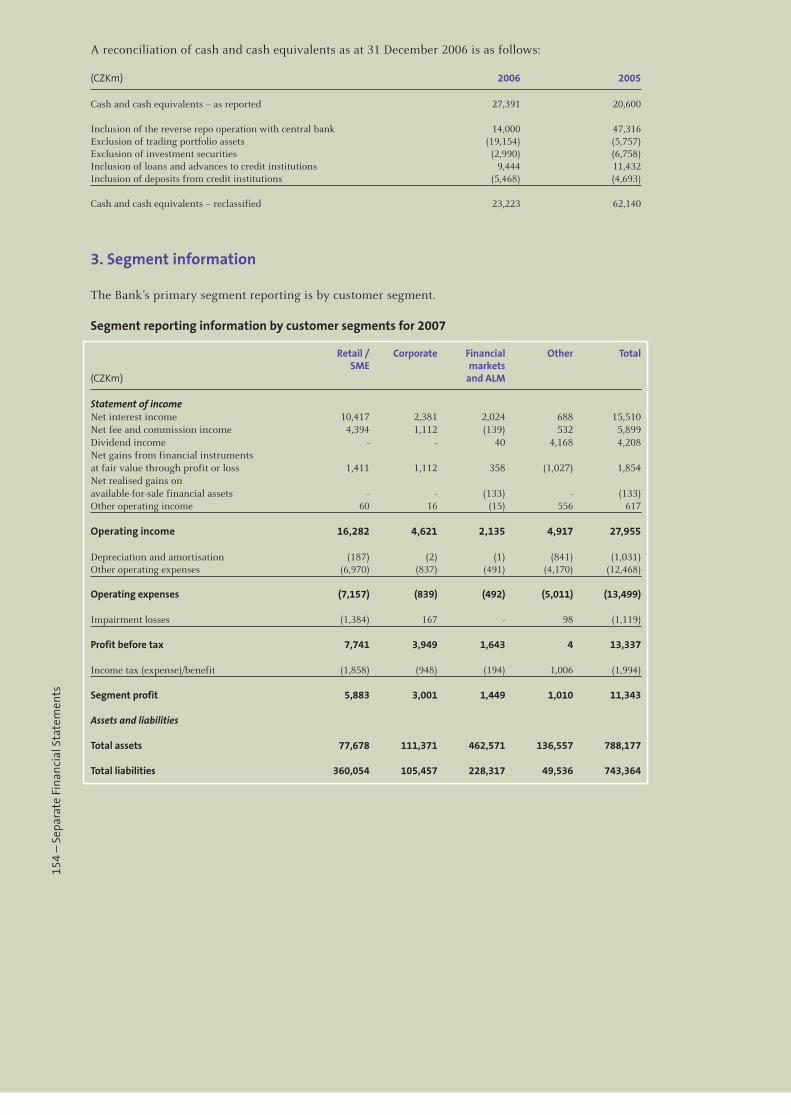
154
– S
epar
ate
Fina
ncia
l Sta
tem
ents
A reconciliation of cash and cash equivalents as at 31 December 2006 is as follows:
(CZKm) 2006 2005
Cash and cash equivalents – as reported 27,391 20,600 Inclusion of the reverse repo operation with central bank 14,000 47,316Exclusion of trading portfolio assets (19,154) (5,757)Exclusion of investment securities (2,990) (6,758)Inclusion of loans and advances to credit institutions 9,444 11,432Inclusion of deposits from credit institutions (5,468) (4,693) Cash and cash equivalents – reclassified 23,223 62,140
3. Segment information
The Bank’s primary segment reporting is by customer segment.
Segment reporting information by customer segments for 2007
Retail / Corporate Financial Other Total SME markets (CZKm) and ALM
Statement of income Net interest income 10,417 2,381 2,024 688 15,510Net fee and commission income 4,394 1,112 (139) 532 5,899Dividend income - - 40 4,168 4,208Net gains from financial instruments at fair value through profit or loss 1,411 1,112 358 (1,027) 1,854Net realised gains on available-for-sale financial assets - - (133) - (133)Other operating income 60 16 (15) 556 617
Operating income 16,282 4,621 2,135 4,917 27,955 Depreciation and amortisation (187) (2) (1) (841) (1,031)Other operating expenses (6,970) (837) (491) (4,170) (12,468)
Operating expenses (7,157) (839) (492) (5,011) (13,499)
Impairment losses (1,384) 167 - 98 (1,119)
Profit before tax 7,741 3,949 1,643 4 13,337
Income tax (expense)/benefit (1,858) (948) (194) 1,006 (1,994)
Segment profit 5,883 3,001 1,449 1,010 11,343 Assets and liabilities Total assets 77,678 111,371 462,571 136,557 788,177 Total liabilities 360,054 105,457 228,317 49,536 743,364
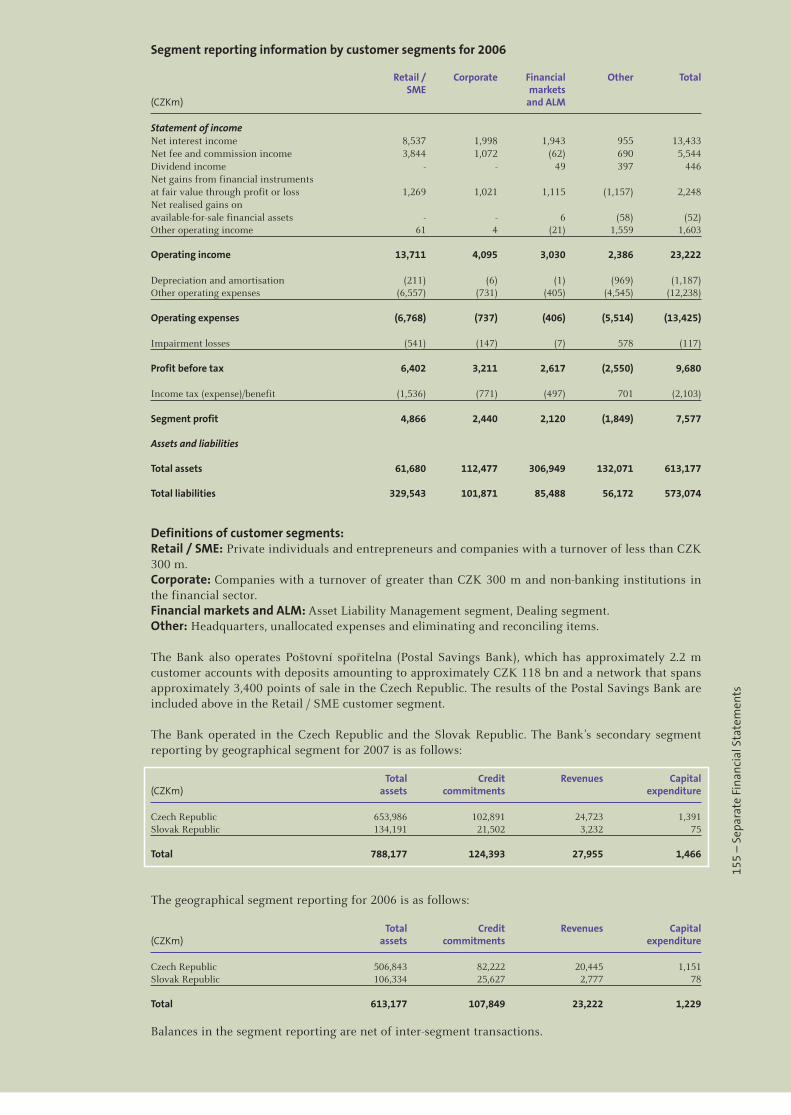
155
– S
epar
ate
Fina
ncia
l Sta
tem
ents
Segment reporting information by customer segments for 2006
Retail / Corporate Financial Other Total SME markets (CZKm) and ALM
Statement of income Net interest income 8,537 1,998 1,943 955 13,433Net fee and commission income 3,844 1,072 (62) 690 5,544Dividend income - - 49 397 446Net gains from financial instruments at fair value through profit or loss 1,269 1,021 1,115 (1,157) 2,248Net realised gains on available-for-sale financial assets - - 6 (58) (52)Other operating income 61 4 (21) 1,559 1,603
Operating income 13,711 4,095 3,030 2,386 23,222 Depreciation and amortisation (211) (6) (1) (969) (1,187)Other operating expenses (6,557) (731) (405) (4,545) (12,238)
Operating expenses (6,768) (737) (406) (5,514) (13,425)
Impairment losses (541) (147) (7) 578 (117)
Profit before tax 6,402 3,211 2,617 (2,550) 9,680
Income tax (expense)/benefit (1,536) (771) (497) 701 (2,103)
Segment profit 4,866 2,440 2,120 (1,849) 7,577
Assets and liabilities Total assets 61,680 112,477 306,949 132,071 613,177 Total liabilities 329,543 101,871 85,488 56,172 573,074
Definitions of customer segments:Retail / SME: Private individuals and entrepreneurs and companies with a turnover of less than CZK 300 m.Corporate: Companies with a turnover of greater than CZK 300 m and non-banking institutions in the financial sector.Financial markets and ALM: Asset Liability Management segment, Dealing segment.Other: Headquarters, unallocated expenses and eliminating and reconciling items.
The Bank also operates Poštovní spořitelna (Postal Savings Bank), which has approximately 2.2 m customer accounts with deposits amounting to approximately CZK 118 bn and a network that spans approximately 3,400 points of sale in the Czech Republic. The results of the Postal Savings Bank are included above in the Retail / SME customer segment.
The Bank operated in the Czech Republic and the Slovak Republic. The Bank’s secondary segment reporting by geographical segment for 2007 is as follows:
Total Credit Revenues Capital(CZKm) assets commitments expenditure
Czech Republic 653,986 102,891 24,723 1,391Slovak Republic 134,191 21,502 3,232 75 Total 788,177 124,393 27,955 1,466
The geographical segment reporting for 2006 is as follows:
Total Credit Revenues Capital(CZKm) assets commitments expenditure
Czech Republic 506,843 82,222 20,445 1,151Slovak Republic 106,334 25,627 2,777 78
Total 613,177 107,849 23,222 1,229
Balances in the segment reporting are net of inter-segment transactions.
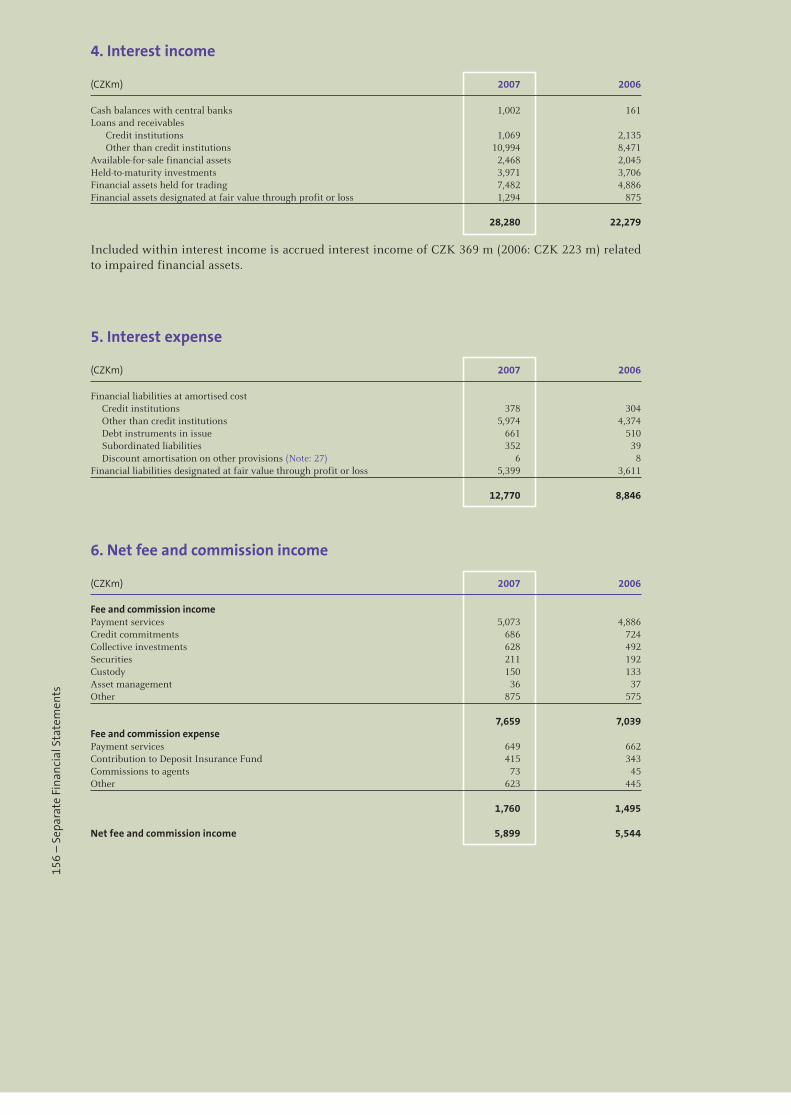
156
– S
epar
ate
Fina
ncia
l Sta
tem
ents
4. Interest income
(CZKm) 2007 2006
Cash balances with central banks 1,002 161Loans and receivables Credit institutions 1,069 2,135 Other than credit institutions 10,994 8,471Available-for-sale financial assets 2,468 2,045Held-to-maturity investments 3,971 3,706Financial assets held for trading 7,482 4,886Financial assets designated at fair value through profit or loss 1,294 875 28,280 22,279
Included within interest income is accrued interest income of CZK 369 m (2006: CZK 223 m) related to impaired financial assets.
5. Interest expense
(CZKm) 2007 2006
Financial liabilities at amortised cost Credit institutions 378 304 Other than credit institutions 5,974 4,374 Debt instruments in issue 661 510 Subordinated liabilities 352 39 Discount amortisation on other provisions (Note: 27) 6 8Financial liabilities designated at fair value through profit or loss 5,399 3,611 12,770 8,846
6. Net fee and commission income
(CZKm) 2007 2006
Fee and commission income Payment services 5,073 4,886Credit commitments 686 724Collective investments 628 492Securities 211 192Custody 150 133Asset management 36 37Other 875 575 7,659 7,039Fee and commission expense Payment services 649 662Contribution to Deposit Insurance Fund 415 343Commissions to agents 73 45Other 623 445 1,760 1,495 Net fee and commission income 5,899 5,544
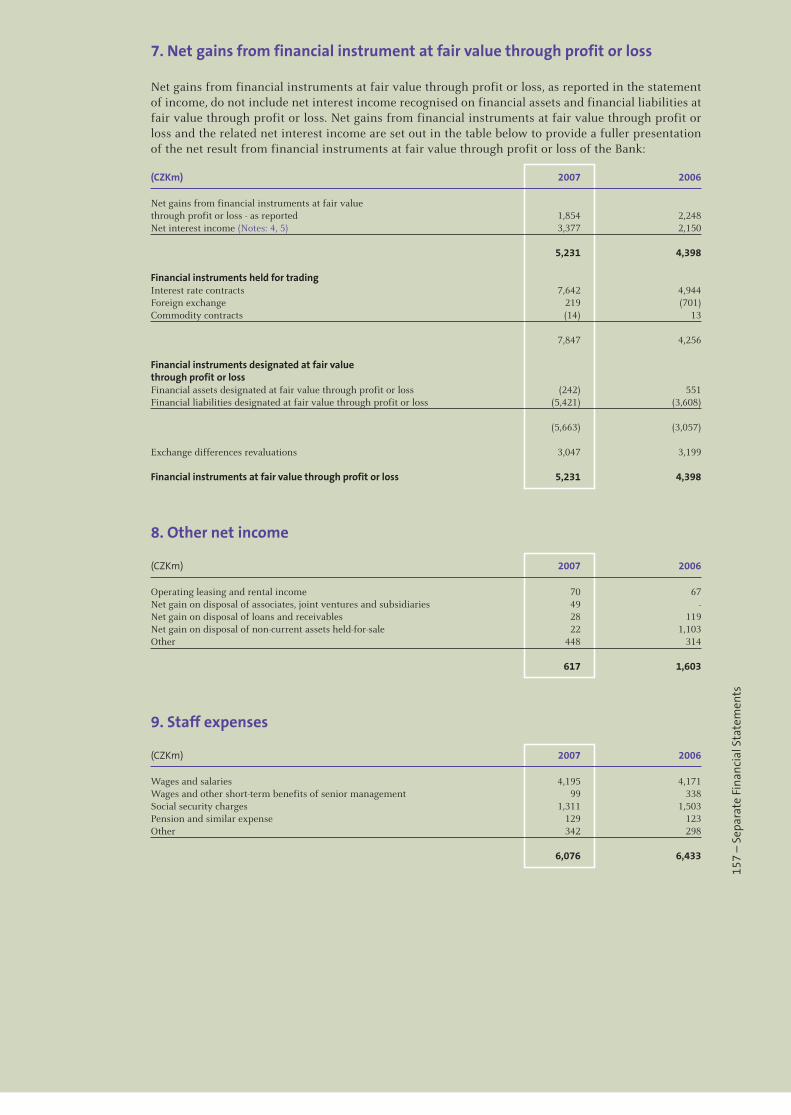
157
– S
epar
ate
Fina
ncia
l Sta
tem
ents
7. Net gains from financial instrument at fair value through profit or loss
Net gains from financial instruments at fair value through profit or loss, as reported in the statement of income, do not include net interest income recognised on financial assets and financial liabilities at fair value through profit or loss. Net gains from financial instruments at fair value through profit or loss and the related net interest income are set out in the table below to provide a fuller presentation of the net result from financial instruments at fair value through profit or loss of the Bank:
(CZKm) 2007 2006
Net gains from financial instruments at fair value through profit or loss - as reported 1,854 2,248Net interest income (Notes: 4, 5) 3,377 2,150 5,231 4,398 Financial instruments held for trading Interest rate contracts 7,642 4,944Foreign exchange 219 (701)Commodity contracts (14) 13 7,847 4,256
Financial instruments designated at fair value through profit or loss Financial assets designated at fair value through profit or loss (242) 551Financial liabilities designated at fair value through profit or loss (5,421) (3,608) (5,663) (3,057) Exchange differences revaluations 3,047 3,199 Financial instruments at fair value through profit or loss 5,231 4,398
8. Other net income
(CZKm) 2007 2006
Operating leasing and rental income 70 67Net gain on disposal of associates, joint ventures and subsidiaries 49 -Net gain on disposal of loans and receivables 28 119Net gain on disposal of non-current assets held-for-sale 22 1,103Other 448 314 617 1,603
9. Staff expenses
(CZKm) 2007 2006
Wages and salaries 4,195 4,171Wages and other short-term benefits of senior management 99 338Social security charges 1,311 1,503Pension and similar expense 129 123Other 342 298 6,076 6,433
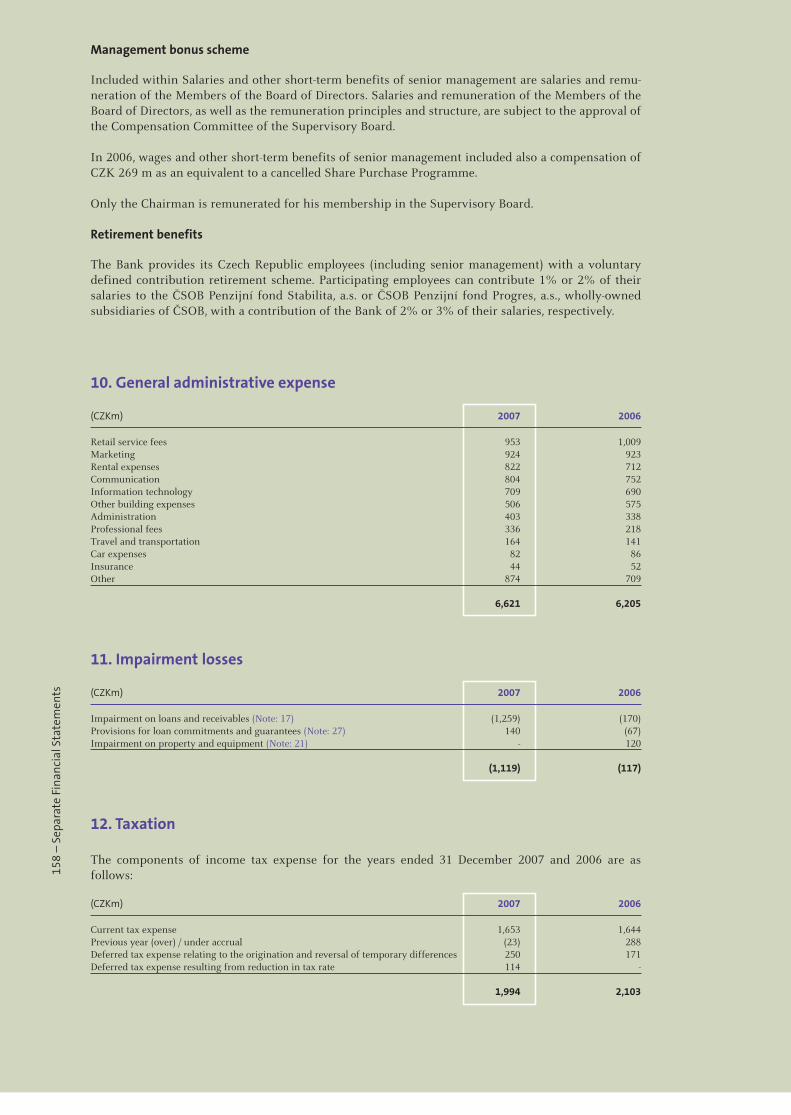
158
– S
epar
ate
Fina
ncia
l Sta
tem
ents
Management bonus scheme
Included within Salaries and other short-term benefits of senior management are salaries and remu-neration of the Members of the Board of Directors. Salaries and remuneration of the Members of the Board of Directors, as well as the remuneration principles and structure, are subject to the approval of the Compensation Committee of the Supervisory Board.
In 2006, wages and other short-term benefits of senior management included also a compensation of CZK 269 m as an equivalent to a cancelled Share Purchase Programme.
Only the Chairman is remunerated for his membership in the Supervisory Board.
Retirement benefits
The Bank provides its Czech Republic employees (including senior management) with a voluntary defined contribution retirement scheme. Participating employees can contribute 1% or 2% of their salaries to the ČSOB Penzijní fond Stabilita, a.s. or ČSOB Penzijní fond Progres, a.s., wholly-owned subsidiaries of ČSOB, with a contribution of the Bank of 2% or 3% of their salaries, respectively.
10. General administrative expense
(CZKm) 2007 2006
Retail service fees 953 1,009Marketing 924 923Rental expenses 822 712Communication 804 752Information technology 709 690Other building expenses 506 575Administration 403 338Professional fees 336 218Travel and transportation 164 141Car expenses 82 86Insurance 44 52Other 874 709 6,621 6,205
11. Impairment losses
(CZKm) 2007 2006
Impairment on loans and receivables (Note: 17) (1,259) (170)Provisions for loan commitments and guarantees (Note: 27) 140 (67)Impairment on property and equipment (Note: 21) - 120 (1,119) (117)
12. Taxation
The components of income tax expense for the years ended 31 December 2007 and 2006 are as follows:
(CZKm) 2007 2006
Current tax expense 1,653 1,644Previous year (over) / under accrual (23) 288Deferred tax expense relating to the origination and reversal of temporary differences 250 171Deferred tax expense resulting from reduction in tax rate 114 - 1,994 2,103
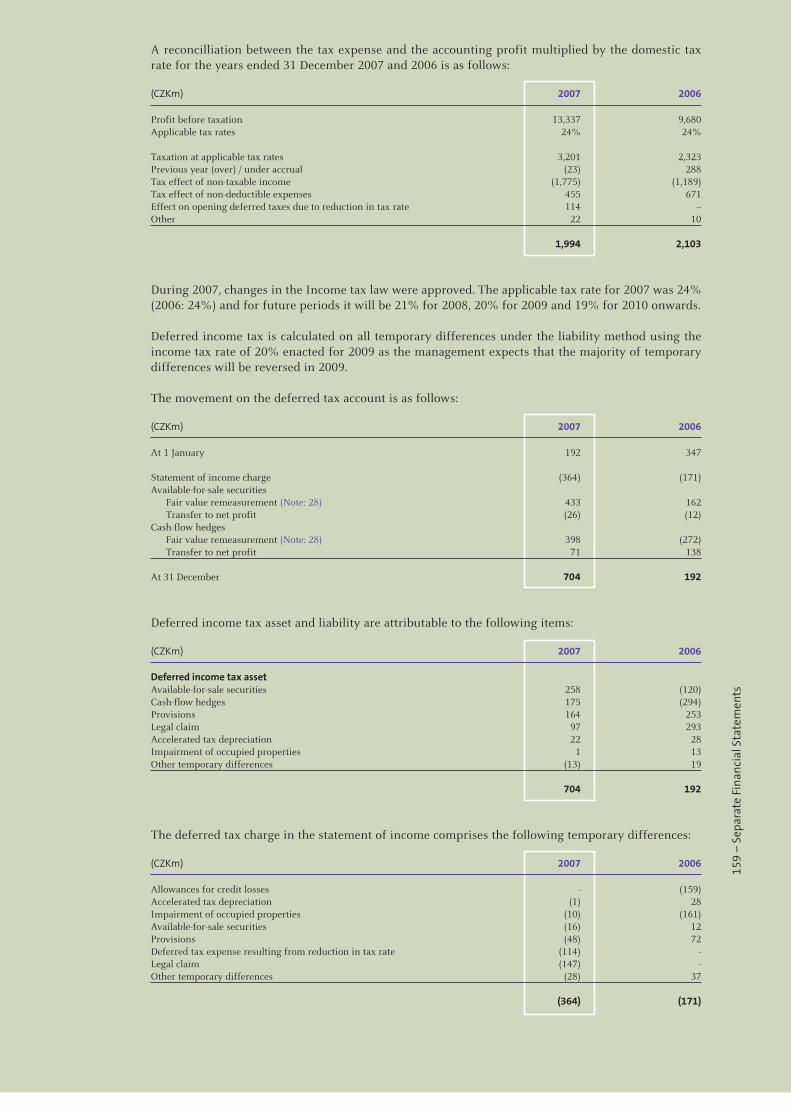
159
– S
epar
ate
Fina
ncia
l Sta
tem
ents
A reconcilliation between the tax expense and the accounting profit multiplied by the domestic tax rate for the years ended 31 December 2007 and 2006 is as follows:
(CZKm) 2007 2006
Profit before taxation 13,337 9,680Applicable tax rates 24% 24% Taxation at applicable tax rates 3,201 2,323Previous year (over) / under accrual (23) 288Tax effect of non-taxable income (1,775) (1,189)Tax effect of non-deductible expenses 455 671Effect on opening deferred taxes due to reduction in tax rate 114 --Other 22 10 1,994 2,103
During 2007, changes in the Income tax law were approved. The applicable tax rate for 2007 was 24% (2006: 24%) and for future periods it will be 21% for 2008, 20% for 2009 and 19% for 2010 onwards.
Deferred income tax is calculated on all temporary differences under the liability method using the income tax rate of 20% enacted for 2009 as the management expects that the majority of temporary differences will be reversed in 2009.
The movement on the deferred tax account is as follows:
(CZKm) 2007 2006
At 1 January 192 347 Statement of income charge (364) (171)Available-for-sale securities Fair value remeasurement (Note: 28) 433 162 Transfer to net profit (26) (12)Cash-flow hedges Fair value remeasurement (Note: 28) 398 (272) Transfer to net profit 71 138 At 31 December 704 192
Deferred income tax asset and liability are attributable to the following items:
(CZKm) 2007 2006
Deferred income tax asset Available-for-sale securities 258 (120)Cash-flow hedges 175 (294)Provisions 164 253Legal claim 97 293Accelerated tax depreciation 22 28Impairment of occupied properties 1 13Other temporary differences (13) 19
704 192
The deferred tax charge in the statement of income comprises the following temporary differences:
(CZKm) 2007 2006
Allowances for credit losses - (159)Accelerated tax depreciation (1) 28Impairment of occupied properties (10) (161)Available-for-sale securities (16) 12Provisions (48) 72Deferred tax expense resulting from reduction in tax rate (114) -Legal claim (147) -Other temporary differences (28) 37 (364) (171)

160
– S
epar
ate
Fina
ncia
l Sta
tem
ents
The Bank’s management believes it is probable that the Bank will fully realise its gross deferred income tax assets based upon the Bank’s current and expected future level of taxable profits and the expected offset from gross deferred income tax liabilities.
13. Dividends paid
Final dividends are not accounted for until they have been ratified by a Resolution of the sole share-holder on a profit distribution. Based on the decision from 14 November 2007, a dividend of CZK 1,869 per share was approved for 2006, representing a total dividend of CZK 9,542 m.
At the Annual General Meeting on 21 April 2006, a dividend of CZK 2,023 m per share was approved in respect of 2005 net profit, representing a total dividend of CZK 10,327 m.
14. Cash and balances with central banks
(CZKm) 2007 2006
Cash 9,366 9,290Mandatory minimum reserves 3,200 7,487Other balances with central banks 19,343 15,073 31,909 31,850
Mandatory minimum reserves are not available for use in the Bank’s day-to-day operations.
The Czech National Bank (CNB) pays interest on the mandatory minimum reserve balances based on the official CNB two-week repo rate. The National Bank of Slovakia paid interest on the mandatory minimum reserve balances at 1.5% in both 2007 and 2006.
15. Financials assets at fair value through profit or loss
(CZKm) 2007 2006
Financial assets held for trading Loans and advances Reverse repo transactions 47,138 66,853 Money market placements 110,241 37,236Debt instruments 56,521 36,837Debt securities pledged as collateral 3,923 766Derivative contracts (Note: 19) 14,459 11,136 232,282 152,828
Financial assets designated at fair value through profit or loss Debt instruments 27,714 28,482Debt securities pledged as collateral 1,364 - 29,078 28,482 Financial assets at fair value through profit or loss 261,360 181,310
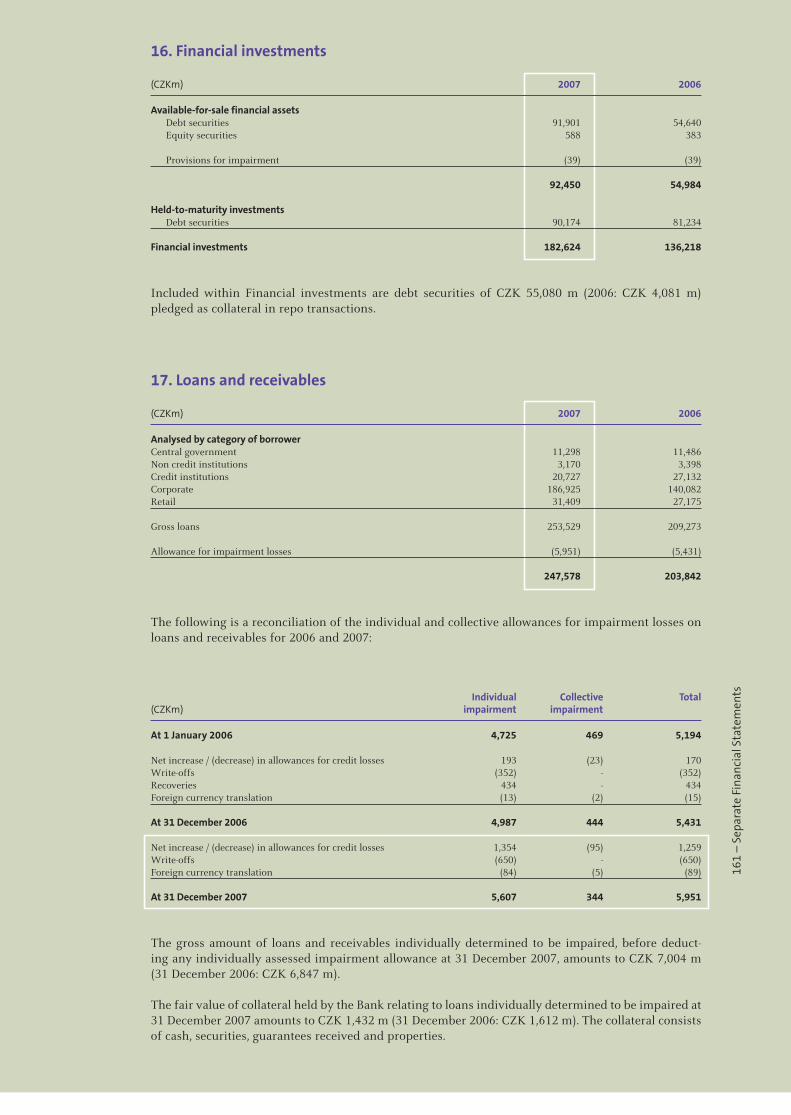
161
– S
epar
ate
Fina
ncia
l Sta
tem
ents
16. Financial investments
(CZKm) 2007 2006
Available-for-sale financial assets Debt securities 91,901 54,640 Equity securities 588 383 Provisions for impairment (39) (39) 92,450 54,984 Held-to-maturity investments Debt securities 90,174 81,234 Financial investments 182,624 136,218
Included within Financial investments are debt securities of CZK 55,080 m (2006: CZK 4,081 m) pledged as collateral in repo transactions.
17. Loans and receivables
(CZKm) 2007 2006
Analysed by category of borrower Central government 11,298 11,486Non credit institutions 3,170 3,398Credit institutions 20,727 27,132Corporate 186,925 140,082Retail 31,409 27,175 Gross loans 253,529 209,273 Allowance for impairment losses (5,951) (5,431) 247,578 203,842
The following is a reconciliation of the individual and collective allowances for impairment losses on loans and receivables for 2006 and 2007:
Individual Collective Total(CZKm) impairment impairment
At 1 January 2006 4,725 469 5,194 Net increase / (decrease) in allowances for credit losses 193 (23) 170Write-offs (352) - (352)Recoveries 434 - 434Foreign currency translation (13) (2) (15) At 31 December 2006 4,987 444 5,431 Net increase / (decrease) in allowances for credit losses 1,354 (95) 1,259Write-offs (650) - (650)Foreign currency translation (84) (5) (89) At 31 December 2007 5,607 344 5,951
The gross amount of loans and receivables individually determined to be impaired, before deduct-ing any individually assessed impairment allowance at 31 December 2007, amounts to CZK 7,004 m (31 December 2006: CZK 6,847 m).
The fair value of collateral held by the Bank relating to loans individually determined to be impaired at 31 December 2007 amounts to CZK 1,432 m (31 December 2006: CZK 1,612 m). The collateral consists of cash, securities, guarantees received and properties.
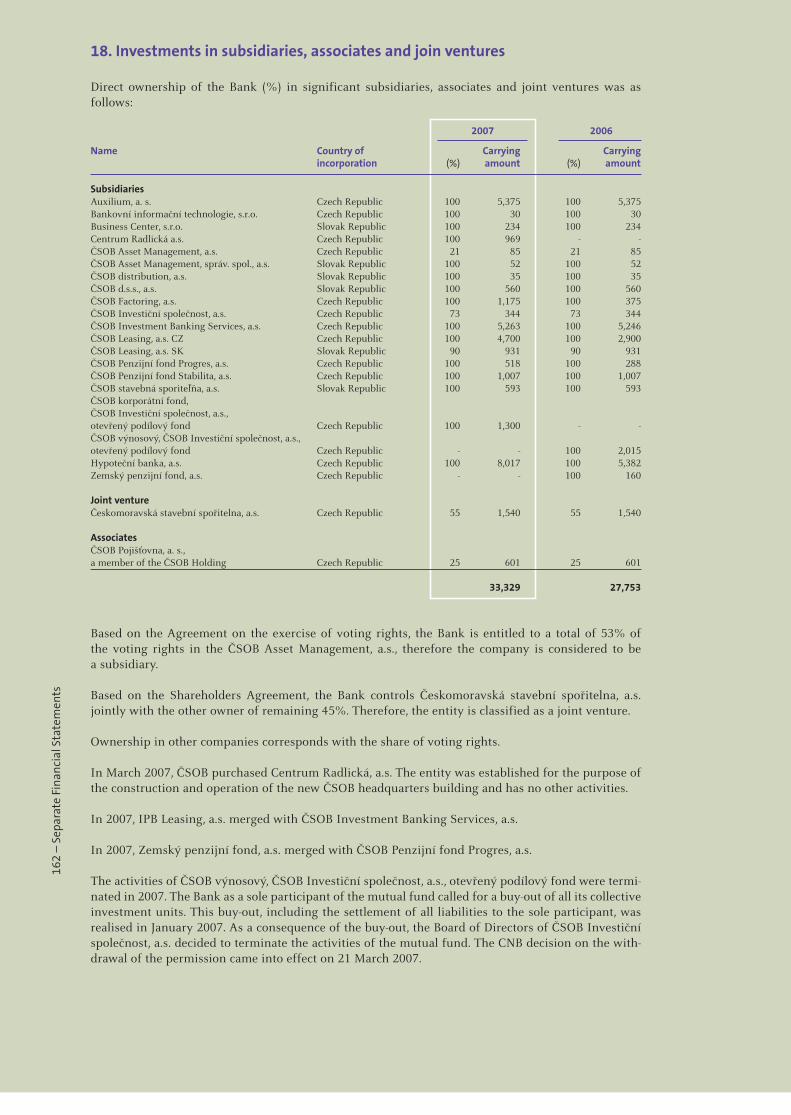
162
– S
epar
ate
Fina
ncia
l Sta
tem
ents
18. Investments in subsidiaries, associates and join ventures
Direct ownership of the Bank (%) in significant subsidiaries, associates and joint ventures was as follows:
2007 2006
Name Country of Carrying Carrying incorporation (%) amount (%) amount
Subsidiaries Auxilium, a. s. Czech Republic 100 5,375 100 5,375Bankovní informační technologie, s.r.o. Czech Republic 100 30 100 30Business Center, s.r.o. Slovak Republic 100 234 100 234Centrum Radlická a.s. Czech Republic 100 969 - -ČSOB Asset Management, a.s. Czech Republic 21 85 21 85ČSOB Asset Management, správ. spol., a.s. Slovak Republic 100 52 100 52ČSOB distribution, a.s. Slovak Republic 100 35 100 35ČSOB d.s.s., a.s. Slovak Republic 100 560 100 560ČSOB Factoring, a.s. Czech Republic 100 1,175 100 375ČSOB Investiční společnost, a.s. Czech Republic 73 344 73 344ČSOB Investment Banking Services, a.s. Czech Republic 100 5,263 100 5,246ČSOB Leasing, a.s. CZ Czech Republic 100 4,700 100 2,900ČSOB Leasing, a.s. SK Slovak Republic 90 931 90 931ČSOB Penzijní fond Progres, a.s. Czech Republic 100 518 100 288ČSOB Penzijní fond Stabilita, a.s. Czech Republic 100 1,007 100 1,007ČSOB stavebná sporiteľňa, a.s. Slovak Republic 100 593 100 593ČSOB korporátní fond, ČSOB Investiční společnost, a.s., otevřený podílový fond Czech Republic 100 1,300 - -ČSOB výnosový, ČSOB Investiční společnost, a.s., otevřený podílový fond Czech Republic - - 100 2,015Hypoteční banka, a.s. Czech Republic 100 8,017 100 5,382Zemský penzijní fond, a.s. Czech Republic - - 100 160 Joint venture Českomoravská stavební spořitelna, a.s. Czech Republic 55 1,540 55 1,540 Associates ČSOB Pojišťovna, a. s., a member of the ČSOB Holding Czech Republic 25 601 25 601
33,329 27,753
Based on the Agreement on the exercise of voting rights, the Bank is entitled to a total of 53% of the voting rights in the ČSOB Asset Management, a.s., therefore the company is considered to be a subsidiary.
Based on the Shareholders Agreement, the Bank controls Českomoravská stavební spořitelna, a.s. jointly with the other owner of remaining 45%. Therefore, the entity is classified as a joint venture.
Ownership in other companies corresponds with the share of voting rights.
In March 2007, ČSOB purchased Centrum Radlická, a.s. The entity was established for the purpose of the construction and operation of the new ČSOB headquarters building and has no other activities.
In 2007, IPB Leasing, a.s. merged with ČSOB Investment Banking Services, a.s.
In 2007, Zemský penzijní fond, a.s. merged with ČSOB Penzijní fond Progres, a.s.
The activities of ČSOB výnosový, ČSOB Investiční společnost, a.s., otevřený podílový fond were termi-nated in 2007. The Bank as a sole participant of the mutual fund called for a buy-out of all its collective investment units. This buy-out, including the settlement of all liabilities to the sole participant, was realised in January 2007. As a consequence of the buy-out, the Board of Directors of ČSOB Investiční společnost, a.s. decided to terminate the activities of the mutual fund. The CNB decision on the with-drawal of the permission came into effect on 21 March 2007.
163
– S
epar
ate
Fina
ncia
l Sta
tem
ents
19. Derivative financial instruments
Derivative instruments are utilised by the Bank for trading and hedging purposes. Derivative instru-ments include swaps, forwards and option contracts. A swap agreement is a contract between two parties to exchange cash flows based on specified underlying notional amounts, assets and/or indices. Forward contracts are agreements to buy or sell a quantity of a financial instrument, index, currency or commodity at a predetermined future date and rate or price. An option contract is an agreement that conveys to the purchaser the right, but not the obligation, to buy or sell a quantity of a financial instrument, index, currency or commodity at a predetermined rate or price at a time or during a period in the future.
Credit risk associated with derivative financial instruments
By using derivative instruments, the Bank is exposed to credit risk in the event of non-performance by counterparties to the derivative instruments. If a counterparty fails to perform, credit risk is equal to the positive fair value of the derivatives with that counterparty. When the fair value of a derivative is positive, the Bank bears the risk of loss; conversely, when the fair value of a derivative is negative, the counterparty bears the risk of loss (or credit risk). The Bank minimises credit risk through credit approvals, limits and monitoring procedures. Furthermore, the Bank obtains collateral where appro-priate and uses bilateral master netting arrangements.
There are no significant concentrations of trading and hedging derivative credit exposures other than with the international banking sector, which are the usual counterparties to transactions undertaken for trading and managing the Bank’s own risks.
All derivatives are traded over-the-counter.
The maximum credit risk on the Bank’s outstanding non-credit derivatives is measured as the cost of replacing their cash flows with positive fair value if the counterparties default, less the effects of bilateral netting arrangements and collateral held. The Bank’s actual credit exposures are less than the positive fair value amounts shown in the derivative tables below as netting arrangements and collateral have not been considered.
Trading derivatives
The Bank’s trading activities primarily involve providing various derivative products to its customers and managing trading positions for its own account. Trading derivatives also include those derivatives which are used for asset and liability management (ALM) purposes to manage the interest rate posi-tion of the Banking Book and which do not meet the criteria of hedge accounting. The Bank used single currency interest rate swaps to convert fixed rate assets to floating rates.
The contract or notional amounts and positive and negative fair values of the Bank’s outstanding derivative trading positions as at 31 December 2007 and 2006 are set out in the table below. The contract or notional amounts represent the volume of outstanding transactions at a point in time; they do not represent the potential for gain or loss associated with market risk or credit risk of such transactions.
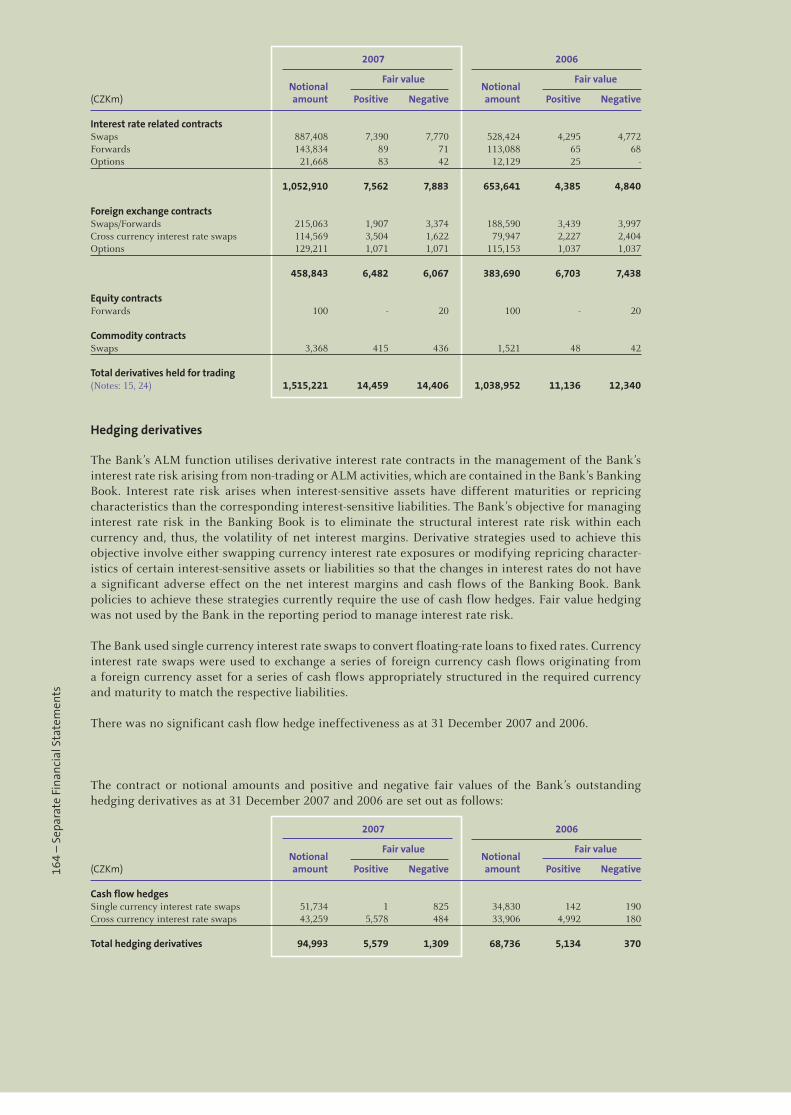
164
– S
epar
ate
Fina
ncia
l Sta
tem
ents
2007 2006
Notional
Fair value Notional
Fair value
(CZKm) amount Positive Negative amount Positive Negative
Interest rate related contracts Swaps 887,408 7,390 7,770 528,424 4,295 4,772Forwards 143,834 89 71 113,088 65 68Options 21,668 83 42 12,129 25 - 1,052,910 7,562 7,883 653,641 4,385 4,840 Foreign exchange contracts Swaps/Forwards 215,063 1,907 3,374 188,590 3,439 3,997Cross currency interest rate swaps 114,569 3,504 1,622 79,947 2,227 2,404Options 129,211 1,071 1,071 115,153 1,037 1,037 458,843 6,482 6,067 383,690 6,703 7,438 Equity contractsForwards 100 - 20 100 - 20 Commodity contracts Swaps 3,368 415 436 1,521 48 42 Total derivatives held for trading(Notes: 15, 24) 1,515,221 14,459 14,406 1,038,952 11,136 12,340
Hedging derivatives
The Bank’s ALM function utilises derivative interest rate contracts in the management of the Bank’s interest rate risk arising from non-trading or ALM activities, which are contained in the Bank’s Banking Book. Interest rate risk arises when interest-sensitive assets have different maturities or repricing characteristics than the corresponding interest-sensitive liabilities. The Bank’s objective for managing interest rate risk in the Banking Book is to eliminate the structural interest rate risk within each currency and, thus, the volatility of net interest margins. Derivative strategies used to achieve this objective involve either swapping currency interest rate exposures or modifying repricing character-istics of certain interest-sensitive assets or liabilities so that the changes in interest rates do not have a significant adverse effect on the net interest margins and cash flows of the Banking Book. Bank policies to achieve these strategies currently require the use of cash flow hedges. Fair value hedging was not used by the Bank in the reporting period to manage interest rate risk.
The Bank used single currency interest rate swaps to convert floating-rate loans to fixed rates. Currency interest rate swaps were used to exchange a series of foreign currency cash flows originating from a foreign currency asset for a series of cash flows appropriately structured in the required currency and maturity to match the respective liabilities.
There was no significant cash flow hedge ineffectiveness as at 31 December 2007 and 2006.
The contract or notional amounts and positive and negative fair values of the Bank’s outstanding hedging derivatives as at 31 December 2007 and 2006 are set out as follows:
2007 2006
Notional
Fair value Notional
Fair value
(CZKm) amount Positive Negative amount Positive Negative
Cash flow hedges Single currency interest rate swaps 51,734 1 825 34,830 142 190Cross currency interest rate swaps 43,259 5,578 484 33,906 4,992 180
Total hedging derivatives 94,993 5,579 1,309 68,736 5,134 370
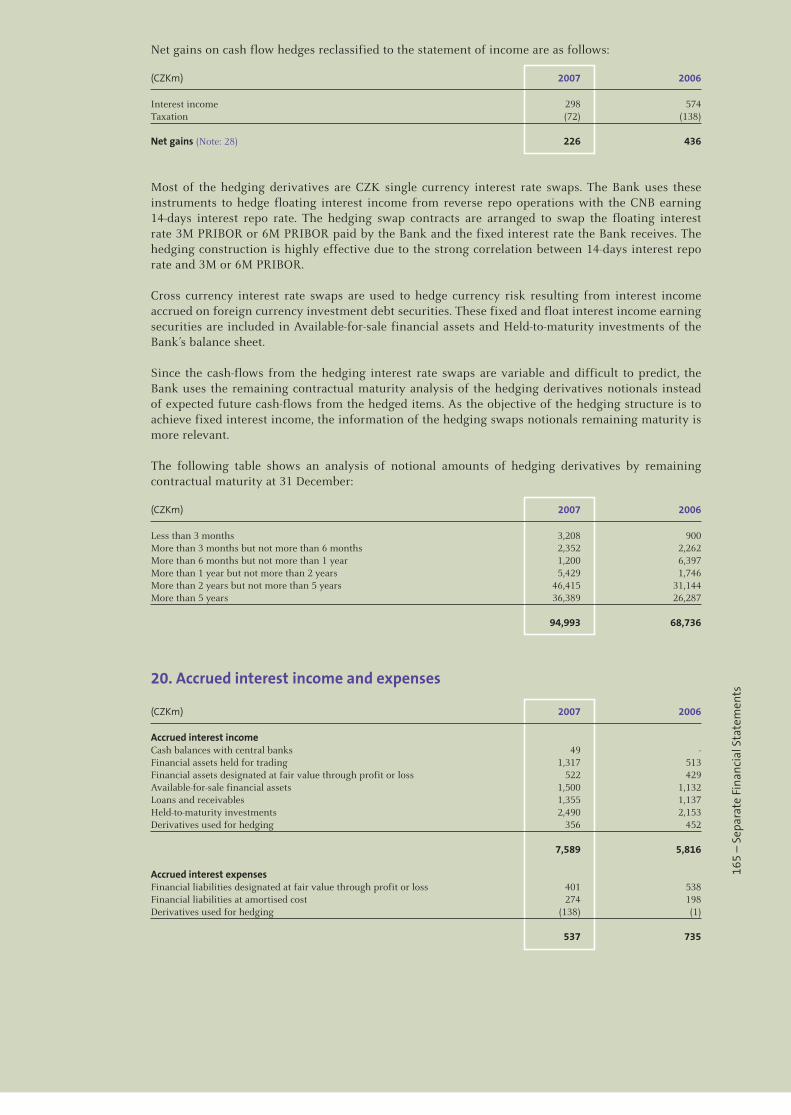
165
– S
epar
ate
Fina
ncia
l Sta
tem
ents
Net gains on cash flow hedges reclassified to the statement of income are as follows:
(CZKm) 2007 2006
Interest income 298 574Taxation (72) (138) Net gains (Note: 28) 226 436
Most of the hedging derivatives are CZK single currency interest rate swaps. The Bank uses these instruments to hedge floating interest income from reverse repo operations with the CNB earning 14-days interest repo rate. The hedging swap contracts are arranged to swap the floating interest rate 3M PRIBOR or 6M PRIBOR paid by the Bank and the fixed interest rate the Bank receives. The hedging construction is highly effective due to the strong correlation between 14-days interest repo rate and 3M or 6M PRIBOR.
Cross currency interest rate swaps are used to hedge currency risk resulting from interest income accrued on foreign currency investment debt securities. These fixed and float interest income earning securities are included in Available-for-sale financial assets and Held-to-maturity investments of the Bank’s balance sheet.
Since the cash-flows from the hedging interest rate swaps are variable and difficult to predict, the Bank uses the remaining contractual maturity analysis of the hedging derivatives notionals instead of expected future cash-flows from the hedged items. As the objective of the hedging structure is to achieve fixed interest income, the information of the hedging swaps notionals remaining maturity is more relevant.
The following table shows an analysis of notional amounts of hedging derivatives by remaining contractual maturity at 31 December:
(CZKm) 2007 2006
Less than 3 months 3,208 900More than 3 months but not more than 6 months 2,352 2,262More than 6 months but not more than 1 year 1,200 6,397More than 1 year but not more than 2 years 5,429 1,746More than 2 years but not more than 5 years 46,415 31,144More than 5 years 36,389 26,287 94,993 68,736
20. Accrued interest income and expenses
(CZKm) 2007 2006
Accrued interest income Cash balances with central banks 49 -Financial assets held for trading 1,317 513Financial assets designated at fair value through profit or loss 522 429Available-for-sale financial assets 1,500 1,132Loans and receivables 1,355 1,137Held-to-maturity investments 2,490 2,153Derivatives used for hedging 356 452 7,589 5,816
Accrued interest expenses Financial liabilities designated at fair value through profit or loss 401 538Financial liabilities at amortised cost 274 198Derivatives used for hedging (138) (1) 537 735
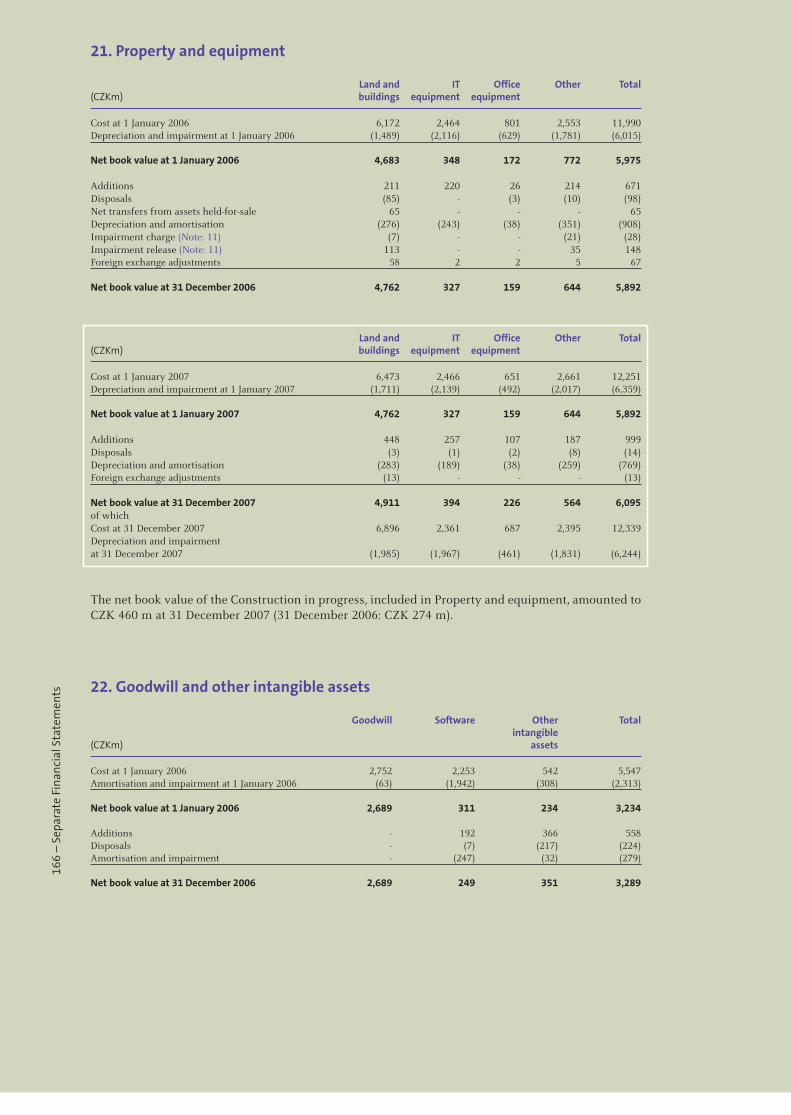
166
– S
epar
ate
Fina
ncia
l Sta
tem
ents
21. Property and equipment
Land and IT Office Other Total(CZKm) buildings equipment equipment
Cost at 1 January 2006 6,172 2,464 801 2,553 11,990Depreciation and impairment at 1 January 2006 (1,489) (2,116) (629) (1,781) (6,015)
Net book value at 1 January 2006 4,683 348 172 772 5,975 Additions 211 220 26 214 671Disposals (85) - (3) (10) (98)Net transfers from assets held-for-sale 65 - - - 65Depreciation and amortisation (276) (243) (38) (351) (908)Impairment charge (Note: 11) (7) - - (21) (28)Impairment release (Note: 11) 113 - - 35 148Foreign exchange adjustments 58 2 2 5 67 Net book value at 31 December 2006 4,762 327 159 644 5,892
Land and IT Office Other Total(CZKm) buildings equipment equipment
Cost at 1 January 2007 6,473 2,466 651 2,661 12,251Depreciation and impairment at 1 January 2007 (1,711) (2,139) (492) (2,017) (6,359)
Net book value at 1 January 2007 4,762 327 159 644 5,892 Additions 448 257 107 187 999Disposals (3) (1) (2) (8) (14)Depreciation and amortisation (283) (189) (38) (259) (769)Foreign exchange adjustments (13) - - - (13) Net book value at 31 December 2007 4,911 394 226 564 6,095of which Cost at 31 December 2007 6,896 2,361 687 2,395 12,339Depreciation and impairment at 31 December 2007 (1,985) (1,967) (461) (1,831) (6,244)
The net book value of the Construction in progress, included in Property and equipment, amounted to CZK 460 m at 31 December 2007 (31 December 2006: CZK 274 m).
22. Goodwill and other intangible assets
Goodwill Software Other Total intangible (CZKm) assets
Cost at 1 January 2006 2,752 2,253 542 5,547Amortisation and impairment at 1 January 2006 (63) (1,942) (308) (2,313)
Net book value at 1 January 2006 2,689 311 234 3,234 Additions - 192 366 558Disposals - (7) (217) (224)Amortisation and impairment - (247) (32) (279) Net book value at 31 December 2006 2,689 249 351 3,289
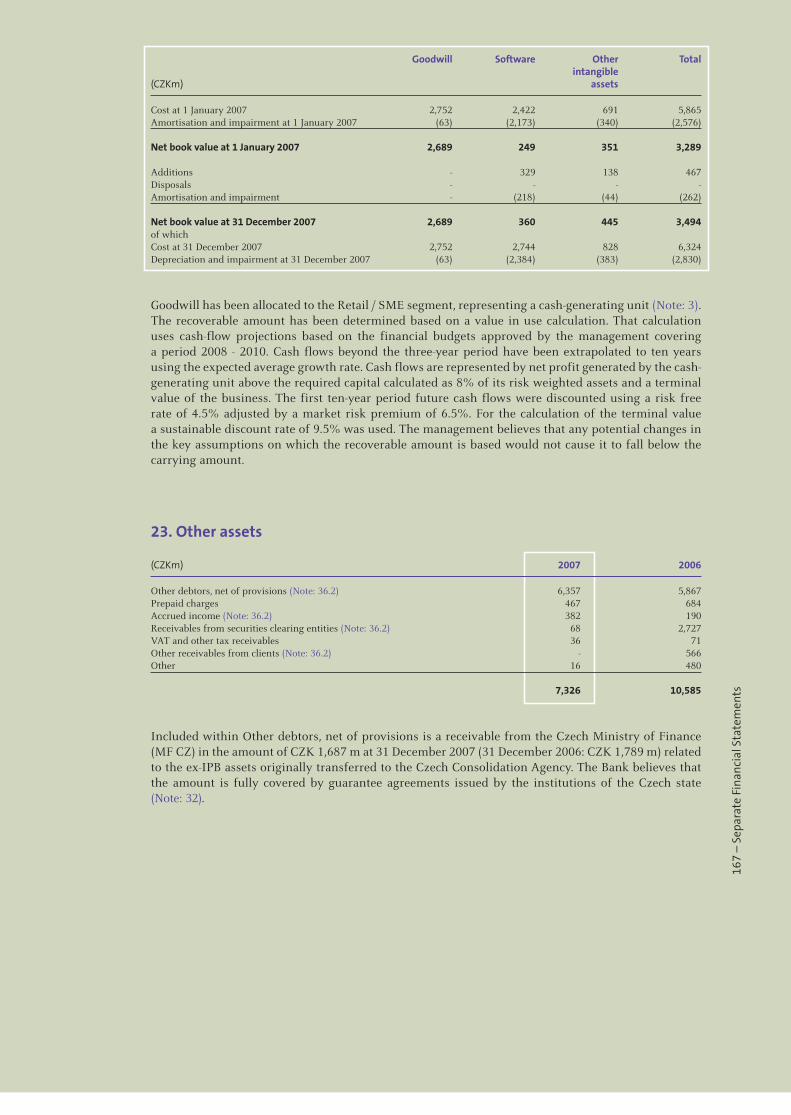
167
– S
epar
ate
Fina
ncia
l Sta
tem
ents
Goodwill Software Other Total intangible (CZKm) assets
Cost at 1 January 2007 2,752 2,422 691 5,865Amortisation and impairment at 1 January 2007 (63) (2,173) (340) (2,576)
Net book value at 1 January 2007 2,689 249 351 3,289 Additions - 329 138 467Disposals - - - -Amortisation and impairment - (218) (44) (262) Net book value at 31 December 2007 2,689 360 445 3,494of which Cost at 31 December 2007 2,752 2,744 828 6,324Depreciation and impairment at 31 December 2007 (63) (2,384) (383) (2,830)
Goodwill has been allocated to the Retail / SME segment, representing a cash-generating unit (Note: 3). The recoverable amount has been determined based on a value in use calculation. That calculation uses cash-flow projections based on the financial budgets approved by the management covering a period 2008 - 2010. Cash flows beyond the three-year period have been extrapolated to ten years using the expected average growth rate. Cash flows are represented by net profit generated by the cash-generating unit above the required capital calculated as 8% of its risk weighted assets and a terminal value of the business. The first ten-year period future cash flows were discounted using a risk free rate of 4.5% adjusted by a market risk premium of 6.5%. For the calculation of the terminal value a sustainable discount rate of 9.5% was used. The management believes that any potential changes in the key assumptions on which the recoverable amount is based would not cause it to fall below the carrying amount.
23. Other assets
(CZKm) 2007 2006
Other debtors, net of provisions (Note: 36.2) 6,357 5,867Prepaid charges 467 684Accrued income (Note: 36.2) 382 190Receivables from securities clearing entities (Note: 36.2) 68 2,727VAT and other tax receivables 36 71Other receivables from clients (Note: 36.2) - 566Other 16 480 7,326 10,585
Included within Other debtors, net of provisions is a receivable from the Czech Ministry of Finance (MF CZ) in the amount of CZK 1,687 m at 31 December 2007 (31 December 2006: CZK 1,789 m) related to the ex-IPB assets originally transferred to the Czech Consolidation Agency. The Bank believes that the amount is fully covered by guarantee agreements issued by the institutions of the Czech state (Note: 32).
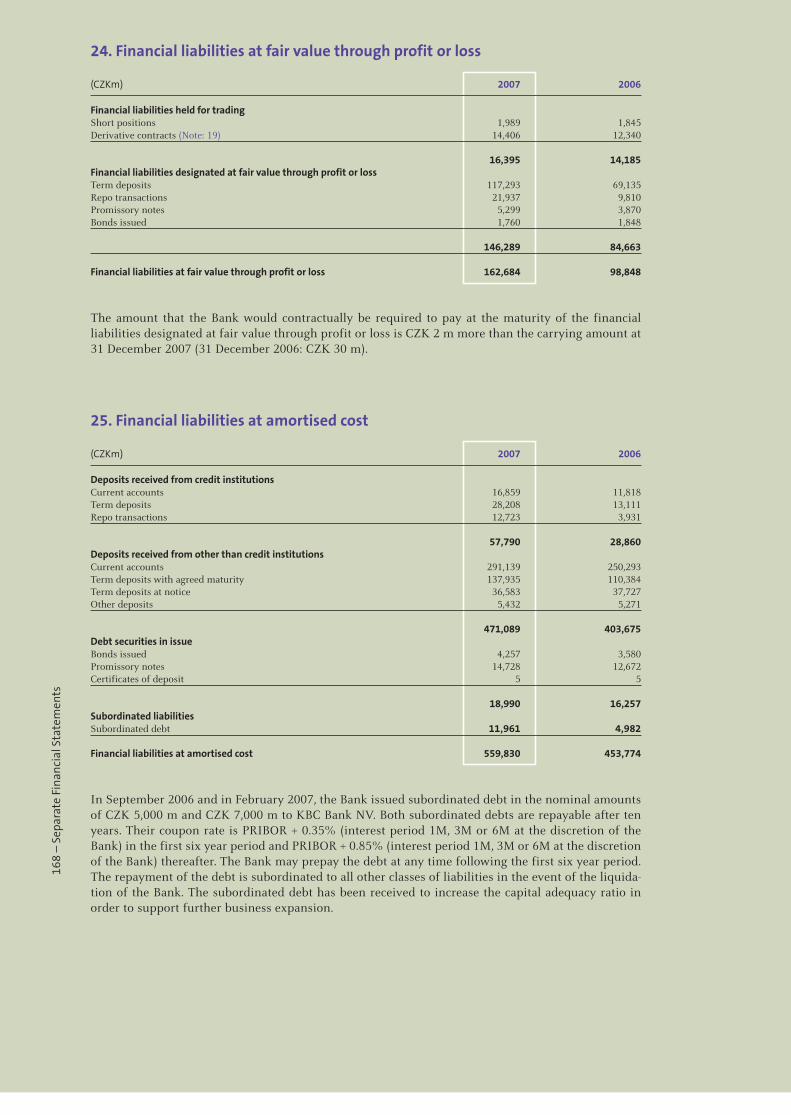
168
– S
epar
ate
Fina
ncia
l Sta
tem
ents
24. Financial liabilities at fair value through profit or loss
(CZKm) 2007 2006
Financial liabilities held for trading Short positions 1,989 1,845Derivative contracts (Note: 19) 14,406 12,340 16,395 14,185Financial liabilities designated at fair value through profit or loss Term deposits 117,293 69,135Repo transactions 21,937 9,810Promissory notes 5,299 3,870Bonds issued 1,760 1,848 146,289 84,663 Financial liabilities at fair value through profit or loss 162,684 98,848
The amount that the Bank would contractually be required to pay at the maturity of the financial liabilities designated at fair value through profit or loss is CZK 2 m more than the carrying amount at 31 December 2007 (31 December 2006: CZK 30 m).
25. Financial liabilities at amortised cost
(CZKm) 2007 2006
Deposits received from credit institutions Current accounts 16,859 11,818Term deposits 28,208 13,111Repo transactions 12,723 3,931 57,790 28,860Deposits received from other than credit institutions Current accounts 291,139 250,293Term deposits with agreed maturity 137,935 110,384Term deposits at notice 36,583 37,727Other deposits 5,432 5,271 471,089 403,675Debt securities in issue Bonds issued 4,257 3,580Promissory notes 14,728 12,672Certificates of deposit 5 5
18,990 16,257Subordinated liabilities Subordinated debt 11,961 4,982 Financial liabilities at amortised cost 559,830 453,774
In September 2006 and in February 2007, the Bank issued subordinated debt in the nominal amounts of CZK 5,000 m and CZK 7,000 m to KBC Bank NV. Both subordinated debts are repayable after ten years. Their coupon rate is PRIBOR + 0.35% (interest period 1M, 3M or 6M at the discretion of the Bank) in the first six year period and PRIBOR + 0.85% (interest period 1M, 3M or 6M at the discretion of the Bank) thereafter. The Bank may prepay the debt at any time following the first six year period. The repayment of the debt is subordinated to all other classes of liabilities in the event of the liquida-tion of the Bank. The subordinated debt has been received to increase the capital adequacy ratio in order to support further business expansion.
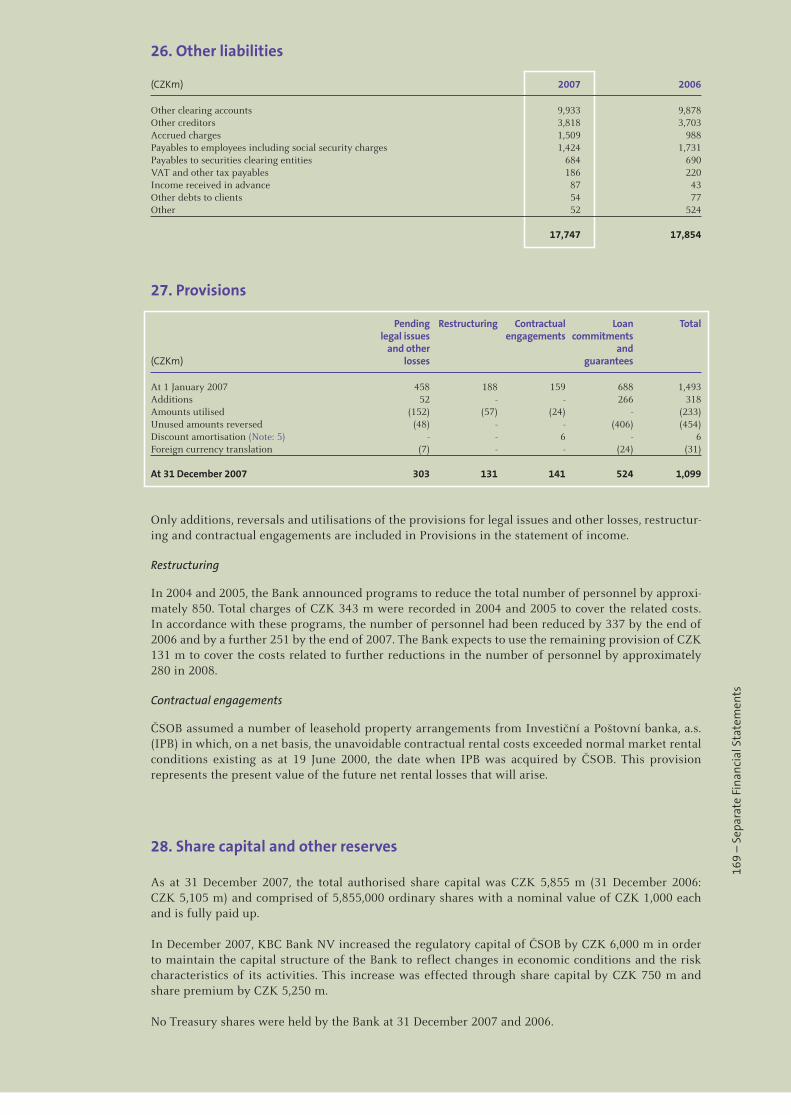
169
– S
epar
ate
Fina
ncia
l Sta
tem
ents
26. Other liabilities
(CZKm) 2007 2006
Other clearing accounts 9,933 9,878Other creditors 3,818 3,703Accrued charges 1,509 988Payables to employees including social security charges 1,424 1,731Payables to securities clearing entities 684 690VAT and other tax payables 186 220Income received in advance 87 43Other debts to clients 54 77Other 52 524 17,747 17,854
27. Provisions
Pending Restructuring Contractual Loan Total legal issues engagements commitments and other and(CZKm) losses guarantees
At 1 January 2007 458 188 159 688 1,493Additions 52 - - 266 318Amounts utilised (152) (57) (24) - (233)Unused amounts reversed (48) - - (406) (454)Discount amortisation (Note: 5) - - 6 - 6Foreign currency translation (7) - - (24) (31) At 31 December 2007 303 131 141 524 1,099
Only additions, reversals and utilisations of the provisions for legal issues and other losses, restructur-ing and contractual engagements are included in Provisions in the statement of income.
Restructuring
In 2004 and 2005, the Bank announced programs to reduce the total number of personnel by approxi-mately 850. Total charges of CZK 343 m were recorded in 2004 and 2005 to cover the related costs. In accordance with these programs, the number of personnel had been reduced by 337 by the end of 2006 and by a further 251 by the end of 2007. The Bank expects to use the remaining provision of CZK 131 m to cover the costs related to further reductions in the number of personnel by approximately 280 in 2008.
Contractual engagements
ČSOB assumed a number of leasehold property arrangements from Investiční a Poštovní banka, a.s. (IPB) in which, on a net basis, the unavoidable contractual rental costs exceeded normal market rental conditions existing as at 19 June 2000, the date when IPB was acquired by ČSOB. This provision represents the present value of the future net rental losses that will arise.
28. Share capital and other reserves
As at 31 December 2007, the total authorised share capital was CZK 5,855 m (31 December 2006: CZK 5,105 m) and comprised of 5,855,000 ordinary shares with a nominal value of CZK 1,000 each and is fully paid up.
In December 2007, KBC Bank NV increased the regulatory capital of ČSOB by CZK 6,000 m in order to maintain the capital structure of the Bank to reflect changes in economic conditions and the risk characteristics of its activities. This increase was effected through share capital by CZK 750 m and share premium by CZK 5,250 m.
No Treasury shares were held by the Bank at 31 December 2007 and 2006.
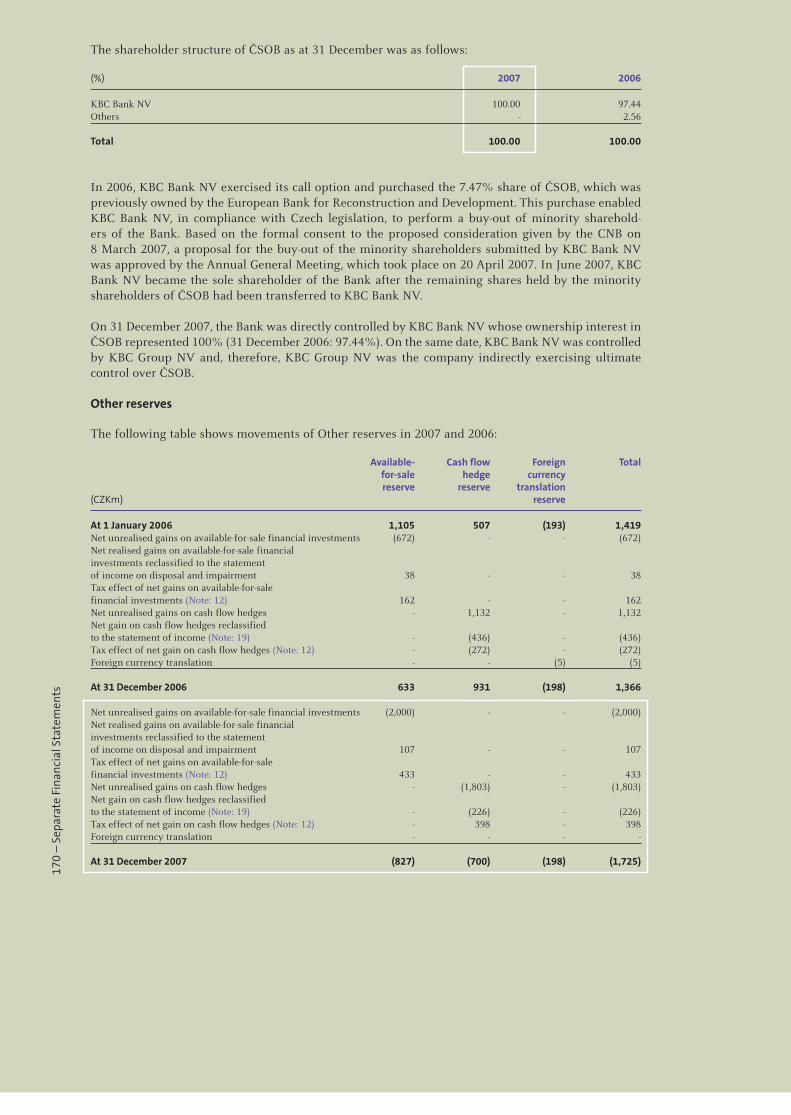
170
– S
epar
ate
Fina
ncia
l Sta
tem
ents
The shareholder structure of ČSOB as at 31 December was as follows:
(%) 2007 2006
KBC Bank NV 100.00 97.44Others - 2.56 Total 100.00 100.00
In 2006, KBC Bank NV exercised its call option and purchased the 7.47% share of ČSOB, which was previously owned by the European Bank for Reconstruction and Development. This purchase enabled KBC Bank NV, in compliance with Czech legislation, to perform a buy-out of minority sharehold-ers of the Bank. Based on the formal consent to the proposed consideration given by the CNB on 8 March 2007, a proposal for the buy-out of the minority shareholders submitted by KBC Bank NV was approved by the Annual General Meeting, which took place on 20 April 2007. In June 2007, KBC Bank NV became the sole shareholder of the Bank after the remaining shares held by the minority shareholders of ČSOB had been transferred to KBC Bank NV.
On 31 December 2007, the Bank was directly controlled by KBC Bank NV whose ownership interest in ČSOB represented 100% (31 December 2006: 97.44%). On the same date, KBC Bank NV was controlled by KBC Group NV and, therefore, KBC Group NV was the company indirectly exercising ultimate control over ČSOB.
Other reserves
The following table shows movements of Other reserves in 2007 and 2006:
Available- Cash flow Foreign Total for-sale hedge currency reserve reserve translation (CZKm) reserve
At 1 January 2006 1,105 507 (193) 1,419Net unrealised gains on available-for-sale financial investments (672) - - (672)Net realised gains on available-for-sale financial investments reclassified to the statement of income on disposal and impairment 38 - - 38Tax effect of net gains on available-for-sale financial investments (Note: 12) 162 - - 162Net unrealised gains on cash flow hedges - 1,132 - 1,132Net gain on cash flow hedges reclassified to the statement of income (Note: 19) - (436) - (436)Tax effect of net gain on cash flow hedges (Note: 12) - (272) - (272)Foreign currency translation - - (5) (5) At 31 December 2006 633 931 (198) 1,366 Net unrealised gains on available-for-sale financial investments (2,000) - - (2,000)Net realised gains on available-for-sale financial investments reclassified to the statement of income on disposal and impairment 107 - - 107Tax effect of net gains on available-for-sale financial investments (Note: 12) 433 - - 433Net unrealised gains on cash flow hedges - (1,803) - (1,803)Net gain on cash flow hedges reclassified to the statement of income (Note: 19) - (226) - (226)Tax effect of net gain on cash flow hedges (Note: 12) - 398 - 398Foreign currency translation - - - - At 31 December 2007 (827) (700) (198) (1,725)
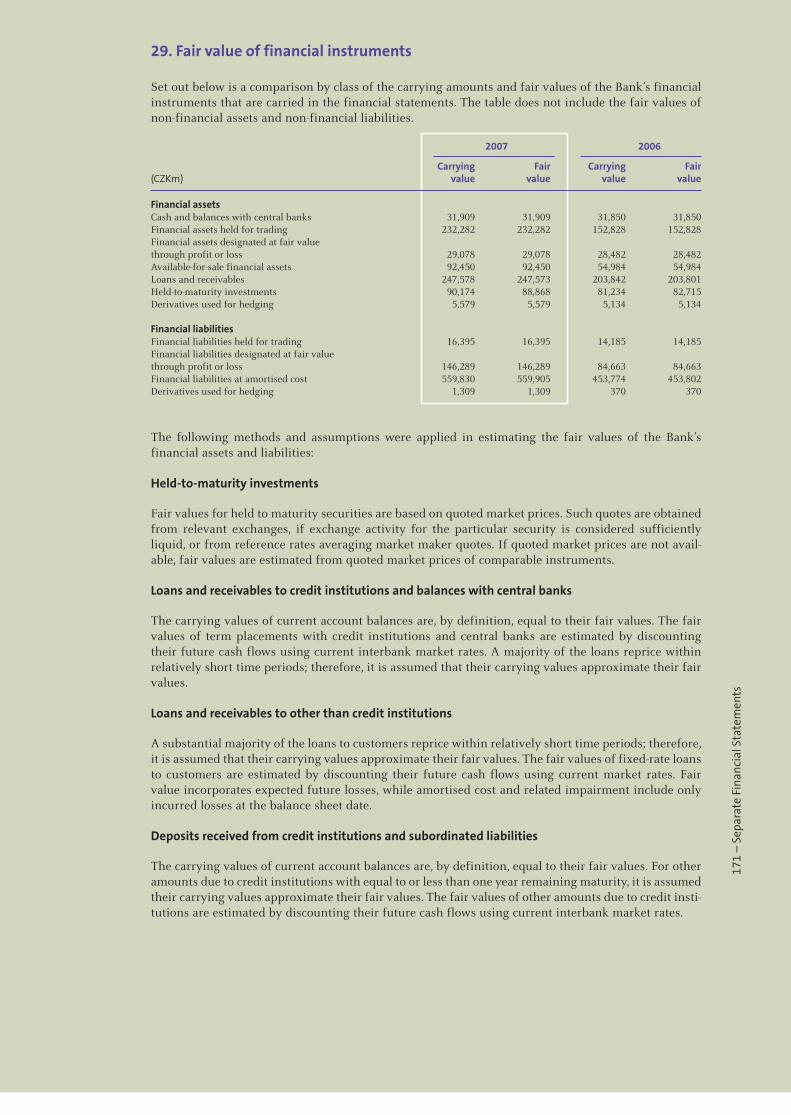
171
– S
epar
ate
Fina
ncia
l Sta
tem
ents
29. Fair value of financial instruments
Set out below is a comparison by class of the carrying amounts and fair values of the Bank’s financial instruments that are carried in the financial statements. The table does not include the fair values of non-financial assets and non-financial liabilities.
2007 2006
Carrying Fair Carrying Fair(CZKm) value value value value
Financial assets Cash and balances with central banks 31,909 31,909 31,850 31,850Financial assets held for trading 232,282 232,282 152,828 152,828Financial assets designated at fair valuethrough profit or loss 29,078 29,078 28,482 28,482Available-for-sale financial assets 92,450 92,450 54,984 54,984Loans and receivables 247,578 247,573 203,842 203,801Held-to-maturity investments 90,174 88,868 81,234 82,715Derivatives used for hedging 5,579 5,579 5,134 5,134 Financial liabilities Financial liabilities held for trading 16,395 16,395 14,185 14,185Financial liabilities designated at fair value through profit or loss 146,289 146,289 84,663 84,663Financial liabilities at amortised cost 559,830 559,905 453,774 453,802Derivatives used for hedging 1,309 1,309 370 370
The following methods and assumptions were applied in estimating the fair values of the Bank’s financial assets and liabilities:
Held-to-maturity investments
Fair values for held to maturity securities are based on quoted market prices. Such quotes are obtained from relevant exchanges, if exchange activity for the particular security is considered sufficiently liquid, or from reference rates averaging market maker quotes. If quoted market prices are not avail-able, fair values are estimated from quoted market prices of comparable instruments.
Loans and receivables to credit institutions and balances with central banks
The carrying values of current account balances are, by definition, equal to their fair values. The fair values of term placements with credit institutions and central banks are estimated by discounting their future cash flows using current interbank market rates. A majority of the loans reprice within relatively short time periods; therefore, it is assumed that their carrying values approximate their fair values.
Loans and receivables to other than credit institutions
A substantial majority of the loans to customers reprice within relatively short time periods; therefore, it is assumed that their carrying values approximate their fair values. The fair values of fixed-rate loans to customers are estimated by discounting their future cash flows using current market rates. Fair value incorporates expected future losses, while amortised cost and related impairment include only incurred losses at the balance sheet date.
Deposits received from credit institutions and subordinated liabilities
The carrying values of current account balances are, by definition, equal to their fair values. For other amounts due to credit institutions with equal to or less than one year remaining maturity, it is assumed their carrying values approximate their fair values. The fair values of other amounts due to credit insti-tutions are estimated by discounting their future cash flows using current interbank market rates.
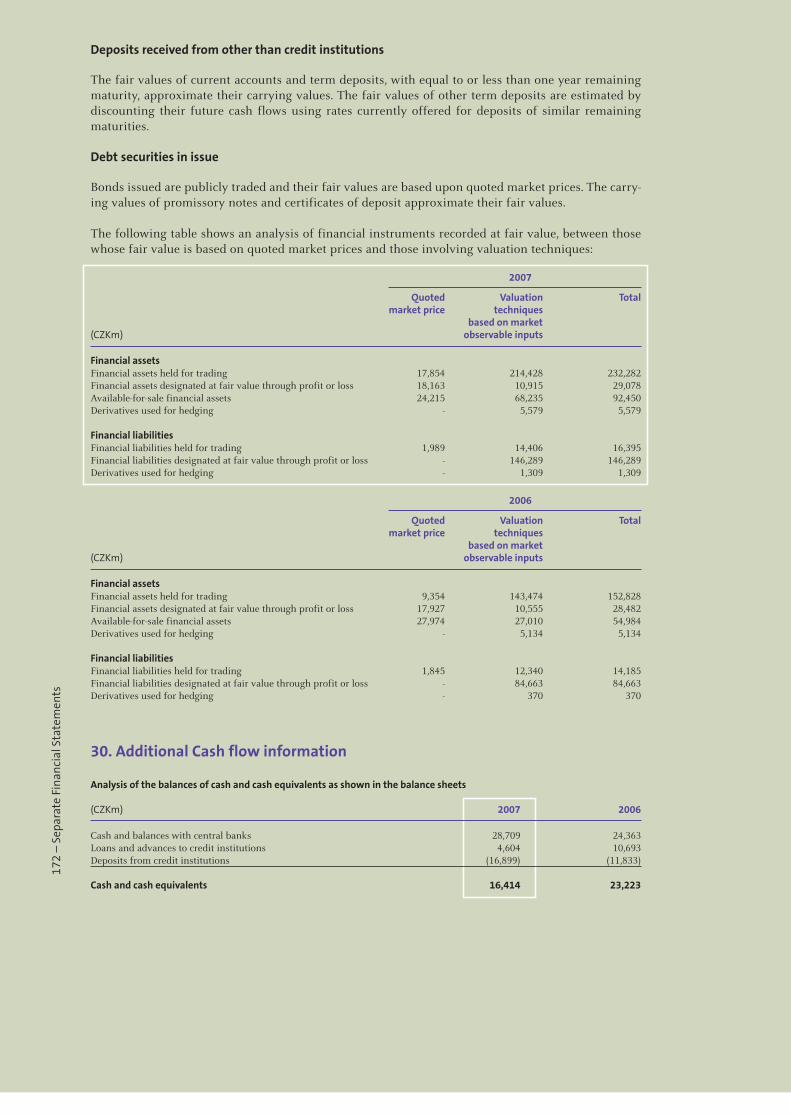
172
– S
epar
ate
Fina
ncia
l Sta
tem
ents
Deposits received from other than credit institutions
The fair values of current accounts and term deposits, with equal to or less than one year remaining maturity, approximate their carrying values. The fair values of other term deposits are estimated by discounting their future cash flows using rates currently offered for deposits of similar remaining maturities.
Debt securities in issue
Bonds issued are publicly traded and their fair values are based upon quoted market prices. The carry-ing values of promissory notes and certificates of deposit approximate their fair values.
The following table shows an analysis of financial instruments recorded at fair value, between those whose fair value is based on quoted market prices and those involving valuation techniques:
2007
Quoted Valuation Total market price techniques based on market (CZKm) observable inputs
Financial assets Financial assets held for trading 17,854 214,428 232,282Financial assets designated at fair value through profit or loss 18,163 10,915 29,078Available-for-sale financial assets 24,215 68,235 92,450Derivatives used for hedging - 5,579 5,579 Financial liabilities Financial liabilities held for trading 1,989 14,406 16,395Financial liabilities designated at fair value through profit or loss - 146,289 146,289Derivatives used for hedging - 1,309 1,309
2006
Quoted Valuation Total market price techniques based on market (CZKm) observable inputs
Financial assets Financial assets held for trading 9,354 143,474 152,828Financial assets designated at fair value through profit or loss 17,927 10,555 28,482Available-for-sale financial assets 27,974 27,010 54,984Derivatives used for hedging - 5,134 5,134 Financial liabilities Financial liabilities held for trading 1,845 12,340 14,185Financial liabilities designated at fair value through profit or loss - 84,663 84,663Derivatives used for hedging - 370 370
30. Additional Cash flow information
Analysis of the balances of cash and cash equivalents as shown in the balance sheets
(CZKm) 2007 2006
Cash and balances with central banks 28,709 24,363Loans and advances to credit institutions 4,604 10,693Deposits from credit institutions (16,899) (11,833) Cash and cash equivalents 16,414 23,223

173
– S
epar
ate
Fina
ncia
l Sta
tem
ents
Change in operating assets
(CZKm) 2007 2006
Net change in financial assets held for trading (79,454) 23,398Net change in financial assets designated at fair value through profit or loss (596) (9,040)Net change in available-for-sale financial assets (39,334) (1,130)Net change in loans and receivables (46,797) (40,588)Net change in derivatives used for hedging (2,546) (908)Net change in accrued interest income (1,773) 650Net change in other assets 3,259 (1,985) (167,241) (29,603)
Change in operating liabilities
(CZKm) 2007 2006
Net change in financial liabilities held for trading 2,210 4,778Net change in financial liabilities designated at fair value through profit or loss 61,626 (30,389)Net change in financial liabilities at amortised cost 93,299 18,992Net change in derivatives used for hedging 939 (762)Net change in accrued interest expenses (198) (658)Net change in other liabilities (107) (1,493) (157,769) (9,532)
Non-cash items included in profit before tax
(CZKm) 2007 2006
Allowances and provisions for credit losses 1,119 237Depreciation and amortisation 1,031 1,187Amortisation of discounts and premiums 438 551Net property impairment (release) - (120)Provisions (229) (400)Other 14 (291) 2,373 1,164
31. Maturity analysis of assets and liabilities
The following table sets out the financial assets and liabilities of the Bank by remaining expected maturity as at 31 December 2007.
Less than 1 year to More than Without Total(CZKm) 1 year 5 years 5 years maturity
ASSETS Financial assets held for trading 191,692 12,307 13,823 14,460 232,282Financial assets designated at fair value through profit or loss 399 5,228 23,451 - 29,078Available-for-sale financial assets 4,438 32,127 55,336 549 92,450Loans and receivables 132,481 68,733 41,413 4,951 247,578Held-to-maturity investments 5,521 33,826 50,827 - 90,174 Total carrying value 334,531 152,221 184,850 19,960 691,562
LIABILITIES Financial liabilities held for trading 1,458 506 25 14,406 16,395Financial liabilities designated at fair value through profit or loss 141,586 4,630 50 23 146,289Financial liabilities at amortised cost 230,255 102,130 227,417 28 559,830 Total carrying value 373,299 107,266 227,492 14,457 722,514
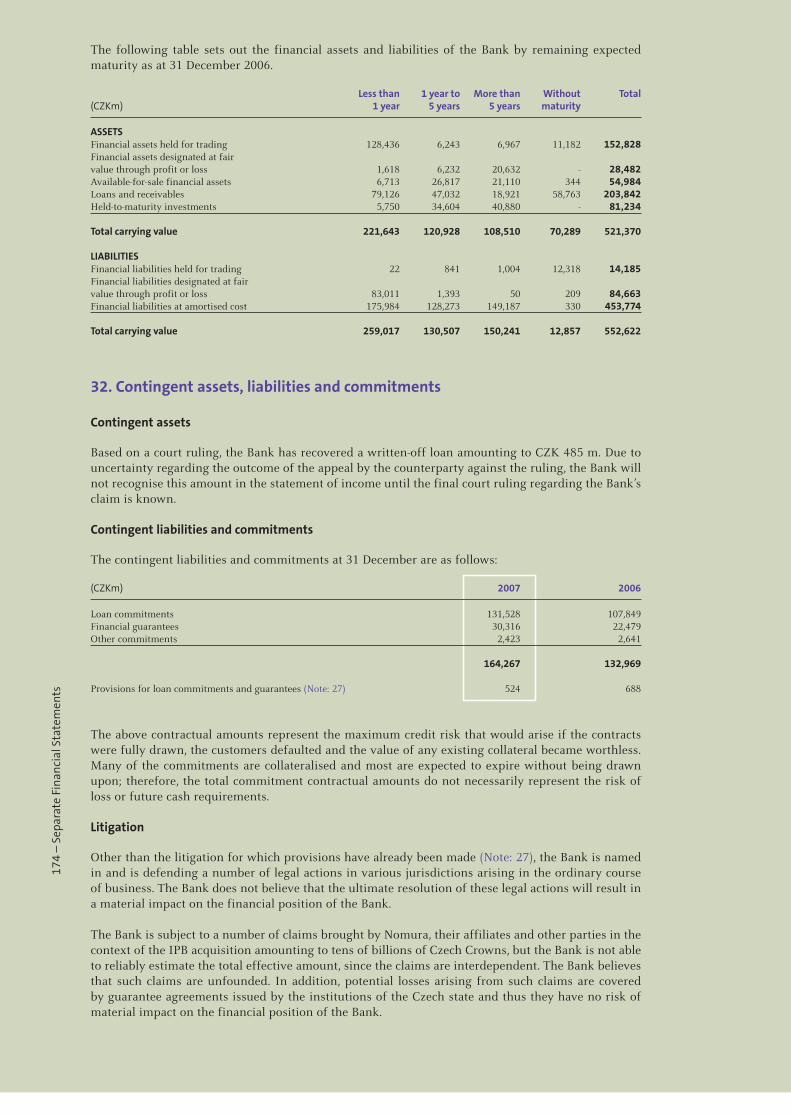
174
– S
epar
ate
Fina
ncia
l Sta
tem
ents
The following table sets out the financial assets and liabilities of the Bank by remaining expected maturity as at 31 December 2006.
Less than 1 year to More than Without Total(CZKm) 1 year 5 years 5 years maturity
ASSETS Financial assets held for trading 128,436 6,243 6,967 11,182 152,828Financial assets designated at fair value through profit or loss 1,618 6,232 20,632 - 28,482Available-for-sale financial assets 6,713 26,817 21,110 344 54,984Loans and receivables 79,126 47,032 18,921 58,763 203,842Held-to-maturity investments 5,750 34,604 40,880 - 81,234 Total carrying value 221,643 120,928 108,510 70,289 521,370 LIABILITIES Financial liabilities held for trading 22 841 1,004 12,318 14,185Financial liabilities designated at fair value through profit or loss 83,011 1,393 50 209 84,663Financial liabilities at amortised cost 175,984 128,273 149,187 330 453,774 Total carrying value 259,017 130,507 150,241 12,857 552,622
32. Contingent assets, liabilities and commitments
Contingent assets
Based on a court ruling, the Bank has recovered a written-off loan amounting to CZK 485 m. Due to uncertainty regarding the outcome of the appeal by the counterparty against the ruling, the Bank will not recognise this amount in the statement of income until the final court ruling regarding the Bank’s claim is known.
Contingent liabilities and commitments
The contingent liabilities and commitments at 31 December are as follows:
(CZKm) 2007 2006
Loan commitments 131,528 107,849Financial guarantees 30,316 22,479Other commitments 2,423 2,641 164,267 132,969 Provisions for loan commitments and guarantees (Note: 27) 524 688
The above contractual amounts represent the maximum credit risk that would arise if the contracts were fully drawn, the customers defaulted and the value of any existing collateral became worthless. Many of the commitments are collateralised and most are expected to expire without being drawn upon; therefore, the total commitment contractual amounts do not necessarily represent the risk of loss or future cash requirements.
Litigation
Other than the litigation for which provisions have already been made (Note: 27), the Bank is named in and is defending a number of legal actions in various jurisdictions arising in the ordinary course of business. The Bank does not believe that the ultimate resolution of these legal actions will result in a material impact on the financial position of the Bank.
The Bank is subject to a number of claims brought by Nomura, their affiliates and other parties in the context of the IPB acquisition amounting to tens of billions of Czech Crowns, but the Bank is not able to reliably estimate the total effective amount, since the claims are interdependent. The Bank believes that such claims are unfounded. In addition, potential losses arising from such claims are covered by guarantee agreements issued by the institutions of the Czech state and thus they have no risk of material impact on the financial position of the Bank.
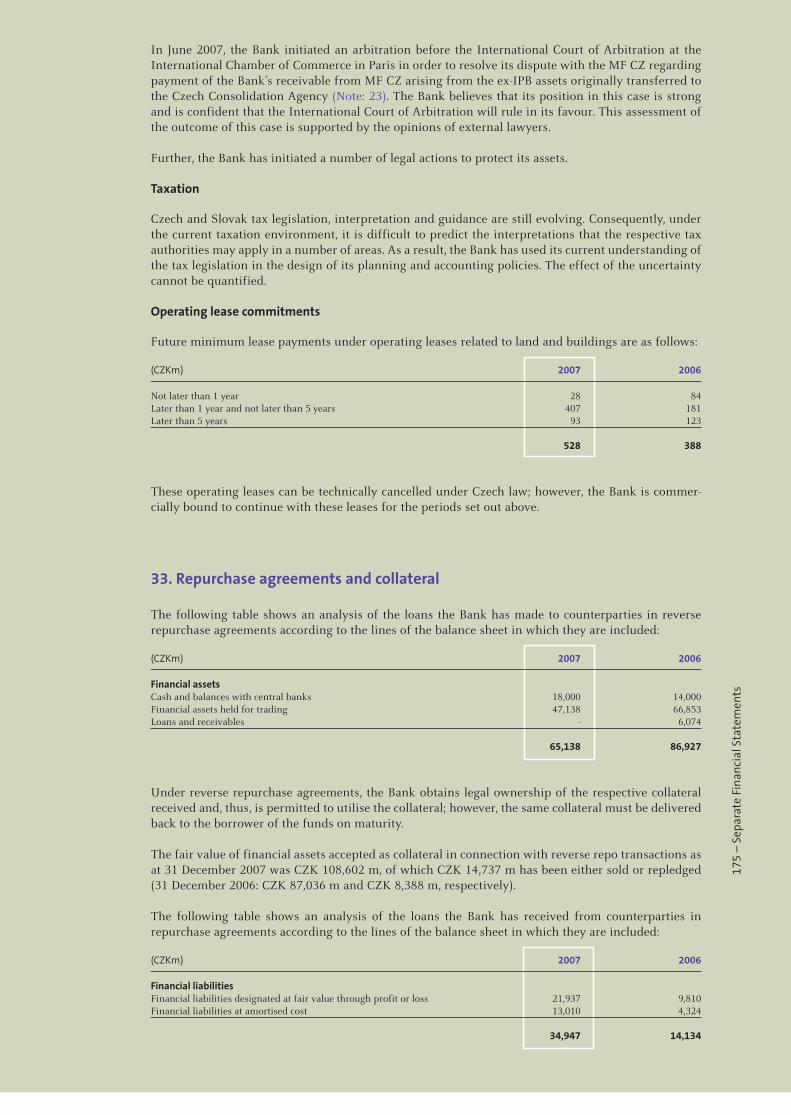
175
– S
epar
ate
Fina
ncia
l Sta
tem
ents
In June 2007, the Bank initiated an arbitration before the International Court of Arbitration at the International Chamber of Commerce in Paris in order to resolve its dispute with the MF CZ regarding payment of the Bank’s receivable from MF CZ arising from the ex-IPB assets originally transferred to the Czech Consolidation Agency (Note: 23). The Bank believes that its position in this case is strong and is confident that the International Court of Arbitration will rule in its favour. This assessment of the outcome of this case is supported by the opinions of external lawyers.
Further, the Bank has initiated a number of legal actions to protect its assets.
Taxation
Czech and Slovak tax legislation, interpretation and guidance are still evolving. Consequently, under the current taxation environment, it is difficult to predict the interpretations that the respective tax authorities may apply in a number of areas. As a result, the Bank has used its current understanding of the tax legislation in the design of its planning and accounting policies. The effect of the uncertainty cannot be quantified.
Operating lease commitments
Future minimum lease payments under operating leases related to land and buildings are as follows:
(CZKm) 2007 2006
Not later than 1 year 28 84Later than 1 year and not later than 5 years 407 181Later than 5 years 93 123
528 388
These operating leases can be technically cancelled under Czech law; however, the Bank is commer-cially bound to continue with these leases for the periods set out above.
33. Repurchase agreements and collateral
The following table shows an analysis of the loans the Bank has made to counterparties in reverse repurchase agreements according to the lines of the balance sheet in which they are included:
(CZKm) 2007 2006
Financial assets Cash and balances with central banks 18,000 14,000Financial assets held for trading 47,138 66,853Loans and receivables - 6,074 65,138 86,927
Under reverse repurchase agreements, the Bank obtains legal ownership of the respective collateral received and, thus, is permitted to utilise the collateral; however, the same collateral must be delivered back to the borrower of the funds on maturity.
The fair value of financial assets accepted as collateral in connection with reverse repo transactions as at 31 December 2007 was CZK 108,602 m, of which CZK 14,737 m has been either sold or repledged (31 December 2006: CZK 87,036 m and CZK 8,388 m, respectively).
The following table shows an analysis of the loans the Bank has received from counterparties in repurchase agreements according to the lines of the balance sheet in which they are included:
(CZKm) 2007 2006
Financial liabilities Financial liabilities designated at fair value through profit or loss 21,937 9,810Financial liabilities at amortised cost 13,010 4,324
34,947 14,134
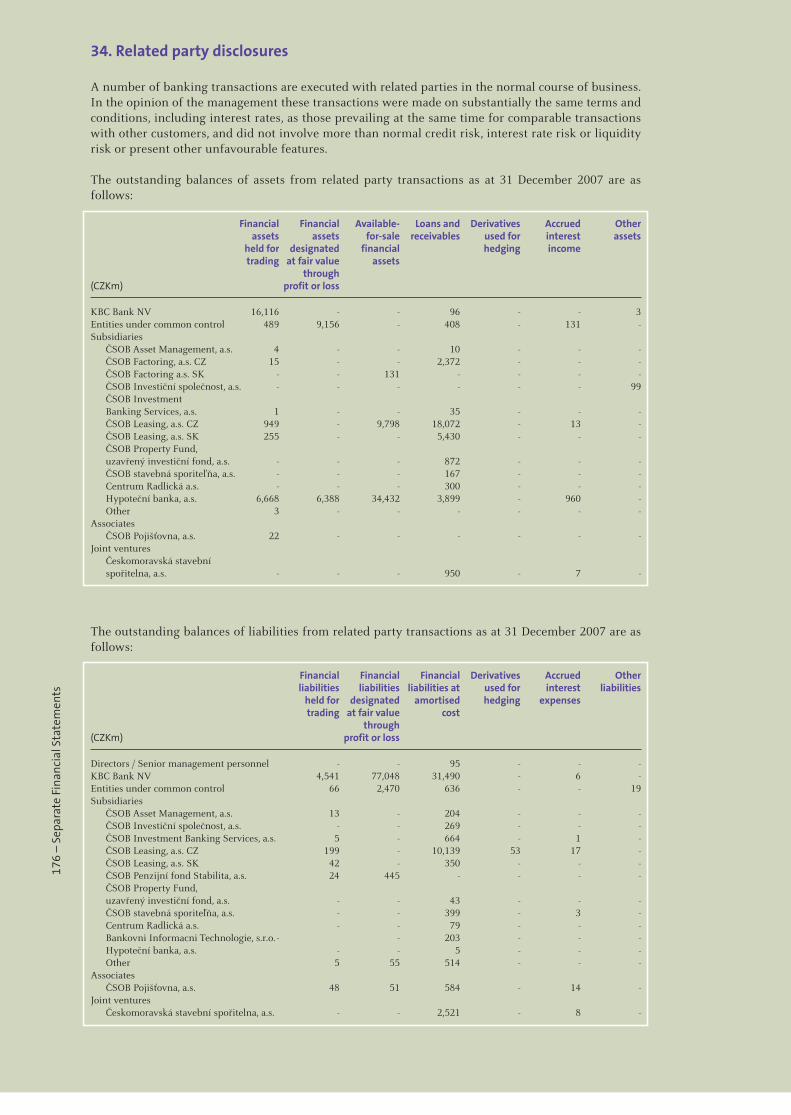
176
– S
epar
ate
Fina
ncia
l Sta
tem
ents
34. Related party disclosures
A number of banking transactions are executed with related parties in the normal course of business. In the opinion of the management these transactions were made on substantially the same terms and conditions, including interest rates, as those prevailing at the same time for comparable transactions with other customers, and did not involve more than normal credit risk, interest rate risk or liquidity risk or present other unfavourable features.
The outstanding balances of assets from related party transactions as at 31 December 2007 are as follows:
Financial Financial Available- Loans and Derivatives Accrued Other assets assets for-sale receivables used for interest assets held for designated financial hedging income trading at fair value assets through (CZKm) profit or loss
KBC Bank NV 16,116 - - 96 - - 3Entities under common control 489 9,156 - 408 - 131 -Subsidiaries ČSOB Asset Management, a.s. 4 - - 10 - - - ČSOB Factoring, a.s. CZ 15 - - 2,372 - - - ČSOB Factoring a.s. SK - - 131 - - - - ČSOB Investiční společnost, a.s. - - - - - - 99 ČSOB Investment Banking Services, a.s. 1 - - 35 - - - ČSOB Leasing, a.s. CZ 949 - 9,798 18,072 - 13 - ČSOB Leasing, a.s. SK 255 - - 5,430 - - - ČSOB Property Fund, uzavřený investiční fond, a.s. - - - 872 - - - ČSOB stavebná sporitel’ňa, a.s. - - - 167 - - - Centrum Radlická a.s. - - - 300 - - - Hypoteční banka, a.s. 6,668 6,388 34,432 3,899 - 960 - Other 3 - - - - - -Associates ČSOB Pojišťovna, a.s. 22 - - - - - -Joint ventures Českomoravská stavební spořitelna, a.s. - - - 950 - 7 -
The outstanding balances of liabilities from related party transactions as at 31 December 2007 are as follows:
Financial Financial Financial Derivatives Accrued Other liabilities liabilities liabilities at used for interest liabilities held for designated amortised hedging expenses trading at fair value cost through (CZKm) profit or loss
Directors / Senior management personnel - - 95 - - -KBC Bank NV 4,541 77,048 31,490 - 6 -Entities under common control 66 2,470 636 - - 19Subsidiaries ČSOB Asset Management, a.s. 13 - 204 - - - ČSOB Investiční společnost, a.s. - - 269 - - - ČSOB Investment Banking Services, a.s. 5 - 664 - 1 - ČSOB Leasing, a.s. CZ 199 - 10,139 53 17 - ČSOB Leasing, a.s. SK 42 - 350 - - - ČSOB Penzijní fond Stabilita, a.s. 24 445 - - - - ČSOB Property Fund, uzavřený investiční fond, a.s. - - 43 - - - ČSOB stavebná sporiteľňa, a.s. - - 399 - 3 - Centrum Radlická a.s. - - 79 - - - Bankovni Informacni Technologie, s.r.o. - - 203 - - - Hypoteční banka, a.s. - - 5 - - - Other 5 55 514 - - -Associates ČSOB Pojišťovna, a.s. 48 51 584 - 14 -Joint ventures Českomoravská stavební spořitelna, a.s. - - 2,521 - 8 -
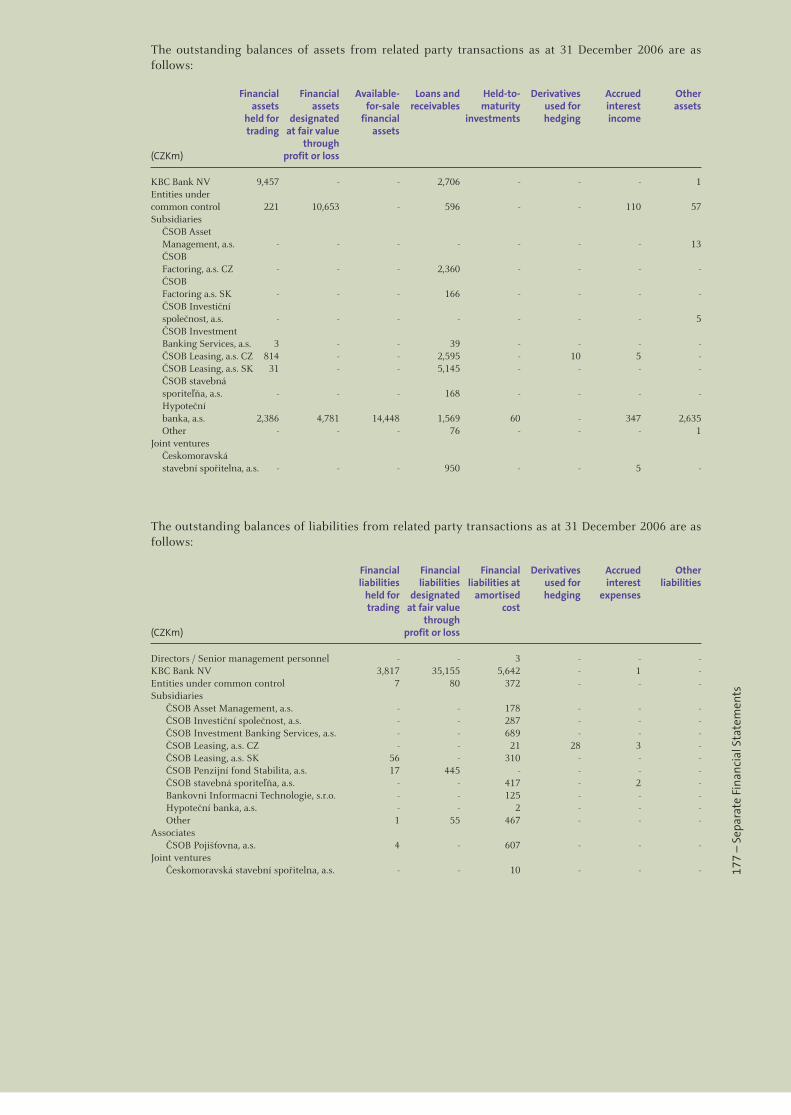
177
– S
epar
ate
Fina
ncia
l Sta
tem
ents
The outstanding balances of assets from related party transactions as at 31 December 2006 are as follows:
Financial Financial Available- Loans and Held-to- Derivatives Accrued Other assets assets for-sale receivables maturity used for interest assets held for designated financial investments hedging income trading at fair value assets through (CZKm) profit or loss
KBC Bank NV 9,457 - - 2,706 - - - 1Entities under common control 221 10,653 - 596 - - 110 57Subsidiaries ČSOB Asset
Management, a.s. - - - - - - - 13 ČSOB
Factoring, a.s. CZ - - - 2,360 - - - - ČSOB
Factoring a.s. SK - - - 166 - - - - ČSOB Investiční
společnost, a.s. - - - - - - - 5 ČSOB Investment
Banking Services, a.s. 3 - - 39 - - - - ČSOB Leasing, a.s. CZ 814 - - 2,595 - 10 5 - ČSOB Leasing, a.s. SK 31 - - 5,145 - - - - ČSOB stavebná
sporiteľňa, a.s. - - - 168 - - - - Hypoteční
banka, a.s. 2,386 4,781 14,448 1,569 60 - 347 2,635 Other - - - 76 - - - 1Joint ventures Českomoravská
stavební spořitelna, a.s. - - - 950 - - 5 -
The outstanding balances of liabilities from related party transactions as at 31 December 2006 are as follows:
Financial Financial Financial Derivatives Accrued Other liabilities liabilities liabilities at used for interest liabilities held for designated amortised hedging expenses trading at fair value cost through (CZKm) profit or loss
Directors / Senior management personnel - - 3 - - -KBC Bank NV 3,817 35,155 5,642 - 1 -Entities under common control 7 80 372 - - -Subsidiaries ČSOB Asset Management, a.s. - - 178 - - - ČSOB Investiční společnost, a.s. - - 287 - - - ČSOB Investment Banking Services, a.s. - - 689 - - - ČSOB Leasing, a.s. CZ - - 21 28 3 - ČSOB Leasing, a.s. SK 56 - 310 - - - ČSOB Penzijní fond Stabilita, a.s. 17 445 - - - - ČSOB stavebná sporiteľňa, a.s. - - 417 - 2 - Bankovni Informacni Technologie, s.r.o. - - 125 - - - Hypoteční banka, a.s. - - 2 - - - Other 1 55 467 - - -Associates ČSOB Pojišťovna, a.s. 4 - 607 - - -Joint ventures Českomoravská stavební spořitelna, a.s. - - 10 - - -
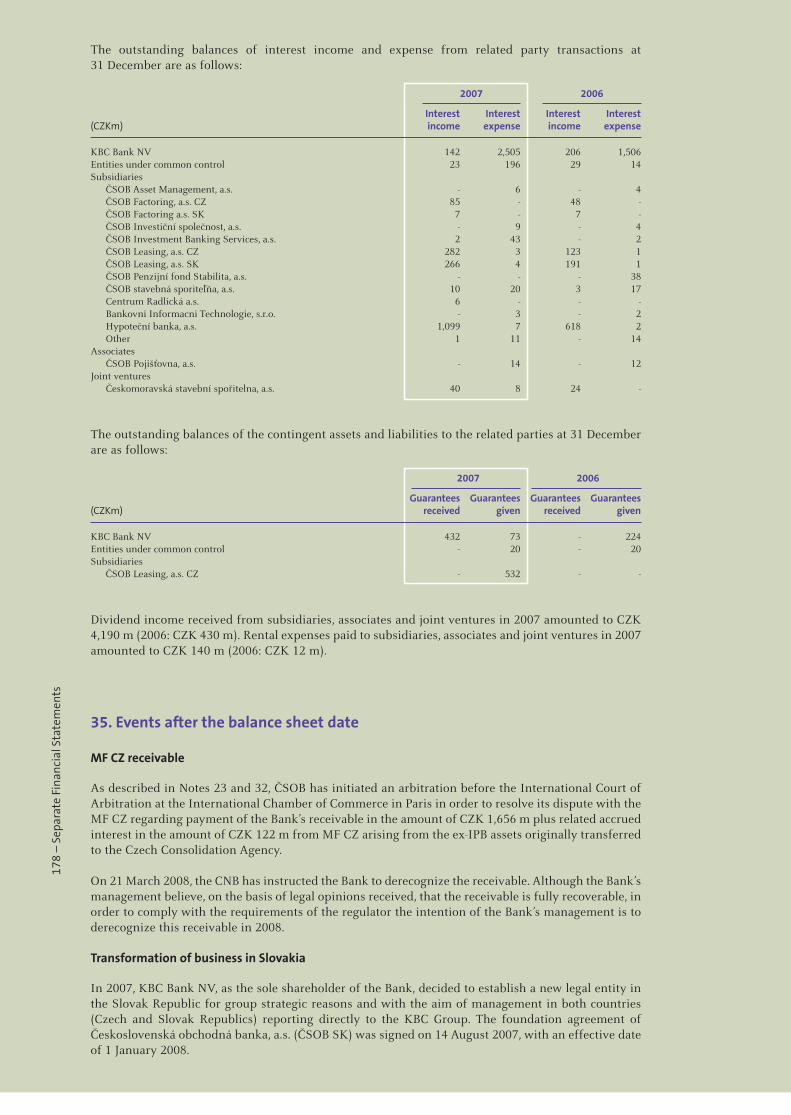
178
– S
epar
ate
Fina
ncia
l Sta
tem
ents
The outstanding balances of interest income and expense from related party transactions at 31 December are as follows:
2007 2006
Interest Interest Interest Interest(CZKm) income expense income expense
KBC Bank NV 142 2,505 206 1,506Entities under common control 23 196 29 14Subsidiaries ČSOB Asset Management, a.s. - 6 - 4 ČSOB Factoring, a.s. CZ 85 - 48 - ČSOB Factoring a.s. SK 7 - 7 - ČSOB Investiční společnost, a.s. - 9 - 4 ČSOB Investment Banking Services, a.s. 2 43 - 2 ČSOB Leasing, a.s. CZ 282 3 123 1 ČSOB Leasing, a.s. SK 266 4 191 1 ČSOB Penzijní fond Stabilita, a.s. - - - 38 ČSOB stavebná sporiteľňa, a.s. 10 20 3 17 Centrum Radlická a.s. 6 - - - Bankovni Informacni Technologie, s.r.o. - 3 - 2 Hypoteční banka, a.s. 1,099 7 618 2 Other 1 11 - 14Associates ČSOB Pojišťovna, a.s. - 14 - 12Joint ventures Českomoravská stavební spořitelna, a.s. 40 8 24 -
The outstanding balances of the contingent assets and liabilities to the related parties at 31 December are as follows:
2007 2006
Guarantees Guarantees Guarantees Guarantees(CZKm) received given received given
KBC Bank NV 432 73 - 224Entities under common control - 20 - 20Subsidiaries ČSOB Leasing, a.s. CZ - 532 - -
Dividend income received from subsidiaries, associates and joint ventures in 2007 amounted to CZK 4,190 m (2006: CZK 430 m). Rental expenses paid to subsidiaries, associates and joint ventures in 2007 amounted to CZK 140 m (2006: CZK 12 m).
35. Events after the balance sheet date
MF CZ receivable
As described in Notes 23 and 32, ČSOB has initiated an arbitration before the International Court of Arbitration at the International Chamber of Commerce in Paris in order to resolve its dispute with the MF CZ regarding payment of the Bank’s receivable in the amount of CZK 1,656 m plus related accrued interest in the amount of CZK 122 m from MF CZ arising from the ex-IPB assets originally transferred to the Czech Consolidation Agency.
On 21 March 2008, the CNB has instructed the Bank to derecognize the receivable. Although the Bank’s management believe, on the basis of legal opinions received, that the receivable is fully recoverable, in order to comply with the requirements of the regulator the intention of the Bank’s management is to derecognize this receivable in 2008.
Transformation of business in Slovakia
In 2007, KBC Bank NV, as the sole shareholder of the Bank, decided to establish a new legal entity in the Slovak Republic for group strategic reasons and with the aim of management in both countries (Czech and Slovak Republics) reporting directly to the KBC Group. The foundation agreement of Československá obchodná banka, a.s. (ČSOB SK) was signed on 14 August 2007, with an effective date of 1 January 2008.
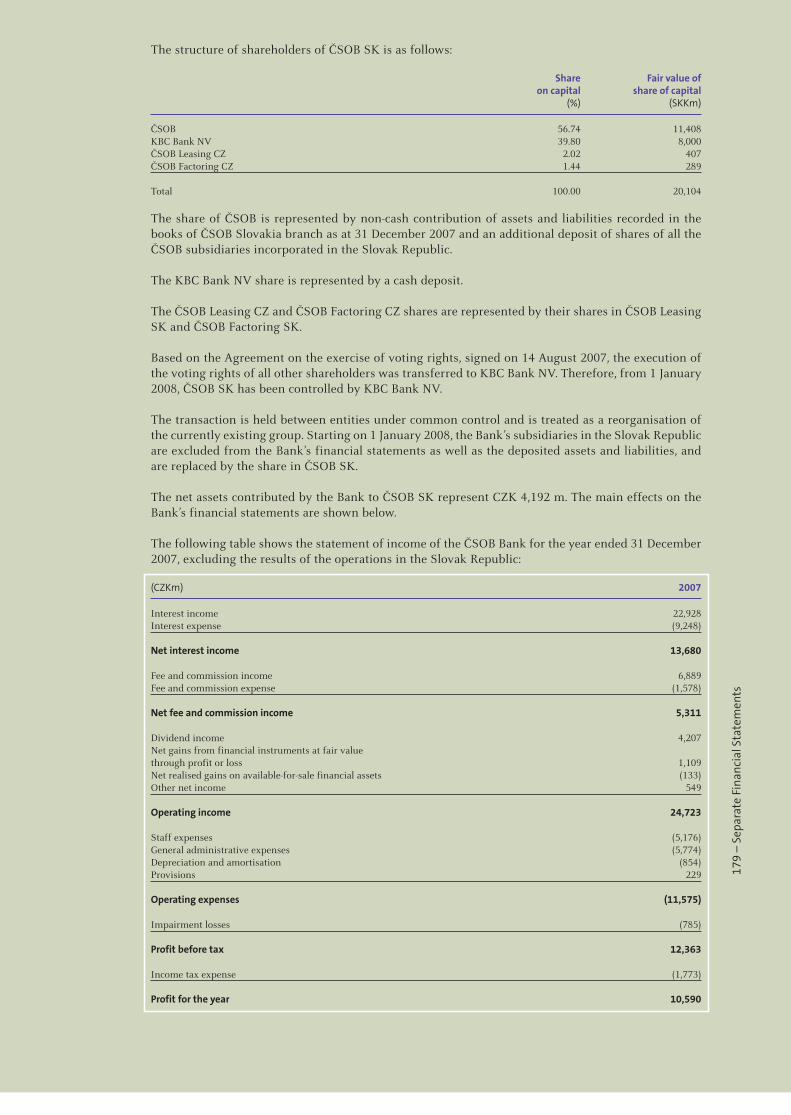
179
– S
epar
ate
Fina
ncia
l Sta
tem
ents
The structure of shareholders of ČSOB SK is as follows:
Share Fair value of on capital share of capital (%) (SKKm)
ČSOB 56.74 11,408KBC Bank NV 39.80 8,000ČSOB Leasing CZ 2.02 407ČSOB Factoring CZ 1.44 289 Total 100.00 20,104
The share of ČSOB is represented by non-cash contribution of assets and liabilities recorded in the books of ČSOB Slovakia branch as at 31 December 2007 and an additional deposit of shares of all the ČSOB subsidiaries incorporated in the Slovak Republic.
The KBC Bank NV share is represented by a cash deposit.
The ČSOB Leasing CZ and ČSOB Factoring CZ shares are represented by their shares in ČSOB Leasing SK and ČSOB Factoring SK.
Based on the Agreement on the exercise of voting rights, signed on 14 August 2007, the execution of the voting rights of all other shareholders was transferred to KBC Bank NV. Therefore, from 1 January 2008, ČSOB SK has been controlled by KBC Bank NV.
The transaction is held between entities under common control and is treated as a reorganisation of the currently existing group. Starting on 1 January 2008, the Bank’s subsidiaries in the Slovak Republic are excluded from the Bank’s financial statements as well as the deposited assets and liabilities, and are replaced by the share in ČSOB SK.
The net assets contributed by the Bank to ČSOB SK represent CZK 4,192 m. The main effects on the Bank’s financial statements are shown below.
The following table shows the statement of income of the ČSOB Bank for the year ended 31 December 2007, excluding the results of the operations in the Slovak Republic:
(CZKm) 2007
Interest income 22,928Interest expense (9,248) Net interest income 13,680 Fee and commission income 6,889Fee and commission expense (1,578) Net fee and commission income 5,311 Dividend income 4,207Net gains from financial instruments at fair value through profit or loss 1,109Net realised gains on available-for-sale financial assets (133)Other net income 549 Operating income 24,723 Staff expenses (5,176)General administrative expenses (5,774)Depreciation and amortisation (854)Provisions 229 Operating expenses (11,575) Impairment losses (785) Profit before tax 12,363 Income tax expense (1,773) Profit for the year 10,590
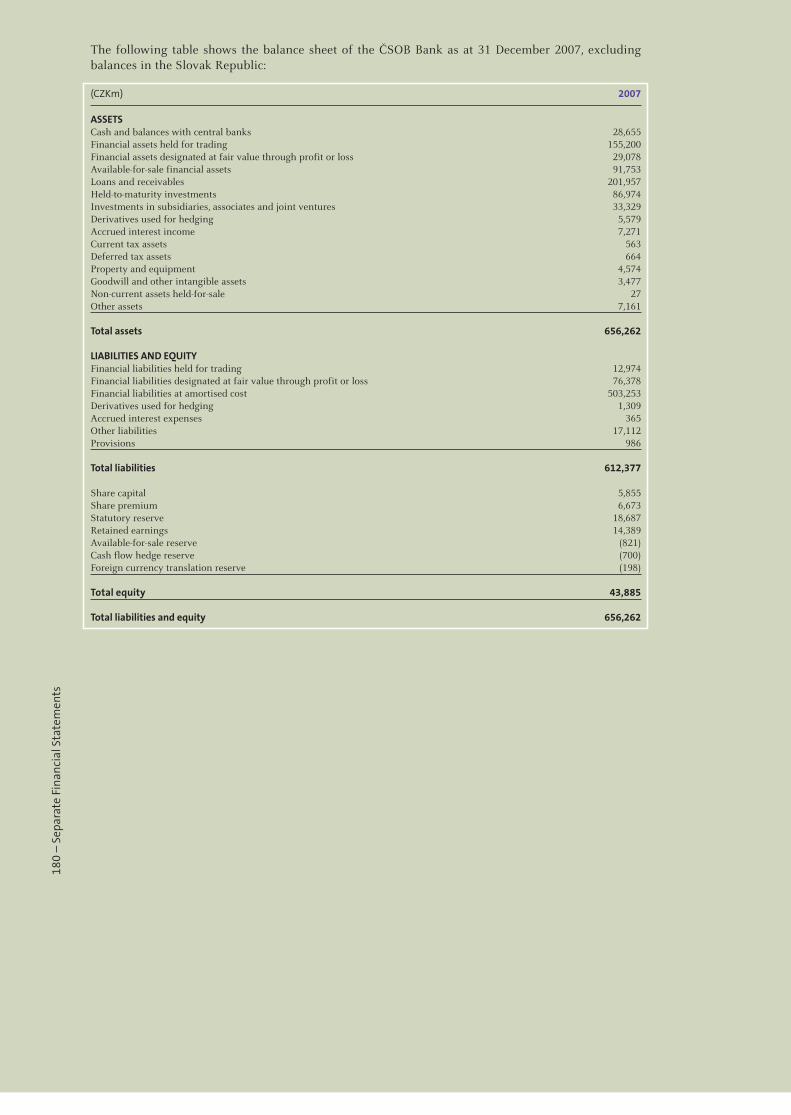
180
– S
epar
ate
Fina
ncia
l Sta
tem
ents
The following table shows the balance sheet of the ČSOB Bank as at 31 December 2007, excluding balances in the Slovak Republic:
(CZKm) 2007
ASSETS Cash and balances with central banks 28,655Financial assets held for trading 155,200Financial assets designated at fair value through profit or loss 29,078Available-for-sale financial assets 91,753Loans and receivables 201,957Held-to-maturity investments 86,974Investments in subsidiaries, associates and joint ventures 33,329Derivatives used for hedging 5,579Accrued interest income 7,271Current tax assets 563Deferred tax assets 664Property and equipment 4,574Goodwill and other intangible assets 3,477Non-current assets held-for-sale 27Other assets 7,161 Total assets 656,262 LIABILITIES AND EQUITY Financial liabilities held for trading 12,974Financial liabilities designated at fair value through profit or loss 76,378Financial liabilities at amortised cost 503,253Derivatives used for hedging 1,309Accrued interest expenses 365Other liabilities 17,112Provisions 986 Total liabilities 612,377 Share capital 5,855Share premium 6,673Statutory reserve 18,687Retained earnings 14,389Available-for-sale reserve (821)Cash flow hedge reserve (700)Foreign currency translation reserve (198) Total equity 43,885 Total liabilities and equity 656,262
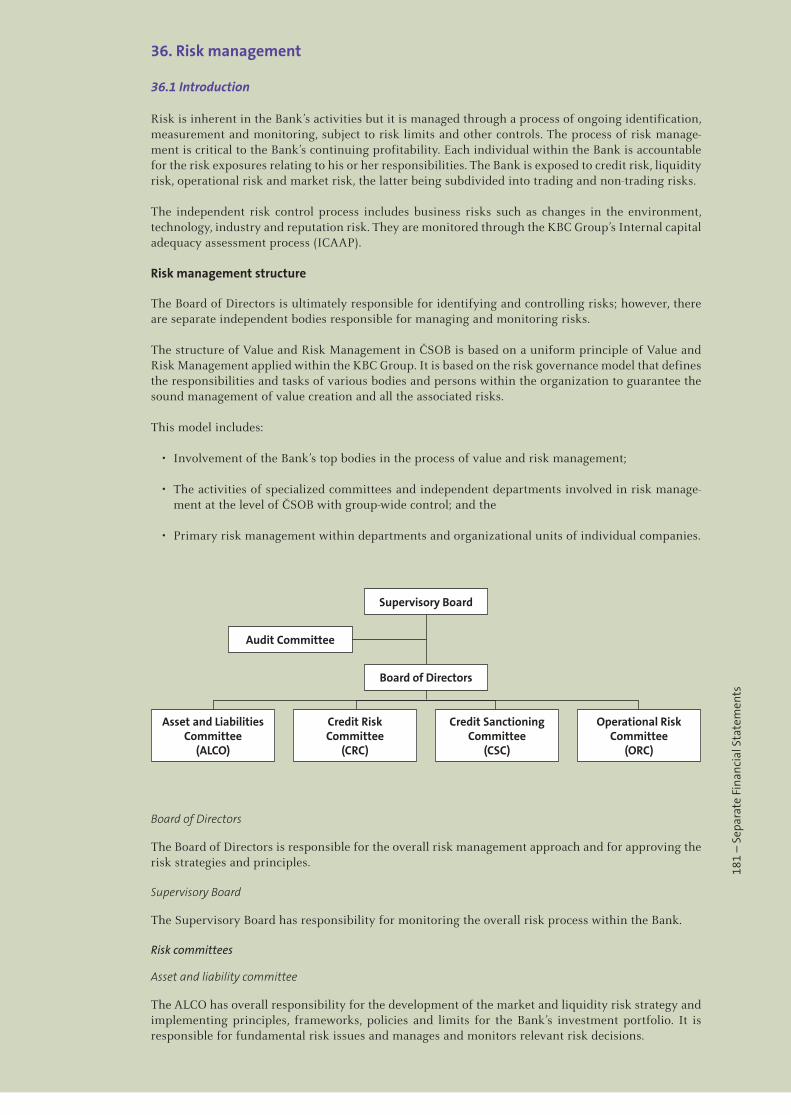
181
– S
epar
ate
Fina
ncia
l Sta
tem
ents
36. Risk management
36.1 Introduction
Risk is inherent in the Bank’s activities but it is managed through a process of ongoing identification, measurement and monitoring, subject to risk limits and other controls. The process of risk manage-ment is critical to the Bank’s continuing profitability. Each individual within the Bank is accountable for the risk exposures relating to his or her responsibilities. The Bank is exposed to credit risk, liquidity risk, operational risk and market risk, the latter being subdivided into trading and non-trading risks.
The independent risk control process includes business risks such as changes in the environment, technology, industry and reputation risk. They are monitored through the KBC Group’s Internal capital adequacy assessment process (ICAAP).
Risk management structure
The Board of Directors is ultimately responsible for identifying and controlling risks; however, there are separate independent bodies responsible for managing and monitoring risks.
The structure of Value and Risk Management in ČSOB is based on a uniform principle of Value and Risk Management applied within the KBC Group. It is based on the risk governance model that defines the responsibilities and tasks of various bodies and persons within the organization to guarantee the sound management of value creation and all the associated risks.
This model includes:
• Involvement of the Bank’s top bodies in the process of value and risk management;
• The activities of specialized committees and independent departments involved in risk manage-ment at the level of ČSOB with group-wide control; and the
• Primary risk management within departments and organizational units of individual companies.
Supervisory Board
Audit Committee
Board of Directors
Asset and LiabilitiesCommittee
(ALCO)
Credit RiskCommittee
(CRC)
Credit SanctioningCommittee
(CSC)
Operational RiskCommittee
(ORC)
Board of Directors
The Board of Directors is responsible for the overall risk management approach and for approving the risk strategies and principles.
Supervisory Board
The Supervisory Board has responsibility for monitoring the overall risk process within the Bank.
Risk committees
Asset and liability committee
The ALCO has overall responsibility for the development of the market and liquidity risk strategy and implementing principles, frameworks, policies and limits for the Bank’s investment portfolio. It is responsible for fundamental risk issues and manages and monitors relevant risk decisions.

182
– S
epar
ate
Fina
ncia
l Sta
tem
ents
Credit risk committee
The CRC has overall responsibility for the development of the credit risk strategy and implementing principles, frameworks, policies and limits. It is responsible for fundamental risk issues and manages and monitors relevant risk decisions.
Credit risk sanctioning committee
The CSC is a committee entrusted with the Group-wide responsibility and authority to take decisions on (individual) credit applications falling within the delegated decision powers of the CSC. As such it acts in principle as the highest decision committee for the Bank.
Operational risk committee
The ORC has overall responsibility for the development of the operation risk strategy and imple-menting principles, frameworks, policies and limits. It is responsible for fundamental risk issues and manages and monitors relevant risk decisions.
Other bodies
ecutive Officers (SEO) responsible for Financial Markets and Risk Management
These two SEOs have overall responsibility for the development of the market risk strategy and imple-menting principles, frameworks, policies and limits for the trading portfolio of the Bank. They are responsible for fundamental risk issues and manage and monitor relevant risk decisions.
Value and Risk Management (VRM)
The Value and Risk Management unit is responsible for implementing and maintaining risk related procedures to ensure an independent control process (except for credit risk). VRM is also responsible for monitoring compliance with risk principles, policies and limits, across the Bank. VRM is respon-sible for the independent control of risks (except for credit risk), including monitoring the risk of exposures against limits and the assessment of risks of new products and structured transactions. This unit also ensures the complete capture of the risks in risk measurement and reporting systems.
Credits unit
The Credits unit is responsible for implementing and maintaining credit risk related procedures to ensure an independent control process. The Credits unit is also responsible for monitoring compliance with credit risk principles, policies and limits, across the Bank.
The Credits unit is responsible for the independent control of credit risk, including monitoring the risk of exposures against limits and the assessment of risks of new products and structured transactions. This unit also ensures the complete capture of the risks in risk measurement and reporting systems.
Asset and liability management unit (ALM)
The Bank’s ALM unit is responsible for managing assets and liabilities of the Bank’s investment port-folio. It is also primarily responsible for the funding and liquidity risks of the Bank.
Financial Markets unit (FM)
The Bank’s FM unit is responsible for managing assets and liabilities of the Bank’s trading portfolio.
Internal audit
Risk management processes throughout the Bank are audited annually by the Internal Audit function, that examines both the adequacy of the procedures and the Bank’s compliance with the procedures. Internal Audit discusses results of all assessments with the management, and reports its findings and recommendations to the Audit Committee.
Risk measurement and reporting systems
The Bank’s risks are measured using a method which reflects both the expected loss likely to arise in normal circumstances and unexpected losses, which are an estimate of the ultimate actual loss based on statistical models. The models make use of probabilities derived from historical experience, adjusted to reflect the economic environment. The Bank also runs worse case scenarios that would arise when extreme events that are unlikely to occur do, in fact, occur.
183
– S
epar
ate
Fina
ncia
l Sta
tem
ents
Monitoring and controlling risks is primarily performed based on limits established by the Bank. These limits reflect the business strategy and market environment of the Bank as well as the level of risk that the Bank is willing to accept, with additional emphasis on selected industries. In addition, the Bank monitors and measures the overall risk bearing capacity in relation to the aggregate risk exposure across all risk types and activities.
Information compiled from all businesses is examined and processed in order to analyse, control and identify risks when they arise. This information is presented and explained to the Board of Directors, the ALCO, and the CRC. The reports include aggregate credit exposure, credit metric forecasts, hold limit exceptions, Value at Risk (VaR), interest rate sensitivities, interest rate gaps, liquidity ratios and risk profile changes. Once a quarter, the Supervisory Board receives a comprehensive risk report designed to provide all information necessary to assess and conclude on the risks of the Bank.
A daily report is given to the senior management and all other relevant members of the Bank on the use of market limits and analysis of VaR in trading book. A weekly report is given to the senior management and all other relevant members on interest rate sensitivities and liquidity in the non-trading book.
Risk mitigation
As part of its overall risk management, the Bank uses derivatives and other instruments to manage exposures resulting from changes in interest rates, foreign currencies, equity risks, credit risks, and exposures arising from forecast transactions.
The risk profile is assessed before entering into hedge transactions, that are authorised by the appro-priate level of seniority within the Bank. The effectiveness of hedges is assessed by the Middle Office (based on economic considerations rather than the IFRS hedge accounting criteria). The effectiveness of all hedge relationships is monitored by the Unit quarterly. In situations of ineffectiveness, the Bank will enter into a new hedge relationship to mitigate risk on a continuous basis.
Excessive risk concentration
Concentrations arise when a number of counterparties are engaged in similar business activities, or activities in the same geographic region, or have similar economic features that would cause their abil-ity to meet contractual obligations to be similarly affected by changes in economic, political or other conditions. Concentrations indicate the relative sensitivity of the Bank’s performance to developments affecting a particular industry or geographical location.
In order to avoid excessive concentrations of risk, the Bank’s policies and procedures include specific guidelines to focus on maintaining a diversified portfolio. Identified concentrations of credit risks are controlled and managed accordingly. Selective hedging is used within the Bank to manage risk concentrations at both the relationship and industry levels.
Basel II
The new rules according the Basel Committee on Banking Supervision (Basel II) came into force in the Czech Republic in the middle of 2007. The new banking law significantly changed the requirements for risk management and added other options for the calculation of capital requirements. Among others the Bank implemented the Internal Rating Based Foundation (IRBF) approach during 2007. From that moment on the Bank calculates its regulatory capital requirements for credit risk using this approach. Credit risk regulatory capital requirements for the previous year (2006) are reported according to Basel I (Standard method). As a consequence, the figures for the credit risk requirements are not fully comparable for the years 2007 and 2006.
36.2 Credit risk
Credit risk is a potential shortfall relative to the value expected as a consequence of the non-payment or non-performance by an obligor (a borrower, guarantor, counterparty to an inter-professional trans-action, or issuer of a debt instrument), due to that party’s insolvency or lack of willingness to pay, or to events or measures taken by the political or monetary authorities of a particular country. The latter is also referred to as ‘country risk’.
The Bank manages and controls credit risk by setting limits on the amount of risk it is willing to accept for individual counterparties and for geographical or industry concentrations. The Bank monitors exposures in relation to these limits.
184
– S
epar
ate
Fina
ncia
l Sta
tem
ents
The Bank has established a credit quality review process to provide early identification of possible changes in the creditworthiness of counterparties. This includes regular collateral revisions. Counterparty limits are established by the use of a credit risk classification system, which assigns each counterparty a risk rating Probability of Default (PD rating). Risk ratings are subject to regular revision. The credit quality review process allows the Bank to assess the potential loss as a result of the risks to which it is exposed and to take corrective action.
Corporate and large SME credits
ČSOB has developed and implemented internal rating models / tools within the credit process for Corporates, SMEs, municipalities, housing cooperatives and other clients. The models were built in compliance with the Basel II regulations, that allow the Bank to use their output (PD) for capital adequacy calculations. The non-retail models produce rating grades on a unified KBC “PD master scale”. Rating grades 1-9 are used for non-default/normal clients while rating grades 10-12 are used for clients in default. Each rating grade is associated with a predefined range of probability of default (e.g. a client carrying PD rating 3 has a probability of default between 0.20% - 0.40%). Clients with PD rating 8, 9 are considered as “weak normal” and the management of such files is monitored by the Bad Debts unit.
Validation of the model is performed by an independent unit from the Value and Risk Management unit and finally approved by KBC Group Model Committee. The whole “model lifecycle” is defined in the KBC Model Management Framework unified for the KBC Group.
The Bank expects to further improve predictive power of the models in line with increasing number of available data.
ČSOB applies using models developed by the KBC Group to assess the quality of sovereign and bank-ing counterparties. These models are validated in KBC as well.
Acceptance Process
The acceptance process for Corporate and large SME clients is organized in three steps. First, the relationship manager of the introducing entity prepares a written credit proposal. In a second step, an advisor independent of the business line (i.e. reporting to Credits) screens the proposal and prepares a recommendation. Credit files that carry only limited expected loss can be approved by a Head of a Corporate Branch. Finally, a decision is made at the appropriate decision-making level (committee). The “four eyes” principle is always respected. The decision always includes an approved counterparty rating.
The newly created rating models that assign a specific probability of default to each client determine the level of potential risk and the acceptance process is adapted accordingly. Thus, the Bank can modify the acceptance authority, follow a simpler framework in cases of lower risk, adjust price policy, set more precise monitoring rules, implement advanced risk control based on the portfolio system, etc. New rating models were integrated into specialized rating tools, which can be used also for pricing purposes.
Retail and small SME credits
The Bank has implemented the Internal Rating Based (IRB) approach to calculate a capital require-ment. This includes the development of scorecards for retail portfolios within the Bank, estimates of key parameters such as PD, Exposure at Default (EAD) and Loss Given Default (LGD) within defined homogenous sets of exposures (so called pools) and a process of regular recalculation, validation and monitoring. Basel II scorecards are used in the application process so that they influence the incoming population. All models have to follow the standards maintained within the KBC Group via the Model management framework and have to be approved by the local Credit Risk committee and the Group Model committee.
Acceptance process
The retail acceptance process is based on a number of internally developed scorecards and uses access to external data sources (Credit Bureaus) that bring additional information about a client’s risk profile. Each application process runs on an in-house developed scorecard. These decision support tools allow complex control over the newly accepted risks. Scorecards are typically based on both socio-demographic and behavioural data. The acceptance process also covers pre-approved limits for existing clients.

185
– S
epar
ate
Fina
ncia
l Sta
tem
ents
Portfolio risk management
Several loss-predicting models are used to manage the risk of the major retail credit portfolios. Regular back testing of those models shows high precision of the predicted development. The use of these modelling techniques and the implemented scorecards together with management techniques signifi-cantly reduces the credit risk taken within retail portfolios, although the acceptance rate has been kept almost the same.
Derivative financial instruments
Credit risk arising from derivative financial instruments is, at any time, limited to those with positive fair values, as recorded in the balance sheet.
Credit-related commitments risk
The Bank grants its customers guarantees that may require that the Bank make payments on their behalf. Such payments are collected from customers based on the terms of a letter of credit. They expose the Bank to similar risks to loans and are mitigated by the same control processes and policies.
The table below shows the maximum exposure to credit risk for the components of the balance sheet. The maximum exposure is shown gross without taking account of any collateral and other credit enhancements.
(CZKm) Note 2007 2006
Cash and balances with central banks 14 22,543 22,560Financial assets held for trading 15 232,282 152,828Financial assets designated at fair value through profit or loss 15 29,078 28,482Available-for-sale financial assets 16 92,450 54,984Loans and receivables 17 247,578 203,842Held-to-maturity investments 16 90,174 81,234Derivatives used for hedging 19 5,579 5,134Accrued interest income 20 7,589 5,816Other assets 23 6,807 9,350 Total 734,080 564,230 Contingent liabilities 32 32,739 25,120Commitments 32 131,528 107,849 Total 164,267 132,969 Total credit risk exposure 898,347 697,199
Where financial instruments are recorded at fair value the amounts shown above represent the current credit risk exposure but not the maximum risk exposure that could arise in the future as a result of changes in values.
Risk concentrations of the maximum exposure to credit risk
Concentration of risk is managed by client/counterparty, by geographical region and by industry sector. The maximum credit exposure to any client or counterparty as at 31 December 2007 was CZK 59,160 m (2006: CZK 13,745 m) before taking account of collateral or other credit enhancements and CZK 59,160 m (2006: CZK 13,745 m) net of such protection.

186
– S
epar
ate
Fina
ncia
l Sta
tem
ents
The Bank’s financial assets, before taking into account any collateral held or other credit enhance-ments, can be analysed by the following geographical regions:
(CZKm) 2007 2006
Czech Republic 555,008 434,611Slovak Republic 160,667 135,012Other Europe 167,942 109,798Other 14,730 17,778 Total 898,347 697,199
An industry sector analysis of the Bank’s financial assets, before taking into account any collateral held or other credit enhancements, is as follows:
(CZKm) 2007 2006
Central government 227,118 153,695Non-credit institutions 7,890 7,325Credit institutions 266,968 225,469Insurance companies 1,063 923Financial services 52,244 17,326Other non-financial companies 303,400 258,364Retail customers 39,664 34,097 Total 898,347 697,199
Collateral and other credit enhancements
The amount and type of collateral required depend on an assessment of the credit risk of the coun-terparty. Guidelines are implemented regarding the acceptability of types of collateral and valuation parameters.
The main types of collateral obtained are as follows:
• For securities lending and reverse repurchase transactions, cash or securities,
• For commercial lending, charges over real estate properties, inventory and trade receivables,
• For retail lending, mortgages over residential properties.
The Bank also obtains guarantees from its parent company for loans to its subsidiaries.
The management monitors the market value of collateral, requests additional collateral in accordance with the underlying agreement, and monitors the market value of collateral obtained during its review of the adequacy of the allowance for impairment losses.
It is the Bank’s policy to dispose of repossessed properties in an orderly fashion. The proceeds are used to reduce or repay the outstanding claim. In general, the Bank does not occupy repossessed properties for business use.
The Bank also makes use of master netting agreements with counterparties.
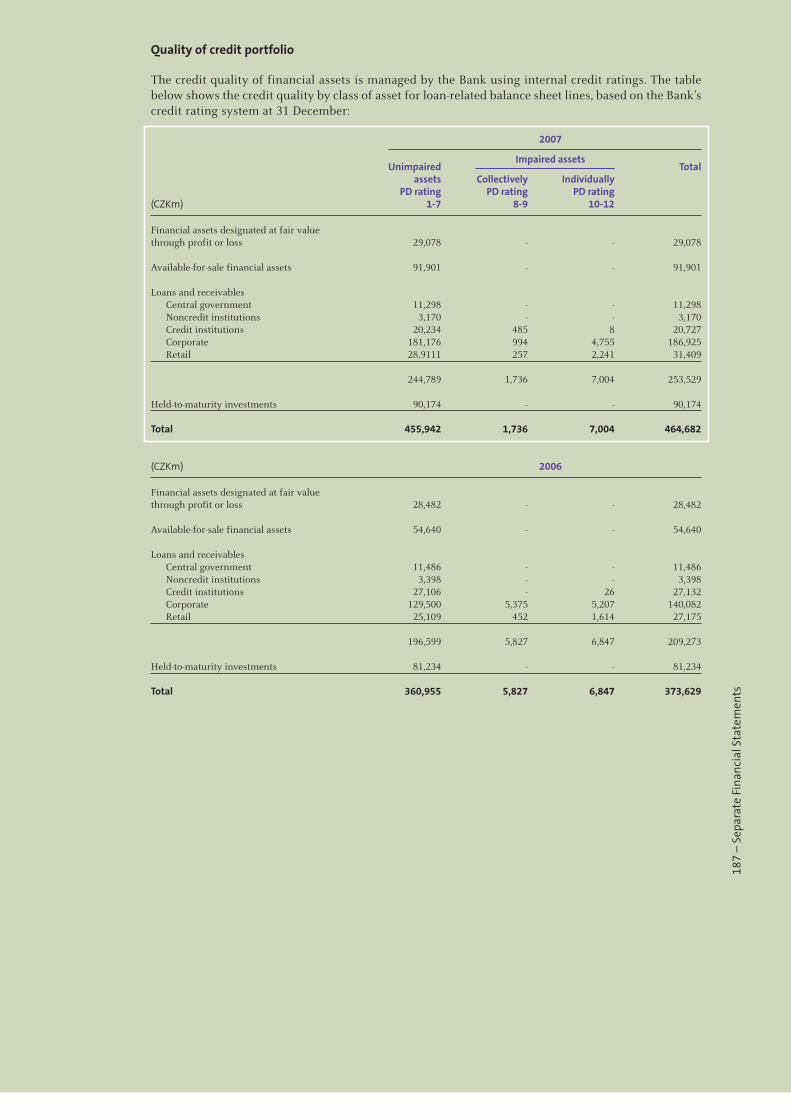
187
– S
epar
ate
Fina
ncia
l Sta
tem
ents
Quality of credit portfolio
The credit quality of financial assets is managed by the Bank using internal credit ratings. The table below shows the credit quality by class of asset for loan-related balance sheet lines, based on the Bank’s credit rating system at 31 December:
2007
Unimpaired
Impaired assets Total
assets Collectively Individually PD rating PD rating PD rating(CZKm) 1-7 8-9 10-12
Financial assets designated at fair value through profit or loss 29,078 - - 29,078 Available-for-sale financial assets 91,901 - - 91,901 Loans and receivables Central government 11,298 - - 11,298 Noncredit institutions 3,170 - - 3,170 Credit institutions 20,234 485 8 20,727 Corporate 181,176 994 4,755 186,925 Retail 28,9111 257 2,241 31,409 244,789 1,736 7,004 253,529 Held-to-maturity investments 90,174 - - 90,174 Total 455,942 1,736 7,004 464,682
(CZKm) 2006
Financial assets designated at fair value through profit or loss 28,482 - - 28,482 Available-for-sale financial assets 54,640 - - 54,640 Loans and receivables Central government 11,486 - - 11,486 Noncredit institutions 3,398 - - 3,398 Credit institutions 27,106 - 26 27,132 Corporate 129,500 5,375 5,207 140,082 Retail 25,109 452 1,614 27,175 196,599 5,827 6,847 209,273 Held-to-maturity investments 81,234 - - 81,234 Total 360,955 5,827 6,847 373,629
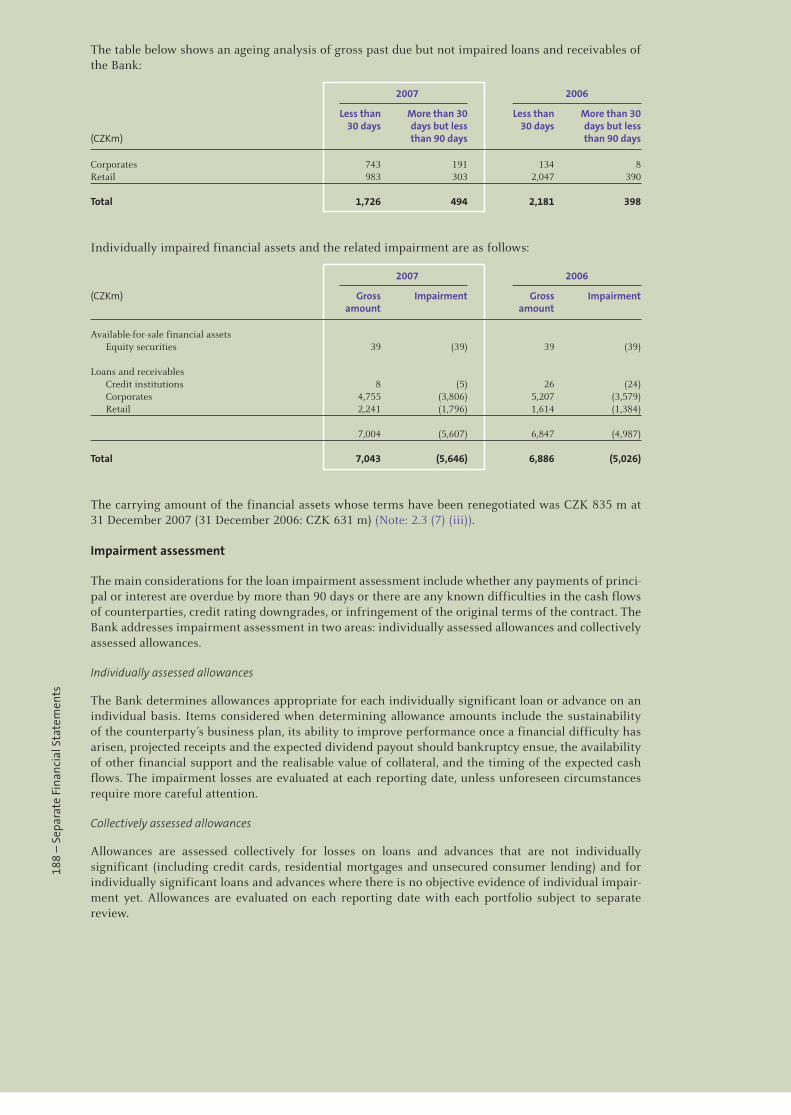
188
– S
epar
ate
Fina
ncia
l Sta
tem
ents
The table below shows an ageing analysis of gross past due but not impaired loans and receivables of the Bank:
2007 2006
Less than More than 30 Less than More than 30 30 days days but less 30 days days but less(CZKm) than 90 days than 90 days
Corporates 743 191 134 8Retail 983 303 2,047 390 Total 1,726 494 2,181 398
Individually impaired financial assets and the related impairment are as follows:
2007 2006
(CZKm) Gross Impairment Gross Impairment amount amount
Available-for-sale financial assets Equity securities 39 (39) 39 (39) Loans and receivables Credit institutions 8 (5) 26 (24) Corporates 4,755 (3,806) 5,207 (3,579) Retail 2,241 (1,796) 1,614 (1,384) 7,004 (5,607) 6,847 (4,987) Total 7,043 (5,646) 6,886 (5,026)
The carrying amount of the financial assets whose terms have been renegotiated was CZK 835 m at 31 December 2007 (31 December 2006: CZK 631 m) (Note: 2.3 (7) (iii)).
Impairment assessment
The main considerations for the loan impairment assessment include whether any payments of princi-pal or interest are overdue by more than 90 days or there are any known difficulties in the cash flows of counterparties, credit rating downgrades, or infringement of the original terms of the contract. The Bank addresses impairment assessment in two areas: individually assessed allowances and collectively assessed allowances.
Individually assessed allowances
The Bank determines allowances appropriate for each individually significant loan or advance on an individual basis. Items considered when determining allowance amounts include the sustainability of the counterparty’s business plan, its ability to improve performance once a financial difficulty has arisen, projected receipts and the expected dividend payout should bankruptcy ensue, the availability of other financial support and the realisable value of collateral, and the timing of the expected cash flows. The impairment losses are evaluated at each reporting date, unless unforeseen circumstances require more careful attention.
Collectively assessed allowances
Allowances are assessed collectively for losses on loans and advances that are not individually significant (including credit cards, residential mortgages and unsecured consumer lending) and for individually significant loans and advances where there is no objective evidence of individual impair-ment yet. Allowances are evaluated on each reporting date with each portfolio subject to separate review.
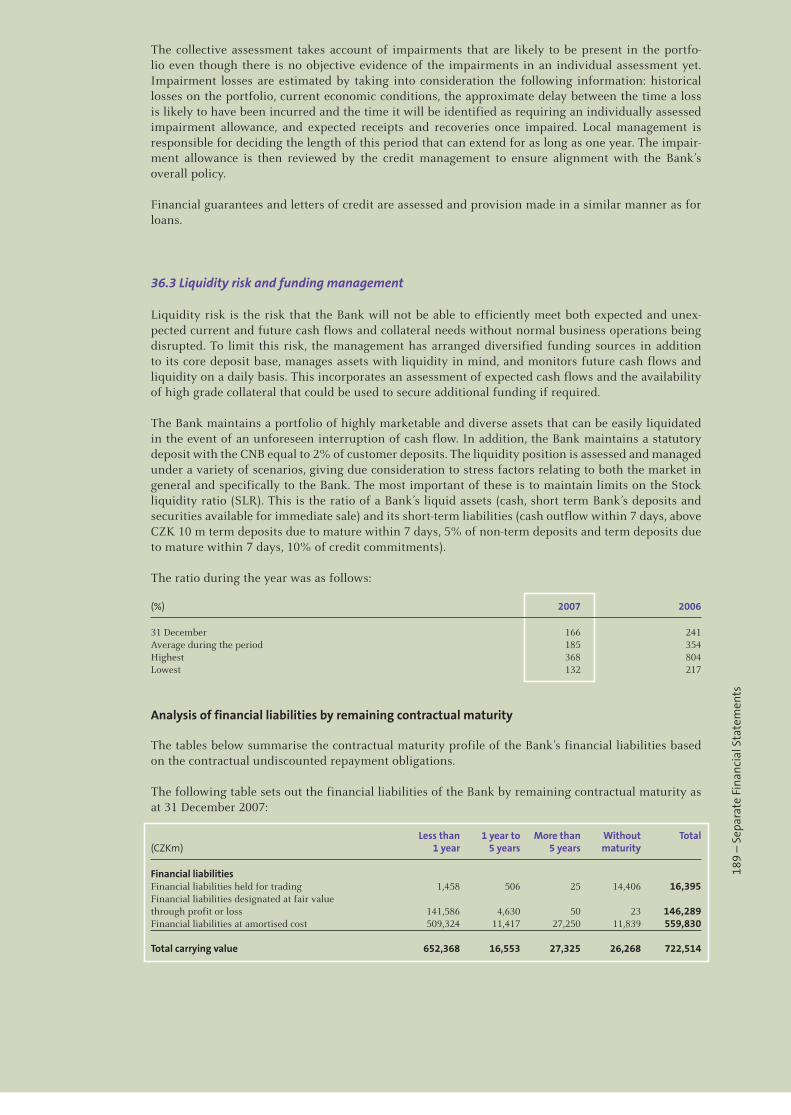
189
– S
epar
ate
Fina
ncia
l Sta
tem
ents
The collective assessment takes account of impairments that are likely to be present in the portfo-lio even though there is no objective evidence of the impairments in an individual assessment yet. Impairment losses are estimated by taking into consideration the following information: historical losses on the portfolio, current economic conditions, the approximate delay between the time a loss is likely to have been incurred and the time it will be identified as requiring an individually assessed impairment allowance, and expected receipts and recoveries once impaired. Local management is responsible for deciding the length of this period that can extend for as long as one year. The impair-ment allowance is then reviewed by the credit management to ensure alignment with the Bank’s overall policy.
Financial guarantees and letters of credit are assessed and provision made in a similar manner as for loans.
36.3 Liquidity risk and funding management
Liquidity risk is the risk that the Bank will not be able to efficiently meet both expected and unex-pected current and future cash flows and collateral needs without normal business operations being disrupted. To limit this risk, the management has arranged diversified funding sources in addition to its core deposit base, manages assets with liquidity in mind, and monitors future cash flows and liquidity on a daily basis. This incorporates an assessment of expected cash flows and the availability of high grade collateral that could be used to secure additional funding if required.
The Bank maintains a portfolio of highly marketable and diverse assets that can be easily liquidated in the event of an unforeseen interruption of cash flow. In addition, the Bank maintains a statutory deposit with the CNB equal to 2% of customer deposits. The liquidity position is assessed and managed under a variety of scenarios, giving due consideration to stress factors relating to both the market in general and specifically to the Bank. The most important of these is to maintain limits on the Stock liquidity ratio (SLR). This is the ratio of a Bank’s liquid assets (cash, short term Bank’s deposits and securities available for immediate sale) and its short-term liabilities (cash outflow within 7 days, above CZK 10 m term deposits due to mature within 7 days, 5% of non-term deposits and term deposits due to mature within 7 days, 10% of credit commitments).
The ratio during the year was as follows:
(%) 2007 2006
31 December 166 241Average during the period 185 354Highest 368 804Lowest 132 217
Analysis of financial liabilities by remaining contractual maturity
The tables below summarise the contractual maturity profile of the Bank’s financial liabilities based on the contractual undiscounted repayment obligations.
The following table sets out the financial liabilities of the Bank by remaining contractual maturity as at 31 December 2007:
Less than 1 year to More than Without Total(CZKm) 1 year 5 years 5 years maturity
Financial liabilities Financial liabilities held for trading 1,458 506 25 14,406 16,395Financial liabilities designated at fair value through profit or loss 141,586 4,630 50 23 146,289Financial liabilities at amortised cost 509,324 11,417 27,250 11,839 559,830 Total carrying value 652,368 16,553 27,325 26,268 722,514
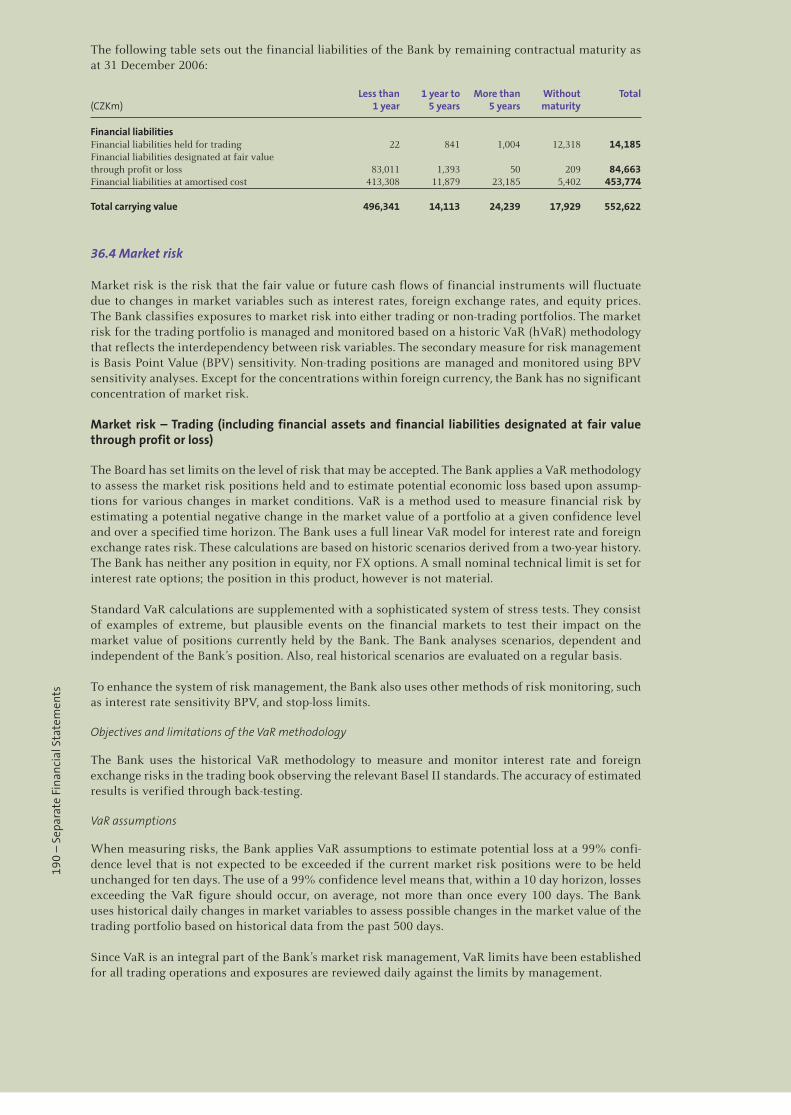
190
– S
epar
ate
Fina
ncia
l Sta
tem
ents
The following table sets out the financial liabilities of the Bank by remaining contractual maturity as at 31 December 2006:
Less than 1 year to More than Without Total(CZKm) 1 year 5 years 5 years maturity
Financial liabilities Financial liabilities held for trading 22 841 1,004 12,318 14,185Financial liabilities designated at fair value through profit or loss 83,011 1,393 50 209 84,663Financial liabilities at amortised cost 413,308 11,879 23,185 5,402 453,774 Total carrying value 496,341 14,113 24,239 17,929 552,622
36.4 Market risk
Market risk is the risk that the fair value or future cash flows of financial instruments will fluctuate due to changes in market variables such as interest rates, foreign exchange rates, and equity prices. The Bank classifies exposures to market risk into either trading or non-trading portfolios. The market risk for the trading portfolio is managed and monitored based on a historic VaR (hVaR) methodology that reflects the interdependency between risk variables. The secondary measure for risk management is Basis Point Value (BPV) sensitivity. Non-trading positions are managed and monitored using BPV sensitivity analyses. Except for the concentrations within foreign currency, the Bank has no significant concentration of market risk.
Market risk – Trading (including financial assets and financial liabilities designated at fair value through profit or loss)
The Board has set limits on the level of risk that may be accepted. The Bank applies a VaR methodology to assess the market risk positions held and to estimate potential economic loss based upon assump-tions for various changes in market conditions. VaR is a method used to measure financial risk by estimating a potential negative change in the market value of a portfolio at a given confidence level and over a specified time horizon. The Bank uses a full linear VaR model for interest rate and foreign exchange rates risk. These calculations are based on historic scenarios derived from a two-year history. The Bank has neither any position in equity, nor FX options. A small nominal technical limit is set for interest rate options; the position in this product, however is not material.
Standard VaR calculations are supplemented with a sophisticated system of stress tests. They consist of examples of extreme, but plausible events on the financial markets to test their impact on the market value of positions currently held by the Bank. The Bank analyses scenarios, dependent and independent of the Bank’s position. Also, real historical scenarios are evaluated on a regular basis.
To enhance the system of risk management, the Bank also uses other methods of risk monitoring, such as interest rate sensitivity BPV, and stop-loss limits.
Objectives and limitations of the VaR methodology
The Bank uses the historical VaR methodology to measure and monitor interest rate and foreign exchange risks in the trading book observing the relevant Basel II standards. The accuracy of estimated results is verified through back-testing.
VaR assumptions
When measuring risks, the Bank applies VaR assumptions to estimate potential loss at a 99% confi-dence level that is not expected to be exceeded if the current market risk positions were to be held unchanged for ten days. The use of a 99% confidence level means that, within a 10 day horizon, losses exceeding the VaR figure should occur, on average, not more than once every 100 days. The Bank uses historical daily changes in market variables to assess possible changes in the market value of the trading portfolio based on historical data from the past 500 days.
Since VaR is an integral part of the Bank’s market risk management, VaR limits have been established for all trading operations and exposures are reviewed daily against the limits by management.
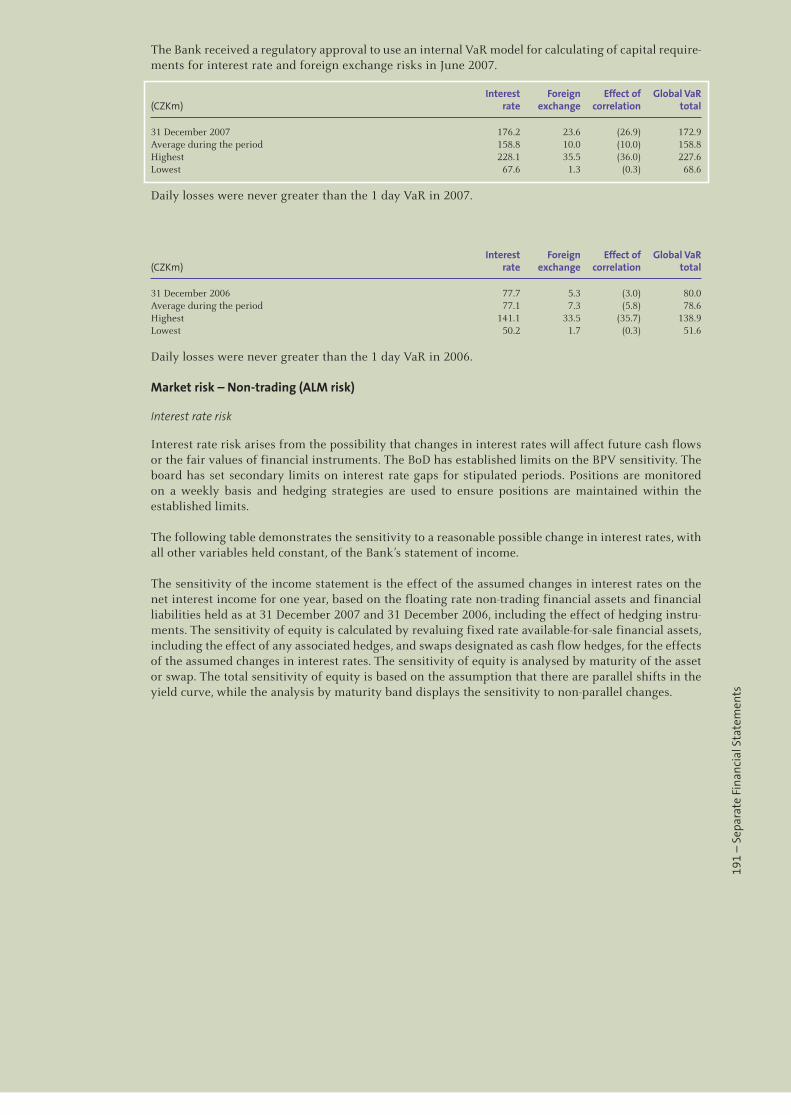
191
– S
epar
ate
Fina
ncia
l Sta
tem
ents
The Bank received a regulatory approval to use an internal VaR model for calculating of capital require-ments for interest rate and foreign exchange risks in June 2007.
Interest Foreign Effect of Global VaR(CZKm) rate exchange correlation total
31 December 2007 176.2 23.6 (26.9) 172.9Average during the period 158.8 10.0 (10.0) 158.8Highest 228.1 35.5 (36.0) 227.6Lowest 67.6 1.3 (0.3) 68.6
Daily losses were never greater than the 1 day VaR in 2007.
Interest Foreign Effect of Global VaR (CZKm) rate exchange correlation total
31 December 2006 77.7 5.3 (3.0) 80.0Average during the period 77.1 7.3 (5.8) 78.6Highest 141.1 33.5 (35.7) 138.9Lowest 50.2 1.7 (0.3) 51.6
Daily losses were never greater than the 1 day VaR in 2006.
Market risk – Non-trading (ALM risk)
Interest rate risk
Interest rate risk arises from the possibility that changes in interest rates will affect future cash flows or the fair values of financial instruments. The BoD has established limits on the BPV sensitivity. The board has set secondary limits on interest rate gaps for stipulated periods. Positions are monitored on a weekly basis and hedging strategies are used to ensure positions are maintained within the established limits.
The following table demonstrates the sensitivity to a reasonable possible change in interest rates, with all other variables held constant, of the Bank’s statement of income.
The sensitivity of the income statement is the effect of the assumed changes in interest rates on the net interest income for one year, based on the floating rate non-trading financial assets and financial liabilities held as at 31 December 2007 and 31 December 2006, including the effect of hedging instru-ments. The sensitivity of equity is calculated by revaluing fixed rate available-for-sale financial assets, including the effect of any associated hedges, and swaps designated as cash flow hedges, for the effects of the assumed changes in interest rates. The sensitivity of equity is analysed by maturity of the asset or swap. The total sensitivity of equity is based on the assumption that there are parallel shifts in the yield curve, while the analysis by maturity band displays the sensitivity to non-parallel changes.
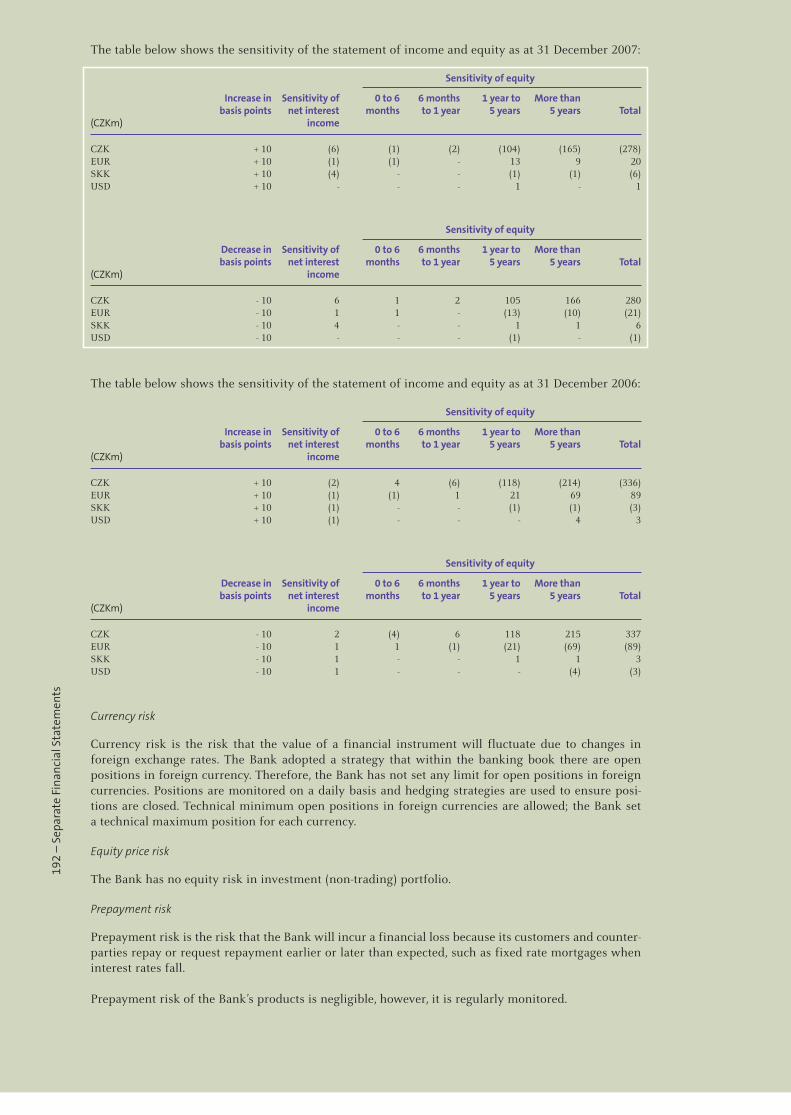
192
– S
epar
ate
Fina
ncia
l Sta
tem
ents
The table below shows the sensitivity of the statement of income and equity as at 31 December 2007:
Sensitivity of equity
Increase in Sensitivity of 0 to 6 6 months 1 year to More than basis points net interest months to 1 year 5 years 5 years Total(CZKm) income
CZK + 10 (6) (1) (2) (104) (165) (278)EUR + 10 (1) (1) - 13 9 20SKK + 10 (4) - - (1) (1) (6)USD + 10 - - - 1 - 1
Sensitivity of equity
Decrease in Sensitivity of 0 to 6 6 months 1 year to More than basis points net interest months to 1 year 5 years 5 years Total(CZKm) income
CZK - 10 6 1 2 105 166 280EUR - 10 1 1 - (13) (10) (21)SKK - 10 4 - - 1 1 6USD - 10 - - - (1) - (1)
The table below shows the sensitivity of the statement of income and equity as at 31 December 2006:
Sensitivity of equity
Increase in Sensitivity of 0 to 6 6 months 1 year to More than basis points net interest months to 1 year 5 years 5 years Total(CZKm) income
CZK + 10 (2) 4 (6) (118) (214) (336)EUR + 10 (1) (1) 1 21 69 89SKK + 10 (1) - - (1) (1) (3)USD + 10 (1) - - - 4 3
Sensitivity of equity
Decrease in Sensitivity of 0 to 6 6 months 1 year to More than basis points net interest months to 1 year 5 years 5 years Total(CZKm) income
CZK - 10 2 (4) 6 118 215 337EUR - 10 1 1 (1) (21) (69) (89)SKK - 10 1 - - 1 1 3USD - 10 1 - - - (4) (3)
Currency risk
Currency risk is the risk that the value of a financial instrument will fluctuate due to changes in foreign exchange rates. The Bank adopted a strategy that within the banking book there are open positions in foreign currency. Therefore, the Bank has not set any limit for open positions in foreign currencies. Positions are monitored on a daily basis and hedging strategies are used to ensure posi-tions are closed. Technical minimum open positions in foreign currencies are allowed; the Bank set a technical maximum position for each currency.
Equity price risk
The Bank has no equity risk in investment (non-trading) portfolio.
Prepayment risk
Prepayment risk is the risk that the Bank will incur a financial loss because its customers and counter-parties repay or request repayment earlier or later than expected, such as fixed rate mortgages when interest rates fall.
Prepayment risk of the Bank’s products is negligible, however, it is regularly monitored.

193
– S
epar
ate
Fina
ncia
l Sta
tem
ents
36.5 Operational risk
Operational risk is the risk of loss resulting from inadequate or failed internal procedures, human and systems errors, or from external events. Operational risks include legal, compliance and tax risks. When controls fail to perform, operational risks can cause damage to reputation, have legal or regula-tory implications, or lead to financial loss. The Bank cannot expect to eliminate all operational risks, but through a control framework and by monitoring and responding to potential risks, the Bank is able to manage the risks. Controls include effective segregation of duties, access, authorisation and reconciliation procedures, staff education and assessment processes, including the use of Internal Audit.
37. Capital
The Bank actively manages capital base to cover risks inherent in the business. The adequacy of the Bank’s capital is monitored using the rules and ratios established by the Basel Committee on Banking Supervision (“Basel II“) and adopted by the CNB in the Regulation No. 123/2007 Coll. on the rules of prudent business carried out by banks, savings and loan cooperatives and securities traders (effective as from 1 June 2007).
During the past year, the Bank complied in full with all its externally imposed capital requirements.
Capital management
The primary objectives of the Bank’s capital management are to ensure that the Bank complies with externally imposed capital requirements and that the Bank maintains strong credit ratings and healthy capital ratios in order to support its business and to maximize shareholder value.
The Bank manages its capital structure considering the changes in economic conditions and the risk characteristics of its activities. In order to maintain or adjust the capital structure, the Bank may ask the sole shareholder to increase capital and optimise its structure.
(CZKm) 2007 2006
Tier 1 capital 31,477 27,869Tier 2 capital 12,618 4,983 Deductible items of Tier 1 and Tier 2 (855) (815) Total capital 43,240 32,037 Risk weighted assets 388,996 344,999 Capital adequacy ratio 11.1 % 9.3 %
In order to keep a long-term target for the capital adequacy ratio and to cover its new business activi-ties the Bank received a subordinated loan provided by KBC Bank NV. This subordinated debt is part of Tier 2 capital.
In December 2007, the Bank’s Tier 1 capital was increased by CZK 6,000 m (Note: 28).

194
– S
epar
ate
Fina
ncia
l Sta
tem
ents

LEED, the US Green Building Rating System, certifies that the new ČSOB headquarters is one of the most environmentally friendly banking houses in Europe.


The internal weather-reporting centre is able to forecast weather 30 minutes in advance and modify accordingly the operation and management of the building.
198
Report of the Board of Directors of Československá obchodní banka, a. s., on Relations between Related Partiesaccording to the provision of Section 66a of Act No. 513/1991 Coll., the Commercial Code, as amended (hereinafter referred to as the “ComC”).
1. Controlled Entity
Československá obchodní banka, a. s.Praha 5, Radlická 333/150, Postcode 150 57Company ID No.: 00001350Incorporated in the Commercial Register, Section B XXXVI, File 46, maintained at the Municipal Court in Prague (hereinafter referred to as “ČSOB” or the “Bank”)
2. Ultimate Controlling Entity
KBC Group NVBelgium, 1080 Brussels, (Sint-Jans Molenbeek), Havenlaan 2
3. Accounting Period
This report describes relations between related parties in accordance with Section 66a of the Commercial Code for the accounting period from 1 January 2007 to 31 December 2007 (hereinafter referred to as the “accounting period”).
4. Relations between Related Parties
In the accounting period, ČSOB maintained rela-tions with related parties in the following areas:
4.1 Basic Banking Transactions
Note: The balances of these transaction arrangements are in-dicated in the Separate Financial Statements (Note: 34 Rela-ted party disclosures).
a. Accounts, Deposit Products, Cash Payments, Domes-tic and International Cash Management
In the accounting period, ČSOB concluded con-tracts with some of the related entities for the provision of services relating to the maintenance of various types of accounts, current and term accounts, interbank deposits, accounts for pay-ments of deposits intended to acquire or increase participation in a company, and for the provision of the following products: Cash Management
Related Parties Report
199
NightLine, Fictive Cash Pooling and Real One-Way Cash Pooling, or these services were provided in the accounting period on the basis of contracts concluded in previous accounting periods. The related entities paid fees for these services based on the price list. Contracts were concluded under standard business terms and conditions. The Bank incurred no damage from the fulfilment of these contracts.
b. Payment Cards
In the accounting period, ČSOB concluded con-tracts with some of the related entities for the issue of payment cards, or they were issued in the accounting period on the basis of contracts concluded in previous accounting periods. The related entities paid fees for these services based on the price list. Contracts were concluded under standard business terms and conditions. The Bank incurred no damage from the fulfil-ment of these contracts.
c. Electronic Banking
In the accounting period, ČSOB concluded con-tracts with some of the related entities on the basis of which it provided the following electro-nic banking products: ČSOB Linka 24, ČSOB Internetbanking, ČSOB Businessbanking, ČSOB MultiCash 24 and ČSOB Edifact 24, or these pro-ducts were provided in the accounting period on the basis of contracts concluded in previous accounting periods. The related entities paid fees for these services based on the price list. Contracts were concluded under standard busi-ness terms and conditions. The Bank incurred no damage from the fulfilment of these contracts.
d. Cheques and Bills of Exchange
In the accounting period, ČSOB concluded contracts with some of the related entities for the procurement of bills of exchange and their custody and contracts for securing the bill-of-ex-change program, or these services were provided in the accounting period on the basis of contracts concluded in previous accounting periods. The consideration provided by the related entities consisted of contractual fees and commissions for placing the bills of exchange. Contracts were concluded under standard business terms and conditions. The Bank incurred no damage from the fulfilment of these contracts.
e. Credit Products and Guarantees
In the accounting period, ČSOB concluded con-tracts with some of the related entities on the basis of which it provided the following credit products: overdrafts, commercial loans, revolving
loans, special purpose loans, subordinated loans and current account overdrafts, and accepted and issued guarantees, provided suretyship, or these services were provided in the accounting period on the basis of contracts concluded in previous accounting periods. The related entities paid contractual fees, remuneration and interest for these services. Contracts were concluded under standard business terms and conditions. The Bank incurred no damage from the fulfilment of these contracts.
f. Investment Services
In the accounting period, ČSOB concluded con-tracts with some of the related entities for the purchase and sale of investment instruments, ISDA contracts, custody contracts, contracts for the settlement of transactions with investment instruments, contracts for the administration of securities, agreements on the authorization of fax instructions regarding settlement and administra-tion of securities, or these services were provided in the accounting period on the basis of contracts and agreements concluded in previous accounting periods. The consideration provided by the related entities consisted of commissions and contractual fees. Contracts and agreements were concluded under standard business terms and conditions. The Bank incurred no damage from the fulfilment of these contracts and agreements.
g. Mortgage Bonds and Bonds
In the accounting period, ČSOB concluded man-date contracts with some of the related entities for the procurement of an issue of mortgage bonds issued in the domestic market within the framework of a bond programme, and mandate contracts for the procurement of an issue of debentures, contracts for subscription and pur-chase of mortgage bonds/bonds, contracts for the administration of the issue and arrangement of payments, or these services were provided in the accounting period on the basis of contracts concluded in previous accounting periods. The related entities paid contractual commissions for these services. Contracts were concluded under standard business terms and conditions. The Bank incurred no damage from the fulfil-ment of these contracts.
4.2 Other Relations
4.2.1 Contracts
a. Leasing Contracts
In the accounting period, ČSOB concluded lea-sing contracts with some of the related entities and, in certain cases, related entities provided performance in the accounting period on the
200
basis of leasing contracts concluded in previous accounting periods. The consideration exchan-ged with the related entities consisted of finan-cial leasing. Contracts were concluded under standard business terms and conditions. The Bank incurred no damage from the fulfilment of these contracts.
b. Insurance Contracts
In the accounting period, ČSOB concluded insu-rance contracts with some of the related entities and, in certain cases, related entities performed activities in the accounting period on the basis of insurance contracts concluded in previous accounting periods. The consideration exchan-ged with the related entities consisted of insu-rance and insurance compensation. Contracts were concluded under standard business terms and conditions. The Bank incurred no damage from the fulfilment of these contracts.
c. Lease and Rent Contracts
In the accounting period, ČSOB concluded con-tracts with some of the related entities for the rent of non-residential areas, parking places and movable assets and, in certain cases, related entities performed activities in the accounting period on the basis of rent contracts concluded in previous accounting periods. The consideration exchanged with the related entities consisted of contractual prices or the lease of certain items. Contracts were concluded under standard busi-ness terms and conditions. The Bank incurred no damage from the fulfilment of these contracts.
d. Co-operation Agreements – Employee Benefits
In the accounting period, ČSOB concluded co-operation agreements - employee benefits with some of the related entities and, in certain cases, related entities performed activities in the accounting period on the basis of agreements relating to this area concluded in previous accounting periods. The consideration exchan-ged with the related entities consisted of the provision of employee benefits. Agreements were concluded under standard business terms and conditions. The Bank incurred no damage from the fulfilment of these agreements.
e. Co-operation Agreements – Selling Products and Services
In the accounting period, ČSOB concluded coope-ration agreements with some of the related enti-ties whose subject was, in particular, cooperation in the areas of product sales, products sales agency, sales support, consultancy, opportunity-seeking and, in certain cases, related entities performed
activities in the accounting period on the basis of agreements relating to this area concluded in previous accounting periods. The consideration exchanged with the related entities consisted of co-operation, contractual commissions, con-tractual fees or selling products. Contracts were concluded under standard business terms and conditions. The Bank incurred no damage from the fulfilment of these contracts.
Additionally, in the accounting period ČSOB concluded with some of the related entities agree-ments on personal data processing, confidentia-lity agreements, agreements on the transmission of information, agreements on mutual rights and duties in connection with the co-operation agreements, and, in certain cases, related entities performed activities in the accounting period on the basis of agreements relating to this area concluded in previous accounting periods. The consideration exchanged with the related enti-ties consisted of the provision of information and confidentiality. Contracts were concluded under standard business terms and conditions. The Bank incurred no damage from the fulfil-ment of these contracts.
f. Agreements on Providing Services – IT
In the accounting period, ČSOB concluded agreements with some of the related entities for providing services in the area of information systems and technologies, involving, in particu-lar, leasing or borrowing hardware or software, assignment of rights to software, provision of software licences and software maintenance, and, in certain cases, related entities performed activities in the accounting period on the basis of contracts concluded in previous accounting peri-ods. The consideration exchanged with the rela-ted entities consisted of contractual prices or the provision of hardware, software or licences, or the assignment of rights to software or software maintenance. Contracts were concluded under standard business terms and conditions. The Bank incurred no damage from the fulfilment of these contracts.
g. Agreements on Providing Services – Call Centre
In the accounting period, ČSOB concluded agreements with some of the related entities for providing Call Centre services, and, in certain cases, related entities performed activities in the accounting period on the basis of contracts concluded in previous accounting periods. The consideration provided by the related entities consisted of contractual commissions. Contracts and agreements were concluded under standard business terms and conditions. The Bank incur-red no damage from the fulfilment of these con-tracts and agreements.
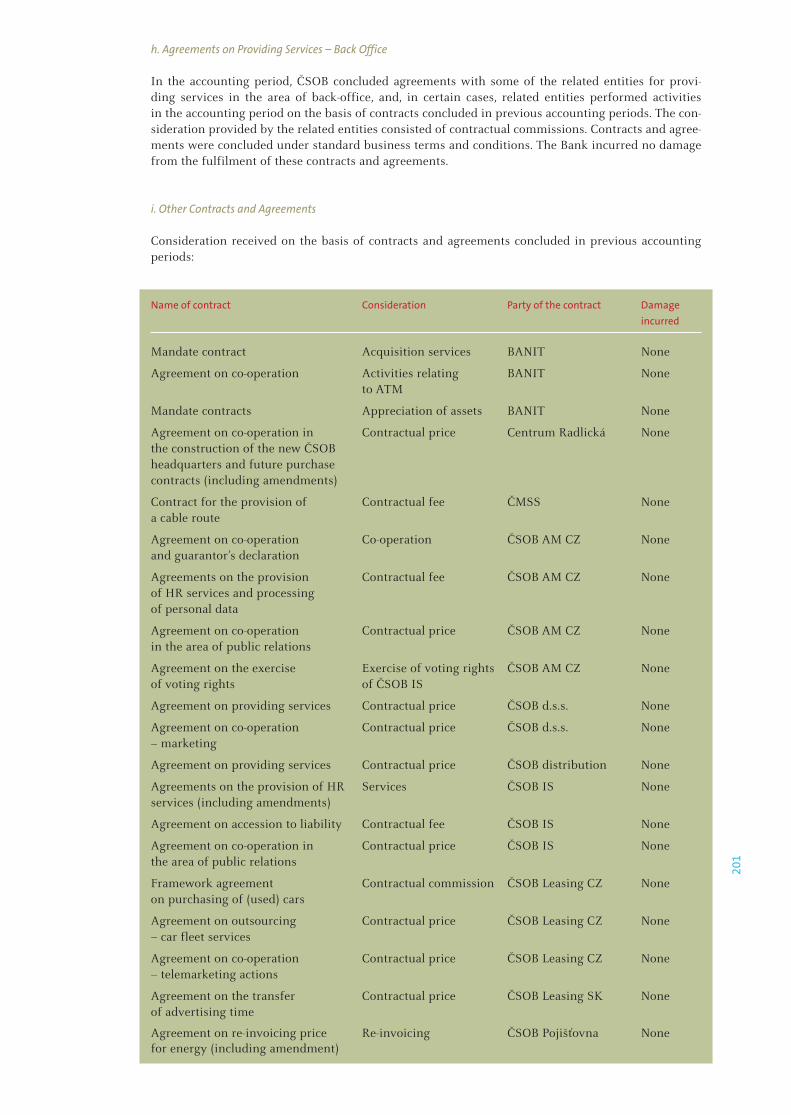
201
h. Agreements on Providing Services – Back Office
In the accounting period, ČSOB concluded agreements with some of the related entities for provi-ding services in the area of back-office, and, in certain cases, related entities performed activities in the accounting period on the basis of contracts concluded in previous accounting periods. The con-sideration provided by the related entities consisted of contractual commissions. Contracts and agree-ments were concluded under standard business terms and conditions. The Bank incurred no damage from the fulfilment of these contracts and agreements.
i. Other Contracts and Agreements
Consideration received on the basis of contracts and agreements concluded in previous accounting periods:
Name of contract Consideration Party of the contract Damage incurred
Mandate contract Acquisition services BANIT None
Agreement on co-operation Activities relating BANIT None to ATM
Mandate contracts Appreciation of assets BANIT None
Agreement on co-operation in Contractual price Centrum Radlická Nonethe construction of the new ČSOB headquarters and future purchase contracts (including amendments)
Contract for the provision of Contractual fee ČMSS Nonea cable route
Agreement on co-operation Co-operation ČSOB AM CZ Noneand guarantor’s declaration
Agreements on the provision Contractual fee ČSOB AM CZ Noneof HR services and processing of personal data
Agreement on co-operation Contractual price ČSOB AM CZ Nonein the area of public relations
Agreement on the exercise Exercise of voting rights ČSOB AM CZ Noneof voting rights of ČSOB IS
Agreement on providing services Contractual price ČSOB d.s.s. None
Agreement on co-operation Contractual price ČSOB d.s.s. None– marketing
Agreement on providing services Contractual price ČSOB distribution None
Agreements on the provision of HR Services ČSOB IS Noneservices (including amendments)
Agreement on accession to liability Contractual fee ČSOB IS None
Agreement on co-operation in Contractual price ČSOB IS Nonethe area of public relations
Framework agreement Contractual commission ČSOB Leasing CZ Noneon purchasing of (used) cars
Agreement on outsourcing Contractual price ČSOB Leasing CZ None– car fleet services
Agreement on co-operation Contractual price ČSOB Leasing CZ None– telemarketing actions
Agreement on the transfer Contractual price ČSOB Leasing SK Noneof advertising time
Agreement on re-invoicing price Re-invoicing ČSOB Pojišťovna Nonefor energy (including amendment)
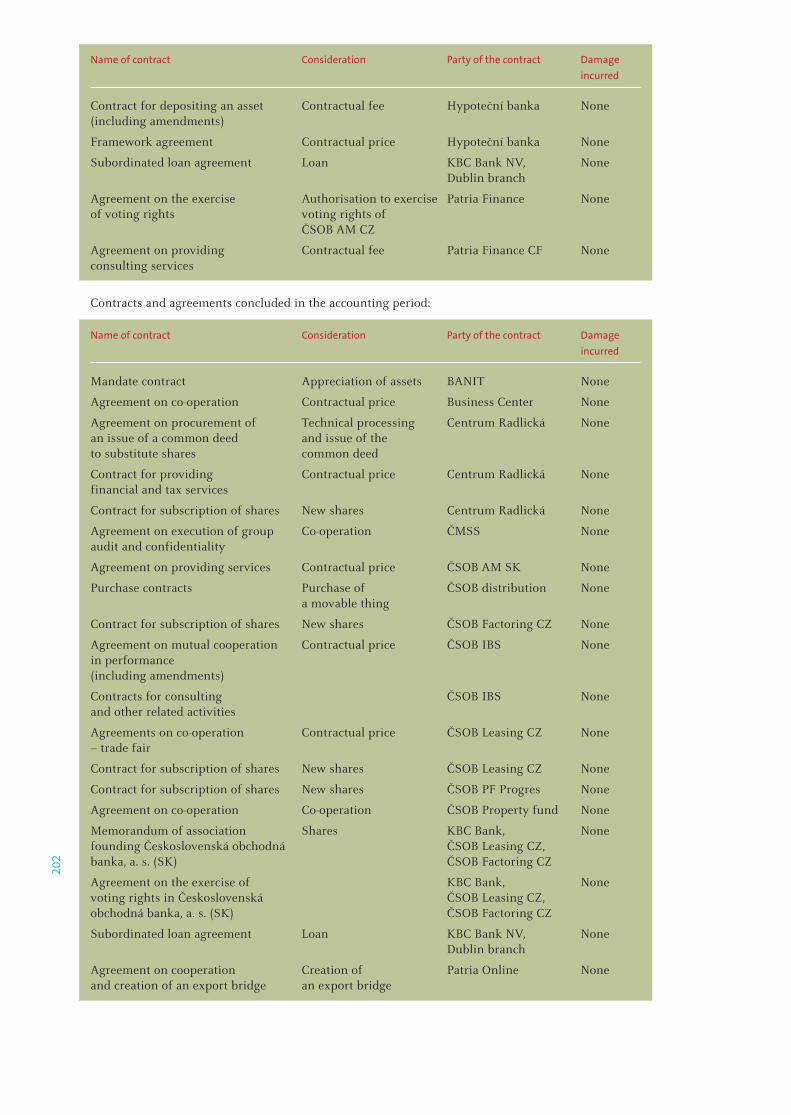
202
Name of contract Consideration Party of the contract Damage incurred
Contract for depositing an asset Contractual fee Hypoteční banka None(including amendments)
Framework agreement Contractual price Hypoteční banka None
Subordinated loan agreement Loan KBC Bank NV, None Dublin branch
Agreement on the exercise Authorisation to exercise Patria Finance Noneof voting rights voting rights of ČSOB AM CZ
Agreement on providing Contractual fee Patria Finance CF Noneconsulting services
Contracts and agreements concluded in the accounting period:
Name of contract Consideration Party of the contract Damage incurred
Mandate contract Appreciation of assets BANIT None
Agreement on co-operation Contractual price Business Center None
Agreement on procurement of Technical processing Centrum Radlická Nonean issue of a common deed and issue of theto substitute shares common deed
Contract for providing Contractual price Centrum Radlická Nonefinancial and tax services
Contract for subscription of shares New shares Centrum Radlická None
Agreement on execution of group Co-operation ČMSS Noneaudit and confidentiality
Agreement on providing services Contractual price ČSOB AM SK None
Purchase contracts Purchase of ČSOB distribution None a movable thing
Contract for subscription of shares New shares ČSOB Factoring CZ None
Agreement on mutual cooperation Contractual price ČSOB IBS Nonein performance (including amendments)
Contracts for consulting ČSOB IBS Noneand other related activities
Agreements on co-operation Contractual price ČSOB Leasing CZ None– trade fair
Contract for subscription of shares New shares ČSOB Leasing CZ None
Contract for subscription of shares New shares ČSOB PF Progres None
Agreement on co-operation Co-operation ČSOB Property fund None
Memorandum of association Shares KBC Bank, Nonefounding Československá obchodná ČSOB Leasing CZ,banka, a. s. (SK) ČSOB Factoring CZ
Agreement on the exercise of KBC Bank, Nonevoting rights in Československá ČSOB Leasing CZ,obchodná banka, a. s. (SK) ČSOB Factoring CZ
Subordinated loan agreement Loan KBC Bank NV, None Dublin branch
Agreement on cooperation Creation of Patria Online Noneand creation of an export bridge an export bridge
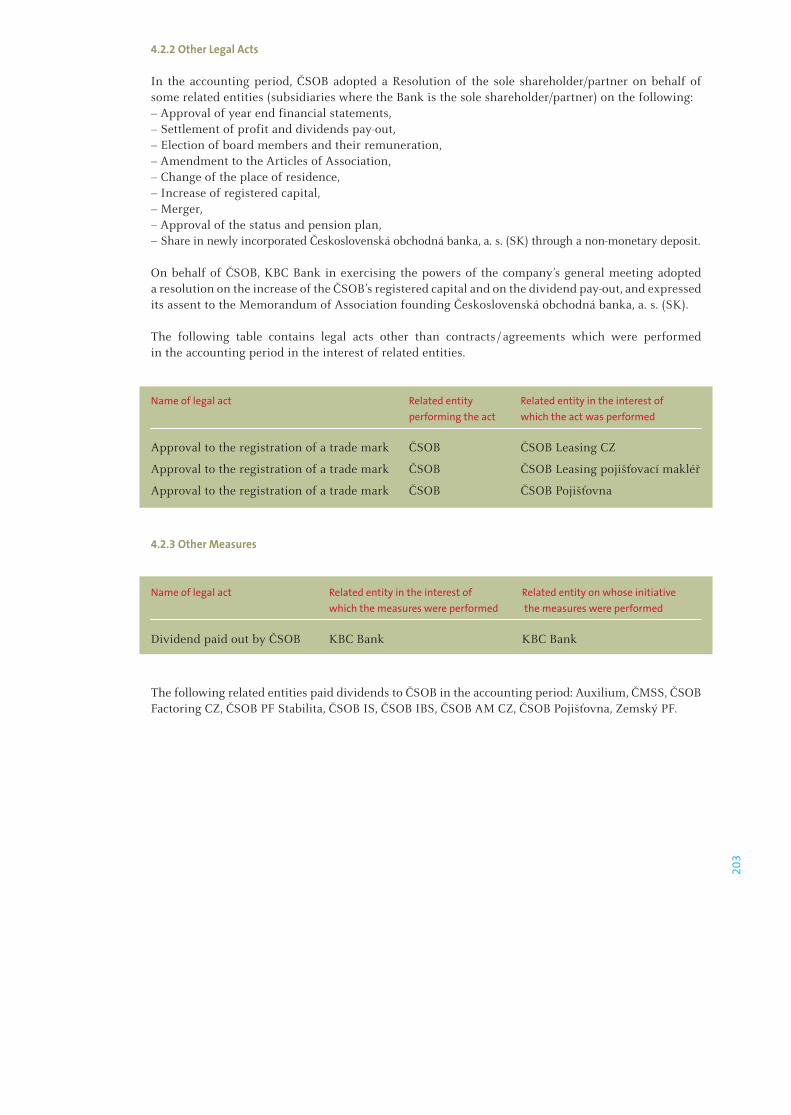
203
4.2.2 Other Legal Acts
In the accounting period, ČSOB adopted a Resolution of the sole shareholder/partner on behalf of some related entities (subsidiaries where the Bank is the sole shareholder/partner) on the following:– Approval of year end financial statements,– Settlement of profit and dividends pay-out,– Election of board members and their remuneration,– Amendment to the Articles of Association,– Change of the place of residence,– Increase of registered capital,– Merger,– Approval of the status and pension plan,– Share in newly incorporated Československá obchodná banka, a. s. (SK) through a non-monetary deposit.
On behalf of ČSOB, KBC Bank in exercising the powers of the company’s general meeting adopted a resolution on the increase of the ČSOB’s registered capital and on the dividend pay-out, and expressed its assent to the Memorandum of Association founding Československá obchodná banka, a. s. (SK).
The following table contains legal acts other than contracts / agreements which were performed in the accounting period in the interest of related entities.
Name of legal act Related entity Related entity in the interest of performing the act which the act was performed
Approval to the registration of a trade mark ČSOB ČSOB Leasing CZ
Approval to the registration of a trade mark ČSOB ČSOB Leasing pojišťovací makléř
Approval to the registration of a trade mark ČSOB ČSOB Pojišťovna
4.2.3 Other Measures
Name of legal act Related entity in the interest of Related entity on whose initiative which the measures were performed the measures were performed
Dividend paid out by ČSOB KBC Bank KBC Bank
The following related entities paid dividends to ČSOB in the accounting period: Auxilium, ČMSS, ČSOB Factoring CZ, ČSOB PF Stabilita, ČSOB IS, ČSOB IBS, ČSOB AM CZ, ČSOB Pojišťovna, Zemský PF.
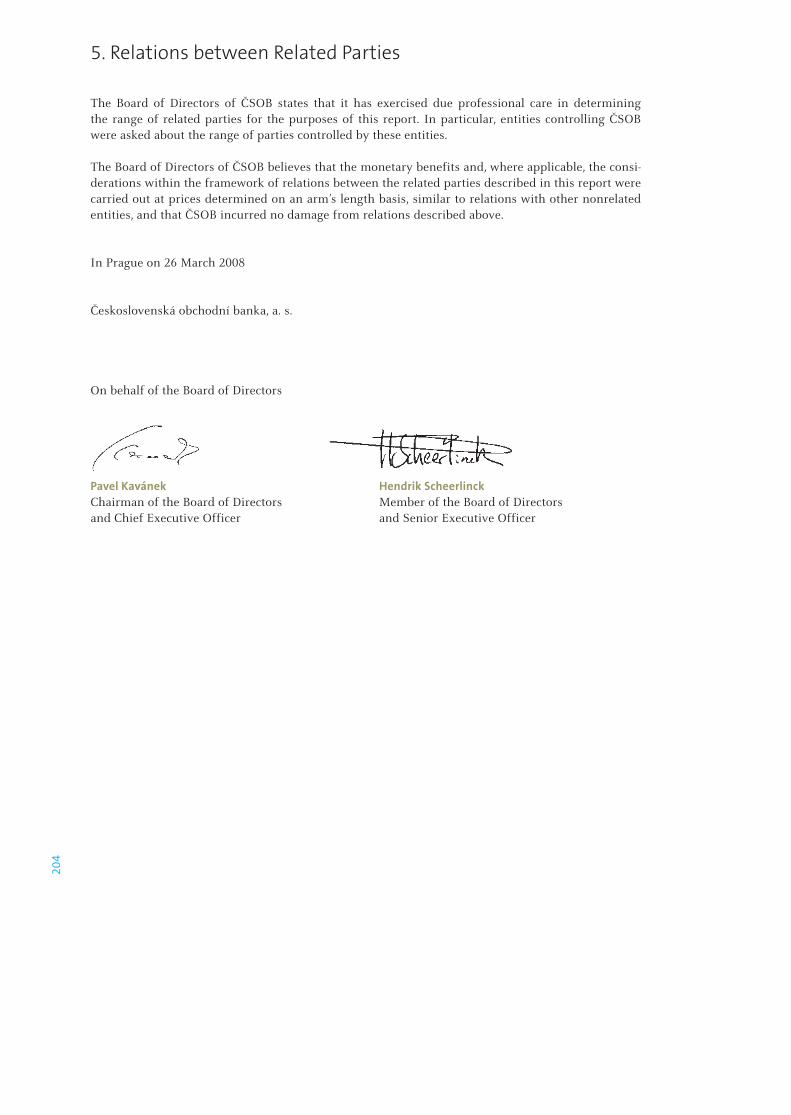
204
5. Relations between Related Parties
The Board of Directors of ČSOB states that it has exercised due professional care in determining the range of related parties for the purposes of this report. In particular, entities controlling ČSOB were asked about the range of parties controlled by these entities.
The Board of Directors of ČSOB believes that the monetary benefits and, where applicable, the consi-derations within the framework of relations between the related parties described in this report were carried out at prices determined on an arm’s length basis, similar to relations with other nonrelated entities, and that ČSOB incurred no damage from relations described above.
In Prague on 26 March 2008
Československá obchodní banka, a. s.
On behalf of the Board of Directors
Pavel Kavánek Hendrik ScheerlinckChairman of the Board of Directors Member of the Board of Directorsand Chief Executive Officer and Senior Executive Officer

205


The building boasts a precision system of ventilation, air conditioning and roof blinders to minimize heating costs. The roof and most terraces are wooded with full-grown trees that make the work environment pleasant but also enhance the heat insulation features of the building.

208
Information on ČSOB Securities
Shares
Shares and share capital of ČSOB (as at 31 December 2007)
ISIN CZ0008000288Class ordinary sharesType registered shares with limited transferabilityEdition book-enteredNumber of shares 5,855,000Nominal value CZK 1,000Total issue volume CZK 5,855,000,000Amount of share capital CZK 5,855,000,000Paid up 100%
ČSOB has not issued any convertible bonds or priority bonds as defined by Section 160 of the Commercial Code. In 2007, ČSOB neither held any own shares, nor issued stock certificates.
ČSOB shares are not listed securities, i.e. they have not been admitted to trading on any official regu-lated market in either an EU member state, or an EEC member state.
Additional Information
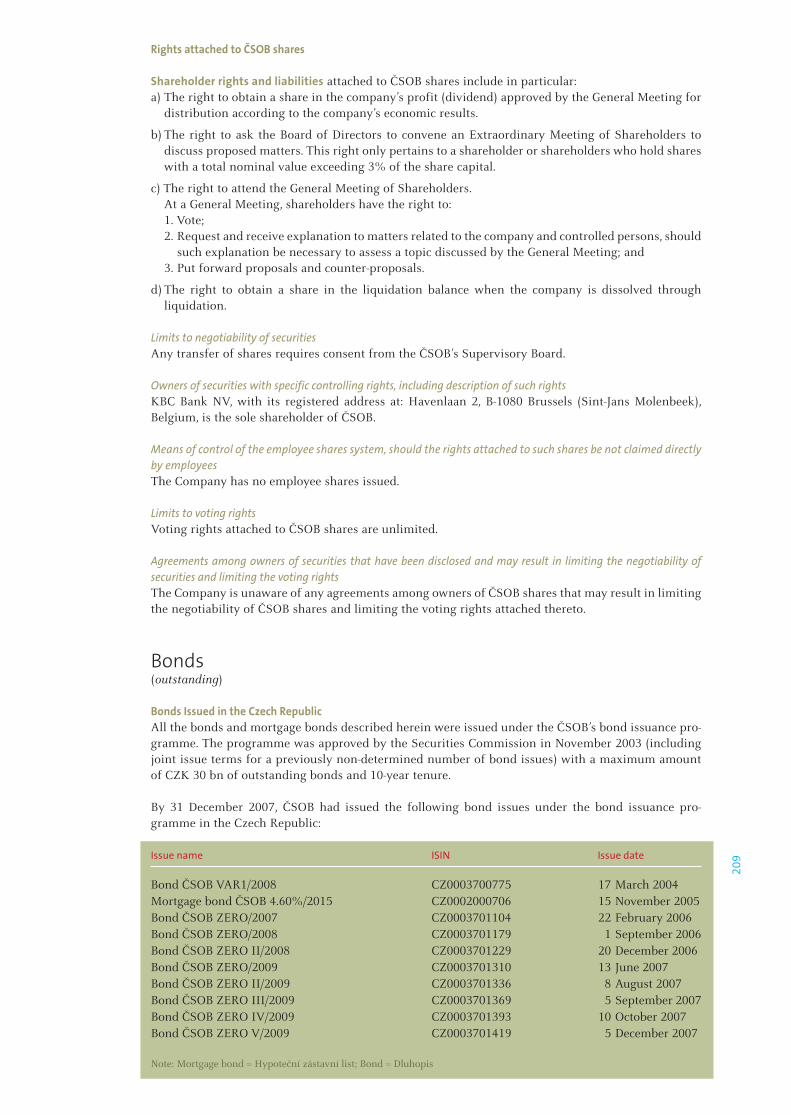
209
Rights attached to ČSOB shares
Shareholder rights and liabilities attached to ČSOB shares include in particular:a) The right to obtain a share in the company’s profit (dividend) approved by the General Meeting for
distribution according to the company’s economic results.
b) The right to ask the Board of Directors to convene an Extraordinary Meeting of Shareholders to discuss proposed matters. This right only pertains to a shareholder or shareholders who hold shares with a total nominal value exceeding 3% of the share capital.
c) The right to attend the General Meeting of Shareholders. At a General Meeting, shareholders have the right to: 1. Vote; 2. Request and receive explanation to matters related to the company and controlled persons, should
such explanation be necessary to assess a topic discussed by the General Meeting; and 3. Put forward proposals and counter-proposals.
d) The right to obtain a share in the liquidation balance when the company is dissolved through liquidation.
Limits to negotiability of securitiesAny transfer of shares requires consent from the ČSOB’s Supervisory Board.
Owners of securities with specific controlling rights, including description of such rightsKBC Bank NV, with its registered address at: Havenlaan 2, B-1080 Brussels (Sint-Jans Molenbeek), Belgium, is the sole shareholder of ČSOB.
Means of control of the employee shares system, should the rights attached to such shares be not claimed directly by employeesThe Company has no employee shares issued.
Limits to voting rightsVoting rights attached to ČSOB shares are unlimited.
Agreements among owners of securities that have been disclosed and may result in limiting the negotiability of securities and limiting the voting rightsThe Company is unaware of any agreements among owners of ČSOB shares that may result in limiting the negotiability of ČSOB shares and limiting the voting rights attached thereto.
Bonds (outstanding)
Bonds Issued in the Czech RepublicAll the bonds and mortgage bonds described herein were issued under the ČSOB’s bond issuance pro-gramme. The programme was approved by the Securities Commission in November 2003 (including joint issue terms for a previously non-determined number of bond issues) with a maximum amount of CZK 30 bn of outstanding bonds and 10-year tenure.
By 31 December 2007, ČSOB had issued the following bond issues under the bond issuance pro-gramme in the Czech Republic:
Issue name ISIN Issue date
Bond ČSOB VAR1/2008 CZ0003700775 17 March 2004Mortgage bond ČSOB 4.60%/2015 CZ0002000706 15 November 2005Bond ČSOB ZERO/2007 CZ0003701104 22 February 2006Bond ČSOB ZERO/2008 CZ0003701179 1 September 2006Bond ČSOB ZERO II/2008 CZ0003701229 20 December 2006Bond ČSOB ZERO/2009 CZ0003701310 13 June 2007Bond ČSOB ZERO II/2009 CZ0003701336 8 August 2007Bond ČSOB ZERO III/2009 CZ0003701369 5 September 2007Bond ČSOB ZERO IV/2009 CZ0003701393 10 October 2007Bond ČSOB ZERO V/2009 CZ0003701419 5 December 2007
Note: Mortgage bond = Hypoteční zástavní list; Bond = Dluhopis
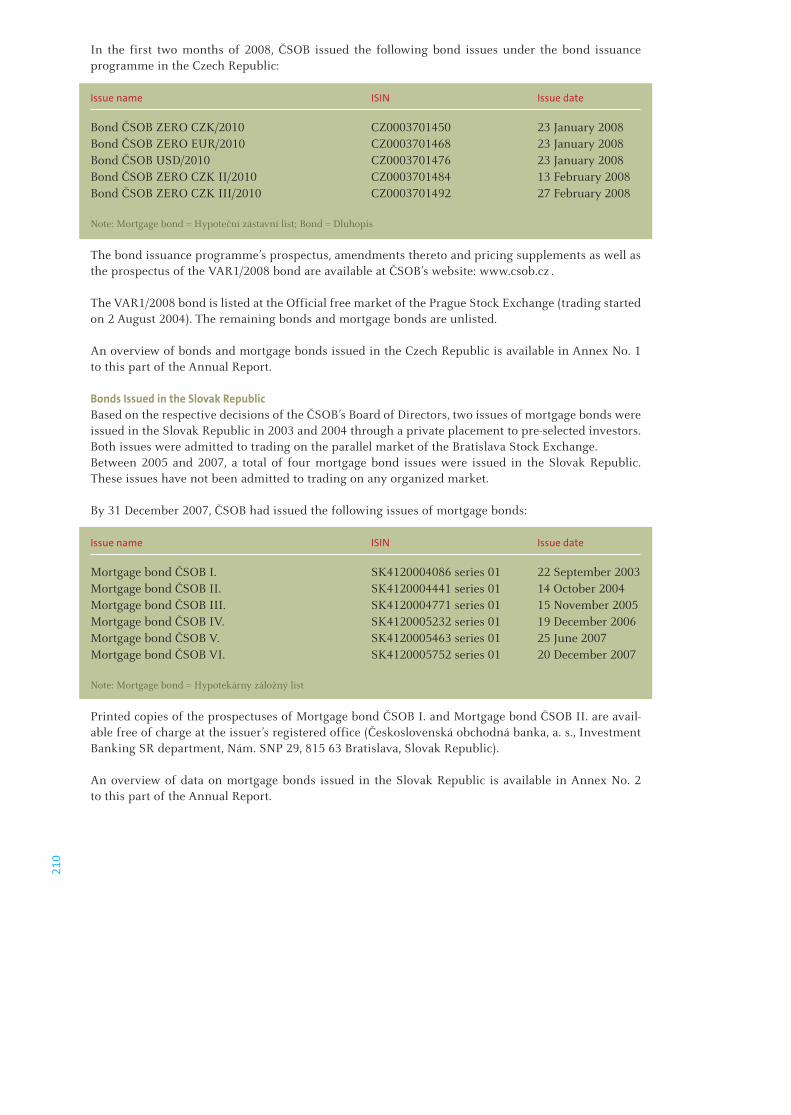
210
In the first two months of 2008, ČSOB issued the following bond issues under the bond issuance programme in the Czech Republic:
Issue name ISIN Issue date
Bond ČSOB ZERO CZK/2010 CZ0003701450 23 January 2008Bond ČSOB ZERO EUR/2010 CZ0003701468 23 January 2008Bond ČSOB USD/2010 CZ0003701476 23 January 2008Bond ČSOB ZERO CZK II/2010 CZ0003701484 13 February 2008Bond ČSOB ZERO CZK III/2010 CZ0003701492 27 February 2008
Note: Mortgage bond = Hypoteční zástavní list; Bond = Dluhopis
The bond issuance programme’s prospectus, amendments thereto and pricing supplements as well as the prospectus of the VAR1/2008 bond are available at ČSOB’s website: www.csob.cz .
The VAR1/2008 bond is listed at the Official free market of the Prague Stock Exchange (trading started on 2 August 2004). The remaining bonds and mortgage bonds are unlisted.
An overview of bonds and mortgage bonds issued in the Czech Republic is available in Annex No. 1 to this part of the Annual Report.
Bonds Issued in the Slovak RepublicBased on the respective decisions of the ČSOB’s Board of Directors, two issues of mortgage bonds were issued in the Slovak Republic in 2003 and 2004 through a private placement to pre-selected investors. Both issues were admitted to trading on the parallel market of the Bratislava Stock Exchange.Between 2005 and 2007, a total of four mortgage bond issues were issued in the Slovak Republic. These issues have not been admitted to trading on any organized market.
By 31 December 2007, ČSOB had issued the following issues of mortgage bonds:
Issue name ISIN Issue date
Mortgage bond ČSOB I. SK4120004086 series 01 22 September 2003Mortgage bond ČSOB II. SK4120004441 series 01 14 October 2004Mortgage bond ČSOB III. SK4120004771 series 01 15 November 2005Mortgage bond ČSOB IV. SK4120005232 series 01 19 December 2006Mortgage bond ČSOB V. SK4120005463 series 01 25 June 2007Mortgage bond ČSOB VI. SK4120005752 series 01 20 December 2007
Note: Mortgage bond = Hypotekárny záložný list
Printed copies of the prospectuses of Mortgage bond ČSOB I. and Mortgage bond ČSOB II. are avail-able free of charge at the issuer’s registered office (Československá obchodná banka, a. s., Investment Banking SR department, Nám. SNP 29, 815 63 Bratislava, Slovak Republic).
An overview of data on mortgage bonds issued in the Slovak Republic is available in Annex No. 2 to this part of the Annual Report.
211
Activity of ČSOBČSOB is active as a universal bank in the Czech Republic. Until 31 December 2007, the Bank had also been active in the Slovak Republic through its organizational unit, registered in the Register of Companies administered by the District Court in Bratislava I under the business name Československá obchodní banka, a.s., a branch of a foreign bank in the Slovak Republic.
Legislation Governing ČSOB
As a legal entity subject to the Czech law, ČSOB follows the applicable legislation in force in the territory of the Czech Republic. Its activities are regulated primarily under the Banking Act, the Act on Business Activities on the Capital Market (also known as the Act on Undertakings on the Capital Market) and the Commercial Code.
A single banking licence granted to ČSOB in accordance with the Banking Act by the decision of the CNB of 28 July 2003, reference number 2003/3350/520, is of fundamental importance for ČSOB’s busi-ness activities. In addition, ČSOB holds a certificate of registration in the register of insurance brokers and independent loss adjusters of insured accidents confirming that it was entered in the register as a tied insurance broker under number 038614VPZ on 20 March 2006. Pursuant to the aforesaid certifi-cate ČSOB also acted as an insurance broker in the Slovak Republic in 2007.
In 2007, ČSOB in the Slovak Republic followed the applicable laws then in force in the territory of the Slovak Republic, especially the Banking Act, the Securities Act and the Commercial Code.
The following permissions were the most important for ČSOB to perform its activities in the Slovak Republic through its foreign branch in 2007:
Decisions of the National Bank of Slovakia• No. UBD-400/2005 of 14 March 2005 on the change of banking permits to carry out banking activities
in order to achieve conformity with legislative terms,• No. UBD-657/2006-PLP of 15 June 2006 on the change (cancellation of the restriction to provide
investment services) of permit No. GRUFT-002/2002/OCP of 19 September 2002 (permission to pro-vide investment services),
Decisions of the Financial Market Office (SK)• No. GRUFT-002/2002/OCP of 19 September 2002 granting permission to provide investment services,• No. GRUFT-029/2004/SOCP of 20 February 2004 granting preliminary consent to carry out activities
of a member of the central depository of Centrálny depozitár cenných papierov SR, a.s. (Central Securities Depository SK).
Main Areas of Activities
ČSOB’s Scope of Business – is defined in the ČSOB Articles of Association (in the part “Corporate Activities and Organisation of
the Company – III. Scope of Business”).
ČSOB, being a universal bank, carries out banking transactions and renders financial services accord-ing to the generally binding legal regulations of the Czech Republic regulating the domestic and for-eign activities of banks. In particular, it accepts deposits from the public and provides loans.
In addition to these basic services, ČSOB is authorized to carry out the following activities according to applicable Czech legal regulations:
– Investment in securities on the Bank’s own account– Financial leasing– Payments and clearance– Issuance and administration of payment instruments– Provision of guarantees– Issuance of letters of credit– Provision of collection services– Provision of all investment services according to a special law
212
– Issuance of mortgage bonds– Financial brokerage– Provision of depository services– Exchange office services (purchase of foreign exchange)– Provision of banking information– Trading in foreign exchange values and gold on the Bank’s own account or on a client’s account– Rental of safe-deposit boxes– Activities directly related to the activities mentioned above, and– Activities carried out for other parties if they relate to the running of the company and operation of
other banks, financial institutions and enterprises providing ancillary banking services, controlled by the company.
In the Slovak Republic, ČSOB was by 31 December 2007 authorized to carry out all banking activities through its foreign branch pursuant to Act No. 483/2001 Coll., Banking Act.
Information on Investments
For information on investments please refer to Notes 3, 21 and 22 of the Notes to the Separate Financial Statements for 2007 according to EU IFRS.
In 2007, investment costs were utilized as follows:
In the Buildings category, ČSOB’s priority was to invest in the expansion and upgrade of the existing branch network so that the points of sale meet as much as possible high standards of client servicing. In 2007, 21 new points of sales were opened and 33 were renovated. The Bank used part of the invest-ment to complete its new headquarters in Prague where some 2,600 employees of the Bank moved during May 2007.
In the Information Technology category, ČSOB invested in new projects, especially payment card sys-tems, electronic banking and payment systems. The Bank used part of the investment to renew and further develop the existing banking systems and to complete its new headquarters in Prague.
In the Other category, ČSOB continued developing its ATM network in the Czech Republic and renewing its car fleet. The branch network expansion and upgrade induced investments in the purchase and upgrade of technical equipment and technology in branches.
All investments were financed from the Bank’s own resources.
Main Future Investments(excluding financial investments)
The volume of ČSOB’s investments in 2008 should reach about CZK 2 bn. It is the Bank’s intent to invest the largest part of this amount in the development of its business activities. The rest will be used to improve and optimize existing processes and technologies.
In the Buildings category, ČSOB will continue extending and upgrading its branch network, mainly through opening small branches and optimizing the current locations of points of sale. A significant part of these investments will be directed to renovation and upgrade of the existing points of sale.
In the Information Technology category, ČSOB will focus on new projects, including electronic banking, payment systems, client service systems and development of management reporting systems. A considerable part of these investments will be used to replace the current IT equipment and software applications.
In the Other category, the Bank plans to go on purchasing and upgrading technical equipment and technologies throughout the branch network as well as renewing the car fleet and security systems. Part of the investment will be devoted to further optimize ČSOB’s internal processes.
Significant Contracts
Outside the ordinary course of ČSOB’s business, the Bank has entered into no contracts which could result in any Group member being under an obligation or entitlement that is material to ČSOB’s ability to meet its obligation to security holders in respect of the securities being issued.
ČSOB is unaware of any agreements in which it is a contracting party and that come into effect, are amended, or the efficiency of which terminates in consequence of any changes in the control circum-stances implied by an offer for takeover.
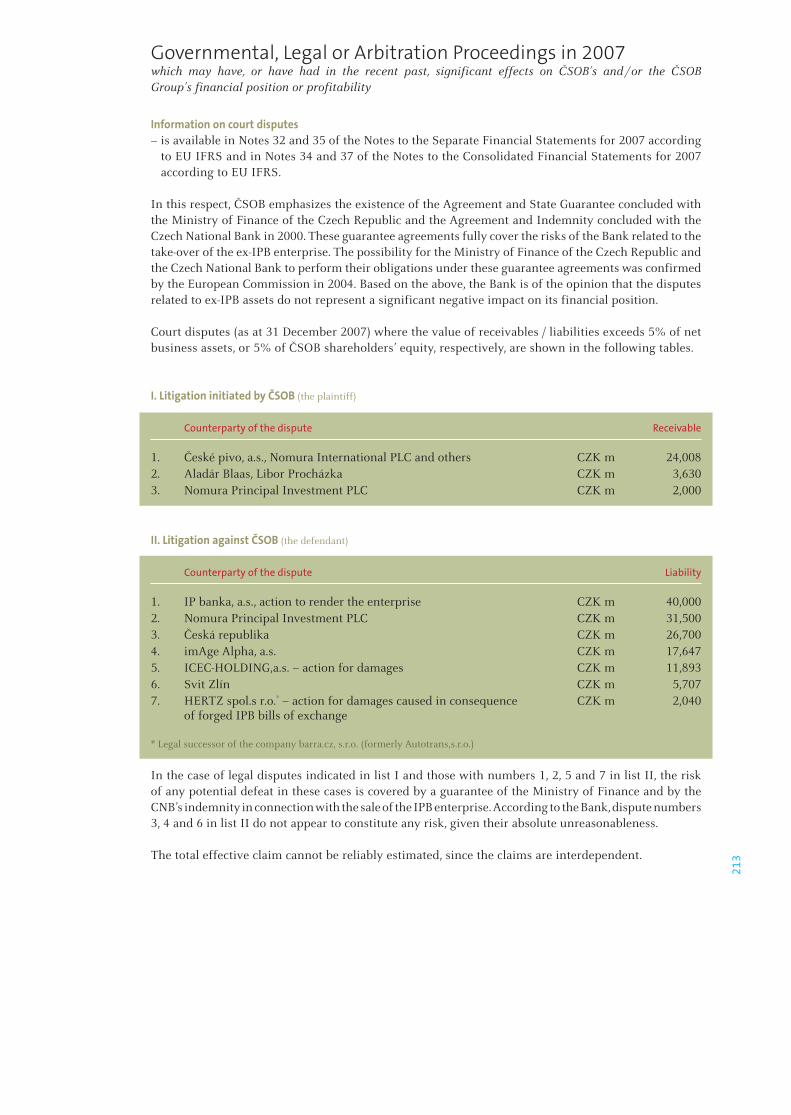
213
Governmental, Legal or Arbitration Proceedings in 2007which may have, or have had in the recent past, significant effects on ČSOB’s and / or the ČSOB Group’s financial position or profitability
Information on court disputes– is available in Notes 32 and 35 of the Notes to the Separate Financial Statements for 2007 according
to EU IFRS and in Notes 34 and 37 of the Notes to the Consolidated Financial Statements for 2007 according to EU IFRS.
In this respect, ČSOB emphasizes the existence of the Agreement and State Guarantee concluded with the Ministry of Finance of the Czech Republic and the Agreement and Indemnity concluded with the Czech National Bank in 2000. These guarantee agreements fully cover the risks of the Bank related to the take-over of the ex-IPB enterprise. The possibility for the Ministry of Finance of the Czech Republic and the Czech National Bank to perform their obligations under these guarantee agreements was confirmed by the European Commission in 2004. Based on the above, the Bank is of the opinion that the disputes related to ex-IPB assets do not represent a significant negative impact on its financial position.
Court disputes (as at 31 December 2007) where the value of receivables / liabilities exceeds 5% of net business assets, or 5% of ČSOB shareholders’ equity, respectively, are shown in the following tables.
I. Litigation initiated by ČSOB (the plaintiff)
Counterparty of the dispute Receivable
1. České pivo, a.s., Nomura International PLC and others CZK m 24,0082. Aladár Blaas, Libor Procházka CZK m 3,6303. Nomura Principal Investment PLC CZK m 2,000
II. Litigation against ČSOB (the defendant)
Counterparty of the dispute Liability
1. IP banka, a.s., action to render the enterprise CZK m 40,0002. Nomura Principal Investment PLC CZK m 31,5003. Česká republika CZK m 26,7004. imAge Alpha, a.s. CZK m 17,6475. ICEC-HOLDING,a.s. – action for damages CZK m 11,8936. Svit Zlín CZK m 5,7077. HERTZ spol.s r.o.* – action for damages caused in consequence CZK m 2,040
of forged IPB bills of exchange
* Legal successor of the company barra.cz, s.r.o. (formerly Autotrans,s.r.o.)
In the case of legal disputes indicated in list I and those with numbers 1, 2, 5 and 7 in list II, the risk of any potential defeat in these cases is covered by a guarantee of the Ministry of Finance and by the CNB’s indemnity in connection with the sale of the IPB enterprise. According to the Bank, dispute numbers 3, 4 and 6 in list II do not appear to constitute any risk, given their absolute unreasonableness.
The total effective claim cannot be reliably estimated, since the claims are interdependent.
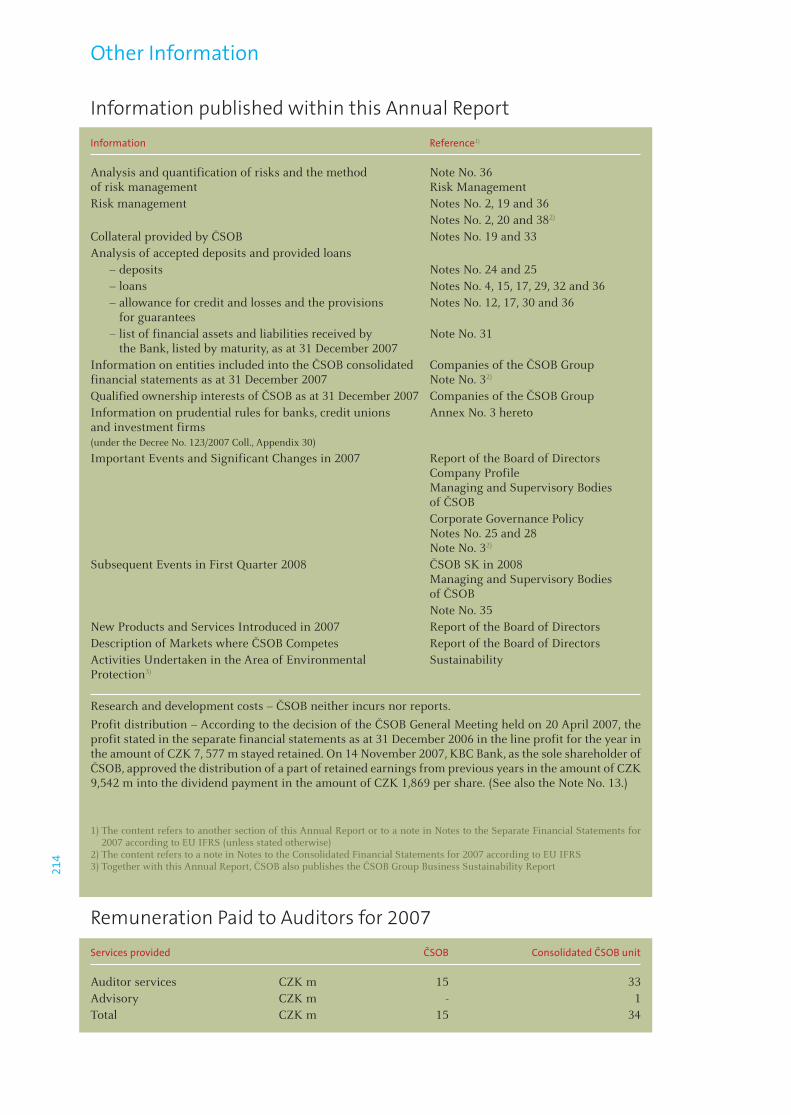
214
Other Information
Information published within this Annual Report
Information Reference1)
Analysis and quantification of risks and the method Note No. 36of risk management Risk ManagementRisk management Notes No. 2, 19 and 36 Notes No. 2, 20 and 382)
Collateral provided by ČSOB Notes No. 19 and 33Analysis of accepted deposits and provided loans – deposits Notes No. 24 and 25 – loans Notes No. 4, 15, 17, 29, 32 and 36 – allowance for credit and losses and the provisions Notes No. 12, 17, 30 and 36
for guarantees – list of financial assets and liabilities received by Note No. 31
the Bank, listed by maturity, as at 31 December 2007Information on entities included into the ČSOB consolidated Companies of the ČSOB Groupfinancial statements as at 31 December 2007 Note No. 32)
Qualified ownership interests of ČSOB as at 31 December 2007 Companies of the ČSOB GroupInformation on prudential rules for banks, credit unions Annex No. 3 heretoand investment firms (under the Decree No. 123/2007 Coll., Appendix 30)
Important Events and Significant Changes in 2007 Report of the Board of Directors Company Profile Managing and Supervisory Bodies of ČSOB Corporate Governance Policy Notes No. 25 and 28 Note No. 32)
Subsequent Events in First Quarter 2008 ČSOB SK in 2008 Managing and Supervisory Bodies of ČSOB Note No. 35New Products and Services Introduced in 2007 Report of the Board of DirectorsDescription of Markets where ČSOB Competes Report of the Board of DirectorsActivities Undertaken in the Area of Environmental SustainabilityProtection3)
Research and development costs – ČSOB neither incurs nor reports.
Profit distribution – According to the decision of the ČSOB General Meeting held on 20 April 2007, the profit stated in the separate financial statements as at 31 December 2006 in the line profit for the year in the amount of CZK 7, 577 m stayed retained. On 14 November 2007, KBC Bank, as the sole shareholder of ČSOB, approved the distribution of a part of retained earnings from previous years in the amount of CZK 9,542 m into the dividend payment in the amount of CZK 1,869 per share. (See also the Note No. 13.)
1) The content refers to another section of this Annual Report or to a note in Notes to the Separate Financial Statements for 2007 according to EU IFRS (unless stated otherwise)
2) The content refers to a note in Notes to the Consolidated Financial Statements for 2007 according to EU IFRS3) Together with this Annual Report, ČSOB also publishes the ČSOB Group Business Sustainability Report
Remuneration Paid to Auditors for 2007
Services provided ČSOB Consolidated ČSOB unit
Auditor services CZK m 15 33Advisory CZK m - 1Total CZK m 15 34
215
Expected Economic and Financial Situation of ČSOB in 2008
Regarding its business goals, ČSOB will focus on maintaining and, in specific areas, increasing its market shares. The Bank is going to achieve this objective by maintaining current and acquiring new clients by offering them high quality services. Financial results of ČSOB in 2008 will be affected by the separation of the Slovak branch to a new legal entity as of 1 January 2008. The ČSOB Group’s financial goals for 2008 count on a growth in operating profit on a comparable basis, continuing reductions of the C/I ratio and stable development in the area of provisions for loans.
Information on the Publication of the ČSOB Annual Report 2007
ČSOB will publish its Annual Report 2007 on its Internet website at www.csob.cz (and ČSOB SK at ww.csob.sk).
The Czech National Bank will add the ČSOB Annual Report 2007 to the collection of deeds of the Register of Companies pursuant to Section 21a of the Accounting Act.
In the Slovak Republic, printed copies of the ČSOB Annual Report 2007 are available free of charge at the registered office of Československá obchodná banka, a. s., Michalská 18, Bratislava 815 63 from the Communications department.
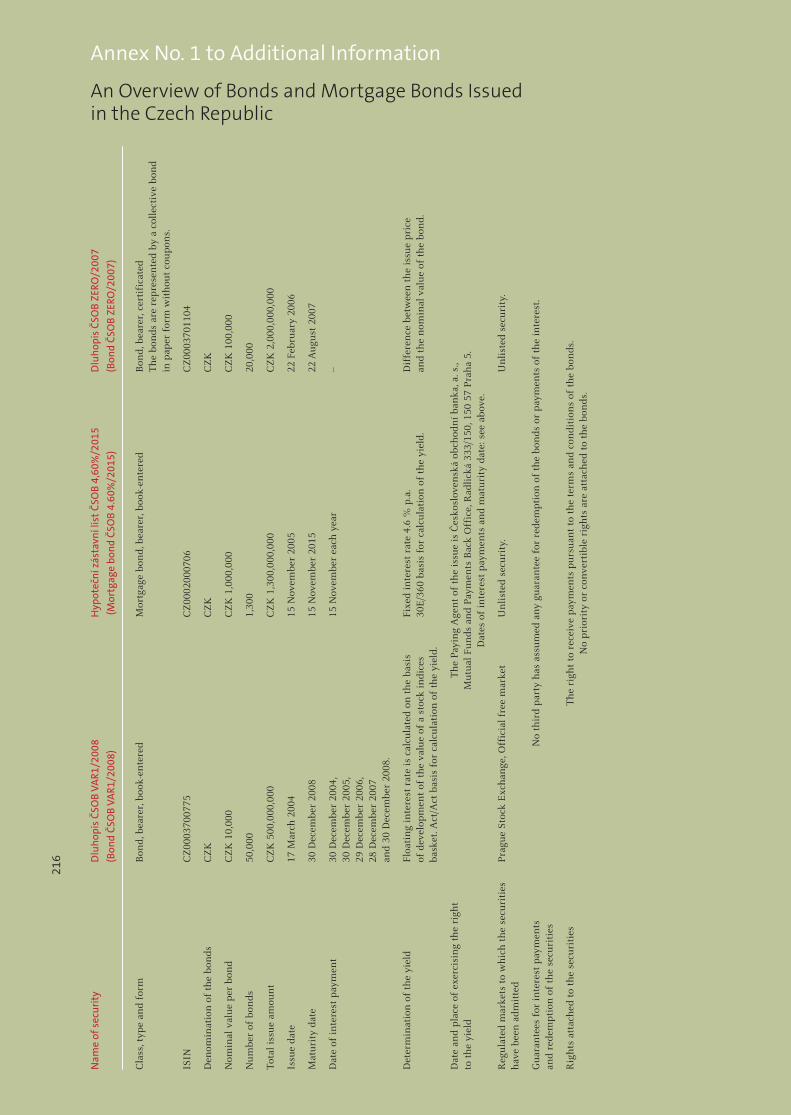
Nam
e of
sec
urit
y D
luho
pis
ČSO
B VA
R1/2
008
H
ypot
eční
zás
tavn
í lis
t ČS
OB
4,60
%/2
015
Dlu
hopi
s ČS
OB
ZERO
/200
7
(B
ond
ČSO
B VA
R1/2
008)
(M
ortg
age
bond
ČSO
B 4.
60%
/201
5)
(Bon
d ČS
OB
ZERO
/200
7)
Cla
ss, t
ype
and
form
B
ond,
bea
rer,
boo
k-en
tere
d M
ortg
age
bon
d, b
eare
r, b
ook-
ente
red
Bon
d, b
eare
r, c
erti
fica
ted
T
he
bon
ds a
re r
epre
sen
ted
by a
col
lect
ive
bon
d
in p
aper
for
m w
ith
out
coup
ons.
ISIN
C
Z00
0370
0775
C
Z00
0200
0706
C
Z00
0370
1104
Den
omin
atio
n o
f th
e bo
nds
C
ZK
C
ZK
C
ZK
Nom
inal
val
ue p
er b
ond
C
ZK
10,
000
CZ
K 1
,000
,000
C
ZK
100
,000
Num
ber
of b
onds
50
,000
1,
300
20,0
00
Tota
l iss
ue a
mou
nt
C
ZK
500
,000
,000
C
ZK
1,3
00,0
00,0
00
CZ
K 2
,000
,000
,000
Issu
e da
te
17 M
arch
200
4 15
Nov
embe
r 20
05
22 F
ebru
ary
2006
Mat
urit
y da
te
30 D
ecem
ber
2008
15
Nov
embe
r 20
15
22 A
ugus
t 20
07
Dat
e of
inte
rest
pay
men
t
30 D
ecem
ber
2004
, 15
Nov
embe
r ea
ch y
ear
--
30 D
ecem
ber
2005
,
29 D
ecem
ber
2006
,
28 D
ecem
ber
2007
an
d 30
Dec
embe
r 20
08.
Det
erm
inat
ion
of
the
yiel
d
Floa
tin
g in
tere
st r
ate
is c
alcu
late
d on
th
e ba
sis
Fi
xed
inte
rest
rat
e 4.
6 %
p.a
. D
iffe
ren
ce b
etw
een
th
e is
sue
pri
ce
of d
evel
opm
ent
of t
he
valu
e of
a s
tock
indi
ces
30
E/3
60 b
asis
for
cal
cula
tion
of
the
yiel
d.
and
the
nom
inal
val
ue o
f th
e bo
nd.
ba
sket
. Act
/Act
bas
is f
or c
alcu
lati
on o
f th
e yi
eld.
Dat
e an
d p
lace
of
exer
cisi
ng
the
righ
t
Th
e Pa
yin
g A
gen
t of
th
e is
sue
is Č
esko
slov
ensk
á ob
chod
ní b
anka
, a. s
.,to
th
e yi
eld
Mut
ual F
unds
an
d Pa
ymen
ts B
ack
Off
ice,
Rad
lick
á 33
3/15
0, 1
50 5
7 P
rah
a 5.
D
ates
of
inte
rest
pay
men
ts a
nd
mat
urit
y da
te: s
ee a
bove
.
Reg
ulat
ed m
arke
ts t
o w
hic
h t
he
secu
riti
es
Pra
gue
Stoc
k E
xch
ange
, Off
icia
l fre
e m
arke
t U
nli
sted
sec
urit
y.
Un
list
ed s
ecur
ity.
hav
e be
en a
dmit
ted
Gua
ran
tees
for
inte
rest
pay
men
ts
No
thir
d p
arty
has
ass
umed
an
y gu
aran
tee
for
rede
mp
tion
of
the
bon
ds o
r p
aym
ents
of
the
inte
rest
.an
d re
dem
pti
on o
f th
e se
curi
ties
Rig
hts
att
ach
ed t
o th
e se
curi
ties
T
he
righ
t to
rec
eive
pay
men
ts p
ursu
ant
to t
he
term
s an
d co
ndi
tion
s of
th
e bo
nds
.
No
pri
orit
y or
con
vert
ible
rig
hts
are
att
ach
ed t
o th
e bo
nds
.
Annex No. 1 to Additional Information
An Overview of Bonds and Mortgage Bonds Issued in the Czech Republic
216
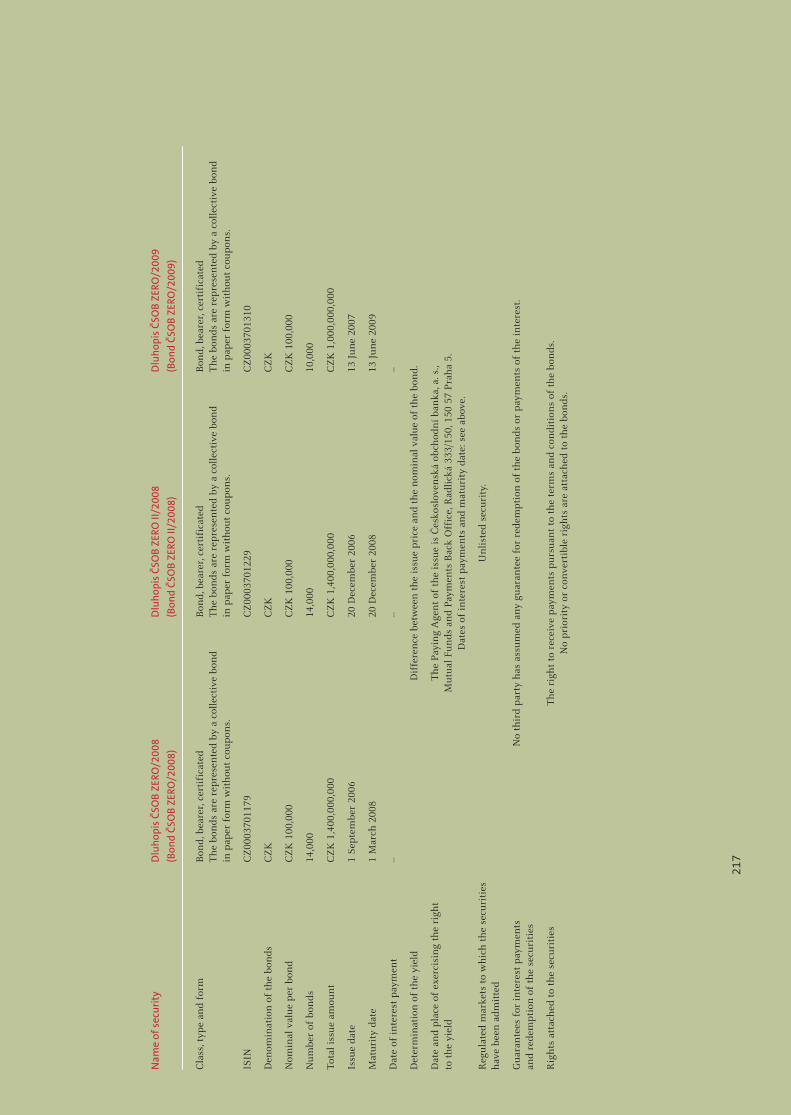
Nam
e of
sec
urit
y D
luho
pis
ČSO
B ZE
RO/2
008
Dlu
hopi
s ČS
OB
ZERO
II/2
008
Dlu
hopi
s ČS
OB
ZERO
/200
9
(Bon
d ČS
OB
ZERO
/200
8)
(Bon
d ČS
OB
ZERO
II/2
008)
(B
ond
ČSO
B ZE
RO/2
009)
Cla
ss, t
ype
and
form
B
ond,
bea
rer,
cer
tifi
cate
d B
ond,
bea
rer,
cer
tifi
cate
d B
ond,
bea
rer,
cer
tifi
cate
d
Th
e bo
nds
are
rep
rese
nte
d by
a c
olle
ctiv
e bo
nd
T
he
bon
ds a
re r
epre
sen
ted
by a
col
lect
ive
bon
d T
he
bon
ds a
re r
epre
sen
ted
by a
col
lect
ive
bon
d
in p
aper
for
m w
ith
out
coup
ons.
in
pap
er f
orm
wit
hou
t co
upon
s.
in p
aper
for
m w
ith
out
coup
ons.
ISIN
C
Z00
0370
1179
C
Z00
0370
1229
C
Z00
0370
1310
Den
omin
atio
n o
f th
e bo
nds
C
ZK
C
ZK
C
ZK
Nom
inal
val
ue p
er b
ond
C
ZK
100
,000
C
ZK
100
,000
C
ZK
100
,000
Num
ber
of b
onds
14
,000
14
,000
10
,000
Tota
l iss
ue a
mou
nt
CZ
K 1
,400
,000
,000
C
ZK
1,4
00,0
00,0
00
CZ
K 1
,000
,000
,000
Issu
e da
te
1 Se
pte
mbe
r 20
06
20 D
ecem
ber
2006
13
Jun
e 20
07
Mat
urit
y da
te
1 M
arch
200
8 20
Dec
embe
r 20
08
13 J
une
2009
Dat
e of
inte
rest
pay
men
t
-- --
–
Det
erm
inat
ion
of
the
yiel
d
Dif
fere
nce
bet
wee
n t
he
issu
e p
rice
an
d th
e n
omin
al v
alue
of
the
bon
d.
Dat
e an
d p
lace
of
exer
cisi
ng
the
righ
t
Th
e Pa
yin
g A
gen
t of
th
e is
sue
is Č
esko
slov
ensk
á ob
chod
ní b
anka
, a. s
.,to
th
e yi
eld
Mut
ual F
unds
an
d Pa
ymen
ts B
ack
Off
ice,
Rad
lick
á 33
3/15
0, 1
50 5
7 P
rah
a 5.
D
ates
of
inte
rest
pay
men
ts a
nd
mat
urit
y da
te: s
ee a
bove
.
Reg
ulat
ed m
arke
ts t
o w
hic
h t
he
secu
riti
es
Un
list
ed s
ecur
ity.
hav
e be
en a
dmit
ted
Gua
ran
tees
for
inte
rest
pay
men
ts
No
thir
d p
arty
has
ass
umed
an
y gu
aran
tee
for
rede
mp
tion
of
the
bon
ds o
r p
aym
ents
of
the
inte
rest
.an
d re
dem
pti
on o
f th
e se
curi
ties
Rig
hts
att
ach
ed t
o th
e se
curi
ties
T
he
righ
t to
rec
eive
pay
men
ts p
ursu
ant
to t
he
term
s an
d co
ndi
tion
s of
th
e bo
nds
.
No
pri
orit
y or
con
vert
ible
rig
hts
are
att
ach
ed t
o th
e bo
nds
.
217

Nam
e of
sec
urit
y D
luho
pis
ČSO
B ZE
RO II
/200
9 D
luho
pis
ČSO
B ZE
RO II
I/20
09
Dlu
hopi
s ČS
OB
ZERO
IV/2
009
(B
ond
ČSO
B ZE
RO II
/200
9)
(Bon
d ČS
OB
ZERO
III/
2009
) (B
ond
ČSO
B ZE
RO IV
/200
9)
Cla
ss, t
ype
and
form
B
ond,
bea
rer,
cer
tifi
cate
d B
ond,
bea
rer,
cer
tifi
cate
d B
ond,
bea
rer,
cer
tifi
cate
d
Th
e bo
nds
are
rep
rese
nte
d by
a c
olle
ctiv
e bo
nd
T
he
bon
ds a
re r
epre
sen
ted
by a
col
lect
ive
bon
d T
he
bon
ds a
re r
epre
sen
ted
by a
col
lect
ive
bon
d
in p
aper
for
m w
ith
out
coup
ons.
in
pap
er f
orm
wit
hou
t co
upon
s.
in p
aper
for
m w
ith
out
coup
ons.
ISIN
C
Z00
0370
1336
C
Z00
0370
1369
C
Z00
0370
1393
Den
omin
atio
n o
f th
e bo
nds
C
ZK
C
ZK
C
ZK
Nom
inal
val
ue p
er b
ond
C
ZK
100
,000
C
ZK
100
,000
C
ZK
100
,000
Num
ber
of b
onds
10
,000
10
,000
10
,000
Tota
l iss
ue a
mou
nt
CZ
K 1
,000
,000
,000
C
ZK
1,0
00,0
00,0
00
CZ
K 1
,000
,000
,000
Issu
e da
te
8 A
ugus
t 20
07
5 Se
pte
mbe
r 20
07
10 O
ctob
er 2
007
Mat
urit
y da
te
8 A
ugus
t 20
09
5 Se
pte
mbe
r 20
09
10 O
ctob
er 2
009
Dat
e of
inte
rest
pay
men
t
-- --
--
Det
erm
inat
ion
of
the
yiel
d
Dif
fere
nce
bet
wee
n t
he
issu
e p
rice
an
d th
e n
omin
al v
alue
of
the
bon
d.
Dat
e an
d p
lace
of
exer
cisi
ng
the
righ
t
Th
e Pa
yin
g A
gen
t of
th
e is
sue
is Č
esko
slov
ensk
á ob
chod
ní b
anka
, a. s
.,to
th
e yi
eld
Mut
ual F
unds
an
d Pa
ymen
ts B
ack
Off
ice,
Rad
lick
á 33
3/15
0, 1
50 5
7 P
rah
a 5.
D
ates
of
inte
rest
pay
men
ts a
nd
mat
urit
y da
te: s
ee a
bove
.
Reg
ulat
ed m
arke
ts t
o w
hic
h t
he
secu
riti
es
Un
list
ed s
ecur
ity.
hav
e be
en a
dmit
ted
Gua
ran
tees
for
inte
rest
pay
men
ts
No
thir
d p
arty
has
ass
umed
an
y gu
aran
tee
for
rede
mp
tion
of
the
bon
ds o
r p
aym
ents
of
the
inte
rest
. an
d re
dem
pti
on o
f th
e se
curi
ties
Rig
hts
att
ach
ed t
o th
e se
curi
ties
T
he
righ
t to
rec
eive
pay
men
ts p
ursu
ant
to t
he
term
s an
d co
ndi
tion
s of
th
e bo
nds
.
No
pri
orit
y or
con
vert
ible
rig
hts
are
att
ach
ed t
o th
e bo
nds
.
218
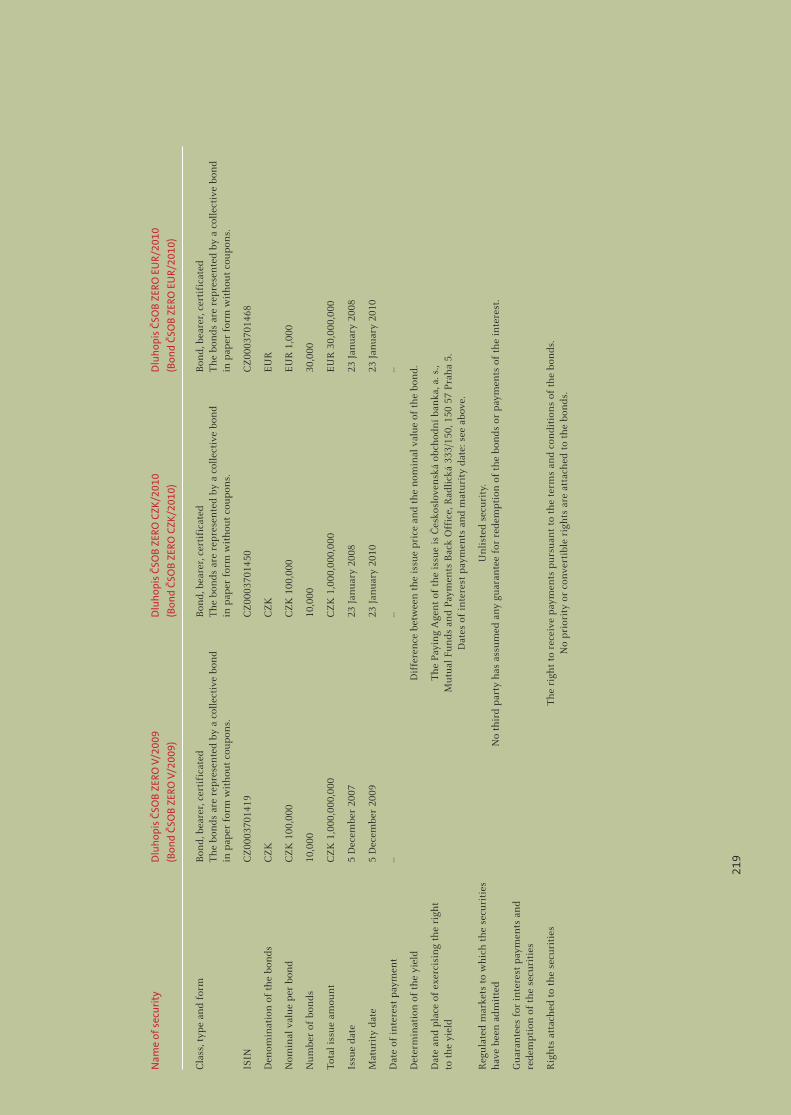
Nam
e of
sec
urit
y D
luho
pis
ČSO
B ZE
RO V
/200
9 D
luho
pis
ČSO
B ZE
RO C
ZK/2
010
Dlu
hopi
s ČS
OB
ZERO
EU
R/20
10
(Bon
d ČS
OB
ZERO
V/2
009)
(B
ond
ČSO
B ZE
RO C
ZK/2
010)
(B
ond
ČSO
B ZE
RO E
UR/
2010
)
Cla
ss, t
ype
and
form
B
ond,
bea
rer,
cer
tifi
cate
d B
ond,
bea
rer,
cer
tifi
cate
d B
ond,
bea
rer,
cer
tifi
cate
d
Th
e bo
nds
are
rep
rese
nte
d by
a c
olle
ctiv
e bo
nd
T
he
bon
ds a
re r
epre
sen
ted
by a
col
lect
ive
bon
d T
he
bon
ds a
re r
epre
sen
ted
by a
col
lect
ive
bon
d
in p
aper
for
m w
ith
out
coup
ons.
in
pap
er f
orm
wit
hou
t co
upon
s.
in p
aper
for
m w
ith
out
coup
ons.
ISIN
C
Z00
0370
1419
C
Z00
0370
1450
C
Z00
0370
1468
Den
omin
atio
n o
f th
e bo
nds
C
ZK
C
ZK
E
UR
Nom
inal
val
ue p
er b
ond
C
ZK
100
,000
C
ZK
100
,000
E
UR
1,0
00
Num
ber
of b
onds
10
,000
10
,000
30
,000
Tota
l iss
ue a
mou
nt
CZ
K 1
,000
,000
,000
C
ZK
1,0
00,0
00,0
00
EU
R 3
0,00
0,00
0
Issu
e da
te
5 D
ecem
ber
2007
23
Jan
uary
200
8 23
Jan
uary
200
8
Mat
urit
y da
te
5 D
ecem
ber
2009
23
Jan
uary
201
0 23
Jan
uary
201
0
Dat
e of
inte
rest
pay
men
t
-- --
--
Det
erm
inat
ion
of
the
yiel
d
Dif
fere
nce
bet
wee
n t
he
issu
e p
rice
an
d th
e n
omin
al v
alue
of
the
bon
d.
Dat
e an
d p
lace
of
exer
cisi
ng
the
righ
t
Th
e Pa
yin
g A
gen
t of
th
e is
sue
is Č
esko
slov
ensk
á ob
chod
ní b
anka
, a. s
.,to
th
e yi
eld
Mut
ual F
unds
an
d Pa
ymen
ts B
ack
Off
ice,
Rad
lick
á 33
3/15
0, 1
50 5
7 P
rah
a 5.
D
ates
of
inte
rest
pay
men
ts a
nd
mat
urit
y da
te: s
ee a
bove
.
Reg
ulat
ed m
arke
ts t
o w
hic
h t
he
secu
riti
es
Un
list
ed s
ecur
ity.
hav
e be
en a
dmit
ted
No
thir
d p
arty
has
ass
umed
an
y gu
aran
tee
for
rede
mp
tion
of
the
bon
ds o
r p
aym
ents
of
the
inte
rest
.
Gua
ran
tees
for
inte
rest
pay
men
ts a
nd
rede
mp
tion
of
the
secu
riti
es
Rig
hts
att
ach
ed t
o th
e se
curi
ties
T
he
righ
t to
rec
eive
pay
men
ts p
ursu
ant
to t
he
term
s an
d co
ndi
tion
s of
th
e bo
nds
.
No
pri
orit
y or
con
vert
ible
rig
hts
are
att
ach
ed t
o th
e bo
nds
.
219

Nam
e of
sec
urit
y D
luho
pis
ČSO
B ZE
RO U
SD/2
010
Dlu
hopi
s ČS
OB
ZERO
CZK
II/2
010
Dlu
hopi
s ČS
OB
ZERO
CZK
III/
2010
(B
ond
ČSO
B ZE
RO U
SD/2
010)
(B
ond
ČSO
B ZE
RO C
ZK II
/201
0)
(Bon
d ČS
OB
ZERO
CZK
III/
2010
)
Cla
ss, t
ype
and
form
B
ond,
bea
rer,
cer
tifi
cate
d B
ond,
bea
rer,
cer
tifi
cate
d B
ond,
bea
rer,
cer
tifi
cate
d
Th
e bo
nds
are
rep
rese
nte
d by
a c
olle
ctiv
e bo
nd
T
he
bon
ds a
re r
epre
sen
ted
by a
col
lect
ive
bon
d
Th
e bo
nds
are
rep
rese
nte
d by
a c
olle
ctiv
e bo
nd
in
pap
er f
orm
wit
hou
t co
upon
s.
in p
aper
for
m w
ith
out
coup
ons.
in
pap
er f
orm
wit
hou
t co
upon
s.
ISIN
C
Z00
0370
1476
C
Z00
0370
1484
C
Z00
0370
1492
Den
omin
atio
n o
f th
e bo
nds
U
SD
CZ
K
CZ
K
Nom
inal
val
ue p
er b
ond
U
SD 1
,000
C
ZK
100
,000
C
ZK
100
, 000
Num
ber
of b
onds
30
,000
10
,000
10
,000
Tota
l iss
ue a
mou
nt
USD
30,
000,
000
CZ
K 1
,000
,000
,000
C
ZK
1,0
00,0
00,0
00
Issu
e da
te
23 J
anua
ry 2
008
13 F
ebru
ary
2008
27
Feb
ruar
y 20
08
Mat
urit
y da
te
23 J
anua
ry 2
010
13 F
ebru
ary
2010
27
Feb
ruar
y 20
10
Dat
e of
inte
rest
pay
men
t
– --
--
Det
erm
inat
ion
of
the
yiel
d
Dif
fere
nce
bet
wee
n t
he
issu
e p
rice
an
d th
e n
omin
al v
alue
of
the
bon
d.
Dat
e an
d p
lace
of
exer
cisi
ng
the
righ
t
Th
e Pa
yin
g A
gen
t of
th
e is
sue
is Č
esko
slov
ensk
á ob
chod
ní b
anka
, a. s
.,to
th
e yi
eld
Mut
ual F
unds
an
d Pa
ymen
ts B
ack
Off
ice,
Rad
lick
á 33
3/15
0, 1
50 5
7 P
rah
a 5.
D
ates
of
inte
rest
pay
men
ts a
nd
mat
urit
y da
te: s
ee a
bove
.
Reg
ulat
ed m
arke
ts t
o w
hic
h t
he
secu
riti
es
Un
list
ed s
ecur
ity.
hav
e be
en a
dmit
ted
Gua
ran
tees
for
inte
rest
pay
men
ts
No
thir
d p
arty
has
ass
umed
an
y gu
aran
tee
for
rede
mp
tion
of
the
bon
ds o
r p
aym
ents
of
the
inte
rest
.an
d re
dem
pti
on o
f th
e se
curi
ties
Rig
hts
att
ach
ed t
o th
e se
curi
ties
T
he
righ
t to
rec
eive
pay
men
ts p
ursu
ant
to t
he
term
s an
d co
ndi
tion
s of
th
e bo
nds
.
No
pri
orit
y or
con
vert
ible
rig
hts
are
att
ach
ed t
o th
e bo
nds
.
220
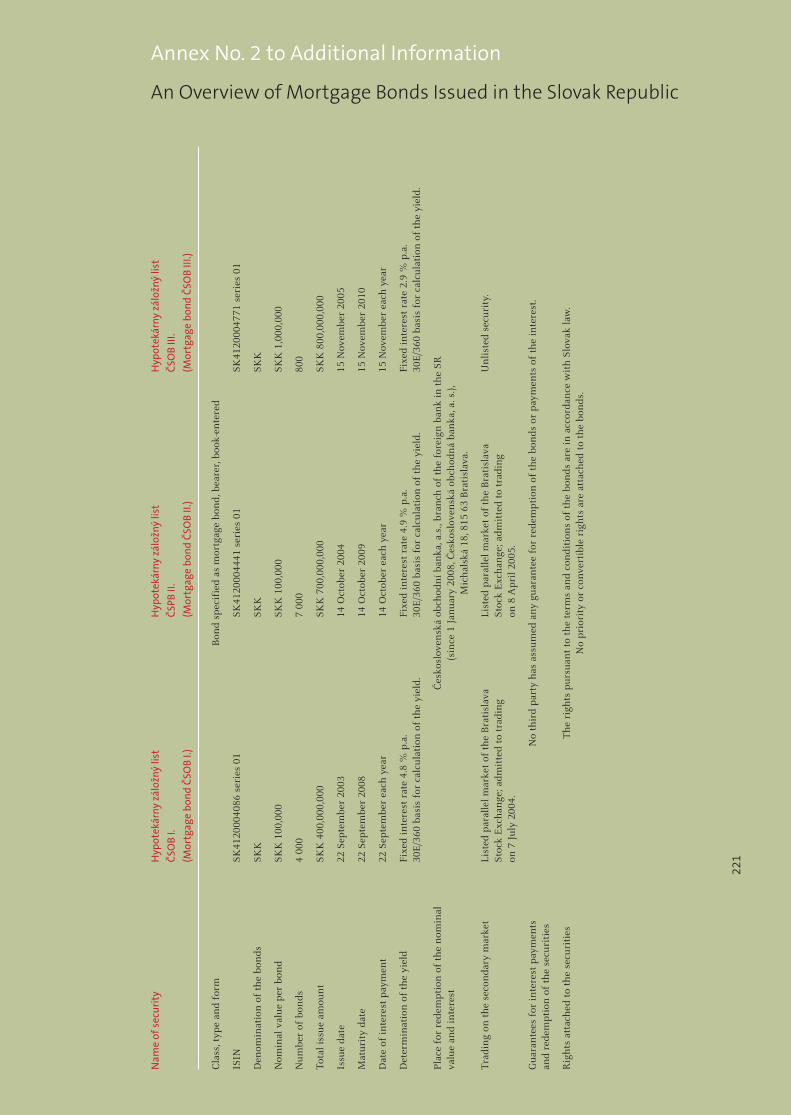
Annex No. 2 to Additional Information
An Overview of Mortgage Bonds Issued in the Slovak Republic
Nam
e of
sec
urit
y H
ypot
ekár
ny z
álož
ný li
st
Hyp
otek
árny
zál
ožný
list
H
ypot
ekár
ny z
álož
ný li
st
ČSO
B I.
ČSPB
II.
ČSO
B III
.
(Mor
tgag
e bo
nd Č
SOB
I.)
(Mor
tgag
e bo
nd Č
SOB
II.)
(Mor
tgag
e bo
nd Č
SOB
III.)
Cla
ss, t
ype
and
form
B
ond
spec
ifie
d as
mor
tgag
e bo
nd,
bea
rer,
boo
k-en
tere
d
ISIN
SK
4120
0040
86 s
erie
s 01
SK
4120
0044
41 s
erie
s 01
SK
4120
0047
71 s
erie
s 01
Den
omin
atio
n o
f th
e bo
nds
SK
K
SKK
SK
K
Nom
inal
val
ue p
er b
ond
SKK
100
,000
SK
K 1
00,0
00
SKK
1,0
00,0
00
Num
ber
of b
onds
4
000
7 00
0 80
0
Tota
l iss
ue a
mou
nt
SK
K 4
00,0
00,0
00
SKK
700
,000
,000
SK
K 8
00,0
00,0
00
Issu
e da
te
22 S
epte
mbe
r 20
03
14 O
ctob
er 2
004
15 N
ovem
ber
2005
Mat
urit
y da
te
22 S
epte
mbe
r 20
08
14 O
ctob
er 2
009
15 N
ovem
ber
2010
Dat
e of
inte
rest
pay
men
t 22
Sep
tem
ber
each
yea
r 14
Oct
ober
eac
h y
ear
15 N
ovem
ber
each
yea
r
Det
erm
inat
ion
of
the
yiel
d Fi
xed
inte
rest
rat
e 4.
8 %
p.a
. Fi
xed
inte
rest
rat
e 4.
9 %
p.a
. Fi
xed
inte
rest
rat
e 2.
9 %
p.a
.
30E
/360
bas
is f
or c
alcu
lati
on o
f th
e yi
eld.
30E
/360
bas
is f
or c
alcu
lati
on o
f th
e yi
eld.
30E
/360
bas
is f
or c
alcu
lati
on o
f th
e yi
eld.
Pla
ce f
or r
edem
pti
on o
f th
e n
omin
al
Čes
kosl
oven
ská
obch
odn
í ban
ka, a
.s.,
bran
ch o
f th
e fo
reig
n b
ank
in t
he
SRva
lue
and
inte
rest
(s
ince
1 J
anua
ry 2
008,
Čes
kosl
oven
ská
obch
odn
á ba
nka
, a. s
.),
Mic
hal
ská
18, 8
15 6
3 B
rati
slav
a.
Tra
din
g on
th
e se
con
dary
mar
ket
Li
sted
par
alle
l mar
ket
of t
he
Bra
tisl
ava
Li
sted
par
alle
l mar
ket
of t
he
Bra
tisl
ava
Un
list
ed s
ecur
ity.
St
ock
Exc
han
ge; a
dmit
ted
to t
radi
ng
St
ock
Exc
han
ge; a
dmit
ted
to t
radi
ng
on
7 J
uly
2004
. on
8 A
pri
l 200
5.
Gua
ran
tees
for
inte
rest
pay
men
ts
No
thir
d p
arty
has
ass
umed
an
y gu
aran
tee
for
rede
mp
tion
of
the
bon
ds o
r p
aym
ents
of
the
inte
rest
.an
d re
dem
pti
on o
f th
e se
curi
ties
Rig
hts
att
ach
ed t
o th
e se
curi
ties
T
he
righ
ts p
ursu
ant
to t
he
term
s an
d co
ndi
tion
s of
th
e bo
nds
are
in a
ccor
dan
ce w
ith
Slo
vak
law
.
No
pri
orit
y or
con
vert
ible
rig
hts
are
att
ach
ed t
o th
e bo
nds
.
221

Nam
e of
sec
urit
y H
ypot
ekár
ny z
álož
ný li
st
Hyp
otek
árny
zál
ožný
list
H
ypot
ekár
ny z
álož
ný li
st
ČS
OB
IV.
ČSO
B V.
ČS
OB
VI.
(M
ortg
age
bond
ČSO
B IV
.) (M
ortg
age
bond
ČSO
B V.
) (M
ortg
age
bond
ČSO
B V
I.)
Cla
ss, t
ype
and
form
B
ond
spec
ifie
d as
mor
tgag
e bo
nd,
bea
rer,
boo
k-en
tere
d
ISIN
SK
4120
0052
32 s
erie
s 01
SK
4120
0054
63 s
erie
s 01
SK
4120
0057
52 s
erie
s 01
Den
omin
atio
n o
f th
e bo
nds
SK
K
SKK
SK
K
Nom
inal
val
ue p
er b
ond
SK
K 1
,000
,000
SK
K 1
,000
,000
SK
K 1
,000
,000
Num
ber
of b
onds
80
0 50
0 40
0
Tota
l iss
ue a
mou
nt
SK
K 8
00,0
00,0
00
SKK
500
,000
,000
SK
K 4
00,0
00,0
00
Issu
e da
te
19 D
ecem
ber
2006
25
Jun
e 20
07
20 D
ecem
ber
2007
Mat
urit
y da
te
19 D
ecem
ber
2011
25
Jun
e 20
12
20 D
ecem
ber
2012
Dat
e of
inte
rest
pay
men
t 19
Dec
embe
r ea
ch y
ear
25 J
une
each
yea
r 20
Dec
embe
r ea
ch y
ear
Det
erm
inat
ion
of
the
yiel
d Fl
oati
ng
inte
rest
rat
e 12
M B
RIB
OR
+ 1
.25
% p
.a.
Fixe
d in
tere
st r
ate
4.6
% p
.a.
Fixe
d in
tere
st r
ate
4.4
% p
.a.
30
/360
bas
is f
or c
alcu
lati
on o
f th
e yi
eld.
A
ct/A
ct b
asis
for
cal
cula
tion
of
the
yiel
d.
Act
/Act
bas
is f
or c
alcu
lati
on o
f th
e yi
eld.
Pla
ce f
or r
edem
pti
on o
f th
e n
omin
al
Čes
kosl
oven
ská
obch
odn
í ban
ka, a
.s.,
bran
ch o
f th
e fo
reig
n b
ank
in t
he
SRva
lue
and
inte
rest
(s
ince
1 J
anua
ry 2
008,
Čes
kosl
oven
ská
obch
odn
á ba
nka
, a. s
.),
Mic
hal
ská
18, 8
15 6
3 B
rati
slav
a.
Tra
din
g on
th
e se
con
dary
mar
ket
U
nli
sted
sec
urit
y.
Gua
ran
tees
for
inte
rest
pay
men
ts
No
thir
d p
arty
has
ass
umed
an
y gu
aran
tee
for
rede
mp
tion
of
the
bon
ds o
r p
aym
ents
of
the
inte
rest
.an
d re
dem
pti
on o
f th
e se
curi
ties
Rig
hts
att
ach
ed t
o th
e se
curi
ties
T
he
righ
ts p
ursu
ant
to t
he
term
s an
d co
ndi
tion
s of
th
e bo
nds
are
in a
ccor
dan
ce w
ith
Slo
vak
law
.
No
pri
orit
y or
con
vert
ible
rig
hts
are
att
ach
ed t
o th
e bo
nds
.
222

223
Annex No. 3 to Additional Information
Information according to Annex No. 30 of Decree No. 123/2007 Coll., stipulating the prudential rules for banks, credit unions and investment firms
1. Information on the Capital of the Regulated Consolidated Unit
Summary of conditions and main features of the capital and its constituents
The rules for capital adequacy calculation of the Regulated consolidated unit are stipulated by the Czech National Bank’s Regulation No. 123/2007 Coll. on the rules of prudent business carried out by banks, savings and loan cooperatives and securities traders (effective from 1 June 2007); the Regulation also contains rules for definition of the regulated consolidated unit.
In December 2007, KBC Bank NV increased paid-up basic capital registered in the Commercial Register by CZK 750 m and share premium by CZK 5,250 m. Share capital is fully subscribed and paid up. The total authorized share capital as at 31 December 2007 equals CZK 5,855 m and is composed of 5,855,000 ordinary shares with a nominal value of CZK 1,000 each. Share premium is CZK 7,509 m.
To support the capital structure of the Group, ČSOB received subordinated debt in nominal amount of CZK 12 bn in two tranches: CZK 5 bn in September 2006 with the maturity date falling on 29 September 2016 and CZK 7 bn in February 2007 with the maturity date falling on 28 March 2017. Hypoteční banka issued subordinated bonds with a total nominal amount of CZK 200 m and maturity on 2 June 2008. These issues are included in the Tier 2 supplementary capital.
Information on Capital of the Regulated consolidated unit
(CZK ths) 31. 12. 2007
1. Original capital (Tier 1) 37,751,349 Paid-up basic capital registered in the Commercial Register 5,855,000 Own shares - Share premium 7,508,552 Mandatory reserve funds 18,686,645 Retained profit from previous periods 10,344,807 Minority interests 300,293 Goodwill from consolidation (887,403) Resulting exch. rate differences from consolidation (223,039) Goodwill other than from consolidation (2,688,910) Intangible assets other than goodwill (1,133,744) Negative valuation difference from real value changes in AFS shares (10,852)
2. Total supplementary capital (Tier 2) 12,006,8973. Total capital to cover market risk (Tier 3) -4. Items deductible from original and supplementary capital (1,126,772) (from Tier 1 + Tier 2) in which: IRB Provision shortfall and IRB equity expected loss amount (271,997)
Total regulatory capital 48,631,475
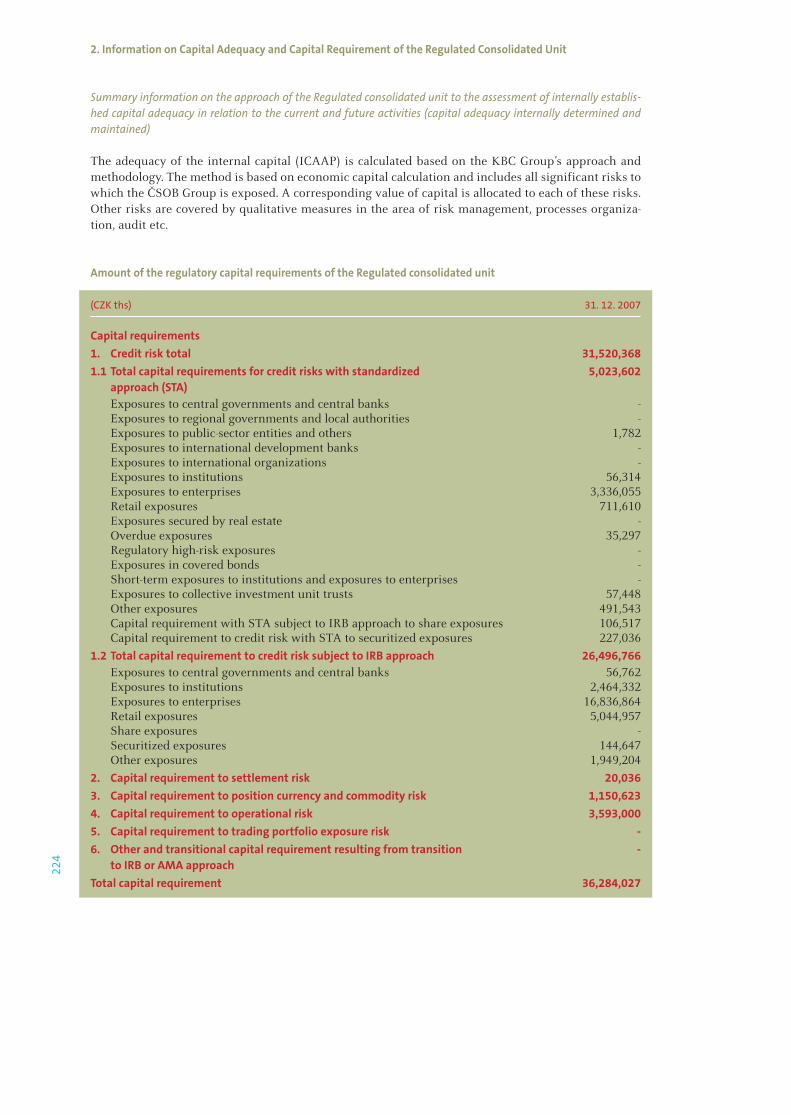
224
2. Information on Capital Adequacy and Capital Requirement of the Regulated Consolidated Unit
Summary information on the approach of the Regulated consolidated unit to the assessment of internally establis-hed capital adequacy in relation to the current and future activities (capital adequacy internally determined and maintained)
The adequacy of the internal capital (ICAAP) is calculated based on the KBC Group’s approach and methodology. The method is based on economic capital calculation and includes all significant risks to which the ČSOB Group is exposed. A corresponding value of capital is allocated to each of these risks. Other risks are covered by qualitative measures in the area of risk management, processes organiza-tion, audit etc.
Amount of the regulatory capital requirements of the Regulated consolidated unit
(CZK ths) 31. 12. 2007
Capital requirements1. Credit risk total 31,520,3681.1 Total capital requirements for credit risks with standardized 5,023,602
approach (STA) Exposures to central governments and central banks - Exposures to regional governments and local authorities - Exposures to public-sector entities and others 1,782 Exposures to international development banks - Exposures to international organizations - Exposures to institutions 56,314 Exposures to enterprises 3,336,055 Retail exposures 711,610 Exposures secured by real estate - Overdue exposures 35,297 Regulatory high-risk exposures - Exposures in covered bonds - Short-term exposures to institutions and exposures to enterprises - Exposures to collective investment unit trusts 57,448 Other exposures 491,543 Capital requirement with STA subject to IRB approach to share exposures 106,517 Capital requirement to credit risk with STA to securitized exposures 227,036
1.2 Total capital requirement to credit risk subject to IRB approach 26,496,766 Exposures to central governments and central banks 56,762 Exposures to institutions 2,464,332 Exposures to enterprises 16,836,864 Retail exposures 5,044,957 Share exposures - Securitized exposures 144,647 Other exposures 1,949,204
2. Capital requirement to settlement risk 20,0363. Capital requirement to position currency and commodity risk 1,150,6234. Capital requirement to operational risk 3,593,0005. Capital requirement to trading portfolio exposure risk -6. Other and transitional capital requirement resulting from transition - to IRB or AMA approachTotal capital requirement 36,284,027

225
3. ČSOB’s Ratios (uncosolidated) (as at 31 December 2007)
Ratio
Capital adequacy % 11.12Return on average assets (ROAA) % 1.55Return on average equity (ROAE) % 35.51Assets per employee CZK ths 93,829Administrative expenses per employee* CZK ths 1,346Profit after income tax per employee* CZK ths 1,340
* annualized


227
The building’s interior contains various kinds of plants, palms, rubber plants, dracaenas, ivies and many more. The most precious include olive tree, laurel, magnolia grandiflora, lemon tree or Phoenix palm which can be found in the main atrium.
228
Sworn Statement
Persons responsible for the ČSOB Annual Report 2007 hereby declare that:
all the information contained in the ČSOB Annual Report 2007 is in accordance with reality; no signi-ficant facts that are likely to influence an accurate and correct assessment of ČSOB and its securities in issue were omitted or misrepresented; and the ČSOB Annual Report 2007 contains true account of all significant events occurred in 2007 and their potential impact on financial statements, including a description of potential major risks and uncertainties in 2007.
In Prague, 23. April 2008
Československá obchodní banka, a. s.
Pavel Kavánek Jan LamserChairman of the Board of Directors Member of the Board of Directorsand Chief Executive Officer and Senior Executive Officer
Sworn Statement
229
To the Shareholders of Československá obchodní banka, a. s.:I. We have audited the consolidated fi nancial statements of Československá obchodní banka, a. s. (“the Company”) as
at 31 December 2007, which are presented in the annual report of the Company on pages 73 – 132, on which we have issued an auditor’s report, dated 9 April 2008, which is presented in the annual report of the Company on page 72. We have also audited the separate fi nancial statements of the Company as at 31 December 2007, which are presented in the annual report of the Company on pages 137 – 193, on which we have issued an auditor’s report, dated 9 April 2008, which is presented in the annual report of the Company on page 136 (both referred to further as “fi nancial statements”).
II. We have also audited the consistency of the annual report with the fi nancial statements described above. The management of Československá obchodní banka, a. s. is responsible for the accuracy of the annual report. Our responsibility is to express, based on our audit, an opinion on the consistency of the annual report with the fi nancial statements.
We conducted our audit in accordance with International Standards on Auditing and the related implementation guidance issued by the Chamber of Auditors of the Czech Republic. Those standards require that we plan and perform the audit to obtain reasonable assurance as to whether the information presented in the annual report which describes the facts refl ected in the fi nancial statements is consistent, in all material respect, with the fi nancial statements. We have checked that the accounting information presented in the annual report on pages 1 – 70 and 208 – 233 is consistent with that contained in the audited fi nancial statements as at 31 December 2007. Our work as auditors was confi ned to checking the annual report with the aforementioned scope and did not include a review of any information other than that drawn from the audited accounting records of the Company. We believe that our audit provides a reasonable basis for our opinion.
Based on our audit, the accounting information presented in the annual report is consistent, in all material respects, with the fi nancial statements described above.
III. In addition, we have reviewed the accuracy of the information included in the report on related parties of Československá obchodní banka, a. s. for the year ended 31 December 2007 presented in the annual report of the Company on pages 198 – 204. The management of Československá obchodní banka, a. s. is responsible for the preparation of the report on related parties. Our responsibility is to issue a report based on our review.
We conducted our review in accordance with applicable International Standards on Auditing and the related implementation guidance issued by the Chamber of Auditors of the Czech Republic. Those standards require that we plan and perform the review to obtain moderate assurance as to whether the report on related parties is free from material misstatement. The review is limited primarily to enquiries of Company personnel, to analytical procedures applied to fi nancial data and to examining, on a test basis, the accuracy of information, and thus provides less assurance than an audit. We have not performed an audit and, accordingly, we do not express an audit opinion.
Based on our review, nothing has come to our attention that causes us to believe that the report on related parties of Československá obchodní banka, a. s. for the year ended 31 December 2007 is materially misstated.
Ernst & Young Audit & Advisory, s.r.o., člen koncernuLicence No. 401Represented by
Douglas Burnham Roman Hauptfl eischPartner Auditor, Licence No. 2009
23 April 2008Prague, Czech Republic
A member fi rm of Ernst & Young Global LimitedErnst & Young Audit & Advisory, s.r.o., člen koncernu with its registered offi ce at Karlovo náměstí 10,120 00 Prague 2, has been incorporated in the Commercial Register administered by the Municipal Court in Prague, Section C, entry no. 88504, under Identifi cation No. 26704153.
Independent auditor’s report
INDEPENDENT AUDITOR’S REPORT


231
Plants growing on the terraces and on the roof of the building are watered by an automated watering system distributing water to each of them. Recycled water and rainwater is used for watering.
Abbreviations
Business company Abbreviation
Československá obchodní banka, a. s. ČSOB the BankČeskoslovenská obchodní banka, a.s., ČSOB SKpobočka zahraničnej banky v SR(foreign branch, until 31 December 2007) Československá obchodná banka, a. s. ČSOB SK(separate legal entity, since 1 January 2008)Poštovní spořitelna PSB
Auxilium, a.s. AuxiliumBankovní informační technologie, s.r.o. BANITBusiness Center, s.r.o. Business CenterCentrum Radlická a.s. Centrum RadlickáCzech National Bank CNBČeskomoravská stavební spořitelna, a.s. ČMSSČSOB stavebná sporiteľňa, a.s. ČSOB SPČSOB Asset Management, a.s., a member of the ČSOB Group ČSOB AM CZČSOB Asset Management, správ.spol., a.s. ČSOB AM SKČSOB d.s.s., a.s. ČSOB d.s.s.ČSOB distribution, a.s. ČSOB distributionČSOB Factoring, a.s. ČSOB Factoring CZČSOB Factoring a.s. (Slovak Republic) ČSOB Factoring SKČSOB Investiční společnost, a.s., a member of the ČSOB Group ČSOB ISČSOB Investment Banking Services, a.s., ČSOB IBSa member of the ČSOB GroupČSOB korporátní, ČSOB Investiční společnost, a.s., ČSOB korporátnía member of the ČSOB Group, open-ended equity fundČSOB Leasing, a.s. ČSOB Leasing CZČSOB Leasing, a.s. (Slovak Republic) ČSOB Leasing SKČSOB Leasing pojišťovací makléř, s.r.o. ČSOB Leasing pojišťovací makléřČSOB Leasing poisťovací maklér, s.r.o. ČSOB Leasing poisťovací maklérČSOB Penzijní fond Progres, a. s., a member of the ČSOB Group ČSOB PF ProgresČSOB Penzijní fond Stabilita, a. s., a member of the ČSOB Group ČSOB PF StabilitaČSOB Pojišťovna, a. s., a member of the ČSOB Holding ČSOB PojišťovnaČSOB Poisťovňa, a.s. ČSOB PoisťovňaČSOB Property fund, closed-ended investment fund, a.s., ČSOB Property funda member of the ČSOB GroupČSOB růstový, ČSOB Investiční společnost, a.s., ČSOB růstovýa member of the ČSOB Group, open-ended equity fundČSOB výnosový, ČSOB Investiční společnost, a.s., ČSOB výnosovýa member of the ČSOB Group, open-ended equity fundEuropean Bank for Reconstruction and Development EBRDHyporeal Praha, a.s. Hyporeal PrahaHypoteční banka, a.s. Hypoteční bankaIPB Group Holding, a.s. in liquidation IPB Group HoldingIPB Leasing, a.s. IPB Leasing KBC Bank NV KBC BankKBC Group NV KBC GroupKBC Insurance NV KBC InsuranceMinistry of Finance of the Czech Republic MF CZMinistry of Finance of the Slovak Republic MF SKMotokov a.s. MotokovNational Bank of Slovakia NBSPatria Finance, a.s. Patria FinancePatria Finance CF, a.s. Patria Finance CFZemský penzijní fond, a. s. Zemský PF
232
ČSOB Group financial results releases (EU IFRS, consolidated) Period Date Event
FY 2007 14 February 2008, 2 PM Presentation on the Internet and press conference
1Q 2008 15 May 2008, 2 PM Presentation on the Internet
1H 2008 8 August 2008, 11 AM Presentation on the Internet and press conference
3Q 2008 6 November 2008, 2 PM Presentation on the Internet
FY 2008 12 February 2009, 2 PM Presentation on the Internet and press conference
Note: This schedule is for information only; dates might be subject to change during the year.
Contact details
Investor relations External communication
Československá obchodní banka, a. s. Československá obchodní banka, a. s.Radlická 333/150 Radlická 333/150150 57 Praha 5 150 57 Praha 5 Tel.: +420 224 114 106 Tel.: +420 224 114 117Tel.: +420 224 114 109-111 Fax: +420 224 119 608Fax: +420 224 119 608 E-mail: [email protected]
Financial calendar for 2008
233

Notes:

© 2008 Československá obchodní banka, a. s.All rights reserved.design, dtp | www.studiomotor.cztisk | www.integraf.cz